TOWING TANK EXPERIMENTS OF RESISTANCE, SINKAGE AND TRIM, BOUNDARY LAYER, WAKE, AND FREE SURFACE FLOW AROUND A NAVAL COMBATANT INSEAN 2340 MODEL
|
|
|
- Christina Wilkinson
- 5 years ago
- Views:
Transcription
1 TOWING TANK EXPERIMENTS OF RESISTANCE, SINKAGE AND TRIM, BOUNDARY LAYER, WAKE, AND FREE SURFACE FLOW AROUND A NAVAL COMBATANT INSEAN 2340 MODEL By A. Olivieri*, F. Pistani*, A. Avanzini*, F.Stern + and R. Penna* *INSEAN - Istituto Nazionale per Studi ed Esperienze di Architettura Navale (Italian ship model basin) Roma + IIHR Iowa Institute of Hydraulic Research The University of Iowa, Iowa City, Iowa IIHR Technical Report No. 421 IIHR Hydroscience & Engineering College of Engineering The University of Iowa IOWA CITY, IOWA September
2 TOWING TANK EXPERIMENTS OF RESISTANCE, SINKAGE AND TRIM, BOUNDARY LAYER, WAKE, AND FREE SURFACE FLOW AROUND A NAVAL COMBATANT INSEAN 2340 MODEL A. Olivieri, F. Pistani, A. Avanzini and R. Penna INSEAN - Istituto Nazionale per Studi ed Esperienze di Architettura Navale (Italian ship model basin) - Roma Summary Abstract... Error! Bookmark not defined. 1 Introduction Model Geometry Tests Design Experimental results Resistance, sinkage and trim and wave profiles Setup and experimental procedure Resistance, sinkage and trim and wave profile results Far field wave pattern Setup and experimental procedure Far field wave elevation results Velocity field in the boundary layer and wake Setup and experimental procedure Results Vortices interaction with the hull boundary layer Propeller plane flow analysis Concluding remarks Acknowledgements References...12 Appendix A Uncertainty Assessment A.1 Resistance, sinkage and trim and wave profiles...30 A.2 Wave elevation...32 A.2.1 Bias limit...32 A.2.2 Precision limit...35 A.2.3 Global uncertainty...36 A.3 5-hole Pitot probe calibration and towing tank data processing...36 A.4 Mean flow velocity uncertainty analysis...40 A.4.1 Elemental error sources and bias limit...40 A.4.2 Error due to the mean shear...41 A.4.3 Precision limit...42
3 ABSTRACT Results from towing tank experiments regarding resistance, sinkage and trim, far field wave elevation, boundary layer and wake of the INSEAN 2340 model are presented. The resistance and sinkage and trim tests are for Froude numbers between Fr = 0.05 and Fr = 0.41 and free model conditions. Wave profiles and far field wave elevations have been carried out at two Froude numbers namely Fr = 0.28 and Fr = Mean velocity field and total head in the boundary layer and wake have been measured by 5-hole Pitot probe at Fr = The test design, measurement system and the uncertainty assessment have been described both for wave elevation and velocity fields. The uncertainty assessment methodology follows the AIAA Standard S The data contributes to the surface-ship resistance and propulsion model-scale database for computational fluid dynamics validation, as part of an international collaborative project between INSEAN, Iowa Institute of Hydraulic Research (IIHR) and David Taylor Model Basin (DTMB) on experimental and computational fluid dynamics and uncertainty assessment for a combatant geometry [1]. 1 Introduction There is a continuing need for additional model-scale data for computational fluid dynamics (CFD) codes verification, validation/calibration and accreditation for realization of simulation based design, especially for modern hull forms. Numerical codes need turbulence models to predict the flow in the boundary layer, wake and close to the surface in presence of breaking waves. The values of the parameters to be set in the turbulence model depend on the flow characteristics as Reynolds number and pressure gradient. Nevertheless the free surface presence changes the characteristics of the turbulent flow so that the turbulence model choice is a fundamental step for the prediction of the flow along the hull-model. It is clear that different choices of the parameters produce different flow prediction. For these reasons an experimental validation of the calculated results is needed, not just for the global quantities, but also for the local properties of the flow. Since the paper of Baba (1969) [18], not many experimental works have been carried out in order to realize a complete flow description around a ship model. An excursus on the state of the art until 1992 is reported in the paper of Toda, Stern and Longo [19], where the effects of the wave field on the boundary layer flow of a Series 60 C B = 0.6 ship model have been investigated. A complete flow description around a yawed Series 60 have been reported in the work of Longo [14], where an exhaustive bibliography on the experimental work in ship models flow description has been made. Finally the experimental investigation of the flow around two different container models has been described in the work of Van et al. [20]. The objective of the present study is to contribute to the surface-ship resistance and propulsion model-scale database for CFD validation, as part of an international cooperative project between INSEAN, IIHR, DTMB on EFD/CFD and uncertainty assessment (UA) for a combatant geometry. The test model (INSEAN 2340) is an identical geosym of the DTMB The length between perpendiculars is 5.72 m, corresponding to λ = 1/24.8 scale. This geometry has been adopted by the International Towing Tank Conference (ITTC) as a recommended benchmark for CFD validation for resistance and propulsion (ITTC, 1996). Resistance and sinkage and trim tests for the INSEAN 2340 model have been carried out in the range of Froude number between 0.05 and 0.41 for free model conditions. Wave profile has been determined at Fr = 0.28 and Fr = 0.41 by analysis of six pictures taken along the model. Furthermore, a detailed description of the wave elevation in the far field at Fr = 0.28 and Fr = 0.41 is given for the regions in which wave breaking does not occur. The measurements have been carried out by capacitance wires and the field reconstruction has been obtained by 136 longitudinal wave cuts at both Froude numbers. A detailed uncertainty assessment has been provided at four longitudinal cuts locate in near and far field. The flow around the model is given 2
4 in terms of the mean velocity components and total head at Fr = The results have been obtained using a 5-hole Pitot probe. Ten cross-flow sections have been investigated to give a complete flow map for testing the CFD results. Moreover the regions that presented trace of particular flow structures, like bow or stern bilge vortices, have been analyzed in detail. In that cases, the measurements have been repeated, adopting finer grids to highlight the flow features. To certify the quality of the experimental data, a detailed uncertainty assessment is given for the propeller plane section by determination of bias and precision limit following the criteria suggested by Coleman et al. [4]. Moreover a cross validation of the experimental results for the nominal wake obtained at INSEAN, DTMB and IIHR has been made, to certify the quality of the benchmark. Present results have been adopted as official database for CFD validation at the "G2K workshop" on numerical hydrodynamics [16]. In the next section an overview of the experiments, including a description of the instrumentation and the experimental procedures is given. The following sections are related to the resistance, sinkage and trim and wave profile, far field wave elevation and global mean flow description. The resistance, sinkage and trim, the longitudinal cut at y = and propeller plane results are shown in comparison with the results obtained at the IIHR and DTMB. For these results, the uncertainty assessment has been carried out. Concluding remarks and future plans are reported in the last section. The 5-hole Pitot probe calibration procedure and the uncertainty assessment for all the measured quantities are described in the appendix. 2 Model Geometry The model namely INSEAN 2340 is an identical geosym of the DTMB 5415 model, that has been adopted by the International Towing Tank (ITTC) as a recommended benchmark for CFD validation for resistance and propulsion (ITTC, 1996). It was conceived as a preliminary design for a surface combatant. The model, whose lines and main characteristics are respectively shown in Fig. 1 and table 1, presents a transom stern and a bow bulbous of peculiar shape that allows the sonar lodging. Its length between perpendiculars is L pp = 5.72m, which corresponds to a scale of λ = All the tests have been performed for the bare hull conditions. During the experiments two identically shaped models were tested. They have been built at the INSEAN models workshop. The only difference between the first and the second model is the material used to build them. The first one, namely INSEAN 2340 model, was made in polyurethane foam (Klegher cells medium density ρ = 90 Kg/m 3 ). It has been applied for resistance, sinkage and trim, wave profiles and far field wave pattern experiments. The second one, namely INSEAN 2340A model, was made in wood and it has been used for the mean velocity field experiment. In order to stimulate turbulent flow, both models adopted a row of cylindrical studs of 3 mm height and 3 mm diameter, 30 mm spaced, fitted on the models 60 mm behind the bow profile. In the following discussion, as well as in the introduction, we refer to both the models as INSEAN Tests Design The typical towing tank tests (resistance, sinkage and trim, wave profile and nominal wake) have been selected for the overlapping tests between the Institutes. Each Institute followed their usual procedures. Special consideration was given to the integration of the uncertainty assessment into all phases of the experimental process as recommended by the AIAA standards. Resistance and sinkage and trim have been taken in free-model conditions at Froude number varying from Fr = 0.05 to Fr = 0.41 with 0.05 increments. The wave profiles have been measured at Fr = 0.28 and Fr = 0.41 using three different techniques. INSEAN carried out the wave profile by the analysis of six photographs taken along the model in free model conditions. The boundary layer and wake velocity field has been carried out at Fr = 0.28 (cruise speed) in fixed conditions (at the dynamic sinkage and trim). The Reynolds number, based on the nominal 3
5 velocity and length between the perpendiculars, is for the INSEAN and DTMB models, while for the IIHR model, that is shorter than the other two, the Reynolds number is The far field wave elevation has been measured at Fr = 0.28 and Fr = 0.41 (flank speed). The field was mapped on a grid having spanwise resolution of 1.5 cm (= L pp ) and longitudinal resolution of 2.3 cm at Fr = 0.28 and 3.3 cm at Fr = For the propeller plane (as for the other sections), a regular grid with squared cells of L pp has been drawn around the hull. Furthermore, when the flow presented particular features like vortex traces or strong shear layer, a grid refinement has been adopted to better resolve the velocity field. In these cases the cell size was L pp corresponding to about 5 mm as the Pitot head diameter. The tests have been conducted at INSEAN basin n. 2, which is 220 m long, 9 m wide. The water depth was 3.5 m. A Cartesian coordinate system has been adopted with origin at the intersection of the forward perpendicular and design waterplane. The (x, y, z) axes are directed downstream, transverse and upward respectively. The resistance and sinkage and trim tests have been carried out for Froude number varying from Fr = 0.05 to Fr = 0.41, with 0.05 step interval. Load cells have been used to measure the forces, while sinkage and trim have been measured by a device, which transforms the translations in rotations that are measured by an encoder. An uncertainty analysis has been developed before the realizations of the tests, in order to estimate the order of magnitude of the accuracy of the results that would be obtained. The uncertainty analysis has been described, together with the final uncertainty assessment, performed on the obtained results in the two works of Avanzini et al. [15, 2]. The wave elevation far field has been reconstructed at Fr = 0.28 and Fr = 0.41, by measurements performed in a tank-fixed reference frame by an array of four capacitance wires assembled on a movable cross slide positioned transversally to the direction of the model motion. Each probe read a time history of the wave elevation related to a value of the y coordinate and the data were acquired in a PC stored in a control room, after the double conversion voltage-frequency and vice versa. The frequency conversion was necessary because of the length of the cable, which would determine a significant loss of the signal in the data transmission. The wave elevation has been acquired in free model conditions. However a verification of the results for the fixed conditions has been made for the four cuts on which the uncertainty assessment has been carried out. The results showed that the difference between data obtained in free and fixed model conditions was lower than the global uncertainty. The wave profile have been measured in fixed-model conditions at Fr = 0.28 and Fr = 0.41, taking the wave height on the model from a series of photographs. The velocity field has been determined using a 5-hole Pitot probe on 10 cross sections along the model. On each section a regular grid with squared cells of L pp has been drawn around the hull. When the flow presented particular features like vortex traces or strong shear layer, a grid refinement has been adopted to better resolve the velocity field. In these cases the cell size was L pp corresponding to about 5 mm as the Pitot head diameter. Approximately 900 points each section have been acquired. The device, including the software, has been designed at INSEAN [11]. 4 Experimental results 4.1 Resistance, sinkage and trim and wave profiles Setup and experimental procedure The Resistance test has been performed following the ITTC standards for Froude numbers from Fr = 0.05 to Fr = 0.45 with 0.05 increments. At Fr = 0.1, Fr = 0.28 and Fr =
6 ten repeated readings have been performed to determine the precision limit. The measurement of the total model resistance has been carried out by a load cell, having a maximum load of N. The signal from the cell was amplified before undergoes a voltage-to-frequency (V/F) conversion for reducing the sensitivity to noise on the transmission line. Therefore it was transmitted in a frequency range of 3000 ± 2500 Hz, which corresponds to a voltage range of ± 5 V and then converted (F/V) to an output voltage for the acquisition by a 12 bit acquisition board mounted on a PC. The load cell calibration has been performed, using the same equipment that has been later used on the carriage for the experiments. The velocity, maintained at the set value by the carriage control system, has been measured by a tachometric system. A tachometric wheel induces 1000 pulses on an optical encoder for every meter of carriage displacement, so that the spatial resolution is m. The pulses counted by a 16 bit binary counter in a 1 s time interval gave the velocity in mm s -1. This number is displayed on the carriage control panel and transmitted to the acquisition board. Sinkage and trim have been obtained, at the same Froude numbers than resistance, measuring the displacements of two points located respectively close to the fore and the rear perpendicular. The displacements of the two points have been measured by two angular potentiometers connected to two pantographs. Being the trim angle very small it has been possible to linearize the relation between fore and aft displacements and the trim angle. The wave profiles have been obtained at Fr = 0.28 and Fr = 0.41, taking a series of photographs along the model. On the model port side both ordinates and immersions have been represented. In this way it has been possible to directly evaluate the wave profile. Nevertheless it has been noted that, due to the particular flare shape, the used technique induced to overestimate the wave profile nearby the bow Resistance, sinkage and trim and wave profile results -Resistance - A series of towing tests was performed between Fr = 0.05 and Fr = 0.41, with Fr = The tests have been carried out with the model free to take its natural sinkage and trim. Model resistance and fore and aft sinkage have been measured. Figure 2 shows the total resistance curve as a function of carriage speed. The values plotted for measured velocity V m = 0.749, V m = and V m = m/s, corresponding respectively to Fr = 0.10, Fr = 0.28 and Fr = 0.41, are the averaged values on 10 repeated readings. Figure 3 shows the curves of total and residual resistance coefficient C TM and C R. Also viscous resistance has reported according to the ITTC 57 formula. The obtained results show no significant dispersion, even if after each day the model was unloaded and dismounted. A slightly larger dispersion is observable only at the lower Froude numbers (see Fig. 4). Table 2 shows the complete set of the results carried out during the tests. The shaded rows report results for the repeated tests at Fr = 0.10, Fr = 0.28 and Fr = Finally, Fig. 5 shows the comparison of the total resistance coefficient and the residual resistance coefficients for the same test case obtained at INSEAN (λ = 24.8), IIHR (λ = 46.6) and DTMB (λ = 24.8). The agreement between the different sets of data was really encouraging and let us to confide in a good outcome also for the wave pattern and velocity field experiments. -Sinkage and Trim - Sinkage and trim have been determined measuring the fore and aft displacements by rotative potentiometers. Displacement measurements have been obtained by conversion of vertical to angular displacements through weight-balanced, mechanical parallelograms. The potentiometers, signal conditioners, and carriage PC AD card are statically calibrated to determine the voltage-displacement relationship. Data acquisition has been done through collection of 300 discrete samples over 10 seconds at 30 Hz. Data is filtered through a 10 Hz low-pass filter. The trim angle has been determined by the first order relation 5
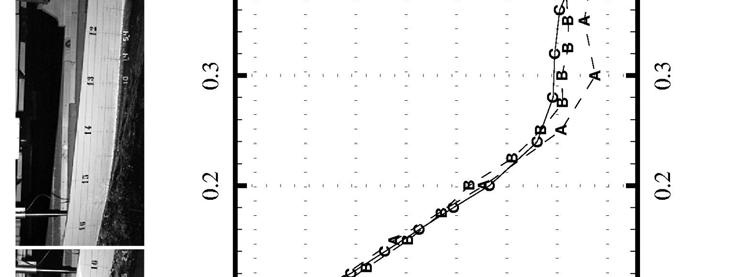
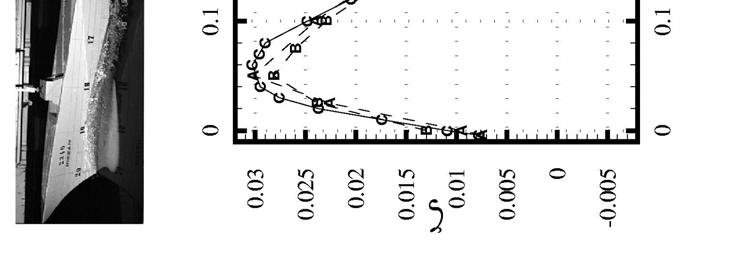
7 ifm i AM θ, (3.1.1) L MM where i FM is the displacement of the point close to the fore perpendicular, i AM is the displacement of the point close to the aft perpendicular and L MM is the distance between these two points. The displacements of the two points, corresponding to the fore and aft perpendicular, have been obtained knowing their distances from the measurement points by relations i i FM FM i L MM i L MM AM AM i = L PP FP MM i + D MM AM i FP i AM iap = i L L D = i AP AM = i LMM + L AM L + D MM PP L L ( i i ) MM MM FM D AM ( i i ) where D is the distance between the fore measurement point and the fore perpendicular. Sinkage has been obtained by the following relation 1 LPP 2D LPP 2D i = ( ifp + iap ) = 1 ifm + i 2 2L 2L MM MM AM FM AM (3.1.2). (3.1.3) Figures 6a and 6b show the variation of trim angle and sinkage as a function of the carriage speed. The values at Fr = 0.10, Fr = 0.28 and Fr = 0.41 are averaged values on 10 repeated tests. Figure 7a and 7b show the comparison for sinkage and trim angle obtained at INSEAN and IIHR. Table 3 shows the complete set of results. -Wave profiles - To determine the wave profiles at Fr = 0.28 and Fr = 0.41, a series of pictures has been taken along the hull and digitized. The measurement system utilizes a hullbased grid system. Data acquisition has been done by photographing the wave profile and digitizing the negatives by a high-resolution scanner. Wave heights are quantified at x-stations on the model by CAD software. Figures 8 and 9 show the wave profiles at Fr = 0.28 and Fr = 0.41 obtained at INSEAN (B) and IIHR (C). Also for the wave profiles the agreement is quite satisfactory. More details are reported in the paper of Stern et al., as for the other overlapping tests [1]. 4.2 Far field wave pattern Setup and experimental procedure The wave elevation measurements have been obtained in a tank-fixed reference frame by an array of four capacitance wires assembled on a movable cross slide that was able to move transversally to the direction of the model motion (Fig. 10). Each probe recorded a time history of the wave elevation related to a value of the y coordinate. Due to the high repeatability of the wave pattern generated by the model, the wave field has been reconstructed by means of a series of time-dependent readings. Moving the probe array each run, it has been possible to cover a large portion of the generated wave pattern. The displacement accuracy of the four probes is 1 mm. As many as the set probe positions, 136 longitudinal cuts have been acquired for both Froude numbers and precision limit have been determined at four transverse positions corresponding to y = 0.082, y = 0.172, y = and y = (Fig. 11). When the carriage reached a defined position, so that the model was 10 m before crossing the ideal line of the four capacitance wires, a small metallic finger turned on a switch positioned close to one of the two rails (Fig. 10); then acquisition started. The output signal of the probe circuit was filtered by a 100 Hz low-pass filter and later converted from voltage to frequency to avoid electromagnetic disturbances and loss of tension due to the length of the cables (about 100 m). The signal was reconverted to voltage and afterwards filtered by a 20 Hz low-pass filter, 6
8 then it was acquired. The sampling rate was fc = 92 Hz so that the corresponding resolution in the longitudinal direction is 2.28 cm at Fr = 0.28 and 3.34 cm at Fr = Longitudinal cuts have been obtained each 1.5 cm in spanwise direction. During the tests the model was free to take its natural sinkage and trim. Anyway additional tests have been performed in fixed conditions, but the difference between these results and the others obtained in free conditions is much smaller than the global uncertainty Far field wave elevation results Experimental data of the 136 time dependent readings of the wave elevation have been acquired to reconstruct the wave pattern at both Froude numbers. The link between temporal history and longitudinal displacement is simply given by relation due to the hypothesis of stationary field: x = x 0 + U (t-t 0 ) (3.2.1) As shown in Figs. 12 and 13, at about two model-lengths downstream the stern there is clear evidence of wave reflection on the tank wall. This reflection occurs more downstream at Fr = 0.41 than at Fr = 0.28 due to the larger divergence of the wave pattern. At Fr = 0.28 the maximum of the measured wave elevation amplitude is h max = 4.1 cm and the signal is sufficiently smooth, even if spilling breaking has been observed at the bow wave crest, shoulder wave and stern wave crest. The maximum of the wave elevation has been detected in the very far field, at about x = 1, y = 0.3, where the breaking is gentler than close to the model. In the case of Fr = 0.41, in correspondence to the bow wave crest, shoulder wave crest and stern wave crest, an irregular behavior of the capacitance wires has been noted. This is related to the presence of intense wave breaking phenomena, as observed during the carriage runs. In fact in this case, the capacitance wires did not correctly behave, because the spray, produced by the intense breaking, did not assure a correct wetting of the wire. In this case, the maximum of the wave elevation amplitude is equal to 8.5 cm, considering the regions where it has been possible to measure correctly. A detailed uncertainty assessment of the present results has been carried out. The procedure is summarized in Appendix A and extensively described in the report of Olivieri and Penna [3]. The obtained wave patterns, constitutes the best resolved results for this kind of ship model and allows to validate the CFD results almost everywhere with uncertainty lower than 3 % of the maximum wave elevations in the field. Unfortunately, in the case of Fr = 0.41, the spray in the breaking regions did not allow to carry out any information about wave elevation close to the bow wave crest, shoulder wave crest and transom wave crest (see Tab.4). A cross-validation of the wave elevation measurements has been performed for the y = longitudinal cut, between INSEAN and IIHR results. Figure 14 shows the good agreement between the two longitudinal cuts, even if there is a small difference, especially nearby the bow and stern wave crests. It must be noticed that the two experiments are performed white different scale models and the examined longitudinal cut is not so far from the model to exclude any Reynolds effect in the wave development. 4.3 Velocity field in the boundary layer and wake Setup and experimental procedure Velocity field have been determined using a 5-hole Pitot probe, located at the hull port side. A classical Pitot tube has been used to measure the static pressure in an undisturbed flow region, far enough from the model. A set of five differential pressure transducers has been adopted to measure the 5 pressure differences between the total pressure, related to the 5 holes of 7
9 the Pitot probe, and the static pressure of the Pitot tube. The 5-holes boundary layer pitot probe and the static pitot tube have been calibrated (see App. A) at IIHR wind tunnel at nominal speed of V cal = 16.5 m/s, which determines a Pitot probe Reynolds number of Re cal = During the towing tank tests, the Pitot Reynolds number (Re exp ) varies between 4800 and Nonetheless the behavior of the Pitot probe is Re-independent for Reynolds numbers larger than 1000 [9] and this condition was verified during the calibration as well as in the towing tank tests. The pressure transducers have been calibrated by a special apparatus allowing to produce a set of reference values of pressure with uncertainty lower than 0.1 Pa. The regression line used for voltage to pressure conversion introduces a percentage error lower than 0.3% for every measured value (see App. A). The experiments have been carried out for the bare hull. During the tests, the model was held in fixed conditions, with trim and sinkage set at the averaged values determined in unrestrained conditions. The nominal speed has been set to U 0 = m/s, corresponding to Froude number Fr = The coordinate system is set fixed to the hull, with the origin at the intersection between the fore perpendicular and the undisturbed water plane. In particular x, y and z axes are in the direction of the uniform flow, starboard side of the hull and upward respectively, and the corresponding velocity components are u (longitudinal), v (transverse) and w (vertical). Ten cross sections have been investigated, with particular attention to the regions where the flow features revealed particular interest, located at x = , x = 0.1, x = 0.2, x = 0.4, x = 0.6, x = 0.8, x = (propeller plane), x = 1.0, x = 1.1, x = 1.2 model lengths downstream the fore perpendicular. For every section a regular grid with squared cells, whose side dimensions are x g = y g = L pp, has been drawn around the hull. Each grid is composed of about 900 points. Furthermore, when the flow showed particular features like vortex traces or strong shear layer, grid refinements have been adopted to better resolve the velocity field. In these cases the adopted cell size is x g = y g = L pp corresponding to 5.7 mm, about as Pitot head diameter (Fig. 16). Five differential pressure transducers (Valydine DP15) have been connected to the five Pitot holes and to the static pressure hole of the Pitot tube. This kind of transducers has been adopted because of their very high accuracy and linearity in the whole measurement range [9, 10]. The acquisition system is running automatically, guided by software implemented by La Gala [11]. Two orthogonal slides, actuated by two step motors, drive the Pitot to the measuring point, starting from a reset position (Fig. 15). The two step motors have a resolution of 200 steps per round and the maneuvering screw has a pitch of 10 mm, so that the spatial resolution of the device is 0.05 mm in vertical and transverse direction. The software is able to manage the Pitot displacements on the transverse sections to avoid any interference between the Pitot head and the model. The velocity signal is checked by the software before starting the acquisition and during the acquisition itself. When the read signal is into a pre-defined range, the acquisition starts. At the end of the acquisition, the system moves the Pitot to the next measuring point. To avoid Pitot probe vibrations, caused by vortex shedding, a third guide has been positioned parallel to the horizontal one (see B in Fig. 15), 1 m downstream. A rigid arm (see C in Fig. 15) has been connected between this additional guide and the vertical arm of Pitot, to obtain a triangular shaped beams system very stiff respect to the forces exerted in its plane. The adopted sample rate is fc = 100 Hz. To set the acquisition time interval we acquired the signal in different points for a time of 5 s. Averaging sample by sample we noticed that the averaged signal was stable from 1 s to end; therefore we set the acquisition time at 2 s (Fig. 17). The three velocity components and the pressure coefficient, in the measuring point, are calculated, with real time preview, via software through the calibration maps (see App. A). 8
10 4.3.2 Results The obtained results for the three velocity components in terms of flow vectors and longitudinal velocity component iso-levels, give a global view of the flow around the model and highlights any interesting flow features. All the reported results are for the port half plane. Furthermore, in the whole measurements the middle ship plane has been overtaken to verify the flow symmetry. The first section, shown in Fig.18, is located at 3 cm ahead the fore perpendicular, corresponding to x= The longitudinal velocity component iso-levels and cross flow vectors reveal presence of stagnation point, at about z = , in correspondence of the bulb (Fig.18a). Section 0.1 is located close to the bulb trailing edge. As shown in Fig.18b, the cross-flow velocity components remain very high, in particular nearby the keel. In fact the peculiar shape of the bulb, due to the sonar dome, determines the generation of a pair of counter rotating streamwise vortices (bow bilge vortices). The presence of the (port side) bow bilge vortex is revealed by cross flow vectors (and stream traces) in Fig.18c related to the section located 0.2 L pp downstream the fore perpendicular. At section x = 0.4 (in the midbody), the bow bilge vortex is still present, as shown by cross flow vectors (and stream traces) in Fig. 18d. The vortex action on the boundary layer produces a lifting of low momentum fluid away from the hull, which determines a significant growth of the boundary layer thickness. At section x = 0.6, a second vortex is observed, having the same sign of the first one (Fig. 18e). This second vortex, called stern bilge vortex, is imputable to the convergence of the limiting streamlines in the afterbody flow, due to the adverse pressure gradient [17]. The bow bilge vortex develops in the keel region, while the stern bilge vortex develops nearby the girth-length, as found in many previous works [17, 21]. At section x = 0.8 (Fig. 18 f ), the vortices are not visible in a fixed reference frame, although the vorticity iso-levels suggest the presence of at least one of the two vortices, whose traces have been observed upstream. The thickness of the boundary layer is growing in a significant way and its shape manifests a well-known feature, developing a bulge nearby the girth-length. The cross flow is dominated by an upward motion, due to the diminishing cross section of the hull at the stern. The wake (x = ) is characterized by the presence of a very thick boundary layer, δ 0.04L pp, while the vertical motion due to the hull shape again dominates the cross flow. Furthermore, the cross-flow vectors reveal presence of relatively strong shear (Fig. 18g). The unsteadiness of the flow around the transom stern compromises an accurate analysis for the section x = 1.0. Some wrong vectors are recognizable on the upper part of Fig. 18h. Downstream the model two weak, but very large, longitudinal counter-rotating vortices have been detected, developing along the port and starboard sides. They dissipate about 0.2L pp downstream the rear perpendicular as shown in Fig. 18l Vortices interaction with the hull boundary layer The flow around the bulb (sonar dome) generates a pair of strong bow longitudinal vortices. A simple way to explain the formation of the two vortices is in considering the bulb as a lifting surface. Looking at the cross-flow maps of the forebody sections we can estimate the global flow around the bulb is oriented at incidence of about α i = 5 as sketched in Fig.19. In this way there is a non-zero circulation around the bulb itself. This fact implies the presence of two streamwise vortices evolving downstream along the port side and the starboard side (see for example [12]). In particular, being the incidence negative, the force acting on the bulb has to be direct downward. This is confirmed by the fact that at this Froude number the model is down by head [1]. The port-side vortex trace is evident in Fig.20a where the cross-flow stream traces are represented together with the longitudinal velocity component iso-levels for the section x = 0.2. In Fig.20b the cross-flow vectors and the longitudinal vorticity component iso-levels, are represented for the same section. The two figures, as the next ones, report measurements 9
11 performed on the port side of the hull, (looking from downstream). To better resolve the velocity field induced by the vortex a finer grid has been adopted. Figure 20c clearly shows the cross-flow vectors due to the vortex produced by the sonar dome for the regular and the finer grid at the x=0.2 section. Moreover Fig.20d, showing the cross-stream traces for the two grid sizes, attests the repeatability of the experimental results. During their streamwise development the two vortices, at the port and starboard sides, interact with the hull boundary layer. Moreover the reciprocal action of the two vortices has to be taken in account to better understand the midbody and afterbody flow. At section x = 0.4 the vortex is still present and clearly visible both on the longitudinal vorticity and cross-flow vectors plots (Fig. 21b). The vortex exerts a lifting action on the hull boundary layer determining a protrusion of low momentum fluid in the outer region of the flow. This is shown in Fig. 21a where the iso-levels of the longitudinal velocity component are represented. On the other hand the vortex itself is pushed toward the hull by the action of its symmetric counter part, which develops along the starboard side. At section x = 0.6 both the stream-traces and the vorticity iso-levels show the appearance of a second vortex nearby the girth-length, namely stern bilge vortex [17] (figs. 22a and 22b). Hence there are four vortices interacting in different ways. Considering as dominant the interactions between couples of neighbors we obtain the scenario sketched in Fig. 23. The bow longitudinal vortex is pushed toward the hull by the action of its symmetric and the action of the stern bilge-vortex. Moreover the stern bilge-vortices push the bow-vortices to go the one toward the other. It is felt that their tendency to superimpose, combined with the increasing viscous dissipation in the inner region of the boundary layer, determines the disappearance of the two bow-vortices. On the contrary the action of the bow-vortices on the stern bilge-vortices moves these ones away from the hull, where the viscous dissipation is weaker. In this way just a vortex each mid-ship tends to survive in the downstream development of the flow around the hull. This is observed in particular at section x = 0.8, where the presence of a single vortex is revealed by longitudinal vorticity contours (Fig. 25b). On the other hand in the afterbody, the hull shape determines a high vertical velocity, which tends to disguise the circulating flow induced by the vortex. In this case, to highlight the vortex by cross-stream traces, it is necessary to subtract the local average of the vertical velocity to the cross-flow (Fig. 26a). It is interesting to notice that, multiplying the time that a fluid particle takes to go from section x = 0.6 to section x = 0.8 by the average of the vertical velocity at the vortex core at the two sections, we obtain exactly the displacement of the vortex trace, as shown in Fig. 24. Here, the displacement of the vortex trace, indicated by, is obtained by relation (3.3.1), ( w[0. 6,y,z ] + w[0. 8,y',z' ]) t v v v v = 0. 02Lpp, (3.3.1) 2 where ( ) t. U 0 (3.3.2) In this flow region, the vortex action on the boundary layer, combined with the adverse pressure gradient determine a very large growth of the boundary layer, increasing both the viscous and the residual resistance by shape effect (Fig. 25a). The observed flow pattern at the propeller plane is quite similar to those of section x = 0.8, with a smoother bulge. Figure 26b shows the vortex presence by iso-levels of longitudinal vorticity, while Fig. 26a shows how big is the boundary layer in this section. The thickness is about 0.04L pp. As shown in Fig. 26b, the vorticity pattern is less regular than for the upstream sections (i.e. x = 0.8). This can be related to the vortex oscillations due to the unstable behavior of the flow in the vicinity of the transom stern. For the same reason, the velocity on the cross plane at the rear perpendicular, (section x = 1.0) has been very hard to measure, so that it has been 10
12 not possible to analyze the acquired data in order to highlight vorticity structures. At section x = 1.1, two weak but very big vortices develops before dissipate close to section x = 1.2 inside the viscous wake as shown in Figs. 18i and 18l. 4.4 Propeller plane flow analysis The flow on the propeller plane has been investigated with particular care for its crucial importance for the propeller design. The obtained results can be summarized in Fig. 28 where the iso-levels of the three velocity components and the total head are shown. In order to certify the experimental results, a comparison between present data and data obtained at David Taylor Model Basin (DTMB) for the same nominal test condition has been made [7]. Also the measurement technique used at the DTMB was the same used at INSEAN to obtain present results. Figures 29a, 29b, 29c show the comparison between the two experimental realizations for the three velocity components. The results obtained from the two experiments show very good agreement, giving an indication of the high accuracy of the whole database. Figures 30 and 31 show the comparison between present results and results obtained at the IIHR for a smaller model (λ = 46.6 instead of λ = 24.8), hence the Reynolds number was (slightly) different. The IIHR results have been obtained by P.I.V. (Fig. 30, [6]) and by Pitot probe (Fig. 31, [5]). A very detailed uncertainty assessment of the measured values has been carried out in order to quantify the accuracy of the results. All the individuated error sources have been separately analyzed to evaluate the bias limit, while precision limit has been evaluated directly on the experiment output by 10 repeated test performed for three different measurement points characterized by high low and intermediate values of the cross-flow components (see App. A). 5 Concluding remarks A very detailed database, for validation of the CFD codes for ship flows prediction, has been realized by measurements of resistance and sinkage and trim, wave profiles, wave pattern and mean velocity components around a model of a fast displacement ship hull. A cross validation of significant part of present data set has been carried out using experimental results obtained at DTMB and IIHR, giving a very good outcome. The uncertainty assessment of the results has allowed quantifying the accuracy of the database for the different flow variables. The uncertainty on the wave pattern is almost everywhere lower than 5 %. Furthermore, it has been shown that the longitudinal velocity component has been determined with uncertainty lower than 1% of the nominal test velocity. The analysis of the velocity field has allowed to understand interesting feature of the flow field, like the action of the bow bilge vortices on the downstream development of the boundary layer and the interaction between stern and bow bilge vortices. Present work confirms the importance of such onerous experiments in order to understand the behavior of the flow around complex body shapes in presence of a free surface, such as ship flows. On the other hand the main reason for which we performed present experiment is to carry out a useful database for numerical codes testing. In fact, this database allows to validate the results on the global quantities, as resistance, but more important, allows to compare the local properties of the calculated flow with the corresponding ones obtained experimentally. A demanding test of the CFD codes for laboratory Reynolds number (10 7 ) is needed, in fact, if we want to use them to calculate the flow at real Reynolds numbers, which are of order of Therefore the experiments have to be carried out at large Reynolds number, in order to obtain a flow that is as close as possible to the one of the full scale realizations. 6 Acknowledgements This work has been supported by the Italian "Ministero dei Trasporti e della Navigazione" trough the INSEAN Research Program and by the Office of Naval Research under Grant 11
13 N through Dr. Edwin Rood. We like to thank Professor Fred Stern of Iowa University (IIHR) for the suggestions and for encouraging us during this work. We also want to thank Massimo Palini and Pietro Maddalena for their contribution. 7 References [1] F. STERN, J. LONGO, R. PENNA, A. OLIVIERI, T. RATCLIFFE, H. COLEMAN, 2000 "International Collaboration on Benchmark CFD Validation Data for Surface Combatant" 23 rd Symposium on Naval Hydrodynamics, Val de Reuil [2] G. AVANZINI AND R. PENNA Towing Test Results with Uncertainty Assessment on a combatant ship INSEAN-IIHR Report May [3] A. OLIVIERI, R. PENNA Uncertainty Assessment in Wave elevation measurement ISOPE International Offshore and Polar Engineering Conference, Brest, [4] H.W. COLEMAN, W.G. STEELE Engineering Application of Experimental Uncertainty Analysis. AIAA J., Vol.33, N.10, pp [5] J. LONGO, F. STERN Resistance, sinkage and trim, wave profile and nominal wake tests and uncertainty assessment for DTMB model Proceedings of the 25 th ATTC. [6] L. GUI, J. LONGO, F. STERN Towing tank PIV measurement system and data uncertainty assessment for DTMB model rd International Workshop on PIV, S. Barbara, CA, USA, September. [7] T. RATCLIFFE. Validation of free surface Reynolds averaged Navier Stokes and potential flow equations DTMB Internal Report [8] A. DI MASCIO, R. MUSCARI, R. BROGLIA Computation of the flow past the U.S. navy combatant DTMB 5415 by a Godunov-type scheme. Proceedings of Gothenburg 2000 A workshop on numerical ship hydrodynamics, Ed. L. Larsson, F. Stern, V. Bertram. [9] T. ARTS, M. CARBONARO, R. A. VAN DEN BRAEMBUSSCHE Measurement Techniques in Fluid Dynamics. Von Karman Institute. [10] G. AVANZINI, L. BENEDETTI, A. OLIVIERI, M. PALINI, R. PENNA Studio sperimentale del campo fluidodinamico intorno ad una carena dislocante veloce. Parte III: Rilievo del campo di velocità triassiali a Fr = INSEAN Technical Report (in Italian). [11] F. LA GALA Misura di campi di velocità 3D con Pitot a 5 fori. INSEAN Technical Report (in Italian) [12] M. TOBAK, D.J. PEAK, Topology of three-dimensional separated flows. Annual Review of fluid mechanics, vol. 14 pp [13] H.W. COLEMAN, W.G. STEELE Experimental and Uncertainty Analysis for Engineers. J. Wiley & Sons New York, USA [14] J. LONGO Yaw effects on model-scale ship flow. Ph.D. Thesis, The Department of Mechanical Engineering, The University of Iowa. [15] G. AVANZINI, L. BENEDETTI, R. PENNA. Experimental evaluation of ship resistance for RANS code validation. International Journal of Off-shore and Polar Engineering, Vol.10, N.1, pp.10-18, [16] L. LARSSON, F. STERN, V. BERTRAM A workshop on numerical ship hydrodynamics Proceedings of G2K Workshop, Gothenburg (2000). [17] I. TANAKA. Three-dimensional ship boundary layer and wake. Advances in Applied Mechanics, vol. 26 (1988). [18] E. BABA A new component of viscous resistance of ships J. Soc. Naval Arch. Japan, 125, 23-34, (1969) 12
14 [19] Y. TODA, F. STERN, J. LONGO Mean-Flow Measurements in the Boundary Layer and Wake and Wave Field of a Series 60 C B = 0.6 Ship Model Part 1: Froude Numbers 0.16 and Journal of Ship Research 36, , (1992). [20] S.H. VAN, W.J. KIM, G.T YIM, D.H. KIM, C.J. LEE Experimental investigation on the flow characteristics around practical hull forms Proceedings of Osaka Conference (OC) [21] L. LARSSON, E. BABA Ship resistance and flow computations. Advances in Marine Hydrodynamics. 13
15
 6.16 0.248 Trim angle (deg) 0.0 0.0 Displacement (t) 8636.0 0.549 Volume (m 3 ) 8425.4 0.549 Wetted surface S W (m 2 ) 2949.5 4.786 Hull coefficients L PP /B 7.530 CB /( L PP BT) 0.")
16 Fig. 1: Geometry and photo of model INSEAN Description Ship Model Scale factor λ Length between perpendiculars L PP (m) Length at water level L WL (m) Overall length L OS (m) Breadth B (m) Draft T (m) Trim angle (deg) Displacement (t) Volume (m 3 ) Wetted surface S W (m 2 ) Hull coefficients L PP /B CB /( L PP BT) B/T CP /( L PP A X ) L E / L PP CPF 2 F /( L PP A X ) L R / L PP CPA 2 A /( L PP A X ) L P / L PP 0.0 CX A X /BT L PP / 1/ CW A W /( L PP B) S W / 2/ CWF 2A WF /( L PP B) X FB /L PP CWA 2A WA /( L PP B)
17 X FF /L PP α (deg) 11.0 Tab. 1: Geometrical data for INSEAN model 2340 and full-scale ship. V Fr R T (Kg) C TM Re C F C R Date Time E E E E-04 1/8/ E E E E-03 22/7/ E E E E-04 24/7/ E E E E-04 31/7/ E E E E-04 28/7/ E E E E-04 31/7/ E E E E-04 31/7/ E E E E-04 25/7/ E E E E-04 30/7/ E E E E E E E E-04 24/7/ E E E E-04 21/7/ E E E E-04 30/7/ E E E E-04 23/7/ E E E E-04 30/7/ E E E E-04 1/8/ E E E E-04 28/7/ E E E E-04 24/7/ E E E E-04 22/7/ E E E E-04 21/7/ E E E E-04 30/7/ E E E E-04 22/7/ E E E E-04 22/7/ E E E E-04 30/7/ E E E E-04 21/7/ E E E E-04 24/7/ E E E E-03 21/7/ E E E E-03 24/7/ E E E E-03 30/7/ E E E E-03 31/7/ E E E E-03 23/7/ E E E E E E E E-03 28/7/ E E E E-03 1/8/ E E E E-03 30/7/ E E E E-03 22/7/ E E E E-03 24/7/ E E E E-03 23/7/ E E E E-03 21/7/ E E E E-03 23/7/ E E E E-03 30/7/ E E E E-03 25/7/ E E E E-03 21/7/ E E E E-03 22/7/ E E E E-03 28/7/ E E E E-03 31/7/ E E E E-03 1/8/ E E E E-03 30/7/ E E E E-03 21/7/ E E E E-03 30/7/ E E E E-03 23/7/
18 E E E E-03 23/7/ E E E E E E E E-03 24/7/ E E E E-03 22/7/ E E E E-03 30/7/ E E E E-03 23/7/ E E E E-03 31/7/ E E E E-03 28/7/ Tab. 2: Towing tests results for INSEAN 2340model: resistance coefficients V (m/s) Fr T bow T stern Trim (deg) T FP T AP Sinkage E E E E E E E E E E E E E E E E E E E E E E E E E E E E E E E E E E E E E E E E E E E E E E+00 17
19 E E E E E E E E E E E+00 Tab. 3: Towing tests results for INSEAN model 2340: sinkage and trim 18
20 250 8.E-03 Total resistance (N) Resistance coefficient 6.E-03 4.E-03 2.E-03 CTm Cfm CR Model speed (ms -1 ) Fig. 2: Resistance force vs. model speed 0.E Froude number (Fr) Fig. 3: Total, viscous and residual resistance coefficients as a function of Froude number 7.00E E E E E E-03 INSEAN IIHR DTMB Ctm Ctm Ctm Cr Cr Cr 5.50E E-03 Ctm 5.00E-03 Ctm, Cr 4.00E E E E E E E E E Fr Fr Fig. 4: Total resistance coefficient dispersion at Fr = 0.10, 0.28 and 0.41 Fig. 5: Comparison for C TM and C R obtained by INSEAN (model 2340, λ = 24.8), IIHR (model 5512, λ = 46.6), DTMB (model 5415, λ = 24.8). 19
21 Trim angle (deg) Sinkage/Lpp Froude number (Fr) Froude number (Fr) Figs. 6a and 6b: Variation of trim angle and sinkage with Froude number INSEAN IIHR Trim angle (deg) INSEAN IIHR Sinkage/Lpp Fr Fr Figs. 7a and 7b: Comparison of sinkage and trim data from INSEAN and IIHR experiments 20


22 21
23 Fig. 8: Wave profiles at Fr = 0.28; INSEAN (B), DTMB (A), IIHR (C). 22


24 23
25 Fig. 9: Wave profiles at Fr = 0.41; INSEAN (B), DTMB (A), IIHR (C). 24
26 Fig. 10: wave pattern experimental setup and sketch of the data acquisition device. 25
27 Fig. 11: wave pattern and selected wave cuts for precision limit evaluation 26
28 wall reflection Fr=0.28 y x Fig. 12: Far-field wave pattern at Fr = wall reflection Fr=0.41 y x Fig. 13: Far-field wave pattern at Fr = Arrows show breaking regions. Fig. 14: y = wave cut. IIHR and INSEAN data. 27
29 Fig. 15: sketch of the velocity measurement set-up: left (rear view), right (side view) 28


30 5 mm Fig. 16: front view of the Pitot head (left). Rack of differential pressure transducers. Fig. 17: step by step averaged pressure transducers signal. 29
 and cross-flow vectors (right). Cross-section x = 0.1: (port side measurements and mirror).")
31 Fig. 18a: longitudinal velocity component iso-levels (left) and cross-flow vectors (right). Cross-section x = 0.0: (port side measurements and mirror). Fig. 18b: longitudinal velocity component iso-levels (left) and cross-flow vectors (right). Cross-section x = 0.1: (port side measurements and mirror). 30
. Cross-section x = 0.2: (port side measurements and mirror).")
 and cross-flow")
32 Fig. 18c: longitudinal velocity component iso-levels (left) and cross-flow vectors (right). Cross-section x = 0.2: (port side measurements and mirror).. Fig. 18d: longitudinal velocity component iso-levels (left) and cross-flow vectors (right). Cross-section x = 0.4: (port side measurements and mirror). 31
 and cross-flow vectors (right). Cross-section x =0.8: (port side measurements and mirror).")
33 Fig. 18e: longitudinal velocity component iso-levels (left) and cross-flow vectors (right). Cross-section x = 0.6: (port side measurements and mirror). Fig. 18 f: longitudinal velocity component iso-levels (left) and cross-flow vectors (right). Cross-section x =0.8: (port side measurements and mirror). 32
 and cross-flow vectors (right). Cross-section x = 1.0: (port side measurements and mirror). 33")
34 Fig. 18g: longitudinal velocity component iso-levels (left) and cross-flow vectors (right). Cross-section x = : (port side measurements and mirror). Fig. 18h: longitudinal velocity component iso-levels (left) and cross-flow vectors (right). Cross-section x = 1.0: (port side measurements and mirror). 33
35 Fig. 18i: longitudinal velocity component iso-levels (left) and cross-flow vectors (right). Cross-section x = 1.1: (port side measurements and mirror). Fig. 18l: longitudinal velocity component iso-levels (left) and cross-flow vectors (right). Cross-section x = 1.2: (port side measurements and mirror). 34

, longitudinal vorticity")
. Figs.")
36 Fig. 19: velocity vector representing the flow at incidence to the bulb. Figs. 20a and 20b: longitudinal velocity iso-levels and cross-stream traces (left), longitudinal vorticity and cross-fl ow vectors (right); section x = 0.2 (port-side view). Figs. 20c and 20d: grid refinement at section x =
,")
; section x = 0.")

; section 0.")


37 Figs. 21a and 21b: longitudinal velocity iso-levels and cross-stream traces (left), longitudinal vorticity and cross-fl ow vectors (right); section x = 0.4 (port-side view). Figs. 22a and 22b: longitudinal velocity iso-levels and cross-stream traces (left), longitudinal vorticity and cross-flow vectors (right); section 0.6 (port-side view). Fig. 23: qualitative sketch of induced velocity by the vortices on the vortices. Fig. 24: displacement of the vortex trace between section 0.6 and section 0.8 (starboard view). 36
; section 0.8 (port-side view). Figs.")
; propeller plane section (nominal wake), (port-side view). Figs.")
 and propeller plane (right); the cross-stream traces have been drawn inside the frames in both")
38 Figs. 25a and 25b: longitudinal velocity iso-levels and cross-flow vectors (left), longitudinal vorticity and cross-flow vectors (right); section 0.8 (port-side view). Figs. 26a and 26b: longitudinal velocity iso-levels and cross-flow vectors (left), longitudinal vorticity and cross-flow vectors (right); propeller plane section (nominal wake), (port-side view). Figs. 27a and 27b: longitudinal vorticity iso-levels and cross-flow vectors at section 0.8 (left) and propeller plane (right); the cross-stream traces have been drawn inside the frames in both figures, adding a mean value to the vertical velocity component (port-sides view). 37
39 Fig. 28: propeller plane results as iso-levels of total head (H) and velocity components. 38
 and DTMB 5415 (right). Fig.")

40 Fig. 29a: comparison in terms of axial velocity component iso-levels between INSEAN 2340A (left) and DTMB 5415 (right). Fig. 29b: comparison in terms of transverse velocity component iso-levels between INSEAN 2340A (left) and DTMB 5415 (right). Fig. 29c: comparison in terms of vertical velocity component iso-levels between INSEAN 2340A (left) 39
41 and DTMB 5415 (right). 40
, in terms of longitudinal velocity component iso-levels. Fig.")
, in terms of longitudinal velocity component iso-levels.")
42 Fig. 30: comparison between present INSEAN 2340 A results (left) and results obtained at IIHR on 5512 model using PIV (right), in terms of longitudinal velocity component iso-levels. Fig. 31: comparison between present INSEAN 2340 A results (left) and results obtained at IIHR on 5512 model using 5-hole Pitot (right), in terms of longitudinal velocity component iso-levels. 41
ITTC Recommended Procedures Testing and Extrapolation Methods Resistance Resistance Test
 -0- Page 1 of 11 CONTENTS 1. PURPOSE OF PROCEDURE. PARAMETERS.1 Data Reduction Equations. Definition of ariables 3. DESCRIPTION OF PROCEDURE 3.1 Model and Installation 3.1.1 Model 3.1. Test condition 3.1.3
ITTC Recommended Procedures and Guidelines
 ITT Recommended 7.5-0 -0-0 Page of 8 00 Table of ontents PURPOSE OF PROEDURE... EXAMPLE FOR RESISTANE TEST. Test Design.... Measurement Systems and Procedure.... Uncertainty Analysis...4.. ias Limit...5...
Numerical Study of the Roll Decay of Intact and Damaged Ships by Q. Gao and D. Vassalos
 Session 7 Stability of Damaged Ships Numerical Simulation of Progressive Flooding and Capsize Numerical Study of the Roll Decay of Intact and Damaged Ships by Q. Gao and D. Vassalos Qiuxin Gao and Dracos
ITTC Recommended Procedures
 7.5-0 -03-0. Page of 6 CONTENTS PURPOSE OF PROCEDURE EXAMPLE FOR OPEN WATER TEST. Test Design. Measurement System and Procedure.3 Uncertainty Analysis.3. ias Limit.3.. Propeller Geometry.3.. Speed of advance
Local Velocity Field Measurements around the KCS Model (SRI M.S.No.631) in the SRI 400m Towing Tank
 in the SRI 400m Towing Tank") Local Velocity Field Measurements around the KCS Model (SRI M.S.No.631) in the SRI 400m Towing Tank 1. Introduction The present report describes the local velocity field measurements around a model of
Local Velocity Field Measurements around the KCS Model (SRI M.S.No.631) in the SRI 400m Towing Tank 1. Introduction The present report describes the local velocity field measurements around a model of
Circular motion tests and uncertainty analysis for ship maneuverability
 DOI 1.17/s773-9-65-2 ORIGINAL ARTICLE Circular motion tests and uncertainty analysis for ship maneuverability Michio Ueno Æ Yasuo Yoshimura Æ Yoshiaki Tsukada Æ Hideki Miyazaki Received: 13 October 2 /
Experimental and Numerical Analysis of the Roll Decay Motion for a Patrol Boat
 Experimental and Numerical Analysis of the Roll Decay Motion for a Patrol Boat R. Broglia, B. Bouscasse, A. Di Mascio and C. Lugni INSEAN Italian Ship Model Basin Rome, Italy P. Atsavapranee NSWCCD Naval
The Calculations of Propeller Induced Velocity by RANS and Momentum Theory
 J. Marine Sci. Appl. (2012) 11: 164-168 DOI: 10.1007/s11804-012-1118-1 The Calculations of Propeller Induced Velocity by RANS and Momentum Theory Qiuxin Gao *, Wei Jin and Dracos Vassalos Department of
Calculation of the Flow around the KVLCC2M Tanker
 Calculation of the Flow around the KVLCC2M Tanker L. Eça 1, M. Hoekstra 2 and S.L. Toxopeus 2 1 Instituto Superior Técnico, Portugal 2 Maritime Research Institute, Netherlands SUMMARY The flow around the
Evaluation of Surface-Ship Resistance and Propulsion Model-Scale Database for CFD Validation *
 Evaluation of Surface-Ship Resistance and Propulsion Model-Scale Database for CFD Validation * Fred Stern and Joe Longo Iowa Institute of Hydraulic Research The University of Iowa Iowa City, IA 52242 Moustafa
A Study of Resistance of High-Speed Catamarans and Scale Effects on Form Factor Sarawuth Srinakaew Dominic J. Taunton Dominic A.
 A Study of Resistance of High-Speed Catamarans and Scale Effects on Form Factor Sarawuth Srinakaew, Dominic J. Taunton, Dominic A. Hudson Fluid Structure Interactions Group, University of Southampton ss17e111@soton.ac.uk
ITTC Recommended Procedures and Guidelines Testing and Extrapolation Methods Propulsion, Performance Propulsion Test
 7.5- Page 1 of 13 Table of Contents... 2 1. PURPOSE OF PROCEDURE... 2 2. PARAMETERS... 2 2.1 Data Reduction Equations... 2 2.2 Definition of Variables... 3 3. DESCRIPTION OF PROCEDURE... 3 3.1 Model and
Experimental characterization of flow field around a square prism with a small triangular prism
 Journal of Mechanical Science and Technology 29 (4) (2015) 1649~1656 www.springerlink.com/content/1738-494x OI 10.1007/s12206-015-0336-2 Experimental characterization of flow field around a square prism
ITTC Recommended Procedures and Guidelines
 Page of Table of Contents Waterjet Propulsion Test and Extrapolation... PURPOSE OF PROCEDURE.... PARAMETERS.... Nomenclature... 3. DESCRIPTION OF PROCEDURE... 3 3. Model and installation... 3 3.. Resistance
A Pair of Large-incidence-angle Cylinders in Cross-flow with the Upstream One Subjected to a Transverse Harmonic Oscillation
 Proceedings of the 2010 International Conference on Industrial Engineering and Operations Management Dhaka, Bangladesh, January 9 10, 2010 A Pair of Large-incidence-angle Cylinders in Cross-flow with the
Module 3: Velocity Measurement Lecture 16: Validation of PIV with HWA. The Lecture Contains: Hotwire Anemometry. Uncertainity
 The Lecture Contains: Hotwire Anemometry Hotwire Measurements Calibration Methodology Curve Fitting Directional Probe Senstivity Data Reduction Uncertainity Validation of Experiments Comparision of Hot
Effect of Liquid Viscosity on Sloshing in A Rectangular Tank
 International Journal of Research in Engineering and Science (IJRES) ISSN (Online): 2320-9364, ISSN (Print): 2320-9356 Volume 5 Issue 8 ǁ August. 2017 ǁ PP. 32-39 Effect of Liquid Viscosity on Sloshing
FLOW SEPARATION. Aerodynamics Bridge-Pier Design Combustion Chambers Human Blood Flow Building Design Etc.
 FLOW SEPARATION Aerodynamics Bridge-Pier Design Combustion Chambers Human Blood Flow Building Design Etc. (Form Drag, Pressure Distribution, Forces and Moments, Heat And Mass Transfer, Vortex Shedding)
Development of a probe traversing system for an open test section wind tunnel
 Development of a probe traversing system for an open test section wind tunnel Gépészet 2012 Conference 24 th of May, 2012 Section Energy 2. Árpád Varga Mechanical Engineering Modelling MSc, Contractual
ME332 FLUID MECHANICS LABORATORY (PART I)
") ME332 FLUID MECHANICS LABORATORY (PART I) Mihir Sen Department of Aerospace and Mechanical Engineering University of Notre Dame Notre Dame, IN 46556 Version: January 14, 2002 Contents Unit 1: Hydrostatics
ME332 FLUID MECHANICS LABORATORY (PART I) Mihir Sen Department of Aerospace and Mechanical Engineering University of Notre Dame Notre Dame, IN 46556 Version: January 14, 2002 Contents Unit 1: Hydrostatics
Dessi, D., D Orazio, D.
 CORRELATION OF MODEL-SCALE AND FULL-SCALE DATA: SENSOR VALIDATION AND ELASTIC SCALING EVALUATION Dessi, D., D Orazio, D. INSEAN-CNR Rome - Italy 1 Project structure hydroelastic side This work was funded
Standard Practices for Air Speed Calibration Testing
 Standard Practices for Air Speed Calibration Testing Rachael V. Coquilla Bryza Wind Lab, Fairfield, California Air speed calibration is a test process where the output from a wind measuring instrument
Confined water effects on the viscous flow around a tanker with propeller and rudder
 International Shipbuilding Progress 60 (2013) 309 343 309 DOI 10.3233/ISP-130101 IOS Press Confined water effects on the viscous flow around a tanker with propeller and rudder L. Zou and L. Larsson Chalmers
PROPERTIES OF THE FLOW AROUND TWO ROTATING CIRCULAR CYLINDERS IN SIDE-BY-SIDE ARRANGEMENT WITH DIFFERENT ROTATION TYPES
 THERMAL SCIENCE, Year, Vol. 8, No. 5, pp. 87-9 87 PROPERTIES OF THE FLOW AROUND TWO ROTATING CIRCULAR CYLINDERS IN SIDE-BY-SIDE ARRANGEMENT WITH DIFFERENT ROTATION TYPES by Cheng-Xu TU, a,b Fu-Bin BAO
Numerical Investigation of the Fluid Flow around and Past a Circular Cylinder by Ansys Simulation
 , pp.49-58 http://dx.doi.org/10.1457/ijast.016.9.06 Numerical Investigation of the Fluid Flow around and Past a Circular Cylinder by Ansys Simulation Mojtaba Daneshi Department of Mechanical Engineering,
Effects of the Leakage Flow Tangential Velocity in Shrouded Axial Compressor Cascades *
 TSINGHUA SCIENCE AND TECHNOLOGY ISSNll1007-0214ll21/21llpp105-110 Volume 14, Number S2, December 2009 Effects of the Leakage Flow Tangential Velocity in Shrouded Axial Compressor Cascades * KIM Jinwook
Comparison of Thruster Axis Tilting versus Nozzle Tilting on the Propeller-Hull Interactions for a Drillship at DP-Conditions
 DYNAMIC POSITIONING CONFERENCE October 12-13, 2010 Thrusters Comparison of Thruster Axis Tilting versus Nozzle Tilting on the Propeller-Hull Interactions for a Drillship at DP-Conditions Michael Palm,
Simulation of Aeroelastic System with Aerodynamic Nonlinearity
 Simulation of Aeroelastic System with Aerodynamic Nonlinearity Muhamad Khairil Hafizi Mohd Zorkipli School of Aerospace Engineering, Universiti Sains Malaysia, Penang, MALAYSIA Norizham Abdul Razak School
A fundamental study of the flow past a circular cylinder using Abaqus/CFD
 A fundamental study of the flow past a circular cylinder using Abaqus/CFD Masami Sato, and Takaya Kobayashi Mechanical Design & Analysis Corporation Abstract: The latest release of Abaqus version 6.10
ITTC Recommended Procedures
 Example for est 7.5-0 -0-0 Page of 7 00 ONENS PUPOSE O POEDUE EXAMPLE O ESISANE ES. est Design. Measurement Systems and Procedure. Uncertainty Analysis.. ias Limit... Hull Geometry (Model Length and Wetted
Welcome to the Ship Resistance Predictor! The total calm water resistance is given by:
 Welcome to the Ship Resistance Predictor! What does this Excel Sheet do? This Excel sheet helps you calculate the Total Calm Water Resistance for a Ship at a given forward speed It also calculates from
ZIG-ZAG MANEUVER SIMULATION BY CFD FOR A TANKER LIKE VESSEL
 V International Conference on Computational Methods in Marine Engineering MARINE 2013 B. Brinkmann and P. Wriggers (Eds) ZIG-ZAG MANEUVER SIMULATION BY CFD FOR A TANKER LIKE VESSEL G. DUBBIOSO, D. DURANTE,
Hull loads and response, hydroelasticity
 Transactions on the Built Environment vol 1, 1993 WIT Press, www.witpress.com, ISSN 1743-3509 Hull loads and response, hydroelasticity effects on fast monohulls E. Jullumstr0 & J.V. Aarsnes Division of
Review of Anemometer Calibration Standards
 Review of Anemometer Calibration Standards Rachael V. Coquilla rvcoquilla@otechwind.com Otech Engineering, Inc., Davis, CA Anemometer calibration defines a relationship between the measured signals from
1) the intermittence of the vortex-shedding regime at the critical angle of incidence in smooth flow; ) the inversion of the lift coefficient slope at
 the intermittence of the vortex-shedding regime at the critical angle of incidence in smooth flow; ) the inversion of the lift coefficient slope at") The Seventh International Colloquium on Bluff Body Aerodynamics and Applications (BBAA7) Shanghai, China; September -6, 01 Experimental investigation on the aerodynamic behavior of square cylinders with
The Seventh International Colloquium on Bluff Body Aerodynamics and Applications (BBAA7) Shanghai, China; September -6, 01 Experimental investigation on the aerodynamic behavior of square cylinders with
Computation of Unsteady Flows With Moving Grids
 Computation of Unsteady Flows With Moving Grids Milovan Perić CoMeT Continuum Mechanics Technologies GmbH milovan@continuummechanicstechnologies.de Unsteady Flows With Moving Boundaries, I Unsteady flows
VORTICITY FIELD EVOLUTION IN A FORCED WAKE. Richard K. Cohn Air Force Research Laboratory Edwards Air Force Base, CA 92524
 Proceedings of the st International Symposium on Turbulence and Shear Flow Phenomena, Santa Barbara, CA, Sep. 5, 999, Eds. Banerjee, S. and Eaton, J. K., pp. 9-96. VORTICITY FIELD EVOLUTION IN A FORCED
Module 3: Velocity Measurement Lecture 15: Processing velocity vectors. The Lecture Contains: Data Analysis from Velocity Vectors
 The Lecture Contains: Data Analysis from Velocity Vectors Velocity Differentials Vorticity and Circulation RMS Velocity Drag Coefficient Streamlines Turbulent Kinetic Energy Budget file:///g /optical_measurement/lecture15/15_1.htm[5/7/2012
Experimental and Numerical Investigation of Flow over a Cylinder at Reynolds Number 10 5
 Journal of Modern Science and Technology Vol. 1. No. 1. May 2013 Issue. Pp.52-60 Experimental and Numerical Investigation of Flow over a Cylinder at Reynolds Number 10 5 Toukir Islam and S.M. Rakibul Hassan
White Paper FINAL REPORT AN EVALUATION OF THE HYDRODYNAMICS MECHANISMS WHICH DRIVE THE PERFORMANCE OF THE WESTFALL STATIC MIXER.
 White Paper FINAL REPORT AN EVALUATION OF THE HYDRODYNAMICS MECHANISMS WHICH DRIVE THE PERFORMANCE OF THE WESTFALL STATIC MIXER Prepared by: Dr. Thomas J. Gieseke NUWCDIVNPT - Code 8233 March 29, 1999
Motions and Resistance of a Ship in Regular Following Waves
 Reprinted: 01-11-2000 Revised: 03-10-2007 Website: www.shipmotions.nl Report 440, September 1976, Delft University of Technology, Ship Hydromechanics Laboratory, Mekelweg 2, 2628 CD Delft, The Netherlands.
Active Control of Separated Cascade Flow
 Chapter 5 Active Control of Separated Cascade Flow In this chapter, the possibility of active control using a synthetic jet applied to an unconventional axial stator-rotor arrangement is investigated.
Reliability assessment of ship powering performance extrapolations using Monte Carlo methods
 Third International Symposium on Marine Propulsors smp 13, Launceston, Tasmania, Australia, May 2013 Reliability assessment of ship powering performance extrapolations using Monte Carlo methods Iwan M.
INFLUENCE OF ACOUSTIC EXCITATION ON AIRFOIL PERFORMANCE AT LOW REYNOLDS NUMBERS
 ICAS 2002 CONGRESS INFLUENCE OF ACOUSTIC EXCITATION ON AIRFOIL PERFORMANCE AT LOW REYNOLDS NUMBERS S. Yarusevych*, J.G. Kawall** and P. Sullivan* *Department of Mechanical and Industrial Engineering, University
DEVELOPMENT OF DROP WEIGHT IMPACT TEST MACHINE
 CHAPTER-8 DEVELOPMENT OF DROP WEIGHT IMPACT TEST MACHINE 8.1 Introduction The behavior of materials is different when they are subjected to dynamic loading [9]. The testing of materials under dynamic conditions
Simple Estimation of Wave Added Resistance from Experiments in Transient and Irregular Water Waves
 Simple Estimation of Wave Added Resistance from Experiments in Transient and Irregular Water Waves by Tsugukiyo Hirayama*, Member Xuefeng Wang*, Member Summary Experiments in transient water waves are
Maneuvering predictions in the early design phase using CFD generated PMM data
 9th Symposium on Naval Hydrodynamics othenburg, Sweden, 6-31 August 01 Maneuvering predictions in the early design phase using CFD generated PMM data Claus D. Simonsen, Janne F. Otzen, Christian Klimt,
Numerical study of the effects of trailing-edge bluntness on highly turbulent hydro-foil flows
 Numerical study of the effects of trailing-edge bluntness on highly turbulent hydro-foil flows T. Do L. Chen J. Tu B. Anderson 7 November 2005 Abstract Flow-induced noise from fully submerged lifting bodies
6.1 Momentum Equation for Frictionless Flow: Euler s Equation The equations of motion for frictionless flow, called Euler s
 Chapter 6 INCOMPRESSIBLE INVISCID FLOW All real fluids possess viscosity. However in many flow cases it is reasonable to neglect the effects of viscosity. It is useful to investigate the dynamics of an
elements remain in high frequency region and sometimes very large spike-shaped peaks appear. So we corrected the PIV time histories by peak cutting an
 The Seventh International Colloquium on Bluff Body Aerodynamics and Applications (BBAA7) Shanghai, China; September 2-6, 2012 LES of fluctuating wind pressure on a 3D square cylinder for PIV-based inflow
An Overview of ASME V&V 20: Standard for Verification and Validation in Computational Fluid Dynamics and Heat Transfer
 An Overview of ASME V&V 20: Standard for Verification and Validation in Computational Fluid Dynamics and Heat Transfer Hugh W. Coleman Department of Mechanical and Aerospace Engineering University of Alabama
Vortex Induced Vibrations
 Vortex Induced Vibrations By: Abhiroop Jayanthi Indian Institute of Technology, Delhi Some Questions! What is VIV? What are the details of a steady approach flow past a stationary cylinder? How and why
Explicit algebraic Reynolds stress models for internal flows
 5. Double Circular Arc (DCA) cascade blade flow, problem statement The second test case deals with a DCA compressor cascade, which is considered a severe challenge for the CFD codes, due to the presence
Numerical Investigation of the Transonic Base Flow of A Generic Rocket Configuration
 1 Numerical Investigation of the Transonic Base Flow of A Generic Rocket Configuration A. Henze, C. Glatzer, M. Meinke, W. Schröder Institute of Aerodynamics, RWTH Aachen University, Germany March 21,
Trajectory Tracking of a Near-Surface Torpedo using Numerical Methods
 ISSN (Print) : 2347-671 An ISO 3297: 27 Certified Organization Vol.4, Special Issue 12, September 215 Trajectory Tracking of a Near-Surface Torpedo using Numerical Methods Anties K. Martin, Anubhav C.A.,
Effect of Blockage on Spanwise Correlation in a Circular Cylinder Wake
 Effect of Blockage on Spanwise Correlation in a Circular Cylinder Wake H. M. Blackburn Department of Mechanical Engineering, Monash University May 15, 2003 Summary A short series of experiments was conducted
Large-eddy simulations for wind turbine blade: rotational augmentation and dynamic stall
 Large-eddy simulations for wind turbine blade: rotational augmentation and dynamic stall Y. Kim, I.P. Castro, and Z.T. Xie Introduction Wind turbines operate in the atmospheric boundary layer and their
Lecture-4. Flow Past Immersed Bodies
 Lecture-4 Flow Past Immersed Bodies Learning objectives After completing this lecture, you should be able to: Identify and discuss the features of external flow Explain the fundamental characteristics
Influence of the Transom-Hollow Length on Wave Resistance
 Summary Influence of the Transom-Hollow Length on Wave Resistance Lawrence J. Doctors The University of New South Wales, Sydney, NSW 2052, Australia Email: L.Doctors@UNSW.edu.au Previous experimental data
Dynamics of Machinery
 Dynamics of Machinery Two Mark Questions & Answers Varun B Page 1 Force Analysis 1. Define inertia force. Inertia force is an imaginary force, which when acts upon a rigid body, brings it to an equilibrium
Applied Fluid Mechanics
 Applied Fluid Mechanics 1. The Nature of Fluid and the Study of Fluid Mechanics 2. Viscosity of Fluid 3. Pressure Measurement 4. Forces Due to Static Fluid 5. Buoyancy and Stability 6. Flow of Fluid and
Applied Fluid Mechanics
 Applied Fluid Mechanics 1. The Nature of Fluid and the Study of Fluid Mechanics 2. Viscosity of Fluid 3. Pressure Measurement 4. Forces Due to Static Fluid 5. Buoyancy and Stability 6. Flow of Fluid and
Experimental Verification of CFD Modeling of Turbulent Flow over Circular Cavities using FLUENT
 Experimental Verification of CFD Modeling of Turbulent Flow over Circular Cavities using FLUENT T Hering, J Dybenko, E Savory Mech. & Material Engineering Dept., University of Western Ontario, London,
PLEASURE VESSEL VIBRATION AND NOISE FINITE ELEMENT ANALYSIS
 PLEASURE VESSEL VIBRATION AND NOISE FINITE ELEMENT ANALYSIS 1 Macchiavello, Sergio *, 2 Tonelli, Angelo 1 D Appolonia S.p.A., Italy, 2 Rina Services S.p.A., Italy KEYWORDS pleasure vessel, vibration analysis,
VERIFICATION AND VALIDATION OF RESISTANCE AND PROPULSION COMPUTATION
 VERIFICATION AND VALIDATION OF RESISTANCE AND PROPULSION COMPUTATION G. Deng, A. Leroyer, E. Guilmineau, P. Queutey, M. Visonneau & J. Wackers (ECN-LHEEA,CNRS, France) A. del Toro Llorens (Spanish Institution
Experimental Investigation of the Aerodynamic Forces and Pressures on Dome Roofs: Reynolds Number Effects
 Experimental Investigation of the Aerodynamic Forces and Pressures on Dome Roofs: Reynolds Number Effects *Ying Sun 1), Ning Su 2), Yue Wu 3) and Qiu Jin 4) 1), 2), 3), 4) Key Lab of Structures Dynamic
Experimental and numerical investigation of 2D sloshing: scenarios near the critical filling depth
 Experimental and numerical investigation of 2D sloshing: scenarios near the critical filling depth A. Colagrossi F. Palladino M. Greco a.colagrossi@insean.it f.palladino@insean.it m.greco@insean.it C.
Numerical Analysis of Unsteady Open Water Characteristics of Surface Piercing Propeller
 Third International Symposium on Marine Propulsors smp 13, Launceston, Tasmania, Australia, May 2013 Numerical Analysis of Unsteady Open Water Characteristics of Surface Piercing Propeller Kohei Himei
1. Introduction - Tutorials
 1. Introduction - Tutorials 1.1 Physical properties of fluids Give the following fluid and physical properties(at 20 Celsius and standard pressure) with a 4-digit accuracy. Air density : Water density
Relaminerization of a Highly Accelerated Flow on a Convex Curvature
 Relaminerization of a Highly Accelerated Flow on a Convex Curvature Abstract Relaminarization of turbulent flow is a process by which the mean flow reverts to an effectively laminar state. The phenomenon
Vortex shedding from slender surface mounted pyramids
 Vortex shedding from slender surface mounted pyramids M. J. Morrison 1, R. J. Martinuzzi 3, E. Savory 1, G. A. Kopp 2 1 Department of Mechanical and Materials Engineering, University of Western Ontario,
Simulation analysis using CFD on vibration behaviors of circular cylinders subjected to free jets through narrow gaps in the vicinity of walls
 Fluid Structure Interaction V 85 Simulation analysis using CFD on vibration behaviors of circular cylinders subjected to free jets through narrow gaps in the vicinity of walls K. Fujita Osaka City University,
COMPUTATIONAL SIMULATION OF THE FLOW PAST AN AIRFOIL FOR AN UNMANNED AERIAL VEHICLE
 COMPUTATIONAL SIMULATION OF THE FLOW PAST AN AIRFOIL FOR AN UNMANNED AERIAL VEHICLE L. Velázquez-Araque 1 and J. Nožička 2 1 Division of Thermal fluids, Department of Mechanical Engineering, National University
Increasing of the Stern Tube Bushes Precision by On-Line Adaptive Control of the Cutting Process
 Increasing of the Stern Tube Bushes Precision by On-Line Adaptive Control of the Cutting Process LUCIAN VASILIU, ALEXANDRU EPUREANU, GABRIEL FRUMUŞANU, VASILE MARINESCU Manufacturing Science and Engineering
Measurement of Pressure Distribution and Forces Acting on an Airfoil S. Ghosh, M. Muste, S. Breczinski, J. Johnson, S. Cook, and F.
 57:00 Mechanics of Fluids and Transfer Processes Laboratory Experiment #3 Measurement of Pressure Distribution and Forces Acting on an Airfoil S. Ghosh, M. Muste, S. Breczinski, J. Johnson, S. Cook, and
Keywords: Contoured side-walls, design, experimental, laminar boundary layer, numerical, receptivity, stability, swept wing, wind tunnel.
 Applied Mechanics and Materials Vol. 390 (2013) pp 96-102 Online available since 2013/Aug/30 at www.scientific.net (2013) Trans Tech Publications, Switzerland doi:10.4028/www.scientific.net/amm.390.96
EXPERIMENTAL INVESTIGATION OF THE DYNAMIC STABILITY DERIVATIVES FOR A FIGHTER MODEL
 24 TH INTERNATIONAL CONGRESS OF THE AERONAUTICAL SCIENCES EXPERIMENTAL INVESTIGATION OF THE DYNAMIC STABILITY DERIVATIVES FOR A FIGHTER MODEL MR Soltani*, Ali R Davari** *Associate Professor, **PhD Student
Chapter 5 Phenomena of laminar-turbulent boundary layer transition (including free shear layers)
") Chapter 5 Phenomena of laminar-turbulent boundary layer transition (including free shear layers) T-S Leu May. 3, 2018 Chapter 5: Phenomena of laminar-turbulent boundary layer transition (including free
Chapter 5 Phenomena of laminar-turbulent boundary layer transition (including free shear layers) T-S Leu May. 3, 2018 Chapter 5: Phenomena of laminar-turbulent boundary layer transition (including free
Self-Excited Vibration in Hydraulic Ball Check Valve
 Self-Excited Vibration in Hydraulic Ball Check Valve L. Grinis, V. Haslavsky, U. Tzadka Abstract This paper describes an experimental, theoretical model and numerical study of concentrated vortex flow
10.52 Mechanics of Fluids Spring 2006 Problem Set 3
 10.52 Mechanics of Fluids Spring 2006 Problem Set 3 Problem 1 Mass transfer studies involving the transport of a solute from a gas to a liquid often involve the use of a laminar jet of liquid. The situation
2 Navier-Stokes Equations
 1 Integral analysis 1. Water enters a pipe bend horizontally with a uniform velocity, u 1 = 5 m/s. The pipe is bended at 90 so that the water leaves it vertically downwards. The input diameter d 1 = 0.1
Side-View Mirror Vibrations Induced Aerodynamically by Separating Vortices
 Open Journal of Fluid Dynamics, 2016, 6, 42-56 Published Online March 2016 in SciRes. http://www.scirp.org/journal/ojfd http://dx.doi.org/10.4236/ojfd.2016.61004 Side-View Mirror Vibrations Induced Aerodynamically
Review on Vortex-Induced Vibration for Wave Propagation Class
 Review on Vortex-Induced Vibration for Wave Propagation Class By Zhibiao Rao What s Vortex-Induced Vibration? In fluid dynamics, vortex-induced vibrations (VIV) are motions induced on bodies interacting
FLOW MEASUREMENT. INC 102 Fundamental of Instrumentation and Process Control 2/2560
 FLOW MEASUREMENT INC 102 Fundamental of Instrumentation and Process Control 2/2560 TABLE OF CONTENTS A. INTRODUCTION B. LOCAL FLOW MEASUREMENT B.1 Particle Image Velocimetry (PIV) B.2 Laser doppler anemometry
On the advanced extrapolation method for a new type of podded propulsor via CFD simulations and model measurements
 Fifth International Symposium on Marine Propulsors smp 17, Espoo, Finland, June 2017 On the advanced extrapolation method for a new type of podded propulsor via CFD simulations and model measurements Tomi
THE EFFECT OF SAMPLE SIZE, TURBULENCE INTENSITY AND THE VELOCITY FIELD ON THE EXPERIMENTAL ACCURACY OF ENSEMBLE AVERAGED PIV MEASUREMENTS
 4th International Symposium on Particle Image Velocimetry Göttingen, Germany, September 7-9, 00 PIV 0 Paper 096 THE EFFECT OF SAMPLE SIZE, TURBULECE ITESITY AD THE VELOCITY FIELD O THE EXPERIMETAL ACCURACY
Measurements using Bernoulli s equation
 An Internet Book on Fluid Dynamics Measurements using Bernoulli s equation Many fluid measurement devices and techniques are based on Bernoulli s equation and we list them here with analysis and discussion.
Open Access Experimental Research and Analysis of Vortex Excited Vibration Suppression of Spiral Stripe Strake
 Send Orders for Reprints to reprints@benthamscience.ae The Open Mechanical Engineering Journal, 2014, 8, 941-947 941 Open Access Experimental Research and Analysis of Vortex Excited Vibration Suppression
ENERGY DISTRIBUTION ANALYSIS IN A LOW HEAD FRANCIS TURBINE DURING THERMODYNAMIC EFFICIENCY MEASUREMENTS
 ENERGY DISTRIBUTION ANALYSIS IN A LOW HEAD FRANCIS TURBINE DURING THERMODYNAMIC EFFICIENCY MEASUREMENTS Gianalberto Grego, Fabio F. Muciaccia W.E.S.T. Srl, Milan, Italy west-hydro@libero.it ABSTRACT The
Lab #4 Similitude: The Kármán Vortex Street CEE 331 Fall 2004
 CEE 331 Lab 4 Page 1 of 6 Lab #4 Similitude: The Kármán Vortex Street CEE 331 Fall 2004 Safety The major safety hazard in this laboratory is a shock hazard. Given that you will be working with water and
Wave Resistance Prediction of Hard-Chine Catamarans through. Regression Analysis
 Wave Resistance Prediction of Hard-Chine Catamarans through Xuan P. Pham Research Student Dept. of Naval Architecture & Ocean Engineering Australian Maritime College PO Box 986, Launceston, TAS 7250, Australia.
EQUILIBRIUM and ELASTICITY
 PH 221-1D Spring 2013 EQUILIBRIUM and ELASTICITY Lectures 30-32 Chapter 12 (Halliday/Resnick/Walker, Fundamentals of Physics 9 th edition) 1 Chapter 12 Equilibrium and Elasticity In this chapter we will
Calculation of hydrodynamic manoeuvring coefficients using viscous-flow calculations
 Calculation of hydrodynamic manoeuvring coefficients using viscous-flow calculations Serge Toxopeus Maritime Research Institute Netherlands (MARIN), Wageningen, The Netherlands Delft University of Technology,
Computation for the Backward Facing Step Test Case with an Open Source Code
 Computation for the Backward Facing Step Test Case with an Open Source Code G.B. Deng Equipe de Modélisation Numérique Laboratoire de Mécanique des Fluides Ecole Centrale de Nantes 1 Rue de la Noë, 44321
EFFECT OF CHANNEL BENDS ON TRANSVERSE MIXING
 NIJOTECH VOL. 10. NO. 1 SEPTEMBER 1986 ENGMANN 57 EFFECT OF CHANNEL BENDS ON TRANSVERSE MIXING BY E. O. ENGMANN ABSTRACT Velocity and tracer concentration measurements made in a meandering channel are
Study of the influence of the resonance changer on the longitudinal vibration of marine propulsion shafting system
 Study of the influence of the resonance changer on the longitudinal vibration of marine propulsion shafting system Zhengmin Li 1, Lin He 2, Hanguo Cui 3, Jiangyang He 4, Wei Xu 5 1, 2, 4, 5 Institute of
Mode switching and hysteresis in the edge tone
 Journal of Physics: Conference Series Mode switching and hysteresis in the edge tone To cite this article: I Vaik and G Paál 2011 J. Phys.: Conf. Ser. 268 012031 View the article online for updates and
Given a stream function for a cylinder in a uniform flow with circulation: a) Sketch the flow pattern in terms of streamlines.
 Sketch the flow pattern in terms of streamlines.") Question Given a stream function for a cylinder in a uniform flow with circulation: R Γ r ψ = U r sinθ + ln r π R a) Sketch the flow pattern in terms of streamlines. b) Derive an expression for the angular
Question Given a stream function for a cylinder in a uniform flow with circulation: R Γ r ψ = U r sinθ + ln r π R a) Sketch the flow pattern in terms of streamlines. b) Derive an expression for the angular
Applied Thermal and Fluid Engineering. Energy Engineering (Thermal Engineering Laboratory)
") Applied Thermal and Fluid Engineering Energy Engineering (Thermal Engineering Laboratory) Professor Assoc. Professor Hajime Nakamura Shunsuke Yamada Outline of Research In our laboratory, we have been
Applied Thermal and Fluid Engineering Energy Engineering (Thermal Engineering Laboratory) Professor Assoc. Professor Hajime Nakamura Shunsuke Yamada Outline of Research In our laboratory, we have been
Experimental and numerical investigation of 2D sloshing with slamming
 Experimental numerical investigation of 2D sloshing with slamming A. Colagrossi C. Lugni M. Greco O. M. Faltinsen a.colagrossi@insean.it c.lugni@insean.it m.greco@insean.it oddfal@marin.ntnu.no INSEAN,