Numerical Study on Cohesive Zone Elements for Static and Time Dependent Damage. and its Application in Pipeline Failure Analysis. Vishal Chandrasekhar
|
|
|
- Hubert Boyd
- 5 years ago
- Views:
Transcription
1 Numerial Study on Cohesive Zone Elements for Stati and Time Dependent Damage and its Appliation in Pipeline Failure Analysis by Vishal Chandrasekhar A Thesis Presented in Partial Fulfillment of the Requirements for the Degree Master of Siene Approved July 2016 by the Graduate Supervisory Committee: Yongming Liu, Chair Hanqing Jiang Jay Oswald ARIZONA STATE UNIVERSITY August 2016
2 ABSTRACT Cohesive zone model is one of the most widely used model for frature analysis, but still remains open ended field for researh. The earlier works using the ohesive zone model and Extended finite element analysis (XFEM) have been briefly introdued followed by an elaborate eluidation of the same onepts. Cohesive zone model in onjugation with XFEM is used for analysis in stati ondition in order to hek its appliability in failure analysis. A real time setup of pipeline failure due to impingement is analyzed along with a detailed parametri study to understand the influene of the prominent design variable. After verifying its good appliability, a reep model is built for analysis where the ohesive zone model with XFEM is used for a time dependent reep loading. The hallenge in this simulation was to ahieve oupled behavior of raks initiation and propagation along with reep loading. By using Design of Experiment, the results from numerial simulation were used to build an equation for life predition for reep loading ondition. The work was further extended to aount for fatigue damage aumulation for high yle fatigue loading in ohesive elements. A model was oneived to aount for damage due to fatigue loading along within ohesive zone model for ohesive elements in ABAQUS simulation software. The model was verified by omparing numerial modelling of Double antilever beam under high yle fatigue loading and experiment results from literature. The model was also applied to a major industrial problem of blistering in Cured-In-Plane liner pipelines and a demonstration of its failure is shown. In onlusion, various models built on ohesive zone to address stati and time dependent loading with real time senarios and future sope of work in this field is disussed. i
3 DEDICATION To one who loves me with all her heart, mom To one who sarified a lot to make me what I am, dad To one who guides and advises me in life, brother To one who teahes and imparts knowledge, teahers ii
4 ACKNOWLEDGMENTS I would like to thank my faulty advisor Dr. Liu Yongming, for his ontinuous support in my researh work and valuable suggestions whenever I needed them. I would also like to thank my ommittee members, Dr. Jay Oswald and Dr. Hanqing Jiang for their valuable omments. I aknowledge the help from Sahil Jain, M.S student and Tishun Peng, PhD student at Arizona State University for introduing me to my researh field. The work is sponsored by federal DOT PHMSA through their C Competitive Aademi Agreement Program (CAAP) (DTPH5614HCAP04L and DTPH56-13-H-CAAP04; program manager James Merritt). The finanial support is greatly appreiated. iii
5 TABLE OF CONTENTS LIST OF TABLES... vii LIST OF FIGURES... viii 1. INTRODUCTION NUMERICAL SIMULATION USING COHESIVE ZONE MODEL FOR POLYMER MATERIAL General Cohesive zone model Extended Finite Element Analysis (XFEM) Numerial simulation of Surfae Cohesive Zone Model for stati loading Modeling Tehnique Material Model Loading and boundary ondition Simulation results for stati analysis Parametri Study on Stati analysis Internal Diameter Pipe Thikness Cavity Radius Time dependent Creep Loading iv
6 2.5 Numerial study of ohesive zone model on reep loading Model for Numerial analyses of reep loading Modelling Tehnique Material model Loading and boundary ondition Numerial Simulation result for Creep Analysis Design of Experiment for Creep Analysis NUMERICAL STUDY ON USING COHESIVE ZONE MODEL FOR COMPOSITE MATERIAL Model for fatigue damage aumulation using ohesive zone model Modeling for high yle fatigue damage in Double Cantilever Beam model Modelling Tehnique Material Model Loading and Boundary ondition Numerial simulation results Appliation of High yle fatigue model for pipeline system Bakground of the problem Numerial simulation and results Material Model v
7 Loading and boundary ondition Simulation results for analysis SUMMARY REFERENCES APPENDIX A FORTRAN CODE FOR FATIGUE DAMAGE ACCUMULATION vi
8 LIST OF TABLES Table Page 1. Properties of Material PA Parametri Study - Internal Diameter Parametri Study Pipe Thikness Parametri Study Cavity Radius Creep Properties of Material PA Sampling Interval for Eah Random Variable The 20 DoE Samples Generated using LHS Properties of DCB Simulation Properties of Various Material in Model vii
9 LIST OF FIGURES Figures Page 1. Tration Separation Response Curve Shemati Diagram Showing Mixed Mode Tration Separation Response Phantom Nodes Creation and Crak Propagation Modelling of Pipeline Struture Boundary Condition and Loading Crak Propagation Von Mises Stress Plots Pi vs. Deformation (Internal Diameter) P vs. Internal Diameter Pi vs. Deformation (Pipe Thikness) P vs. Pipe Thikness Pi vs. Deformation (Cavity Radius) P vs. Cavity Radius Shemati Illustration of Creep Behavior Shemati Illustration of Strain Reovery Load vs Time Plot for Simulation Model Pipe Setion for Numerial Simulation for Creep Loading Mesh for Pipe Setion for Numerial Simulation for Creep Loading Loading Region and Boundary Condition for Creep Analysis viii
10 Figures Page 20. Crak Propagation a) Initial Loading b) t=10.09 ) t=21.98 d) t= Crak Propagation a) Initial Loading b) t=10.09 ) t=21.98 d) t= Projetion of 20 Samples on 2D plane Crak Growth Curves for 8 DoEs Comparison Between True and Predited Crak Length Crak Length Variation for the Perturbation of eah Design Variable Speimen Geometry Shemati Diagram of Loading in Fatigue Cyle Crak Propagation at Different Time Period for DCB Speimen (from t=1 to 11) Rate of Crak Growth per Cyle for DCB Speimen Plot of Crak Growth vs Number of Cyles for DCB Speimen Pipe and Liner Material with Pressurized Void Model for Cured-in-Plane Pipeline System Boundary Condition and Loading Stages of Crak Propagation with respet to Time Period ix
11 1. INTRODUCTION One of the most imperative models for the analysis of frature and damage of strutural materials is the ohesive zone model. There has been numerous work in ohesive zone model due to good agreement with experimental results for various numerial studies. The main advantage of the ohesive zone model is that it an avoid the singularity during the numerial simulation of disontinuities and an inlude both rak initiation and propagation in a single framework. This work onsists of two parts. The first part is using ohesive zone model (CZM) in onjugation with Extended Finite Element Method (XFEM) for a stati load ase to study pipeline raking due to rok impingement, this is followed by a reep analysis using the same CZM with XFEM to predit the life to failure of pipe struture. The seond part onsists of inorporating a model aounting for fatigue damage due to high yle loading in ohesive zone model. Then, the model was used to simulate Double Cantilever beam to verify its agreement with experimental results from the literature. The modified ohesive zone model to aount for fatigue damage was applied to a real time problem in the multilayered pipeline. Cohesive zone models have been used extensively in past deade in numerial simulations. Pablo [1] used ohesive model for shell elements to model rak propagation in thin walled strutures wherein he showed simple 3D plate rak propagation and studied the variation due to shell and solid elements in analysis. Park et al. [2] explained the tration separation based ohesive zone model and the different relationship with respet to frature surfae. An XFEM based approah has been used for a long time by many researhers to obtain 1
12 information on rak propagation of the materials under study. Ebrahimi et al [3] used an XFEM to study rak analysis in omposite media and determined the mixed mode stress intensity fator based on interative integral approah to determine J integrals whih were in good agreement to values of other models. Many models have been developed using XFEM due to their advantages in handling disontinuity and raks, further they do not require remeshing like other FEM analysis. Yazdani et al [4] gave modelling and analysis of delamination in omposite laminates by ombining the lower-order plate theory and the novel XFEM tehnique, and this model is able to aurately alulate the delamination onset and the propagation with less omputational effort. In Chapter 2, XFEM + CZM is used as an analysis methodology for stati analysis to understand the working of the methodology and also to show how well the onjugation works on real time pipe system problems. This is followed by a time-dependent loading analysis where, maximum load is maintained for a partiular time period similar to reep loading and the rak propagation in pipeline is studied. A detailed Design of Experiment (DoE) is onduted to obtain the model along with the rak growth vs time plot for the model. Bouvard et al [5] studied the fatigue and reep-fatigue rak growth in single rystal super alloys using ohesive zone model by traditional yli loading method to predit the rak growth. Kyungmok Kim [6] has worked on Creep rupture model of aluminum alloys using Cohesive zone approah to analyze the long-term reep using a time jump strategy in ohesive zone law. Pouria Hajikarimi [7] et al used extended finite element method for 2
13 two dimensional reep analysis of a linear visoelasti medium using a 4-node retangular element and also studied the effet of enrihment funtion on the analysis. In hapter 3, a model to address the fatigue damage due to high yle loading is developed without atual loading and unloading. An envelope is developed to aount the effet of high yle loading instead of atual yli loading. This is then inorporated in Cohesive element in Abaqus using UEL and then verified by using DCB model. The results give a good math with existing values from literature. Then this model is used for analysis of a imperative problem in piping system and results are shown. Yangjian Xu [8] et al had worked on damage aumulations in mixed-mode fatigue rak growth using yli ohesive zone model along with XFEM, where a yli load was applied and results were obtained. This work though, is a similar approah to that of Hallett et al [9] who developed a model for fatigue degradation using ohesive zone model using an enveloped model instead of onventional yli model. 3
14 2. NUMERICAL SIMULATION USING COHESIVE ZONE MODEL FOR POLYMER MATERIAL 2.1 General Cohesive zone model The ohesive zone modeling (CZM) is one of the most widely used frature phenomenon based on the separation of surfaes involved in raking. It is defined by ohesive trations that exists in between material surfaes whih is resisted by rak propagation. The main advantage of this method is that it has no stress singularity at rak tip. Unlike onventional methods, size of non-linear zone around rak tip does not have to be negligible and further it an also predit behavior of un-raked strutures. The ohesive zone model has different governing equations but the most predominant one is tration-separation response model. This is a bilinear urve between the tration fore and separation. This urve has two main parts; a damage initiation riterion and a damage evolution law. The initial response is assumed to be linear till damage initiation. However, one a damage initiation riterion is met, damage an our aording to a user-defined damage evolution law. Figure 1: Tration separation response urve 4
15 Damage initiation is the first linear part of the bilinear urve whih is governed by maximum strength of the material, beyond whih the degradation of the ohesive response begins. The proess of degradation starts one the ontat stresses and/or ontat separations is beyond the damage initiation riterion. The damage initiation riterion an be set in terms of maximum strain and stress of the material. Eah damage initiation riterion also has an output variable whih indiates the riterion status, if the value is beyond 1 it means the damage initiation riterion has started. Damage initiation riteria not assoiated with evolution law an still be used to evaluate the propensity of the material to undergo damage without atually modeling the damage proess (i.e., without atually speifying damage evolution). The four ways to set the damage initiation riterion are listed as Eq (1) to (4): maximum stress, maximum separation, quadrati stress and quadrati separation. Damage is assumed to initiate when the maximum ontat stress ratio reahes a value of one. max { t n t n o, t s t s o, t t t t o} = 1 (1) max { δ n δ n o, δ s δ s o, δ t δ t o} = 1 (2) { t n t n 0} 2 + { t s t s 0} 2 + { t 2 t t t 0} = 1 (3) { δ n δ n 0} 2 + { δ s δ s 0} 2 + { δ 2 t δ t 0} = 1 (4) 5
16 o where t n, t o o s and t t represent the maximum ontat stress when the separation is either purely normal to the interfae or purely in the first or the seond shear diretion respetively. Likewise, δ o o n, δ s and δ o s represent the maximum ontat separation, when the separation is either purely along the ontat normal or purely in the first or the seond shear diretion respetively. The next part of tration separation is damage evolution law, whih desribes the rate at whih the ohesive stiffness is degraded one the orresponding initiation riterion is reahed. The general framework for desribing the evolution of damage takes plae in two stages: softening of the yield stress and degradation of the elastiity. A salar damage variable D, represents the overall damage at the ontat point. It initially has a value of 0. If damage evolution is modeled, D monotonially evolves from 0 to 1 upon further loading after the initiation of damage. The ontat stress omponents are affeted by the damage aording to Eq (5) to (8) t n = { (1 D)t n if t n 0 t n otherwise (5) t s = (1 D)t s (6) t s = (1 D)t s (7) There are mainly two omponents to define damage evolution: the first omponent is either speifying the effetive separation at omplete failure δ f relative to the effetive separation at the initiation of damage δ o ; or the frature energy dissipated due to failure G. The 6
17 seond omponent to the definition of damage evolution is the speifiation of the nature of the evolution of the damage variable D, between initiation of damage and final failure. This an be defined by linear or exponential softening laws or speifying D diretly as a tabular funtion of the effetive separation relative to the effetive separation at damage initiation. The Figure 2 shows the shemati representation of the dependene of damage initiation and evolution on the mode mix for a tration-separation response with isotropi shear behavior. The figure shows the tration on the X axis and the magnitudes of the normal and the shear separations along the two Y axes. The unshaded triangles in the two vertial oordinate planes represent the response under pure normal and pure shear separation, respetively. All intermediate vertial planes (that ontain the vertial axis) represent the damage response under mixed-mode onditions with different mode mixes. The dependene of the damage evolution data on the mode mix an be defined either in tabular form or, in the ase of an energy-based definition, analytially. 7
18 Figure 2[24]: Shemati Diagram showing mixed mode tration separation response The ohesive zone model an be implemented by either using ohesive elements or ohesive surfaes. Though they follow the same bilinear urve there are some differenes. The ohesive surfaes use the material properties as interation properties where initial stiffness is ontated automatially. In ohesive element, the ohesive zone model is defined as material property along with speial ohesive element definition. The initial stiffness has to be defined as a material property and is easier to manipulate aording to requirement. 8
19 2.2 Extended Finite Element Analysis (XFEM) The Finite Element Method (FEM) has been used for deades to analyze and solve imperative problems. There are number of instanes where the usual FEM methodology have ertain restritions in effiiently solving some problems involving interior boundaries, disontinuities or singularities, beause of the need of remeshing and high mesh densities. The Extended Finite Element Analysis (XFEM) is a latest development in the field of Finite Element Analysis in whih a speial enrihed funtion is introdued in order to effetively model disontinuities, suh as raks, without onforming the mesh to the disontinued geometry. Only solid (ontinuum) elements an be assoiated with the enrihed feature. XFEM is a methodology where loal elements are partition of unity in order to aount for the disontinuity. u h (x) = ni S φ 1 (x)u 1 + n J S Ψ φ J (x) Ψ(x)a J (8) The Extended Finite Element Analysis (XFEM) is defined by Eq (8) of whih the first part is from FEM and seond part is Enrihment funtion. XFEM extends the pieewise polynomial funtion spae of onventional finite element methods with extra funtions. The enrihment funtion an be divided into two parts, Heaviside enrihment term that aounts for jump disontinuity and rak tip enrihment funtion whih handles the rak tip. The Eq (9) shows the enrihment funtion divided into Heaviside enrihment and rak tip enrihment. u h (x) = ni S φ 1 (x)u 1 + I N Γ φ 1 (x)h(x) a I + α I N Λ φ 1 (x)f α (x)b I (9) 9
20 H(x) = { 1, if (x x ) n 0 1, otherwise (10) [F α (x), α = 1 4] = [ r sin θ 2, r os θ 2, r sin θ sin θ 2, r sin θ os θ 2 ] (11) In Eq (10) whih represents the Heaviside enrihment funtion, x is an integration point, x* is the losest point to x on the rak fae and n is the unit normal at x* and Eq (11) represents the rak tip enrihment funtion where (r, θ) denote oordinate values from a polar oordinate system loated at the rak tip. The rak tip and Heaviside enrihment funtions are multiplied by the onventional shape funtions thus the enrihment is loally assoiated around the rak. The rak loation is defined by using level set method, where two funtion φ and Ψ are used to ompletely desribe the rak. The funtion φ represents the rak fae and interation of φ and Ψ funtion denotes the rak front. These funtions are defined by nodal values whose spatial variation is determined by using finite element shape funtions. The funtion s values are speified only at nodes belonging to elements being ut by rak. When the rak propagates through the element it raks the element nodes and reates phantom nodes on both the divided elements. The disontinuous element with Heaviside enrihment is treated as a superposition of two ontinuous elements with phantom nodes. The Figure 3 below shows the reation of phantom nodes for a lear representation. 10
21 Figure 3: Phantom nodes reation and rak propagation In Classial finite element method (FEM) adaptive meshing an be used for rak analysis, but it is very time onsuming for large system analysis. Sine objetive is to develop an effiient and aurate failure analysis and predition, XFEM in onjugation with Cohesive zone model is used. In FEM there are many methods to simulate rak propagation but due to high auray requirement and ease of omputation we hoose XFEM over FEM. The main reason to use XFEM + CZM is that the use of CZM will enable preditions under omplex loading onditions and for different failure modes. XFEM allows non-mathing mesh with respet to the rak and allows the arbitrary traking of the CZM within the simulation domain. 11
22 2.3 Numerial simulation of Surfae Cohesive Zone Model for stati loading The numerial simulation to study ohesive zone model has been done using ABAQUS software as it gave the freedom to use both XFEM and CZM tehnique. The most important parameters to define the model in ABAQUS are pipe dimensions, material model, loading and boundary ondition. In the following setion, modeling tehnique used for pipeline model, material model used for XFEM + CZM, loading and boundary ondition to simulate a real time problem has been elaborated in detail Modeling Tehnique In this part, the numerial modeling was done using ABAQUS for a pipe model with lose to real time dimensions. As XFEM + CZM simulation takes longer to analyze a full model analysis leading to an inreased omputation ost and time, only a quarter of the model is modelled along with the region of interest like the pipe impingement. The results for a quarter model will be same as full sale model but the modeling uses lesser number of elements along with appropriate boundary onditions. The model was meshed using various ontrol parameters suh as imprinting faes, edge biasing, edge divisions et. to ahieve good quality elements in the desired region. Tet elements were used as model had a urved surfae. The meshing is done more near the region of interest so as to get a more aurate result. After meshing, material model was assigned whih is desribed in the next setion. The modeling is done in two stages were the pipe is first modelled with a 12


23 dimension of outer diameter of 120 mm and inner diameter of 100 mm and an impingement of 20 mm sphere whih is divided into half along YZ axis and XZ axis respetively. - = Figure 4: Modelling of pipeline struture The irular setion in Figure 4 represents the pipeline and the half sphere represents the impingement and are reated as separate parts and then assembled to form the model Material Model The material model has three main parts: property, element type and setion assignment. The setion assignment of eah part is solid setion and the element type is 3D stress element. The material used is PA11 and the values are obtained from literature [10]. The properties assoiated with the model is listed below in the table Table 1: Properties of material PA11 S.No Property of Material Value 1 Modulus of Elastiity 1700 MPa 2 Poisson s Ratio Utimate Tensile Strength 68.9 MPa 13


24 4 Yield Tensile Strength 44 MPa 5 Max. Prinipal Stress value for CZM 62 MPa 6 Frature Energy for CZM 620 KJ/m Loading and boundary ondition The loading and boundary ondition are imperative part to any analysis, they are key to an aurate analysis. The boundary onditions are set suh that they are lose to real time appliations so as to narrow the differene between the atual ourrene and simulation result. There are some universal rules for giving boundary onditions. BCs an only be applied in diretions that the element has DoF s. Every DoF must be restrained in at least one plae in the model. There must be at least one applied load to get a solution. The internal pressure of the pipeline was maintained as 30 MPa and load due to rok impingement was 15 MPa. The figure below shows the boundary ondition given to the model. Figure 5: Boundary ondition given to model 14


25 2.3.4 Simulation results for stati analysis The simulation results an be viewed in two perspetives: rak propagation whih an be obtained by Status of XFEM that shows visual of rak growth along with the indiation of elements failure, Von - mises stress whih gives an idea about the maximum stress along the region of interest. This is an analysis for visualization of the failure giving us the ultimate load that the material an bear before failure. Figure 7 and 8 shows stages of rak propagation and von - mises stress respetively. 15

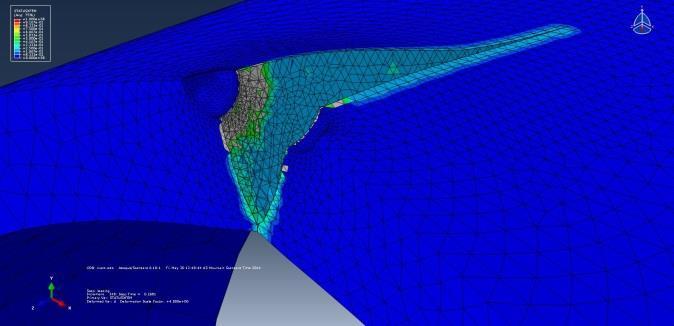


26 Figure 6: Crak Propagation Figure 7: Von mises Stress Plots 16
27 2.3.5 Parametri Study on Stati analysis The stati analysis gives us an idea about all the parameters of the analysis and for the next time dependent analysis it is important to determine the important parameters so as to lose the differene between atual value and analysis values. Thus a detailed parametri studies is arried out by onsidering three major parameters: Internal Diameter, Pipe Thikness, Cavity (impingement diameter). These parameters were varied individually while keeping others onstant to understand the impat of that partiular parameter under analysis. This tehnique is alled bloking. It is suggested that only trends of the graphs should be observed and not the values sine the values hosen for material model were taken from literature available and not from any material manufaturer. All the graphs are plotted for Pi and P where Pi indiates the pressure at whih the rak first appears in the model. P stands for ritial pressure at whih rak grows throughout the thikness. Deformation mentioned in the graphs is the deformation at a point on the inner surfae of the pipe indiating the amount by whih pipe has expanded Internal Diameter The internal diameter was varied over a range to understand its impat on the rak initiation and propagation. Attahed below is the data ompiled from the simulations. 17
28 Table 2: Parametri study - Internal Diameter Parameter Internal Diam. Graph1 Graph2 P1 U1 P2 Para value Figure 8: Pi vs. Deformation (Internal Dia.) Figure 9: P vs. Internal Diameter 18
29 Both Pi and P derease with parameter value indiating a negative effet of the parameter on the rak. Higher the value of internal diameter, higher is the risk of rak initiation and propagation Pipe Thikness Pipe thikness was varied keeping internal diameter and loading onstant. Attahed below is the data ompiled from the simulations. Table 3: Parametri study Pipe Thikness Parameter Thikness Graph1 Graph2 P1 U1 P2 Para value Figure 10: Pi vs. Deformation (Pipe thikness) 19


30 Figure 11: P vs. Pipe Thikness From the graphs it an be observed that pipe thikness has a positive impat on rak. Thiker the pipe, higher will be the value of Pi and P Cavity Radius Cavity radius was varied keeping internal and outer diameter and loading onstant. Attahed below is the data ompiled from the simulations. Table 4: Parametri study Cavity Radius 20
31 Figure 12: Pi vs. Deformation (Cavity Radius) Figure 13: P vs. Cavity Radius It an be observed from the graphs that avity radius has a negative impat on the rak. The arrow marked in figure represents the diretion of graph where data for first value of the parameter is represented by top right orner. The graph flows from top right orner to bottom left orner. Higher the value of avity radius, higher will be the risk of rak. 21
32 2.4 Time dependent Creep Loading Mehanial properties of polymers vary enormously with time and temperature. The time dependene ompliates measurement of these properties sine speifi onditions under whih experiments are arried out must neessarily be inorporated into the definition of appropriate parameters. Thus, the terms reep, stress relaxation and dynami mehanial measurements are all ommon in this field [11]. The mehanial properties of a polymeri omponent are dominated by its visoelastiity. This is refleted by the time-dependeny of the mehanial response of a omponent during loading. Hene, a polymer behaves differently if subjeted to short term or long term loads [12]. A brief review for the fundamental reep mehanis is briefly mentioned below. A polymer, at a speifi temperature and moleular weight, may behave as a liquid or a solid, depending on the speed (time sale) at whih its moleules deform. This behavior, whih ranges between liquid and solid, is generally referred to as the visoelasti behavior or material response. Polymers are visoelasti materials and exhibit time-dependent relaxations when subjeted to stress or strain. While reep is a measure of inrease in strain with time under a onstant stress, stress relaxation is the redution of stress with time under a onstant strain. Therefore, reep and stress relaxation tests measure the dimensional stability of a polymer over time. Suh tests are of great importane for investigated materials, partiularly if a polymer must be in servie under stress and strain for long periods [13]. The model for simulation is limited to linear visoelastiity, whih is valid for polymer systems undergoing small or slow deformations. Non-linear visoelastiity is 22
33 required when modeling large rapid deformations, suh as those enountered in flowing polymer melts. In linear visoelastiity, the stress relaxation test is often used, along with the time temperature superposition priniple and the Boltzmann superposition priniple, to explain the behavior of polymeri materials during deformation [12]. When a plasti material is subjeted to a onstant load, it deforms ontinuously. The initial strain is roughly predited by its stress-strain modulus. The material will ontinue to deform slowly with time indefinitely or until rupture or yielding auses failure. The primary region is the early stage of loading when the reep rate dereases rapidly with time. Then it reahes a steady state whih is alled the seondary reep stage followed by a rapid inrease (tertiary stage) and frature. Figure 14[11]: Shemati illustration of reep behavior If the applied load is released before the reep rupture ours, an immediate elasti reovery equal to the elasti deformation, followed by a period of slow reovery is observed whih is shown in Figure 15. The material in most ases does not reover to the 23
![original shape and a permanent deformation remains. The magnitude of the permanent deformation depends on length of time, amount of stress applied, and temperature [14].](/docs-images/93/113963176/images/34-1.jpg "Figure 15[14]: Shemati illustration of strain reovery In this numerial study, the same methodology of XFEM and ohesive zone whih has been used for previous analysis is used along with ertain")
34 original shape and a permanent deformation remains. The magnitude of the permanent deformation depends on length of time, amount of stress applied, and temperature [14]. Figure 15[14]: Shemati illustration of strain reovery In this numerial study, the same methodology of XFEM and ohesive zone whih has been used for previous analysis is used along with ertain modifiations to the loading to get the time-dependent reep loading. For this the time period of the analysis was inreased to a partiular value say 10 whih represents atual time period. The load is then applied suh that the entire load is ramped up for the first time period and then maintained at this time period for rest of the omplete time period. Figure 16 shows a representation of the time period vs load for a learer illustration. 24
35 Figure 16: Load vs time plot for simulation model 2.5 Numerial study of ohesive zone model on reep loading Model for Numerial analyses of reep loading In the previous setion, stati frature of Poly-Amide 11 was done and the fous was on the failure strength predition with existing impingement in representative pipe struture. Also, thorough parametri studies were arried out on the design variables to understand it pivotal role in failure of pipelines. The design variables were varied one at a time while keeping others onstant. This helped in sreening the effet of eah variable on the response. The pressure at whih rak initiates in the pipe was seleted to be the response variable. The failure mode was simulated using XFEM method and Cohesive Zone Model. Moving forward a methodology is defined on how to simulate Slow Crak Growth under reep behavior with given loading onditions. This investigation fouses on the time dependent failure of pipeline strutures. As done earlier in all simulations, XFEM and ohesive zone model was also used. The hallenge in this simulation was to ahieve 25
36 oupled behavior of raks initiation and propagation along with reep loading. This methodology is explained below and later the simulation result for pipe model is desribed. The stress relaxation and the reep test are well-known long-term tests. The stress relaxation test is diffiult to perform and is, therefore, often approximated by data aquired through the more ommonly used reep test. The stress relaxation of a polymer is often onsidered the inverse of reep. The reep test, whih an be performed either in shear, ompression or tension, measures the flow of a polymer omponent under a onstant load. It is a ommon test that measures the strain ε, as a funtion of stress, time and temperature. Standard reep tests suh as DIN and ASTM D2990 an be used. Creep tests are performed at a onstant temperature, using a range of applied stress. On plotting reep data in a log-log graph, in the majority of the ases, the reep urves redue to straight lines. Hene, the reep behavior of most polymers an be approximated with a power law where strain over time is based on stress σ and time t and reep onstant k(t) whih depends on Temperature (T) [12,14]: ε (t ) = k(t) σ m t n (12) In this methodology, Creep properties are used for analysis where the Creep onstant k(t) is given for a partiular temperature and the loading is given for a partiular time period. The full magnitude is applied within the first time period and then maintained for rest of time period in analysis. 26

37 2.5.2 Modelling Tehnique The above disussion only serves as a general bakground for the simulation. The values used in numerial simulation are from literature. The full pipe model is developed but the properties of XFEM + CZM is applied to region of interest around the impingement region so as to save omputational time and ost. The model is meshed by using Tet element due to urved shape of pipeline and are onentrated at the region of impingement so as to study the initiation and propagation of rak. After meshing the material model is applied with properties from literature for PA11 inluding reep properties whih are listed in material model. Unlike the previous model, there is no ut due to impingement as the simulation is time-dependent and the load applied has to be for a long time period. Hene the region of impingement is taken as irular region of interest. The modeling is a pipe setion with dimension of outer diameter of 120 mm and inner diameter of 100 mm and a irular setion of diameter 20 mm on the top surfae represents the area of impat of impingement, where maximum load is going to our. A region of interest is reated by segmenting the pipe setion around the impingement irle by dividing 10 mm on both side of irle with XZ datum plane. The Figure 17 shows the modelled setion used for numerial simulation for reep analysis. Figure 17: Pipe setion for numerial simulation for reep loading 27


38 Figure 18: Mesh for pipe setion for numerial simulation for reep loading Material model The material model for this reep analysis onsist of both Cohesive zone properties and also reep properties from literature. The setion used is solid setion with 3D stress element for the analysis. The properties for the material PA11 are listed below in a Table 5 Table 5: Creep properties of material PA11 S.No Property of Material Value 1 Modulus of Elastiity 1700 MPa 2 Poisson s Ratio Utimate Tensile Strength 68.9 MPa 28

39 4 Yield Tensile Strength 44 MPa 5 Max. Prinipal Stress value for CZM 62 MPa 6 Frature Energy for CZM 620 KJ/m2 7 Creep Power Law Multiplier 2.45E-7 MPa-n time-1 8 Creep Stress exponent, m Time order 0 10 Dimensionless time period Creep tolerane Loading and boundary ondition The boundary ondition is similar to the previous analysis as the basi priniple of analysis remains the same. The loading for this reep analysis is different, as explained earlier the load is applied over a time period. The full load is applied within the first time period and then it is maintained at this load for rest of time period. The internal pressure of the pipeline was maintained as 30 MPa and load due to rok impingement was 15 MPa The region of loading and boundary onditions are shown Figure 19. Figure 19: Loading region and Boundary Condition for reep analysis 29
40 2.5.5 Numerial Simulation result for Creep Analysis The simulation is similar to that of previous analysis exept an additional reep fator is added. In this model, a Viso step is added to do the reep analysis along with the rak domain definition, rak initiation riterion and rak evolution riterion. The important fator of reep analysis is time period. The time period hosen is 70, for whih the analysis takes plae. The analysis uses initial and minimal time inrement as and maximum time inrement as 1. The tolerane for maximum differene in reep strain inrement has been set as 1e-5 In stress based model, the alulation is done to onvert the time period obtained from analysis to atual time period. In general, the time period is multiplied with 365 days and 24 hours as the reep onstant is in terms of year time unit. The value is then multiplied by a onstant (multiplying fator) to get the appropriate time in atual time frame. But by modifying the reep onstant it is possible to get diret real-time value from simulation. In the strain based model, the time period for the simulation an be onverted to real-time time by multiplying by same methodology. The onstant for reep analysis has been modified suh that it gives the real time life of the pipe model. A nominal value of reep onstant is to be hosen if it is very small time then the rak propagation is very quik and rapid, thus rak growth annot be studied in detail whereas if it is very high small rak propagation is very slow, this takes a lot of omputational time. 30


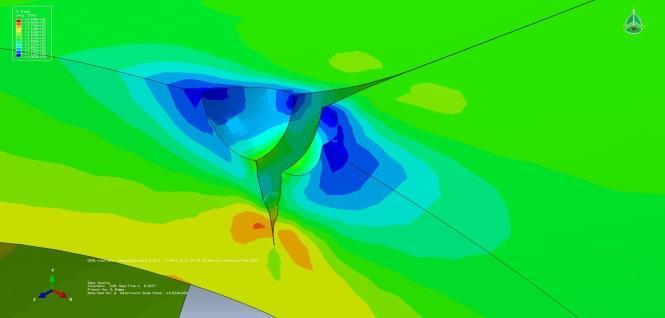
41 The stress based simulation results are shown in Figure 20. It shows the rak through thikness of the pipe due to reep loading. Sine a onstant pressure is applied by a rok impingement the reep rak grows as time period inreases. The rak simulation shows the initiation of rak within the material and tends to travel along the thikness first and then travels in axial diretion. Figure 20: Crak propagation a) initial loading b) t=10.09 ) t=21.98 d) t= The strain based simulation results are shown in Figure 21. This simulation is strain based whih is representative of the sudden rupture in pipeline due to sharp rok impingement with high loading. This senario tries to model the hole that we see as effet of sudden rok impingement fore. 31


42 Figure 21: Crak propagation a) initial loading b) t=10.09 ) t=21.98 d) t= Design of Experiment for Creep Analysis Design of experiments are widely used for generating samples that an uniformly over the whole domain of the explanatory variables [15,16]. In order to aurately apture the system harateristis, a full fatorial approah is neessary to investigate all possible ombinations. However, it is infeasible to do the full fatorial design for high dimensional problems. Latin hyperube design is onsidered as an optimal method for high dimensional experimental design, beause every variable an be represented identially no matter how many samples are seleted [17]. In this study, five variables are hosen to investigate the system response based on the numerial investigation. Latin hyperube sampling is employed to generate multiple ombinations (i.e. DoE) of design variables. The orresponding system response of eah DoE an be omputed using the developed finite element model. With these samples, a surrogate model that an apture this system 32
43 behavior is developed, whih makes it possible for probabilisti analysis with respet to eah design variable using Bayesian updating. The Latin hyperube sampling (LHS) is very flexible to be used to reate any number of design of experiments. A lot of work has been done on the optimization of Latin hyperube from both optimization algorithm and objetive riteria [18,19,20,21]. An experiment design with N point in D dimension is given as X = [x 1, x 2, x N ] T, in whih eah olumn represents a random variable and eah row x i represents a realization. A Latin hyperube design is performed in suh a way that eah dimension is divided into N equally probable intervals and there is only one sample within eah interval. In this study, a riterion with maximizing the minimum distane is implemented to generate Latin hyperube samples. Five random variables are hosen and the orresponding sampling interval for eah variable is listed in Table 6. Random variable Table 6: Sampling interval for eah random variable Creep onstant (Mpa/Time) Frature Energy (MJ/mm 2 ) n Prinipal stress (Mpa) Load (Mpa) Mean Sampling [1.15,3.25] 10 3 [0.590, 0.650] [4.5,8.5] [46,56] [15,35] interval Using Latin hyperube sampling method, 20 design of experiments are generated whih are listed in Table 7. The projetion of these samples on 2D plane is shown in Figure
44 Crak length(mm) Prinipal stress(map) Load(Mpa) Frature energy(mj/mm 2 ) n Creep onstant(map/s) x Frature energy(mj/mm 2 ) n Prinipal stress(mpa) Figure 22: Projetion of 20 samples on eah 2D plane For eah DoE, the system response suh as rak length vs. time urve an be generated using the FEM model developed above. During simulation, some ases may rash beause of impratial variable ombination is input into the FEM model. By ignoring them, rak growth urves for 8 DoEs are plotted in Figure DOE1 DOE2 DOE3 DOE4 DOE8 DOE12 DOE Time (Years) Figure 23: Crak growth urves for 8 DoEs 34
45 S.No Creep Constant A (e-3) Table 7: The 20 DoE samples generated using LHS Frature Energy (e-3) Stress Order n Prinipal Stress Constant Load Coneptually, the developed surrogate model should be a time dependent model that has design variables as input parameters. However, it is not that straight forward to get this model in one step. The idea in this study is to fit the rak length with respet to time relationship using power law, and then the effet of design variables is inorporated in the model oeffiients using other regression methods. Bearing this idea in mind, the proposed surrogate model is expressed as 35
46 Predied rak length(mm) a = f 1 (P)t f 2 (P) + f 3 (P) (13) where t is the reep time and f 1 (P) = α 0 + α i p i, f 2 (P) = β 0 + β i p i, f 3 (P) = γ 0 + γ i p i, in whih p i represents the design variables. After fitting this model, the true and predited rak length vs. time data are illustrated in Figure 24. In order to investigate the model sensitivity with respet to eah design variable, the rak length variation due to 10% perturbation of eah design variable at reep time t = 10 years is shown in figure Simulated rak length(mm) DOE1 DOE2 DOE3 DOE4 Figure 24: Comparison between true and predited rak length 36
47 Da Creep onstant Frature energy n Design variables Prinipal stress Load Figure 25: Crak length variation for the perturbation of eah design variable As seen in Figure 24, the proposed model an generally apture the rak growth trend for different DoE samples, but there are relatively large unertainties embedded in the predition. Based on this model, it an be onluded that the rak growth is more sensitive to the parameters that ontrol the rak initiation and material reep behavior, whih is given as the frature energy and n in Figure
48 3. NUMERICAL STUDY ON USING COHESIVE ZONE MODEL FOR COMPOSITE MATERIAL This setion proposes a model that an be used for high yle fatigue loading for omposite material analysis using ohesive zone model. In literature, most of the work on the fatigue damage aumulation for high yle fatigue follows a yli model whih onsumes more omputation time and is theoretially more omplex. Hene in this work, an attempt has been made to reate a model whih an be applied with Abaqus simulation software to address the high yle fatigue damage using ohesive zone elements. 3.1 Model for fatigue damage aumulation using ohesive zone model The various models developed in the past have been very suessful in addressing low yle fatigue but there are a very few models for high yle fatigue loading. There are mainly two methods to aount for yli loading: loading and unloading pattern and degrading stiffness on a yle by yle basis whih is mainly used for low yle fatigue appliation where there is signifiant hysteresis, the other method is developing an envelope strategy, where maximum load remains onstant (like reep loading) for a partiular time period and interfae elements are degraded on disrete number of yles after eah time step. The seond strategy is the basis for this methodology whih has two main requirements: extration of strain energy release rate from elements within ohesive zone; enabling the interfae elements within the ohesive elements to be degraded suh that rate of rak advane mathes with that given by the Paris law from the orresponding strain energy release rate. The envelope strategy has been adopted for high yle fatigue damage aumulation predition in Cohesive zone model using ABAQUS simulation 38
49 software. The ohesive zone model has been explained earlier and the stress degradation ours depending on Damage parameter, D as shown in the equation below σ = σ max (1 D) (14) In order to aount for the fatigue damage this damage parameter D is divided into two parts, one for stati ds and other for fatigue damage df where the damage due to stati is defined in abaqus by default as d s = δ δ e δ f δ e (15) In this model the fator df is alulated and added to damage due to stati to form a total damage aumulation Dtot, whih modifies the strength degradation law as follows σ = σ max (1 D tot ) (16) D tot = d s + d f (17) The main user inputs required for this analysis is Number of yles N and R-ratio whih is a ratio of minimum load to maximum load (Pmin/Pmax). The main assumptions for the model are it is a onstant amplitude loading and tension-tension fatigue loading. Thus the maximum strain energy release rate in eah fatigue yle Gmax an be onverted to hange in strain energy release rate G by using the equation below G = (1 R 2 )G max (18) In our model the maximum strain energy release rate an be obtained from the ohesive elements from the tration-separation response diretly adjaent to numerial rak tip 39
50 In order to alulate the mixed mode rak growth rate the Paris law that equates rak growth rate and stress intensity fator is used a N = C( K)m (19) By using modified Blano s model whih is a modified version of Paris law we an write the equation as a N = C( G)m (20) Where G is hange in strain energy rate and C and m are material onstants whih an be determined from the equations below, where CI,CII,Cm and mi,mii,mm are mode I, mode II and mixed mode onstants. log C = log C I + ( G II G T ) log C m + ( G II G T ) 2 log C II C m C I (21) m = m I + ( G II G T ) m m + (m II m I m m ) ( G II G T ) 2 (22) GT, GI and GII are the total, mode I and mode II strain energy rates whih are obtained from the tration displaement response of ohesive elements. The fatigue damage degrades aording to the strain energy release rate extrated from the tration separation law. The total rate of fatigue damage aumulation is dependent on the rak growth a and interfae element rak length Le. The relationship an be written as N 40
51 a N = L e N f (23) But our requirement for the propagation of rak is damage aumulated due to fatigue in eah yle d f N fatigue damage as following whih an be derived on the basis of failure of the element due to stati and d f N = (1 d s) N f (24) d f N = (1 d s) L e ( a N ) (25) Thus, the damage due to fatigue is updated every time period and this an be expressed by using the equation (26) where N is hange in number of yle in that partiular time period d f,t+ t = d f,t + N ( d f N ) (26) 41
52 3.2 Modeling for high yle fatigue damage in Double Cantilever Beam model The model to aount for fatigue damage aumulation is used to analyze the delamination in omposite based Double Cantilever Beam in order to verify its auray with experimental data available in Literature Modelling Tehnique The Double Cantilever Beam model has been used for mode I fatigue testing for a very long time and gives most aurate values whih is used for verifying the model proposed for high yle fatigue damage aumulation in numerial simulation. In this model two beams of length 120 mm and breath of 20 mm are attahed to eah other with a ohesive element layer. The ohesive elements in between the layers serve as the interfae elements in our fatigue damage model. The ohesive layer serves as the adhesive layer (epoxy/polyamide) in ase of a omposite layup and hene this numerial simulation an be viewed as delamination of omposite material. The speimen used for analysis is shown below. Figure 26: Speimen Geometry 42
53 The model is built for 8-node retangular ohesive 3D element and the modifiation of damage riterion is inorporated in UEL whih has to be used along with the ABAQUS input file Material Model The materials used in this analysis are divided into two ategories: Laminate properties and interfae properties. There are two element types used - shell element for the laminate properties and ohesive element for interfae properties. Similarly, the setion assignment for laminate element is omposite shell and for interfae element it is ohesive setion. The properties for both elements are listed below in Table 8 Table 8: Properties of DCB simulation S.No Property of Material Value Laminate Properties 1 E MPa 2 E22 = E MPa 3 G12=G MPa 4 G MPa 5 ν12 = ν ν Interfae Properties 7 GIC 0.26 N/mm 8 GIIC N/mm 9 σimax 30 MPa 10 σiimax 60 MPa 11 KI 10 5 N/mm 3 12 KII 10 5 N/mm 3 13 R N 1000 yles Blano s Paris law model onstants 15 CI 2.1 (mm/yle) (N/mm) -m 16 CII 0.12 (mm/yle) (N/mm) -m 43
54 17 Cm (mm/yle) (N/mm) -m 18 mi mii mm Loading and Boundary ondition The loading for this model is an extension of reep model where the load was maintained onstant after reahing the maximum load, thus during this time period the fatigue law is ativated in this region, during whih the damage due to fatigue df term is alulated and strength degradation ours. The loading for the high yle fatigue damage is shown below in Figure 27. Figure 27: Shemati diagram of loading in fatigue yle The boundary ondition for DCB model is fixing one end of the Cantilever beam and reating a pre-rak of 35 mm on the other side, and the appliation of load is on width of the beam on the side of pre-rak. 44


55 3.2.4 Numerial simulation results The simulation for Double Cantilever Beam requires two inputs along with the model that has been prepared, the input file in ABAQUS and UEL file whih has modified COH3D8 element for aounting the fatigue damage aumulation. The rak propagation at different time period whih atually indiates number of yle under high yle fatigue is shown in Figure 28 below 45


56 Figure 28: Crak propagation at different time period for DCB speimen (from t=1 to 11) 46
57 da/dn It learly indiates that the rak growth is rapid during the last time period whih indiates high number of yles, in order to visualize this effet two plots of a vs GI/GIC whih has maximum stress values of 30 MPa and 60 MPa is shown below in Figure 29. N 1.00E-03 da/dn vs GI/GI 1.00E E E E-07 GI/GIC 60 MPa 30 MPa Experimental values Figure 29: Rate of rak growth per yle for DCB speimen Also, the rak growth versus number of yles plot has been shown below in Figure 30 to indiate the rak growth in high yle fatigue damage 47
58 A vs N Mpa 60Mpa Figure 30: Plot of rak growth vs number of yles for DCB speimen 48
59 3.3 Appliation of High yle fatigue model for pipeline system Bakground of the problem The model for fatigue damage aumulation is used for real-time appliation in Cured-IN pipe struture [22]. There are speial types of pipelines used for transport of high pressure natural gas alled the Cured-In-Plane Liner pipelines, whih has a liner material and a metalli pipeline layer. In general, the inner material is omposite and outer material is metal. In these pipelines the pressure of natural gas is very high and when they are depressurized for maintenane or emergeny repair, there is a void formed between the liner material and the pipe as shown in Figure 31. Figure 31[22]: Pipe and liner material with pressurized void One the void is formed, the variation in the pressure in the pipeline is going to indue a yli loading whih reates a fatigue damage in the piping system. Thus the high yle 49

60 fatigue damage model an be applied to this piping system to study the effet of fatigue damage on the Cured-In-plane Liner pipeline Numerial simulation and results The numerial simulation for Cured-In-plane pipeline system has been done using ABAQUS with the fatigue model developed for high yle fatigue damage. The simulation model prepared onsists of three layers: outer layer whih is metalli pipe, inner layer whih is liner material and a ohesive element layer in between to address the fatigue damage due to high yle loading. In this model, only a quarter of pipe model is developed as the region where pressurized void is formed is the region under study. The reason for a quarter model is that it uses lesser number of elements and hene the omputation time and ost would redue. The modeling is done in two stages were the pipe is first modelled with a dimension of outer diameter of 120 mm and inner diameter of 100 and then the model is ut in between to reate ohesive layer with a thikness of 5 mm. The model reated is shown below in Figure 32. Figure 32: Model for Cured-In-Plane pipeline system 50
61 Material Model The material model onsists of three setion: metalli part, ohesive setion and liner material. The orresponding setion assignment for eah part is solid setion, ohesive setion and shell omposite. The properties assoiated with the model is listed below in the table Table 9: Properties of various material in model S.No Property of Material Value Metal properties 1 Young s Modulus Poisson s Ratio 0.4 Laminate Properties 3 E MPa 4 E22 = E MPa 5 G12=G MPa 6 G MPa 7 ν12 = ν ν Interfae Properties 9 GIC 0.26 N/mm 10 GIIC N/mm 11 σimax 30 MPa 12 σiimax 60 MPa 13 KI 10 5 N/mm 3 14 KII 10 5 N/mm 3 15 R N 1000 yles Blano s Paris law model onstants 17 CI 2.1 (mm/yle) (N/mm) -m 18 CII 0.12 (mm/yle) (N/mm) -m 19 Cm (mm/yle) (N/mm) -m 20 mi mii mm

62 Loading and boundary ondition The loading is given at the ohesive layer between the liner material and the pipeline in order to study the fatigue damage due to void reation. The edges of the model have a fixed boundary onditions in order to have a stability in analysis. The internal pressure of the pipeline was maintained as 100 MPa and load at the layer was 50 MPa. The figure below shows the boundary ondition and loading given to the model. Figure 33: Boundary ondition and Loading Simulation results for analysis The simulation results show the void formation due to fatigue and its enlargement and inrement in void pressure over time due to yle loading. The fatigue damage is restrited to the layer beause only ohesive element has fatigue damage aumulation term. Figure 34 final stage of rak propagation with respet to time period. 52


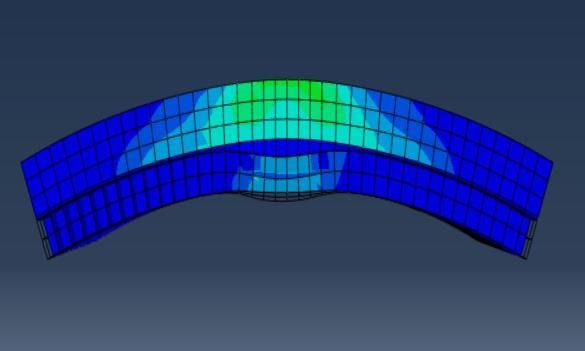

63 53


64 Figure 34: Final Stage of rak propagation with respet to time period 54
Finite Element Modeling of Fracture Failure in Composite Materials
 International Researh Journal of Applied and Basi Sienes 2015 Available online at www.irjabs.om ISSN 2251-838X / Vol, 9 (10): 1711-1717 Siene Explorer Publiations Finite Element Modeling of Frature Failure
LOAD-RATIO DEPENDENCE ON FATIGUE LIFE OF COMPOSITES
 LOAD-RATIO DEPENDENCE ON FATIGUE LIFE OF COMPOSITES Joakim Shön 1 and Anders F. Blom 1, 1 Strutures Department, The Aeronautial Researh Institute of Sweden Box 1101, SE-161 11 Bromma, Sweden Department
Structural Integrity of Composite Laminates with Embedded Microsensors
 Strutural Integrity of Composite Laminates with Embedded Mirosensors Yi Huang, Sia Nemat-Nasser Department of Mehanial and Aerospae Engineering, Center of Exellene for Advaned Materials, University of
STUDY OF INTERFACIAL BEHAVIOR OF CNT/POLYMER COMPOSITE BY CFE METHOD
 THE 19TH INTERNATIONAL CONFERENCE ON COMPOSITE MATERIALS STUDY OF INTERFACIAL BEHAVIOR OF CNT/POLYMER COMPOSITE BY CFE METHOD Q. S. Yang*, X. Liu, L. D. Su Department of Engineering Mehanis, Beijing University
MODE I FATIGUE DELAMINATION GROWTH ONSET IN FIBRE REINFORCED COMPOSITES: EXPERIMENTAL AND NUMERICAL ANALYSIS
 21 st International Conferene on Composite Materials Xi an, 20-25 th August 2017 MODE I FATIUE DELAMINATION ROWTH ONSET IN FIBRE REINFORCED COMPOSITES: EXPERIMENTAL AND NUMERICAL ANALYSIS Man Zhu 1,3,
Failure Assessment Diagram Analysis of Creep Crack Initiation in 316H Stainless Steel
 Failure Assessment Diagram Analysis of Creep Crak Initiation in 316H Stainless Steel C. M. Davies *, N. P. O Dowd, D. W. Dean, K. M. Nikbin, R. A. Ainsworth Department of Mehanial Engineering, Imperial
Millennium Relativity Acceleration Composition. The Relativistic Relationship between Acceleration and Uniform Motion
 Millennium Relativity Aeleration Composition he Relativisti Relationship between Aeleration and niform Motion Copyright 003 Joseph A. Rybzyk Abstrat he relativisti priniples developed throughout the six
WRAP-AROUND GUSSET PLATES
 WRAP-AROUND GUSSET PLATES Where a horizontal brae is loated at a beam-to-olumn intersetion, the gusset plate must be ut out around the olumn as shown in Figure. These are alled wrap-around gusset plates.
Three-dimensional Meso-scopic Analyses of Mortar and Concrete Model by Rigid Body Spring Model
 Three-dimensional Meso-sopi Analyses of Mortar and Conrete Model by Rigid Body Spring Model K. Nagai, Y. Sato & T. Ueda Hokkaido University, Sapporo, Hokkaido, JAPAN ABSTRACT: Conrete is a heterogeneity
Stress triaxiality to evaluate the effective distance in the volumetric approach in fracture mechanics
 IOSR Journal of ehanial and Civil Engineering (IOSR-JCE) e-issn: 78-1684,p-ISSN: 30-334X, Volume 11, Issue 6 Ver. IV (Nov- De. 014), PP 1-6 Stress triaxiality to evaluate the effetive distane in the volumetri
Development of a user element in ABAQUS for modelling of cohesive laws in composite structures
 Downloaded from orbit.dtu.dk on: Jan 19, 2019 Development of a user element in ABAQUS for modelling of ohesive laws in omposite strutures Feih, Stefanie Publiation date: 2006 Doument Version Publisher's
Influence of transverse cracks on the onset of delamination: application to L-angle specimens. F. Laurin*, A. Mavel, P. Nuñez, E.
 Influene of transverse raks on the onset of delamination: appliation to L-angle speimens F. Laurin*, A. Mavel, P. Nuñez, E. Auguste Composite strutures subjeted to 3D loading Wings Strutures under 3D loadings
University of Bristol - Explore Bristol Research
 Chen, J., Ravey, E., Hallett, S. R., Wisnom, M. R., & Grassi, M. (2009). Predition of delamination in braided omposite T-piee speimens. Composites Siene and Tehnology, 69(14), 2363-2367. 10.1016/j.ompsiteh.2009.01.027
Chapter 2 Linear Elastic Fracture Mechanics
 Chapter 2 Linear Elasti Frature Mehanis 2.1 Introdution Beginning with the fabriation of stone-age axes, instint and experiene about the strength of various materials (as well as appearane, ost, availability
Simplified Buckling Analysis of Skeletal Structures
 Simplified Bukling Analysis of Skeletal Strutures B.A. Izzuddin 1 ABSRAC A simplified approah is proposed for bukling analysis of skeletal strutures, whih employs a rotational spring analogy for the formulation
A simple expression for radial distribution functions of pure fluids and mixtures
 A simple expression for radial distribution funtions of pure fluids and mixtures Enrio Matteoli a) Istituto di Chimia Quantistia ed Energetia Moleolare, CNR, Via Risorgimento, 35, 56126 Pisa, Italy G.
Experimental Investigation and FE Analysis of Fiber Woven Layered Composites under Dynamic Loading
 2th International LS-DYNA Users Conferene Constitutive Modeling(2) xperimental Investigation and F Analysis of Fiber Woven Layered Composites under Dynami Loading Pavel A. Mossakovsky, Fedor K. Antonov,
Uniaxial Concrete Material Behavior
 COMPUTERS AND STRUCTURES, INC., JULY 215 TECHNICAL NOTE MODIFIED DARWIN-PECKNOLD 2-D REINFORCED CONCRETE MATERIAL MODEL Overview This tehnial note desribes the Modified Darwin-Peknold reinfored onrete
The coefficients a and b are expressed in terms of three other parameters. b = exp
 T73S04 Session 34: elaxation & Elasti Follow-Up Last Update: 5/4/2015 elates to Knowledge & Skills items 1.22, 1.28, 1.29, 1.30, 1.31 Evaluation of relaxation: integration of forward reep and limitations
Wave Propagation through Random Media
 Chapter 3. Wave Propagation through Random Media 3. Charateristis of Wave Behavior Sound propagation through random media is the entral part of this investigation. This hapter presents a frame of referene
ADHESION MEASURES OF ELASTO-PLASTIC THIN FILM VIA BUCKLE-DRIVEN DELAMINATION
 ADHESION MEASURES OF ELASTO-PLASTIC THIN FILM VIA BUCKLE-DRIVEN DELAMINATION Yu Shouwen and Li Qunyang Department of Engineering Mehanis, Tsinghua University, Beijing 184, China Yusw@mail.tsinghua.edu.n
FORCE DISTRIBUTION OF REINFORCED CONCRETE COUPLING BEAMS WITH DIAGONAL REINFORCEMENT
 FORCE DISTRIBUTION OF REINFORCED CONCRETE COULING BEAMS WITH DIAGONAL REINFORCEMENT Yenny Nurhasanah Jurusan Teknik Sipil, Fakultas Teknik, Universitas Muhammadiyah Surakarta Jl. A. Yani Tromol os 1 abelan
MODELLING THE POSTPEAK STRESS DISPLACEMENT RELATIONSHIP OF CONCRETE IN UNIAXIAL COMPRESSION
 VIII International Conferene on Frature Mehanis of Conrete and Conrete Strutures FraMCoS-8 J.G.M. Van Mier, G. Ruiz, C. Andrade, R.C. Yu and X.X. Zhang Eds) MODELLING THE POSTPEAK STRESS DISPLACEMENT RELATIONSHIP
FIBER/MATRIX DEBONDING CRITERIONS IN SIC/TI COMPOSITE. NUMERICAL AND EXPERIMENTAL ANALYSIS
 FIBER/MATRIX DEBONDING CRITERIONS IN SIC/TI COMPOSITE. NUMERICAL AND EXPERIMENTAL ANALYSIS A. Thionnet 1, J. Renard 1 1 Eole Nationale Supérieure des Mines de Paris - Centre des Matériaux P. M. Fourt BP
Fig Review of Granta-gravel
 0 Conlusion 0. Sope We have introdued the new ritial state onept among older onepts of lassial soil mehanis, but it would be wrong to leave any impression at the end of this book that the new onept merely
Evaluation of effect of blade internal modes on sensitivity of Advanced LIGO
 Evaluation of effet of blade internal modes on sensitivity of Advaned LIGO T0074-00-R Norna A Robertson 5 th Otober 00. Introdution The urrent model used to estimate the isolation ahieved by the quadruple
Mode II brittle fracture: recent developments
 A. Campagnolo et alii, Frattura ed Integrità Strutturale, 4 (017) 181-188; DOI: 10.31/IGF-ESIS.4.19 Mode II brittle frature: reent developments A. Campagnolo Department of Industrial Engineering, University
ES 247 Fracture Mechanics Zhigang Suo
 ES 47 Frature Mehanis Zhigang Suo The Griffith Paper Readings. A.A. Griffith, The phenomena of rupture and flow in solids. Philosophial Transations of the Royal Soiety of London, Series A, Volume 1 (191)
4 Puck s action plane fracture criteria
 4 Puk s ation plane frature riteria 4. Fiber frature riteria Fiber frature is primarily aused by a stressing σ whih ats parallel to the fibers. For (σ, σ, τ )-ombinations the use of a simple maximum stress
RC DEEP BEAMS ANALYSIS CONSIDERING LOCALIZATION IN COMPRESSION
 RC DEEP BEAMS ANAYSIS CONSIDERING OCAIZATION IN COMPRESSION Manakan ERTSAMATTIYAKU* 1, Torsak ERTSRISAKURAT* 1, Tomohiro MIKI* 1 and Junihiro NIWA* ABSTRACT: It has been found that RC deep beams usually
IMPACT MODELLING OF THE COEFFICIENT OF RESTITUTION OF POTATOES BASED ON THE KELVIN- VOIGHT PAIR
 Bulletin of the Transilvania University of Braşov Series II: Forestry Wood Industry Agriultural Food Engineering Vol. 9 (58) No. - 06 IMPACT MODELLING OF THE COEFFICIENT OF RESTITUTION OF POTATOES BASED
Torsion. Torsion is a moment that twists/deforms a member about its longitudinal axis
 Mehanis of Solids I Torsion Torsional loads on Cirular Shafts Torsion is a moment that twists/deforms a member about its longitudinal axis 1 Shearing Stresses due to Torque o Net of the internal shearing
General Equilibrium. What happens to cause a reaction to come to equilibrium?
 General Equilibrium Chemial Equilibrium Most hemial reations that are enountered are reversible. In other words, they go fairly easily in either the forward or reverse diretions. The thing to remember
TORSION By Prof. Ahmed Amer
 ORSION By Prof. Ahmed Amer orque wisting moments or torques are fores ating through distane so as to promote rotation. Example Using a wrenh to tighten a nut in a bolt. If the bolt, wrenh and fore are
Shear-Friction Strength of RC Walls with 550 MPa Bars
 Proeedings of the Tenth Paifi Conferene on Earthquake Engineering Building an Earthquake-Resilient Paifi 6-8 November 215, Sydney, Australia Shear-Frition Strength of RC Walls with 55 MPa Bars Jang-woon
DIGITAL DISTANCE RELAYING SCHEME FOR PARALLEL TRANSMISSION LINES DURING INTER-CIRCUIT FAULTS
 CHAPTER 4 DIGITAL DISTANCE RELAYING SCHEME FOR PARALLEL TRANSMISSION LINES DURING INTER-CIRCUIT FAULTS 4.1 INTRODUCTION Around the world, environmental and ost onsiousness are foring utilities to install
Where as discussed previously we interpret solutions to this partial differential equation in the weak sense: b
 Consider the pure initial value problem for a homogeneous system of onservation laws with no soure terms in one spae dimension: Where as disussed previously we interpret solutions to this partial differential
International Journal of Advanced Engineering Research and Studies E-ISSN
 Researh Paper FINIE ELEMEN ANALYSIS OF A CRACKED CANILEVER BEAM Mihir Kumar Sutar Address for Correspondene Researh Sholar, Department of Mehanial & Industrial Engineering Indian Institute of ehnology
INTERNATIONAL JOURNAL OF CIVIL AND STRUCTURAL ENGINEERING Volume 2, No 4, 2012
 INTERNATIONAL JOURNAL OF CIVIL AND STRUCTURAL ENGINEERING Volume, No 4, 01 Copyright 010 All rights reserved Integrated Publishing servies Researh artile ISSN 0976 4399 Strutural Modelling of Stability
Crack Detection of Pipe Using Static Deflection Measurement Method
 International Journal of Engineering Researh & Tehnology (IJERT) ISSN: 78-08 Vol. 3 Issue, January - 04 Crak Detetion of Pipe Using Stati Defletion easurement ethod Jatin. Patel #, Prof. itesh J. ungla
Identification of Ductile Damage Parameters for Austenitic Steel
 Identifiation of utile amage Parameters for Austeniti Steel J. zugan, M. Spaniel, P. Konopík, J. Ruzika, J. Kuzelka Abstrat The modeling of inelasti behavior of asti materials requires measurements providing
THE EFFECT OF CONSOLIDATION RATIOS ON DYNAMIC SHEAR MODULUS OF SOIL
 Otober 12-17, 28, Beijing, China THE EFFECT OF CONSOLIDATION RATIOS ON DYNAMIC SHEAR MODULUS OF SOIL J. Sun 1 and X.M. Yuan 2 1 Assoiate Professor, Institute of Civil Engineering, Heilongjiang University,
Machining. Introduction
 Mahining Introdution Mahining aims to generate the shape of the workpiee from a solid body, or to improve the toleranes and surfae finish of a previously formed workpiee, by removing exess material in
A NETWORK SIMPLEX ALGORITHM FOR THE MINIMUM COST-BENEFIT NETWORK FLOW PROBLEM
 NETWORK SIMPLEX LGORITHM FOR THE MINIMUM COST-BENEFIT NETWORK FLOW PROBLEM Cen Çalışan, Utah Valley University, 800 W. University Parway, Orem, UT 84058, 801-863-6487, en.alisan@uvu.edu BSTRCT The minimum
Singular Event Detection
 Singular Event Detetion Rafael S. Garía Eletrial Engineering University of Puerto Rio at Mayagüez Rafael.Garia@ee.uprm.edu Faulty Mentor: S. Shankar Sastry Researh Supervisor: Jonathan Sprinkle Graduate
Wavetech, LLC. Ultrafast Pulses and GVD. John O Hara Created: Dec. 6, 2013
 Ultrafast Pulses and GVD John O Hara Created: De. 6, 3 Introdution This doument overs the basi onepts of group veloity dispersion (GVD) and ultrafast pulse propagation in an optial fiber. Neessarily, it
UDC DAMAGE DIAGNOSTICS IN A VERTICAL BAR ON THE ELASTIC SUSPENDER WITH CONCENTRATED MASS
 1 UDC 534113 DAAGE DIAGNOSTICS IN A VERTICAL BAR ON THE ELASTIC SUSPENDER WITH CONCENTRATED ASS A Ilgamov, BZ Sultanov, AN Tazhitdinov, AG Khakimov Institute of ehanis, Ufa Branh RAS, Ufa, Russia Using
Diagonal Tensile Failure Mechanism of Reinforced Concrete Beams
 Journal of Advaned Conrete Tehnology Vol., No. 3, 37-34, Otober 4 / Copyright 4 Japan Conrete Institute 37 Diagonal Tensile Failure Mehanism of Reinfored Conrete Beams Yasuhiko Sato, Toshiya Tadokoro and
Slenderness Effects for Concrete Columns in Sway Frame - Moment Magnification Method
 Slenderness Effets for Conrete Columns in Sway Frame - Moment Magnifiation Method Slender Conrete Column Design in Sway Frame Buildings Evaluate slenderness effet for olumns in a sway frame multistory
A NORMALIZED EQUATION OF AXIALLY LOADED PILES IN ELASTO-PLASTIC SOIL
 Journal of Geongineering, Vol. Yi-Chuan 4, No. 1, Chou pp. 1-7, and April Yun-Mei 009 Hsiung: A Normalized quation of Axially Loaded Piles in lasto-plasti Soil 1 A NORMALIZD QUATION OF AXIALLY LOADD PILS
A Time-Dependent Model For Predicting The Response Of A Horizontally Loaded Pile Embedded In A Layered Transversely Isotropic Saturated Soil
 IOSR Journal of Mehanial and Civil Engineering (IOSR-JMCE) e-issn: 2278-1684,p-ISSN: 232-334X, Volume 16, Issue 2 Ser. I (Mar. - Apr. 219), PP 48-53 www.iosrjournals.org A Time-Dependent Model For Prediting
A Mechanism-Based Approach for Predicting Ductile Fracture of Metallic Alloys
 The University of Akron IdeaExhange@UAkron Mehanial Engineering Faulty Researh Mehanial Engineering Department 6-13 A Mehanism-Based Approah for Prediting Dutile Frature of Metalli Alloys Xiaosheng Gao
Determination of the reaction order
 5/7/07 A quote of the wee (or amel of the wee): Apply yourself. Get all the eduation you an, but then... do something. Don't just stand there, mae it happen. Lee Iaoa Physial Chemistry GTM/5 reation order
Cavity flow with surface tension past a flat plate
 Proeedings of the 7 th International Symposium on Cavitation CAV9 Paper No. ## August 7-, 9, Ann Arbor, Mihigan, USA Cavity flow with surfae tension past a flat plate Yuriy Savhenko Institute of Hydromehanis
Advanced Computational Fluid Dynamics AA215A Lecture 4
 Advaned Computational Fluid Dynamis AA5A Leture 4 Antony Jameson Winter Quarter,, Stanford, CA Abstrat Leture 4 overs analysis of the equations of gas dynamis Contents Analysis of the equations of gas
COMBINED PROBE FOR MACH NUMBER, TEMPERATURE AND INCIDENCE INDICATION
 4 TH INTERNATIONAL CONGRESS OF THE AERONAUTICAL SCIENCES COMBINED PROBE FOR MACH NUMBER, TEMPERATURE AND INCIDENCE INDICATION Jiri Nozika*, Josef Adame*, Daniel Hanus** *Department of Fluid Dynamis and
THE EQUATION CONSIDERING CONCRETE STRENGTH AND STIRRUPS FOR DIAGONAL COMPRESSIVE CAPACITY OF RC BEAM
 - Tehnial Paper - THE EQUATION CONSIDERING CONCRETE STRENGTH AND STIRRUPS FOR DIAGONAL COMPRESSIE CAPACITY OF RC BEAM Patarapol TANTIPIDOK *, Koji MATSUMOTO *, Ken WATANABE *3 and Junihiro NIWA *4 ABSTRACT
23.1 Tuning controllers, in the large view Quoting from Section 16.7:
 Lesson 23. Tuning a real ontroller - modeling, proess identifiation, fine tuning 23.0 Context We have learned to view proesses as dynami systems, taking are to identify their input, intermediate, and output
3 Tidal systems modelling: ASMITA model
 3 Tidal systems modelling: ASMITA model 3.1 Introdution For many pratial appliations, simulation and predition of oastal behaviour (morphologial development of shorefae, beahes and dunes) at a ertain level
Subject: Introduction to Component Matching and Off-Design Operation % % ( (1) R T % (
 R T % (") 16.50 Leture 0 Subjet: Introdution to Component Mathing and Off-Design Operation At this point it is well to reflet on whih of the many parameters we have introdued (like M, τ, τ t, ϑ t, f, et.) are free
16.50 Leture 0 Subjet: Introdution to Component Mathing and Off-Design Operation At this point it is well to reflet on whih of the many parameters we have introdued (like M, τ, τ t, ϑ t, f, et.) are free
Part G-4: Sample Exams
 Part G-4: Sample Exams 1 Cairo University M.S.: Eletronis Cooling Faulty of Engineering Final Exam (Sample 1) Mehanial Power Engineering Dept. Time allowed 2 Hours Solve as muh as you an. 1. A heat sink
IN-PLANE VIBRATIONS OF CURVED BEAMS WITH VARIABLE CROSS-SECTIONS CARRYING ADDITIONAL MASS
 11 th International Conferene on Vibration Problems Z. Dimitrovová et al. (eds.) Lisbon, Portugal, 9-1 September 013 IN-PLANE VIBRATIONS OF CURVED BEAMS WITH VARIABLE CROSS-SECTIONS CARRYING ADDITIONAL
Wood Design. = theoretical allowed buckling stress
 Wood Design Notation: a = name for width dimension A = name for area A req d-adj = area required at allowable stress when shear is adjusted to inlude self weight b = width of a retangle = name for height
Remark 4.1 Unlike Lyapunov theorems, LaSalle s theorem does not require the function V ( x ) to be positive definite.
 to be positive definite.") Leture Remark 4.1 Unlike Lyapunov theorems, LaSalle s theorem does not require the funtion V ( x ) to be positive definite. ost often, our interest will be to show that x( t) as t. For that we will need
Leture Remark 4.1 Unlike Lyapunov theorems, LaSalle s theorem does not require the funtion V ( x ) to be positive definite. ost often, our interest will be to show that x( t) as t. For that we will need
UTC. Engineering 329. Proportional Controller Design. Speed System. John Beverly. Green Team. John Beverly Keith Skiles John Barker.
 UTC Engineering 329 Proportional Controller Design for Speed System By John Beverly Green Team John Beverly Keith Skiles John Barker 24 Mar 2006 Introdution This experiment is intended test the variable
Comparison of solution to FE. note: the distance from flange edge is x in these plots while it was y in the derivation!!!
 Comparison of solution to FE note: the distane from flange edge is in these plots while it was y in the derivation!!! Comparison of solution to FE Comparison of solution to FE?? More elaborate solutions
Developing Excel Macros for Solving Heat Diffusion Problems
 Session 50 Developing Exel Maros for Solving Heat Diffusion Problems N. N. Sarker and M. A. Ketkar Department of Engineering Tehnology Prairie View A&M University Prairie View, TX 77446 Abstrat This paper
DETERMINATION OF MATERIAL PARAMETERS OF A TEXTILE REINFORCED COMPOSITE USING AN INVERSE METHOD
 DETERMINATION OF MATERIAL PARAMETERS OF A TEXTILE REINFORCED COMPOSITE USING AN INVERSE METHOD J. Blom, H. Cuypers, P. Van Itterbeek and J. Wastiels VUB in Brussels -Faulty of Engineering, Department of
A multiscale description of failure in granular materials
 A multisale desription of failure in granular materials Nejib Hadda, François Niot, Lu Sibille, Farhang Radjai, Antoinette Tordesillas et al. Citation: AIP Conf. Pro. 154, 585 (013); doi: 10.1063/1.4811999
Modeling of Threading Dislocation Density Reduction in Heteroepitaxial Layers
 A. E. Romanov et al.: Threading Disloation Density Redution in Layers (II) 33 phys. stat. sol. (b) 99, 33 (997) Subjet lassifiation: 6.72.C; 68.55.Ln; S5.; S5.2; S7.; S7.2 Modeling of Threading Disloation
Beams on Elastic Foundation
 Professor Terje Haukaas University of British Columbia, Vanouver www.inrisk.ub.a Beams on Elasti Foundation Beams on elasti foundation, suh as that in Figure 1, appear in building foundations, floating
Drift Capacity of Lightly Reinforced Concrete Columns
 Australian Earthquake Engineering Soiety Conferene, Perth, Western Australia Drift Capaity of ightly Reinfored Conrete Columns A Wibowo, J Wilson, NTK am, EF Gad,, M Fardipour, K Rodsin, P ukkunaprasit
Compression Members Local Buckling and Section Classification
 Compression Memers Loal Bukling and Setion Classifiation Summary: Strutural setions may e onsidered as an assemly of individual plate elements. Plate elements may e internal (e.g. the wes of open eams
BEAMS: SHEARING STRESS
 LECTURE Third Edition BEAMS: SHEARNG STRESS A. J. Clark Shool of Engineering Department of Civil and Environmental Engineering 14 Chapter 6.1 6.4 b Dr. brahim A. Assakkaf SPRNG 200 ENES 220 Mehanis of
IRRECOVERABLE AND RECOVERABLE NONLINEAR VISCOELASTIC PROPERTIES OF ASPHALT CONCRETE
 IRRECOVERABLE AND RECOVERABLE NONLINEAR VISCOELASTIC PROPERTIES OF ASPHALT CONCRETE James S. Lai, University of Utah; and Douglas Anderson, Utah State Department of Highways The results are reported of
NON-LINEAR BENDING CHARACTERISTICS OF PHC PILES UNDER VARYING AXIAL LOAD
 13 th World Conferene on Earthquake Engineering Vanouver, B.C., Canada August 1-6, 24 aper No. 356 NON-LINEAR BENDING CHARACTERISTICS OF HC ILES UNDER VARYING AXIAL LOAD Toshihiko ASO 1 Fusanori MIURA
Fracture analysis of a functionally graded interfacial zone between two dissimilar homogeneous materials
 540 Siene in China Series G: Physis, Mehanis & Astronomy 006 Vol.49 No.5 540 55 DOI: 0.007/s433-006-004-0 Frature analysis of a funtionally graded interfaial zone between two dissimilar homogeneous materials
Slenderness Effects for Concrete Columns in Sway Frame - Moment Magnification Method
 Slenderness Effets for Conrete Columns in Sway Frame - Moment Magnifiation Method Slender Conrete Column Design in Sway Frame Buildings Evaluate slenderness effet for olumns in a sway frame multistory
QCLAS Sensor for Purity Monitoring in Medical Gas Supply Lines
 DOI.56/sensoren6/P3. QLAS Sensor for Purity Monitoring in Medial Gas Supply Lines Henrik Zimmermann, Mathias Wiese, Alessandro Ragnoni neoplas ontrol GmbH, Walther-Rathenau-Str. 49a, 7489 Greifswald, Germany
Theoretical and Experimental Research on the Yoke of the Axial Piston Pumps
 Theoretial and Experimental Researh on the Yoke of the Axial Piston Pumps Vasiliu Niolae, P.E., Ph.D., Professor University "Politehnia" of Buharest, Fluid Power Department Rosu Cristian Adrian, M.E.,
Four-dimensional equation of motion for viscous compressible substance with regard to the acceleration field, pressure field and dissipation field
 Four-dimensional equation of motion for visous ompressible substane with regard to the aeleration field, pressure field and dissipation field Sergey G. Fedosin PO box 6488, Sviazeva str. -79, Perm, Russia
NUMERICAL SIMULATION OF ATOMIZATION WITH ADAPTIVE JET REFINEMENT
 Paper ID ILASS8--7 ILASS 28 Sep. 8-, 28, Como Lake, Italy A44 NUMERICAL SIMULATION OF ATOMIZATION WITH ADAPTIVE JET REFINEMENT Anne Bagué, Daniel Fuster, Stéphane Popinet + & Stéphane Zaleski Université
SIMULATION OF BEHAVIOR OF REINFORCED CONCRETE COLUMNS SUBJECTED TO CYCLIC LATERAL LOADS
 SIMULATION OF BEHAVIOR OF REINFORCED CONCRETE COLUMNS SUBJECTED TO CYCLIC LATERAL LOADS H. Sezen 1, M.S. Lodhi 2, E. Setzler 3, and T. Chowdhury 4 1,2 Department of Civil and Environmental Engineering
Elastic anisotropy effect on indentation-induced thin film interfacial delamination
 Available online at www.sienediret.om Engineering Frature Mehanis 75 (008) 311 3130 www.elsevier.om/loate/engframeh Elasti anisotropy effet on indentation-indued thin film interfaial delamination B. Yang
City, University of London Institutional Repository
 City Researh Online City, University of London Institutional Repository Citation: Labib, M., Moslehy, Y. & Ayoub, A. (07). Softening Coeffiient of Reinfored Conrete Elements Subjeted to Three-Dimensional
Analysis of discretization in the direct simulation Monte Carlo
 PHYSICS OF FLUIDS VOLUME 1, UMBER 1 OCTOBER Analysis of disretization in the diret simulation Monte Carlo iolas G. Hadjionstantinou a) Department of Mehanial Engineering, Massahusetts Institute of Tehnology,
EFFECTS OF COUPLE STRESSES ON PURE SQUEEZE EHL MOTION OF CIRCULAR CONTACTS
 -Tehnial Note- EFFECTS OF COUPLE STRESSES ON PURE SQUEEZE EHL MOTION OF CIRCULAR CONTACTS H.-M. Chu * W.-L. Li ** Department of Mehanial Engineering Yung-Ta Institute of Tehnology & Commere Ping-Tung,
Analysis of Leakage Paths Induced by Longitudinal Differential Settlement of the Shield-driven Tunneling
 2016 rd International Conferene on Engineering Tehnology and Appliation (ICETA 2016) ISBN: 978-1-60595-8-0 Analysis of Leakage Paths Indued by Longitudinal Differential Settlement of the Shield-driven
FINITE ELEMENT ANALYSES OF SLOPES IN SOIL
 Contrat Report S-68-6 FINITE ELEMENT ANALYSES OF SLOPES IN SOIL A Report of an Investigation by Peter Dunlop, J. M. Dunan and H. Bolton Seed Sponsored by OFFICE, CHIEF OF ENGINEERS U. S. ARMY Conduted
GUIDED WAVE ENERGY DISTRIBUTION ANALYSIS IN INHOMOGENEOUS PLATES
 GUDED WAVE ENERGY DSTRBUTON ANALYSS N NHOMOGENEOUS PLATES Krishnan Balasubramaniam and Yuyin Ji Department of Aerospae Engineering and Mehanis Mississippi State University, Mississippi State, MS 39762
Optimization of Statistical Decisions for Age Replacement Problems via a New Pivotal Quantity Averaging Approach
 Amerian Journal of heoretial and Applied tatistis 6; 5(-): -8 Published online January 7, 6 (http://www.sienepublishinggroup.om/j/ajtas) doi:.648/j.ajtas.s.65.4 IN: 36-8999 (Print); IN: 36-96 (Online)
Improvements in the Modeling of the Self-ignition of Tetrafluoroethylene
 Exerpt from the Proeedings of the OMSOL onferene 010 Paris Improvements in the Modeling of the Self-ignition of Tetrafluoroethylene M. Bekmann-Kluge 1 *,. errero 1, V. Shröder 1, A. Aikalin and J. Steinbah
The gravitational phenomena without the curved spacetime
 The gravitational phenomena without the urved spaetime Mirosław J. Kubiak Abstrat: In this paper was presented a desription of the gravitational phenomena in the new medium, different than the urved spaetime,
Evaluation of a Dual-Load Nondestructive Testing System To Better Discriminate Near-Surface Layer Moduli
 52 TRANSPORTATION RESEARCH RECORD 1355 Evaluation of a Dual-Load Nondestrutive Testing System To Better Disriminate Near-Surfae Layer Moduli REYNALDO ROQUE, PEDRO ROMERO, AND BYRON E. RUTH Theoretial analyses
Hankel Optimal Model Order Reduction 1
 Massahusetts Institute of Tehnology Department of Eletrial Engineering and Computer Siene 6.245: MULTIVARIABLE CONTROL SYSTEMS by A. Megretski Hankel Optimal Model Order Redution 1 This leture overs both
STRUCTURAL BEHAVIOR OF R/C DEEP BEAM WITH HEADED LONGITUDINAL REINFORCEMENTS
 13 th World Conferene on Earthquake Engineering anouver, B.C., Canada August 1-6, 24 Paper No. 58 STRUCTURAL BEHAIOR OF R/C DEEP BEAM WITH HEADED LONGITUDINAL REINFORCEMENTS Soo-Yeon SEO 1, Seung-Joe YOON
Universities of Leeds, Sheffield and York
 promoting aess to White Rose researh papers Universities of Leeds, Sheffield and York http://eprints.whiterose.a.uk/ This is an author produed version of a paper published in Journal of Composites for
A Spatiotemporal Approach to Passive Sound Source Localization
 A Spatiotemporal Approah Passive Sound Soure Loalization Pasi Pertilä, Mikko Parviainen, Teemu Korhonen and Ari Visa Institute of Signal Proessing Tampere University of Tehnology, P.O.Box 553, FIN-330,
SIZE EFFECT ON SHEAR STRENGTH OF RC BEAMS USING HSC WITHOUT SHEAR REINFORCEMENT
 SIZE EFFECT ON SHEAR STRENGTH OF RC BEAMS USING HSC WITHOUT SHEAR REINFORCEMENT (Translation from Proeedings of JSCE, Vol.711/V-56, August 00) Manabu FUJITA Ryoihi SATO Kaori MATSUMOTO Yasuhiro TAKAKI
EFFECT OF PITCH NUMBER IN OVERALL HEAT TRANSFER RATE IN DOUBLE PIPE HELICAL HEAT EXCHANGER
 Volume 116 No. 5 2017, 1-6 ISSN: 1311-8080 (printed version); ISSN: 1314-3395 (on-line version) url: http://www.ijpam.eu ijpam.eu EFFECT OF PITCH NUMBER IN OVERALL HEAT TRANSFER RATE IN DOUBLE PIPE HELICAL