Copyright. Andreas Michael
|
|
|
- Tyler George
- 6 years ago
- Views:
Transcription
1 Copyright by Andreas Michael 2016
2 The Report Committee for Andreas Michael Certifies that this is the approved version of the following report: Hydraulic Fracturing Optimization: Experimental Investigation of Multiple Fracture Growth Homogeneity via Perforation Cluster Distribution APPROVED BY SUPERVISING COMMITTEE: Supervisor: Jon E. Olson Matthew T. Balhoff
3 Hydraulic Fracturing Optimization: Experimental Investigation of Multiple Fracture Growth Homogeneity via Perforation Cluster Distribution by Andreas Michael, B.S.P.E. Report Presented to the Faculty of the Graduate School of The University of Texas at Austin in Partial Fulfillment of the Requirements for the Degree of Master of Science in Engineering The University of Texas at Austin May 2016
4 To my parents and grandparents, for helping me chase the American Dream
5 Acknowledgements To my supervising professor Jon E. Olson I owe a great deal. That is for providing me with a project of commercial value within the petroleum industry and additionally for his support, directions and insights. Historically, exceptional graduate students have been supervised by the department s chairperson and it is thus an honor to have that happening to me. Secondly, I want to thank my co-advisor Matthew T. Balhoff for his meticulous efforts in my research project, which I know did not fall into his primary specialty vicinity. He also helped me enormously in a time that was mentally very tough for me. The relationship between the graduate student and his advising professor(s) must be one of total harmony; in no case must the student feel challenged going to the laboratory for research work. He should instead feel invited, because there is something there to be gained. Richard A. Schultz, my other co-advisor, was major to the project development, even though he came to the department while the project was already on its way. He trained my thinking process using his long experience from his participation in similar projects. I look forward working with both my advisor and my co-advisors in the future. Special thanks also go to his predecessor Jon T. Holder, who has been an awesome person to have in the laboratory with me. I wish him a happy retirement. My thanks go similarly to the technical and administrative staff which includes Darryl Nygaard, Glen Baum, Gary Miscoe and Dori Coy. Finance was the biggest chokepoint I had to face in my higher education. Thus, I have to thank my parents, Michalis and Despo and grandparents for providing the route v
6 for obtaining the funds needed to pursue my undergraduate degree here in Texas. I would not have reached this level without having my B.S.P.E. as a base. Also, I want to thank the donors of the eleven scholarships awards I received up to this point. This includes Chevron Corporation, Baker Hughes, Inc., the Pancyprian Association of Texas, the Houston Chapter of the International Association of Drilling Contractors, the Hellenic Professional Society of Texas and the Association of International Petroleum Negotiators. Furthermore, I have to thank my friends in the department. I have never been in a place with higher concentration of intelligent people than the CPE and I do not think I ever will. It is my hope that by the time I retire, petroleum engineering will evolve to a coherent discipline of its own rather than amalgamation of other disciplines, which is what it seems to be now. For that to happen there has to be abundance of people both in industry and academia with deep as well as broad knowledge on petroleum engineering. In particular, I wish to thank Vu Q. Nguyen and Arjang Gandomkar, who beyond being classmates from the early undergraduate years and outstanding petroleum engineers have also been the best gym buddies I ever had. I should also thank my officemates at CPE for a great year and a half I had with them. These are Weiwei Wang, Valerie Gono, Hunjoo P. Lee, Mohsen Babazadeh, Kaimin Yue and Nana Asiamah. Last but definitely not least, I would like to thank my twelve PetroBowl teammates from 2013 to It is great having our names engraved together on the wall of the world s premier petroleum engineering department. To all I owe my gratitude. Funding for this project was provided through the Fracture Research and Application Consortium (FRAC) of the Department of Petroleum and Geosystems Engineering and the Bureau of Economic Geology of The University of Texas at Austin. vi
7 Abstract Hydraulic Fracturing Optimization: Experimental Investigation of Multiple Fracture Growth Homogeneity via Perforation Cluster Distribution Andreas Michael, M.S.E. The University of Texas at Austin, 2016 Supervisor: Jon E. Olson Hydraulic fracturing is a reservoir stimulation technique used in the petroleum industry since High pressure fluid composed mainly of water generates cracks near the wellbore improving the surrounding permeability and enhancing the flow of oil and gas to the surface. Advances in hydraulic fracturing coupled with developments in horizontal drilling, have unlocked vast quantities of unconventional resources, previously believed impossible to be produced. Fracture creation induces perturbations in the nearby in-situ stress regime suppressing the initiation and propagation of other fractures. Neighboring fractures are affected by this stress shadow effect, causing them to grow dissimilarly and they receive unequal portions of the injected fluid. Numerical simulation models have shown that nonuniform perforation cluster distributions with interior fractures closer to the exterior ones vii
8 can balance out these stress shadow effects, promoting more homogeneous multiple fracture growth compared to uniform perforation cluster distributions. In this work, laboratory-scale tests on three perforation configurations are performed on transparent specimens using distinctly colored fracturing fluids such that fracture growth can be observed. A normal faulting stress regime is replicated with the introduction of an overburden load in a confined space. The results have shown that uniform perforation spacing configurations yields higher degree of fracture growth homogeneity, as maximum spacing minimizes stress shadow effects, compared to moving the middle perforation closer to the toe, or heel of the horizontal well. The experiments also showed a proclivity to form one dominant fracture. Time delay, neglected in most theoretical modelling studies, between fracture initiations is found to be a key parameter and is believed to be one of the major factors promoting this dominant fracture tendency along with wellbore pressure gradients. Moreover, in several cases, the injected bypassed perforation(s) to generate fracture(s) downstream. Finally, the compressibility of the fracturing fluid triggered somewhat unexpected transient pressure behavior. The understanding of the stress shadow effects and what influences them could lead to optimization of hydraulic fracturing treatment design in terms of productivity and cost. Therefore, achieving more homogeneous multiple fracture growth patterns can be pivotal on the economic feasibility of several stimulation treatments. viii
9 Table of Contents List of Tables... xiv List of Figures...xv CHAPTER 1 INTRODUCTION Background Research Motivation and Scope Report Overview Organization Sign Convention...5 CHAPTER 2 LITERATURE REVIEW Subsurface In-situ Stress Regime Hydraulic Fracture Characterization Fracture Modes Fracture Initiation, Propagation and Closure Fracture Geometry Simultaneous Multiple Fracture Interaction Stress Shadow Effect Field Studies Numerical Simulations Laboratory Experiments Stress Shadow Mitigation...22 CHAPTER 3 EXPERIMENTAL METHODOLOGY Materials and Preparation Specimen Materials Preliminary Testing of Specimen Materials Specimen Preparation Wellbore Geometry and Perforations Stress Conditions...29 ix
10 3.2 Experimental Setup and Testing Procedure Experimental Program Fracturing Fluids Pilot Testing Vaseline Glycerin Injection Flow Rates Multiple Fracture Homogeneity Quantification Method...38 CHAPTER 4 RESULTS AND DISCUSSION Key Observations Experimental Results Case I Test Test Test Case II Test Test Test Case III Test Test Test Summary of Results Discussion Fracture Growth Homogeneity Analysis Agreement with Theoretical Models Agreement with Field Data...80 CHAPTER 5 CONCLUSION AND FUTURE WORK Conclusions Summary...81 x
11 5.2 Future Work Plans Experimental Investigation of Non-uniform Perforation Cluster Arrays with Separate Pumping per Perforation Stress Shadow Mitigation via Perforation Diameter Variation..83 Glossary...84 References...86 Vita...91 xi
12 List of Tables Table 3.1: Properties of the media used in the tests...25 Table 3.2: Properties of the fracturing fluids used in the tests...37 Table 3.3: Hypothetical data for the example cases...40 Table 4.1: Test conditions and results summary (0.2 psi overburden pressure) 69 Table 4.2a: Fracture growth homogeneity analysis for Case I tests...70 Table 4.2b: Fracture growth homogeneity analysis for Case II tests...71 Table 4.2c: Fracture growth homogeneity analysis for Case III tests...72 Table 4.3: Average results per case...75 xii
13 List of Figures Figure 1.1: United States natural gas production from shale basins...2 Figure 1.2: Multiple fractures along a horizontal well...3 Figure 1.3: Wu et al. (2015) simulations for 4 perforation (cluster) arrays...4 Figure 1.4a: Peirce and Bunger (2015) simulations for uniform 5 perforation arrays...4 Figure 1.4b: Peirce and Bunger (2015) simulations for non-uniform 5 perforation arrays...5 Figure 2.1: The in-situ principle stresses acting on an element in the subsurface 8 Figure 2.2: The 3 modes of fracture. From left to right: Mode I, Mode II and Mode III...9 Figure 2.3a: Longitudinal fracture configuration (from Crosby et al., 2002), assuming normal faulting stress regime, so σ h =σ Figure 2.3b: Transverse fracture configuration (from Crosby et al., 2002). It assumes normal faulting stress regime, so σ h =σ Figure 2.4: Induced hydraulic fracture initiation when wellbore pressure (p) becomes bigger than the minimum principal stress, σ 3 (P)...11 Figure 2.5: Idealized parameters versus time plot during a hydraulic fracturing treatment...12 Figure 2.6a: Radial (or penny-shaped) fracture geometry...14 Figure 2.6b: Kristonovich-Geertsma-de Klerk (KGD) fracture geometry (from Geerstma and de Klerk, 1969)...15 Figure 2.6c: Perkins-Kern-Nordgren (PKN) fracture geometry (from Nordgren et al., 1972)...16 xiii
14 Figure 2.7: Percentage of all perforation clustetrs that are not producing. The green bar is for fracture stages producing 110 to 150 percent above the average production rate. Red is for stages producing over 150 percent above the average rate (from Miller et al., 2011)...18 Figure 2.8: Top view numerical simulation outputs at increasing stress shadow effect from (a) to (c) by decreasing the fracture spacing (from Olson, 2008)...20 Figure 2.9: Simultaneous multiple fracture propagation experiments using motor oil as fracturing fluid (from El Rabaa, 1989)...22 Figure 2.10: Two fracturing sequencing techniques (a) consecutive and (b) alternative (from Roussel and Sharma, 2011)...23 Figure 3.1: Brazilian testing of PMMA, obtaining its tensile strength...26 Figure 3.2: SCB testing of PMMA, obtaining fracture toughness...26 Figure 3.3a: Container with aluminum wellbore prior to addition of gelatin. The arrows show the direction of the axes x, y and z, assumed to be aligned with the principal stresses S Hmax, S hmin and S v, respectively...27 Figure 3.3b: Container with wellbore with gelatin placed in the refrigerator for curing...28 Figure 3.3c: Cured gelatin with wellbore inside the container...28 Figure 3.4: Experimental setup...30 Figure 3.5a: Case I (base case): uniform array with perforations uniformly spaced31 Figure 3.5b: Case II: non-uniform array with the second perforation closer to the first...32 Figure 3.5c: Case III: non-uniform array with the second perforation closer to the last...32 xiv
15 Figure 3.6a: Pilot Test 1 with Vaseline fracturing fluid...34 Figure 3.6b: Pilot Test 2 with Vaseline fracturing fluid...34 Figure 3.6c: Pilot Test 3 with Vaseline fracturing fluid...35 Figure 3.7: Pilot test with glycerin fracturing fluid. The images are arranged from (a) to (d) with respect to the time captured...36 Figure 3.8: Image taken parallel to wellbore. Fracture opening direction indicates S 3 to be oriented perpendicular to the wellbore in the horizontal direction...37 Figure 3.9: Fracture growth profiles for the example cases...41 Figure 3.10: Fracture growth homogeneity plots for the example cases...42 Figure 4.1: Generic pressure behavior observed during the tests...44 Figure 4.2: Fracture growth with the compressed air previously present in the wellbore at the crack tip, followed by glycerin fracturing fluid. Inside the dotted box, we see the dry tip of the fracture...44 Figure 4.3: Perforation configuration schematic for Case I...45 Figure 4.4: Snapshots from Case I Test Figure 4.5: Pump pressure, flow rate and volume variation during Case I Test 147 Figure 4.6: Snapshots from Case I Test Figure 4.7: Pump pressure, flow rate and volume variation during Case I Test 249 Figure 4.8: Snapshots from Case I Test Figure 4.9: Pump pressure, flow rate and volume variation during Case I Test 352 Figure 4.10: Perforation configuration schematic for Case II...53 Figure 4.11: Snapshots from Case II Test Figure 4.12: Pump pressure, flow rate and volume variation during Case II Test 155 Figure 4.13: Snapshots from Case II Test xv
16 Figure 4.14: Pump pressure, flow rate and volume variation during Case II Test 257 Figure 4.15: Snapshots from Case II Test Figure 4.16: Pump pressure, flow rate and volume variation during Case II Test 360 Figure 4.17: Perforation configuration schematic for Case III...61 Figure 4.18: Snapshots from Case III Test Figure 4.19: Pump pressure, flow rate and volume variation during Case III Test Figure 4.20: Snapshots from Case III Test Figure 4.21: Pump pressure, flow rate and volume variation during Case III Test Figure 4.22: Snapshots from Case III Test Figure 4.23: Pump pressure, flow rate and volume variation during Case III Test Figure 4.24: Snapshots from all nine tests just before the first fracture reaches the specimen boundary at the surface. Case I, II and III are on column 1, 2 and 3 respectively and Test 1 and 2 and 3 are on row 1, 2 and 3 respectively...73 Figure 4.25: Fracture growth profiles for the nine tests, showing the normalized length versus normalized position of the perforation from which each generated fracture was initiated...74 Figure 4.26: Fracture length homogeneity factor versus normalized position for the nine tests...75 Figure 4.27: Average (arithmetic mean) fracture length homogeneity factor versus normalized position for the three cases...76 xvi
17 Figure 4.28: Schematic of wellbore and breakdown pressure profiles along a horizontal lateral during various time intervals of fluid injection (t+δt 1 < t+δt 2 < t+δt 3 )...77 Figure 4.29: Schematic of the wellbore pressure profile along a horizontal lateral for the three fracturing fluids: water, glycerin and Vaseline...78 xvii
18 Chapter 1 Introduction This chapter provides an introductory overview of this Master s Report. This includes general background information in Section 1.1, the scope and motivation of the research project in Section 1.2, as well as an overview of this report in Section Background Hydraulic fracturing is a method used in oilfields since the 1940s for reservoir stimulation. It increases the rock permeability around the wellbore and improves its connection with the surrounding reservoir. This is accomplished by high pressure fluid injection which either creates cracks that propagate through the rock matrix, or by causing slippage along natural pre-existing fractures. Commonly, 20 to 40 fracture stages are placed in a horizontal well with four or more fractures pumped per stage simultaneously (Xu et al., 2013). The industrial impact of this technology has been massive and is responsible for the advances in the development of tight unconventional petroleum resources such as shale gas (Figure 1.1). Fluids used include water, oils, and high viscosity gel and are typically varied per treatment and sometimes per stage. Previous research (Xu et al., 2013) has shown that low viscosity fluids tend to create larger fractures primarily in terms of height covering larger surface area but with limited width compared to high viscosity fluids. In addition, proppant particles (normally sand or ceramic) are pumped with the injection fluid for the purpose of filling up the created fractures, keeping them open after the fluid is flowed back and maintaining high fracture conductivity. The base fluid and proppant make up about 99.5 percent of the injection fluid and the balance consists of chemical additives such as acids and glycol, which helps to improve the quality of the stimulation process. 1

19 The creation of a fracture interacts with and alters the rock in-situ stresses, creating a stress shadow around it. This stress perturbation induced by the fracture stimulation affects nearby fractures causing them to grow and develop dissimilarly. This leads to a geometrically non-uniform treatment outcome and in many cases ineffective or prematurely terminated fractures (and therefore sub-optimal economics). Understanding stress shadowing and its effects is essential for optimizing the hydraulic fracture treatment design in terms of productivity and cost. The interactions between simultaneously growing fractures are of great interest to the research and development branch of the petroleum industry. A technology of high commercial value, hydraulic fracturing is the subject of numerous studies and research projects both in the industry and academia. The goal is to understand what parameters influence hydraulic fracturing treatments, how, and to what extent. Figure 1.1 United States natural gas production from shale basins (U.S. Energy Information Administration, 2015). 2
 promote homogeneous fracture growth more than others. Numerical simulations performed by Wu et al. (2015) for 4 perforation cluster (see Figure 1.")
20 1.2 Research Motivation and Scope The motivation for this experimental research is the conclusions of theoretical modelling studies that certain perforation cluster distribution arrays (see Figure 1.2) promote homogeneous fracture growth more than others. Numerical simulations performed by Wu et al. (2015) for 4 perforation cluster (see Figure 1.3) arrays and by Peirce and Bunger (2015) for 5 perforation cluster arrays (see Figure 1.4a and b) indicate that at critical spacing patterns, the stress shadow effects are balanced out and uniform fracture development is promoted. Subsequently, these critical non-uniform cluster distributions were found to yield 46 to 74 percent more fracture surface area than uniform distributions. Experiments were performed on three different cases of three perforation cluster arrays; one uniformly spaced (base case) and two non-uniformly spaced. The hypothesis tested is that non-uniform perforation clusters can promote more homogeneous fracture growth compared to the uniform base case. Unlike Peirce and Bunger (2015) and Wu et al. (2015) whose suggested non-uniform arrays are symmetric, our tested nonuniform arrays are non-symmetrical, in an attempt to compensate for the pressure gradients in the wellbore either by having the middle perforation (cluster) closer to either the heel, or the toe of the horizontal well. Transparent materials are used along with distinctly colored fracturing fluids, enabling the visual monitoring and recording of fracture initiation and growth. Results are assessed for homogeneity based on the length dimension of each generated fracture. Figure 1.2 Multiple fractures along a horizontal well. 3

21 Figure 1.3 Wu et al. (2015) simulations for 4 perforation (cluster) arrays. Figure 1.4a Peirce and Bunger (2015) simulations for uniform 5 perforation arrays. 4

22 Figure 1.4b Peirce and Bunger (2015) simulations for non-uniform 5 perforation arrays. 1.3 Report Overview Organization This report is organized into 5 chapters. Chapter 1 contains the introduction and a description of the method used for fracture growth homogeneity characterization. Chapter 2 provides a literature review on topics related to the research project. Chapter 3 gives a detailed description of the experimental methodology and outlines the experimental program. In Chapter 4 the results are illustrated, discussed and analyzed. Chapter 5 presents current conclusions and plans for future work. A complete list of citations is provided at the end in the Reference section Sign convention Contrary to most texts on mechanics where tension is assumed to have positive direction, in rock mechanics compressive stresses are positive. In this report, to be 5
23 consistent with the existing literature on related topics, all equations are presented with the compressive stress component being positive. 6
24 Chapter 2 Literature Review This chapter includes a summary of the existing scientific literature on the geomechanical principles behind the initiation, propagation and interaction of induced hydraulic fractures. It is divided into three main sections. Section 2.1 talks about subsurface in-situ stress regimes. Section 2.2 is related to hydraulic fracture characterization, and Section 2.3 is about simultaneous multiple hydraulic fracture interaction. 2.1 Subsurface In-situ Stress Regimes The subsurface stress state can be fully characterized by three principal stresses acting along mutually orthogonal directions (S 1, S 2 and S 3, where S 1 >S 2 >S 3 ). In most cases, one of those stresses is aligned vertically and is denoted by S v and the two others are horizontal. The largest horizontal stress is denoted by S Hmax and the smaller by S hmin. Figure 2.1 shows these stresses and their orientations. The principal stresses relative magnitude with respect to each other dictates the subsurface stress regime and subsequently the direction induced fractures would propagate (Valko and Economides, 1995; Zoback, 2007; Crosby et al., 2002). According to Anderson (1995) there are three main subsurface in-situ stress regimes: i. Normal faulting stress regime (S v >S Hmax >S hmin ) ii. Reverse (or thrust) faulting stress regime (S Hmax >S hmin >S v ) iii. Strike-slip faulting stress regime (S Hmax >S v>s hmin) Each of those three regimes induces its corresponding fault tectonic movement. For example, normal faults are generated when normal faulting stress regime exists. In 7

25 accordance to their magnitudes they are also denoted by S 1, S 2 and S 3 from strongest to weakest. Figure 2.1 The in-situ principal stresses acting on an element in the subsurface. When the material is porous and pressurized fluid is present in the pores, this pore pressure counteracts the tectonic stresses. In this case the effective principal stresses have to be considered instead of the absolute tectonic stresses and these are denoted by σ i, σ i = S i p p (2.1) where S i is the corresponding subsurface principal stress and p p is the pore pressure. 2.2 Hydraulic Fracture Characterization Fracture Modes There are three modes of fracture propagation, shown in Figure 2.2. Mode I refers to fractures where the normal stress direction is perpendicular the crack surface making the fracture propagate in the direction crack plane. Mode II fractures propagate between 8
26 crack faces and correspond to in-plane shear forces. Mode III fractures are shear displacements parallel to the crack plane induced by out-of-plane shear. In several cases a crack exhibits features of more than one mode, resulting in mixed mode fractures. Figure 2.2 The 3 modes of fracture. From left to right: Mode I, Mode II and Mode III Fracture Initiation, Propagation and Closure Mode I open mode fractures open by doing work against the minimum (least compressive) principal stress, σ 3. For this study on simultaneous multiple fracture propagation from a horizontal wellbore, all fractures are assumed to be Mode I. Hence, there propagation direction is perpendicular to σ 3. The orientation of the wellbore (horizontal lateral) with respect to σ 3 determines whether the fractures generated will be longitudinal, or transverse (Valko and Economides, 1995; Crosby, 2002). Figures 2.3a and 2.3b show longitudinal and transverse fracture configurations, respectively. As the treatment fluid is injected, the pressure at the perforations increases. When the wellbore pressure becomes equal to the breakdown, (or fracture initiation) pressure of the rock, a crack is created from where a fracture starts to grow. Figure 2.4 illustrates fracture initiation as wellbore pressure increases above a critical point. A number of studies throughout the years proposed different equations for measuring transverse fracture initiation pressure, for example Hubbert and Willis (1957) and Hoek and Brown (1980). 9
. It assumes normal faulting stress regime, so σ h =σ 3. During a hydraulic fracture treatment the bottomhole pressure and fluid injection flow rate are carefully monitored.")
. Despite the leak-off, the pressure continues to build up until the rock eventually breaks down and a crack forms.")
27 Figure 2.3a Longitudinal fracture configuration (from Crosby et al., 2002), assuming normal faulting stress regime, so σ h =σ 3. Figure 2.3b Transverse fracture configuration (from Crosby et al., 2002). It assumes normal faulting stress regime, so σ h =σ 3. During a hydraulic fracture treatment the bottomhole pressure and fluid injection flow rate are carefully monitored. As shown in Figure 2.5 at a steady injection rate the bottomhole pressure increases linearly with time until a point where it becomes nonlinear when pressure begins to leak into the formation. The pressure at which the leakage begins is known as the leak-off pressure (Fu, 2014). Despite the leak-off, the pressure continues to build up until the rock eventually breaks down and a crack forms. This is the breakdown pressure of the rock. Beyond that point further injection makes a fracture to extend from the induced crack. The pressure needed for the extension is the fracture propagation pressure, which is lower than both leak-off and breakdown pressures. When injection ceases, the pressure inside the fracture begins to decline and it closes unless proppant has been pumped inside to keep it open. The fracture closure 10

28 stress is approximately equal to the minimum principal stress, σ 3. The fracture volume begins to increase after rock breakdown and keeps increasing during the fracture propagation process. It eventually either asymptotes to a maximum value after the pressure declines if proppant has been pumped, (as in Figure 2.5) or goes back toward zero as the fracture closes if proppant has not been pumped. Figure 2.4 Induced hydraulic fracture initiation when wellbore pressure (p) becomes bigger than the minimum principal stress, σ 3 (P). 11
29 Figure 2.5 Idealized parameters versus time plot during a hydraulic fracturing treatment. Modelling of the pressure needed to initiate a fracture in relation to the near wellbore stresses was developed by Hubbert and Willis (1957) using Kirsch s (1898) stress concentrations at the wellbore wall and was modified by Haimson and Fairhurst (1967) to incorporate pore pressure and fluid flow. The equation for breakdown pressure, in normal faulting stress regime is the following; P b = S hmin 3 Hmax + T p p (2.2) P closure = S hmin p p = σ hmin (2.3) T is the tensile strength of the material and p p is the in situ pore pressure. This assumes vertical impact open borehole, vertical planar fracture orientation (normal faulting stress regime), homogeneous and isotropic rock matrix, which exhibits linearly elastic rock deformation and obeys the tensile stress failure criterion (Frash, 2014). Assuming the rock to be impermeable as well as having zero pore pressure, then the tensile strength can, in theory, be computed with the expression, 12
30 T = P b + 3S Hmax S hmin (2.4) where the wellbore is aligned with S v under normal faulting stress regime Fracture Geometry The most widely used pseudo-3d fracture propagation geometries are the radial (or penny-shaped), Kristonovich-Geertsma-de Klerk (KGD) and Perkins-Kern-Nordgren (PKN) models, depicted on Figure 2.6a, b and c, respectively. Each model is more applicable than the others for different situations. For example PKN model is more accurate for longer fracture where changes in the height are negligible. Also, some models can be more applicable at different stages of propagation of a specific fracture. For instance, Peirce and Bunger (2015) in their numerical simulations used radial model for the earlier stages of the fracture propagation, leading to PKN geometry at the latter stages. The following brief descriptions of each model are based on Economides et al. (1994). The radial model is a limiting one, where the fracture height is twice the radius (δz = 2rf) and is appropriate for small treatments in formations with thick pay zones, keeping the fracture away from any vertical barriers with an approximately circular shape. For this radial fracture propagation case with no leak-off, the radius, r f can be calculated by, 13
31 q inj z δz r f Figure 2.6a Radial (or penny-shaped) fracture geometry. 1 9 ) (1 ν)μ r f = 0.56 ( Gq 3 inj t 4 9 (2.5) where q inj is the volumetric fluid injection rate, G is the shear modulus, ν the Poisson s ratio, μ the fluid viscosity and t is the time from fracture initiation (Perkins and Kern, 1961; Geerstma and de Klerk, 1969). The KGD model is applicable to short-length fractures where the fracture height is bigger than the length. The width stays constant along the entire height of the fracture. At the wellbore the width, w w (0, t) can be calculated from, 14
32 Figure 2.6b Kristonovich-Geertsma-de Klerk (KGD) fracture geometry (from Geerstma and de Klerk, 1969). w w (0, t) = 4(1 v2 average )p net L(t) E (2.6) p average net = p frac p p (2.7) where p frac is the pressure of the fluid in the fracture, E is the Young s modulus of the formation and L is the fracture half length. The PKN model is the opposite of KGD and is used when the fracture length is much larger than its height. The height is assumed to be constant along the entire fracture length, while the width varies from zero at the top and bottom apexes to a maximum value at the middle of the fracture height. Because of this width variation, PKN yields 15
33 lower fracture volumes than KGD modeling for the same fracture length. The width at any point along the length of the fracture can be calculated by, Figure 2.6c Perkins-Kern-Nordgren (PKN) fracture geometry (from Nordgren et al., 1972). w(x, t) = 2(1 v2 )P net (x,t)h E (2.8) where p net is the net pressure at any point along the length of the fracture and h is the fracture height. 16
34 2.3 Simultaneous Multiple Fracture Interaction Stress Shadow Effect Stress shadow effects have been studied extensively in the scientific and engineering communities. The potential gains from understanding of the stress shadow behavior and managing it, balancing its effects, are enormous Field Studies Microseismic mapping results (Fisher et al., 2004) have shown that induced stress (shadow) effects on multiple fracture propagation increases with the number of perforation clusters pumped per stage. Consequently, less than three perforation clusters per fracturing stage were recommended to avoid excessive induced stresses, (Fisher et al., 2004). Similarly, Miller et al. (2011) examined production logs from many horizontal wells from six United States shale basins and discovered that the number of perforation clusters did not significantly to increase natural gas production (see Figure 2.7). In some basins approximately two thirds of the production is produced from one third of perforation clusters (Miller et al., 2011). The underperformance was attributed to the increased induced stresses due to the small spacing between the clusters. Miller et al. (2004) concluded that the optimum spacing range between perforation clusters is between 75 and 175 feet. 17
.")
35 Figure 2.7 Percentage of all perforation clusters that are not producing. The green bar is for fracture stages producing 110 to 150 percent above the average production rate. Red is for stages producing over 150 percent above the average rate (from Miller et al., 2011). Real time downhole monitoring data studies have indicated restrictions of fracture growth along the middle perforation clusters (Molenaar et al., 2012; Koskella et al., 2014). This was explained by uneven distribution of fracturing fluid favoring the outer perforations in horizontal wells with multiple fractures (Holley et al., 2010; Molenaar et al., 2012). This suggests low fracture growth homogeneity leading to heterogeneous production from these perforation clusters Numerical Simulations Fracture geometry was found to depend in multiple fractured horizontal wells and to be a function of the injection rate, fluid viscosity and proppant friction and fracture spacing (Lolon et al., 2009; Bunger et al., 2012). Furthermore, although well productivity is expected to increase with the number of fracturing stages, as the stimulated reservoir 18
36 volume increases, a threshold exists above which marginal well productivity per additional fracturing stage diminishes (Lolon et al., 2009). Stress shadow effects on the propagation of simultaneous multiple fractures from horizontal wells was also closely examined in various studies analyzing the propagation of the hydraulic fracture tip. Analyzing the effects on the surrounding in-situ stress regime, it was found that the maximum increase in the principal stresses is across the hydraulic fracture face in the S 3 direction (Nagel et al., 2014). Moreover, it was suggested that stress shadow decreases the shear stress behind the fracture tip (Nagel et al., 2014). Shin and Sharma (2014) used models showing fluid leak-off to increase reservoir pore pressure subsequently increasing the stresses around the growing fracture. As a result, the opening of one fracture increases the closure pressure (see pressure falloff in Figure 2.5) of its neighboring fractures affecting their growth and geometry. This makes the outer fractures near the heel and toe of the horizontal well to curve away from the wellbore. Inner fractures in the middle of the horizontal well however, experience propagation constraints leading to complex patterns (Shin and Sharma, 2014; Olson, 2008; Olson and Wu, 2012) as illustrated by Figure
37 Figure 2.8 Top view numerical simulation outputs at increasing stress shadow effect from (a) to (c) by decreasing the fracture spacing (from Olson, 2008). Other analyses showed that shorter perforation cluster spacing, larger number of perforation clusters pumped per stage, higher fracturing fluid viscosity, larger fracture height and bigger formation Young s modulus all can increase the stress shadow effect (Shin and Sharma, 2014; Olson and Wu, 2012). However, higher fracturing fluid injection rate was found to decrease stress shadow (Shin and Sharma, 2014; Olson and Wu, 2012). The role of the length of perforation intervals in the generation of multiple fractures was investigated as well. It was found that perforation clusters with interval length longer than four times the wellbore outer diameter are likely to generate multiple fractures at an elevated fracture treatment pressure (Soliman et al., 2004; Ketter et al., 20
38 2006). All these results highlight the degree of heterogeneity that exists in multiple fracture growth from horizontal wells Laboratory Experiments Laboratory testing on rock and hydrostone blocks (a mixture of Portland cement with gypsum plaster) was used in the past to examine the importance of perforation cluster design on the number of hydraulic fractures produced from each cluster. The parameters highlighted are the perforation cluster interval length and the cluster spacing. El Rabaa (1989) found that perforation intervals shorter than four times the wellbore outer diameter are likely to produce only one single fracture (Figure 2.9). From the same set of experiments in the case of longitudinal fractures, opening perpendicular the trajectory of the wellbore, (Figure 2.3a) perforation cluster spacing of at least the length of the fracture was needed to avoid connection (El Rabaa, 1989). Tests on hydrostone by Al Abbad (2014) showed that simultaneous multiple fracture propagation of similar length is operationally challenging. A tendency for the creation of one dominant fracture was observed. Moreover, closure of fractures in the middle segments prior to the far end ones, entraps fluid in these far end segments. This fluid remains unrecovered, contributing to partial recovery of injected fluids during flowbacks. Also, deflections in the induced fractures, either by the stress shadow effect, or interaction with pre-existing fractures creates regions of potential proppant bridging. This leads to pre-mature proppant screenouts. 21
.")
39 Figure 2.9 Simultaneous multiple fracture propagation experiments using motor oil as fracturing fluid (from El Rabaa, 1989) Stress Shadow Mitigation Several techniques have been proposed through numerical simulations for the promotion of uniform fracture development (Wu et al., 2015). The first is the limited entry technique where the diameter or number of perforations is adjusted such that even fluid flow is achieved in all. The second is balancing the stress shadow effects using a non-uniform cluster array. This is the technique which is investigated experimentally in this report. The arrays proposed by the models have the interior fractures moved closer to the exterior ones, in an attempt to promote homogeneous fracture growth across all of the perforations. Another proposed approach for mitigating the stress shadow effects in a horizontal well, is to have fractures initiated separately in a pre-defined sequence, instead of attempting to initiate them all simultaneously. It has been suggested that in the 22
40 presence of layers bounding the pay zone causing fracture containment that an alternative fracturing strategy reduces the stress reorientation region, compared to consecutive fracturing , (shown in Figure 2.10) lessening the effect on the fractures geometry and propagation. Figure 2.10 Two fracturing sequencing techniques (a) consecutive and (b) alternative (from Roussel and Sharma, 2011). 23
41 Chapter 3 Experimental Methodology This chapter provides a description of the methodology used in the experimental investigation. It is divided into four main sections. Section 3.1 discusses the materials used and the specimen preparation procedure and Section 3.2 talks about the experimental setup and the procedure followed for each test. Section 3.3 outlines the experimental program and Section 3.4 talks about the fracturing fluid selection. Section 3.5 provides a detailed example of the method used to characterize the fracture growth homogeneity in the experimental tests. 3.1 Materials and Preparation Specimen Materials The specimen material for the hydraulic fracturing experiments is edible Knox Gelatin mixed with water. The mixture s brittle behavior makes it comparable to rock formations and its transparency enables visual inspection of fracture propagation. Moreover gelatin is elastic, impermeable and non-porous with homogeneous properties when prepared carefully. A perforated aluminum wellbore tube, bent having a vertical and horizontal section is used to inject the fracturing fluids into the specimen at a constant rate. Experiments on hydraulic fracturing have been performed previously on polymethyl methacrylate/acrylic/pmma (Frash et al., 2013; Frash et al., 2014) and hydrostone blocks (Bahorich, 2012; Al Abbad, 2014; Asiamah, 2015). Additionally, transparent urethane plastic (see Crystal Clear Series in Reference Section) was considered for specimen material, but was not used in these experiments because it was not found to be as brittle as desired for the tests of this project. 24
42 Gelatin has a significantly lower Young s modulus, E estimated at psi (Wu et al., 2008). This result in the breakdown pressure for gelatin being lower compared to the other two materials (hydrostone and PMMA) subsequently making fracture initiation is easier. Moreover, fracture geometry (length, width and height) is likely to be different in the gelatin mixture than in PMMA, or hydrostone according to models of fracture geometry in the literature, (Perkins and Kern, 1961; Nordgren, 1972) taking into consideration the specimen properties. Lower E would mean larger width, but smaller height and length Preliminary Testing of Specimen Materials Urethane plastic, PMMA and gelatin mixture were the three materials considered for the experiments. Preliminary tests were performed, in an attempt to quantify some of their properties, including i. Unconfined Compressive Stress (UCS) test for obtaining Young s modulus and yield stress ii. Brazilian test for obtaining tensile strength iii. Semi-Circular Bend (SCB) test for obtaining fracture toughness Based on the results of those tests it was determined that gelatin of 7-8 percent by weight was the best candidate for the experiments. Note that not all three tests were possible to be performed on all three materials. Figure 3.1 shows Brazilian test and Figure 3.2 shows SCB test performed on a PMMA sample. Table 3.1 summarizes how the three specimen material candidates satisfy, or not, the properties required for our experimental program. Table 3.1 Properties of the media used in the tests. Material Transparency Low fracture toughness, K 1C Low tensile strength Price affordable for multiple tests Urethane plastic PMMA Gelatin (7-8% by weight) 25


43 Figure 3.1 Brazilian testing of PMMA, obtaining its tensile strength. Figure 3.2 SCB testing of PMMA, obtaining fracture toughness. 26
.")
44 3.1.3 Specimen Preparation Gelatin powder is added to hot water (near boiling point, 100 C) and stirred. It is made sure that the gelatin powder concentration is about 7-8 percent by weight. The wellbore is placed in the container filled with the fracturing fluid to prevent penetration of liquid gelatin inside and is held in place with the help of a clamp (Figure 3.3a). Once the gelatin powder has completely dissolved, the liquid is poured into a plastic transparent container and placed on a refrigerator to cure at about 5 C overnight, or about 12 hours (Figure 3.3b). After the gelatin has cured the container is removed from the refrigerator (Figure 3.3c). z Figure 3.3a Container with aluminum wellbore prior to addition of gelatin. The arrows show the direction of the axes x, y and z, assumed to be aligned with the principal stresses S Hmax, S hmin and S v, respectively. 27


45 Figure 3.3b Container with wellbore with gelatin placed in the refrigerator for curing. Figure 3.3c Cured gelatin with wellbore inside the container. 28
46 3.1.4 Wellbore Geometry and Perforations The wellbore is an aluminum tube 3/8 th inch diameter OD with inch wall thickness. The inclination angle is about 90 degrees. Perforations are made through 1/9 th inch holes drilled in the tubing facing up. Different perforation spacing configurations are used both uniform and nonuniform. The spacing between perforations was made in accordance with the literature, (El Rabaa, 1989) such that multiple distinct fractures are promoted when perforation spacing is at least four times the wellbore tubing outer diameter Stress Conditions The container provides confining pressure on the gelatin on the 2 horizontal directions x and y. The vertical part of the wellbore is aligned in the z-direction (see Figure 3.3b). Quantification of those confining stresses was not attempted. However, it was noted from fracture propagation that the shorter side, x is stronger than the longer side, y. In order to create normal faulting stress regime, an overburden load is applied via placing a mass on the gelatin surface. Through previous trial and error procedures, the gelatin was found to be able to withstand overburden pressures up to 0.20 psi (about lb m on a flat 11 5 in 2 surface). This stress is larger than the two horizontal stresses as indicated by fracture propagation as well. Even though this means that the fractures generated will be longitudinal to the wellbore, testing of the hypothesis is still possible due to the specimen dimensions and perforation spacing, which will allow multiple fractures generated to be distinct for a while, before they merge. 3.2 Experimental Setup and Testing Procedure Fracturing fluid is placed in an accumulator and is injected into the specimen using Teledyne ISCO pumps, which enable constant flow rate injection. Connections between the pump, accumulator and wellbore are made using 1/16 th inch high pressure 29

47 steel tubing. Figure 3.4 shows a schematic of the experimental setup. Data acquisition is performed using a custom made NI LabVIEW program with the data being further processed and analyzed using a code written in MATLAB. Figure 3.4 Experimental setup. Throughout the experimental program, this testing procedure was followed: 1. Synchronize all data acquisition and video equipment. 2. Make sure that the wellbore is filled with fracturing fluid and connect it to the tubing extended from the fluid accumulator. 3. Place overburden weight at the surface of gelatin. Do that gently, to avoid rupturing of the gelatin. 4. Close the outlet air valve at the bottom of the fluid accumulator. 5. Start the video recording equipment. 6. Start injection at a prescribed constant flow rate. 7. Stop injection as soon as the fracture reaches the specimen boundary. 8. Stop video recording and data acquisition. 9. Bleed out any residual pressure. 10. Photograph any final fracture key features in the specimen. 11. Disconnect the wellbore from the fluid accumulator and dispose the specimen. 30
48 3.3 Experimental Program The experimental program consisted of multiple runs of three test cases of three perforation arrays. In all three cases the total length from the first perforation to the last is 7 inches. Case I is the base case with a uniformly spaced array with the perforations arranged 3.5 inches apart. Case II is a non-uniform array with the second perforation being 2 inches from the first and 5 inches from the last. Case III is also a non-uniform array, but the second perforation is 5 inches from the first and 2 inches from the last. Figures 3.5a-c show respectively Cases I to III. The experimental results, key observations and their conclusions are summarized and discussed in the following chapters. Figure 3.5a Case I (base case): uniform array with perforations uniformly spaced. 31
49 Figure 3.5b Case II: non-uniform array with the second perforation closer to the first. Figure 3.5c Case III: non-uniform array with the second perforation closer to the last. 3.4 Fracturing Fluids Dyed glycerin (99.7% concentration) was used as fracturing fluid. The viscosity of pure glycerin is 950 cp. In the preliminary experiments, other fluids have been used. These were dyed water (~1.5 cp) and dyed Vaseline (~64,000 cp). All viscosity values are given for room temperature and pressure. It was found that as the fracture fluid viscosity increases, from water to glycerin, the number of fractures initiated per given 32
50 perforation number increases. This is in agreement with findings in the literature (Wu et al., 2008). However, increasing the viscosity further (exchanging glycerin to Vaseline ) has the opposite effect, leading to less fractures being generated per given perforation number. The reason for the reduced number of fractures is the higher pressure gradients induced in the wellbore when using higher viscosity fluids. It seems that there is an optimal fracturing fluid viscosity at which a maximum number of fractures are generated from a fixed number of perforations Pilot Testing Two small scale pilot tests series were performed prior to the actual tests. The main goal of those tests was to establish familiarity with the materials and equipment and make sure that everything works properly. Also, it was intended to use the outcome of those pilot tests to decide which fracturing fluid to use in the actual tests. The two fluids tested were Vaseline and glycerin Vaseline This fluid has very high viscosity (~64,000 cp) at room temperature and must be heated to make it pourable. The test was repeated three times (Figures 3.6a, b and c) on three uniformly spaced perforated wellbores. A slow flow rate of 0.05 ml/min is used for safety purposes, as the highly viscous and compressible fluid can reach high pressures very fast. In all tests one dominant fracture is created from the perforation closer to the vertical section of the wellbore. This can be explained considering the very high pressure gradients in the wellbore induced by the very high viscosity of the fluid. An explanation on how higher viscosity fluids with higher wellbore pressure gradients affect the timing (and sequencing) of fracture initiations in horizontal wells is given in Chapter 4. 33


51 Figure 3.6a Pilot Test 1 with Vaseline fracturing fluid. Figure 3.6b Pilot Test 2 with Vaseline fracturing fluid. 34

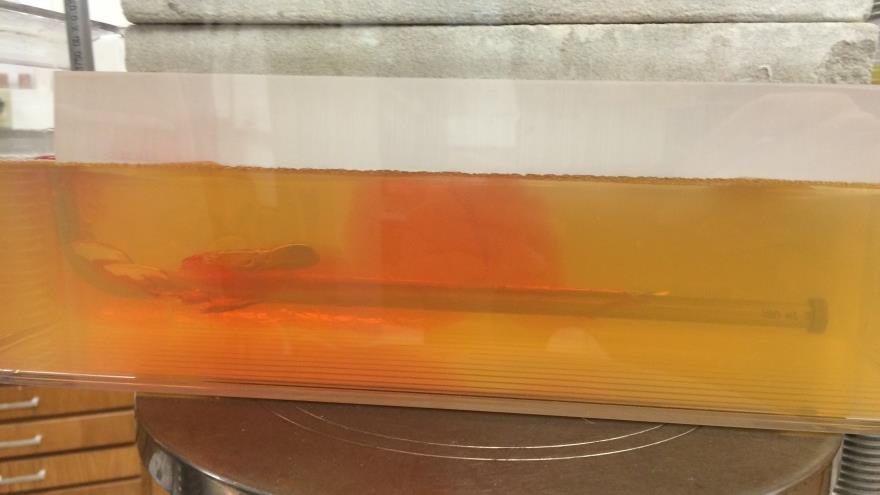
52 Figure 3.6c Pilot Test 3 with Vaseline fracturing fluid Glycerin This fluid s viscosity (~950 cp) is lower than Vaseline, but still much higher than that of water. Higher flow rates of ml/min were used. Tests are made on wellbores with four uniformly spaced perforations. Two perforations generated fractures in these tests; sometimes the two closest to the toe and sometimes the two closest to the heel. It is not clear what determines which of the two perforations will initiate fractures. Figures 3.7a-d are images of one of these tests at various time lapses. The direction of propagation of the fractures is indicative of the relative magnitude of the principal stresses, as mentioned earlier. Fractures open doing work against the minimum principal stress (Hubbert and Willis, 1957). Figure 3.8 shows an image captured from an angle almost parallel to the wellbore enabling accurate inspection of the induced fractures. Within some margin, the fractures open against the longer horizontal dimension y making it the direction of the least principal stress. The plastic container is more flexible along the longer horizontal dimension y compared to the shorter x likely making it the direction of S 3. The reason for the margin is the presence of the container s walls, acting as boundaries affecting fracture growth. 35
 wit Figure 3.")


 with respect to")
53 (a) wit (b) wit (c) wit (d) wit Figure 3.7 Pilot test with glycerin fracturing fluid. The images are arranged from (a) to (d) with respect to the time captured. 36

54 Figure 3.8 Image taken parallel to wellbore. Fracture opening direction indicates S 3 to be oriented perpendicular to the wellbore in the horizontal direction. Table 3.2 summarizes the properties of the three different fracturing fluids; water, glycerin and Vaseline. The results of the pilot tests have shown that glycerin usability as fracturing fluid for the purposes of the experimental program is far superior to Vaseline. The major factor in the decision was glycerin s ability to generate multiple fractures from one horizontal wellbore. Furthermore, the relatively lower viscosity of glycerin, compared to Vaseline, makes laboratory-to-field scaling (de Pater, 1994) easier, since it is closer to the viscosity of fracturing fluids used in field conditions. Table 3.2 Properties of the fracturing fluids used in the tests. Fluid Approximate viscosity (cp) Compressibility (10 6 psi -1 ) Gradients generated in Ability to initiate multiple fractures wellbore during pumping Water low Glycerin medium Vaseline 64,000 Very low high 37
55 3.4.2 Injection Flow Rates Results from pilot testing performed with dyed glycerin fracturing fluid, as well as findings in the literature, from other studies using similar specimen material and fracturing fluid (Wu et al., 2008) were considered for choosing the injection flow rate used in the tests. It was decided to use 100 ml/min, as this rate is high enough to generate multiple fractures, but not too high that the fractures propagate so fast, that reach the specimen surface, before other fractures are produced. To ensure reliable comparison, the same injection flow rate was used in every test. 3.5 Multiple Fracture Homogeneity Quantification Method The parameter used for quantification of fracture homogeneity is the fracture length (equal to half-length in the case of bi-wing fractures). The length of each generated fracture can be normalized by the length of the longest fracture produced in the corresponding test as shown in Equation 3.1, N i length = l i l max (3.1) where N length i is the normalized length of the i th fracture, l i is the actual length of that particular fracture and l max is the length of the longest fracture generated. Consistent units should be used in the numerator and the denominator producing a dimensionless quantity. For each experimental test, the sum of the normalized lengths of the fractures generated is calculated and then divided by the total number of perforations using Equation 3.2, n length FLHF = 1 N n 1 i (3.2) 38
56 where the value of i varies from 1 to n, the total number of fractures expected to be generated in each test, which is equal to the number of perforations. We refer to this value as the fracture length homogeneity factor (FLHF) and it can vary from zero to one depending on the degree of homogeneity of fracture growth. Fully homogeneous multiple fracture growth, where all fractures have the same length will give a value of one, while heterogeneous growth yields values closer to zero. The FLHF is then plotted against the independent variable which for three perforation cluster arrays is the normalized position of Perforation No. 2 (N position 2 ) and is calculated using Equation 3.3, N 2 position = D 1 2 D 1 3 (3.3) 2 3 where D 1 is the distance between Perforations No. 2 and No. 1 and D 1 is the distance between Perforations No. 3 and No. 1. The units of both must be the same. Similarly, N position 1 and N position 3 will be zero and one respectively. Table 1.1 presents synthetic data from five example cases of three perforation arrays, similar to the ones used in the actual experimental program: Example 1: uniform perforation spacing Example 2 High/Low homogeneity: middle perforation closer to the heel of the horizontal wellbore with homogeneous/non-homogeneous fracture growth Example 3 High/Low homogeneity: middle perforation closer to the toe of the horizontal wellbore with homogeneous/non-homogeneous fracture growth The quantities of l 1,2 and 3 and D 1 1,2 and 3 tabulated are assumed to be in consistent units. 39
57 Table 3.3 Hypothetical data for the example cases. Parameters for example 1 2 High homogeneity 2 Low homogeneity 3 High homogeneity 3 Low homogeneity l 1 (in) l 2 (in) l 3 (in) length N length N length N D 1 1 (in) D 1 (in) D 1 3 (in) N 1 position position N N 3 position FLHF Using the results a multiple fracture length profile plot (Figure 3.9) can be generated for each example case, in which a perfectly homogeneous growth case yields a straight line at fracture normalized length of one. Moreover, a fracture growth homogeneity by length versus N position 2 plot (the rows in the red dotted boxes) is generated using the calculated FLHF as shown in Figure 3.10; the perforation spacing case which generates the higher FLHF is the best. 40
58 Normalized fracture length Example 2 High homogneneity Example 3 High homogeneity 1 Example Example 2 Low homogneneity Example 3 Low homogneneity Normalized perforation position Figure 3.9 Fracture growth profiles for the example cases. 41
59 Fracture Length Homogeneity Factor (FLHF) Example 1 Example 2 High/Low homogeneity Example 3 High/Low homogeneity 100% homogeneous fracture growth Normalized position of Perforation No. 2 Figure 3.10 Fracture growth homogeneity plots for the example cases. The closer the points are to the dotted line, the more homogeneous the fracture growth is. This technique is used to quantify the degree of homogeneity in our experiments and prove, or disprove the hypothesis tested. This method is applicable in field-scale as it is for laboratory-scale cases when information on fracture length is available, for example by microseismic data. FLHF can also be calculated and assessed at various time intervals during a fracture stimulation job. 42
60 Chapter 4 Results and Discussion This chapter presents the results of the experimental tests and discusses what they indicate in relation to the pre-stated hypothesis. Photographic snapshots taken during each test are provided along with the data acquisition of key parameters. Then a fracture growth homogeneity analysis is performed to quantify the fracture length homogeneity achieved in each test and the extent to which the results agree with numerical simulations and field data is assessed. 4.1 Key Observations Most of the tests exhibited a pressure profile similar to that shown in Figure 4.1, which is close to the behavior predicted in Figure 2.5. Pressure increases rapidly, until it reaches the highest point, which sometimes becomes a small plateau at the fracture initiation pressure. Interestingly, despite having multiple fracture generation, only one peak in pressure is observed. This can be attributed to the lower compressibility of glycerin, which is psi 1 compared to psi 1 for water. Low compressibility hinders fluid displacement during pressure increase. For the same pressure increase, the fluid with the lower compressibility experiences lower change in volume, compared to the fluid with higher compressibility. This smaler volumetric compression during pressure increase compared to water does not allow glycerin to expand in the wellbore, as much as it would if it was water which is almost incompressible. Another observation is that in all tests the fluid is lagging the crack tip, as the fractures grow; glycerin is almost never present at the crack tip. The fluid at the crack tip is almost always air (see Figure 4.2). This has to do with the viscosity of the fracturing 43
.")
61 fluid used. The viscosity of glycerin is too high to penetrate to the fracture tip and air becomes the fluid causing the breakdown when a fracture is generated. This situation is known as dry tip (Groenenboom et al., 1999). How far in the fracture glycerin reaches is determined by capillary forces related to fracture geometry (opening) and the two fluids present in the fracture. Finally, all tests end with one fracture dominating, by propagating much faster than the rest breaking to the surface of the specimen. Figure 4.1 Generic pressure behavior observed during the tests. Figure 4.2 Fracture growth with the air previously present in the wellbore at the crack tip, followed by glycerin fracturing fluid. Inside the dotted box, we see the dry tip of the fracture. 44

62 4.2 Experimental Results Case I In this series of tests, the spacing between the three perforations is equal at 3.5 inches. Case I is intended to be the uniform perforation distribution base case in the testing of our hypothesis. Three tests were performed for this case. Figure 4.3 Perforation configuration schematic for Case I Test 1 Figure


63 Figure 4.4 Snapshots from Case I Test 1. 46
64 Figure 4.5 Pump pressure, flow rate and volume variation during Case I Test 1. In Case I Test 1, the first fracture was initiated from the first perforation. Then fluid moved along the length of the wellbore passing the second perforation generating small fractures around the wellbore. Eventually the third perforation initiated two fractures; a smaller horizontal one longitudinally to the wellbore and a bigger vertical one also longitudinal to the wellbore, opening against the specimen width. This bigger fracture generated from the third perforation was the one that first reached the surface of the gelatin sample. Notably, while the fracture from the first perforation stopped propagating, the fractures generated from the third perforation were still propagating. 47


65 Test 2 Figure

66 Figure 4.6 Snapshots from Case I Test 2. Figure 4.7 Pump pressure, flow rate and volume variation during Case I Test 2. Case I Test 2 generated a total of three fractures as in Case I Test 1. The first fracture initiated at the middle perforation and then another one was initiated next to it towards the heel of the lateral. Finally, a third fracture was initiated from the first 49


67 perforation and all three fractures grew quite homogeneously in length. Small fractures, created along the deviated and vertical parts of the wellbore let fluid reach the surface. This may be possibly due to poor bonding between the wellbore and the gelatin sample Test 3 Figure


68 Figure 4.8 Snapshots from Case I Test 3. 51
69 Figure 4.9 Pump pressure, flow rate and volume variation during Case I Test 3. In Case I Test 3, only one fracture was produced, initiated from the middle perforation. It is clearly visible from the snapshots that the compressed air is present at the tip of the fracture followed by dyed glycerin. 52


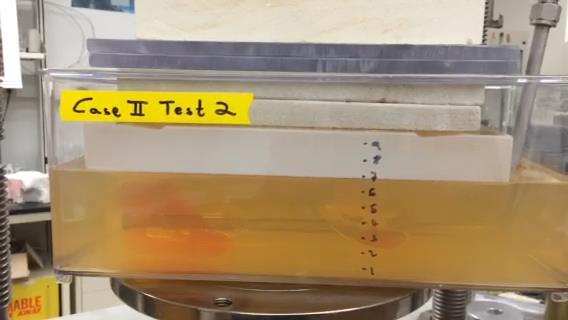
70 4.2.2 Case II For Case II Perforation No. 2 is moved closer to the heel of the horizontal wellbore compared to Case I. The distance between Perforations No. 1 and No. 2 is 2 inches and the distance between Perforation No. 2 and No. 3 is 5 inches. Figure 4.10 Perforation configuration schematic for Case II Test 1 Figure


71 Figure 4.11 Snapshots from Case II Test 1. 54
72 Figure 4.12 Pump pressure, flow rate and volume variation during Case II Test 1. Case II Test 1 produced only one fracture from the third perforation, which is nearest to the toe of the well. The first two perforations did not generate any fracture despite being nearer to the heel of the wellbore, where the fluid pressure is higher, due to friction between the fluid and the internal surface of the wellbore. Moreover, the geometry of the fracture formed was very close to radial (a vertical fracture longitudinal to the wellbore with equal height and length). 55


73 Test 2 Figure
74 Figure 4.13 Snapshots from Case II Test 2. Figure 4.14 Pump pressure, flow rate and volume variation during Case II Test 2. Two fractures were produced in Case II Test 2. The first fracture was generated from the first perforation (near the heel of the well). As this first fracture was 57

75 propagating, the second one was initiated from the third perforation closer to the toe and began growing much faster than the first fracture. Eventually, the second fracture reached the surface of the specimen Test 3 Figure
76 Figure 4.15 Snapshots from Case II Test 3. 59
77 Figure 4.16 Pump pressure, flow rate and volume variation during Case II Test 3. A single vertical fracture was produced in Case II Test 3 from Perforation No. 3. It propagated upwards from the horizontal lateral and extended a long distance along the length of the wellbore, without reaching Perforation No. 2. This was one of the two tests that gave maximum pressure recording considerably less than the rest of the tests; the other one being Case III Test 3 shown later. 60

78 4.2.3 Case III For Case III Perforation No. 2 is moved closer to the toe of the horizontal wellbore compared to Cases I and II. The distance between Perforations No. 1 and No. 2 is 5 inches and the distance between Perforation No. 2 and No. 3 is 2 inches. Figure 4.17 Perforation configuration schematic for Case III Test 1 Figure


79 Figure 4.18 Snapshots from Case III Test 1. 62
80 Figure 4.19 Pump pressure, flow rate and volume variation during Case III Test 1. Case III Test 1 produced three fractures, one from each perforation. The first two fractures were initiated almost simultaneously from the second and third perforation. A few seconds later a third perforation was initiated from the first perforation. The last fracture continued to grow, both in length and also longitudinally along the deviated and vertical part of the wellbore, eventually reaching the surface. Interestingly, the fractures form the second and third perforations were not fully longitudinal to the wellbore as in other cases. 63


81 Test 2 Figure

82 Figure 4.20 Snapshots from Case III Test 2. Figure 4.21 Pump pressure, flow rate and volume variation during Case III Test 2. 65

83 In Case III Test 2 only one fracture was produced and was initiated from the third perforation. This fracture was longitudinal to the wellbore growing vertically in length, eventually cracking the surface of the specimen Test 3 Figure
84 Figure 4.22 Snapshots from Case III Test 3. 67
85 Figure 4.23 Pump pressure, flow rate and volume variation during Case III Test 3. Case III Test 3 generated one fracture from Perforation No. 1, propagating longitudinally above and below the wellbore. The fracture extended along the deviated part of the wellbore and cracked the surface of the specimen next to the overburden weight, spilling out fracturing fluid. The maximum pressure reached in this test was, similar to Case II Test 3, significantly lower than the rest of the tests Summary of Results Table 4.1 provides a summary of the results of all tests. Every test led to generation of fracture(s). The materials, concentrations and stress conditions for all the tests were kept constant to ensure result reliability. Moreover, the same injection flow rate (100 ml/min) was used in all nine tests. 68
86 Table 4.1 Test conditions and results summary (0.2 psi overburden pressure). Experiment Maximum pressure recorded (psi) Number of fractures generated Perforation initiating first fracture Case I Test (2 from Perf. No. 2) No. 1 Case I Test (2 from Perf. No. 2) No. 2 Case I Test No. 2 Case II Test No. 3 Case II Test No. 2 Case II Test No. 3 Case III Test No. 3 Case III Test No. 3 Case III Test No. 1 The pressure behavior with time is similar for every test, with the maximum pressures recorded (at fracture initiation) within a very close range ( psi) for all except three tests. The maximum pressure reached in Case III Test 2 was a little below that range at 944 psi. Case II Test 3 and Case III Tests 3 had maximum pressure recorded significantly lower from that range; 421 and 578 psi, respectively. 4.3 Discussion Fracture Growth Homogeneity Analysis The homogeneity of fracture growth for each test is quantified by using the method outlined in Chapter 3, Section 3.5. The fracture length is the sole parameter used for this characterization and the fracture length homogeneity factor (FLHF) is calculated for each test, is shown on Tables 4.2a-c. It should be noted that the FLHF for tests with three perforations present, in which only one fracture was generated is always
87 Table 4.2a Fracture growth homogeneity analysis for Case I. Parameters Test 1 Test 2 Test 3 l 1 (in) l 2 (in) l 3 (in) length N length N length N D 1 1 (in) D 2 1 (in) D 3 1 (in) position N position N position N FLHF
88 Table 4.2b Fracture growth homogeneity analysis for Case II. Parameters Test 1 Test 2 Test 3 l 1 (in) l 2 (in) l 3 (in) N 1 length N 2 length N 3 length D 1 1 (in) D 1 2 (in) D 3 1 (in) N 1 position N 2 position N 3 position FLHF
89 Table 4.2c Fracture growth homogeneity analysis for Case III. Parameters Test 1 Test 2 Test 3 l 1 (in) l 2 (in) l 3 (in) length N length N length N D 1 1 (in) D 2 1 (in) D 3 1 (in) position N position N position N FLHF As mentioned before the FLHF is a strong varies with time during non-uniform fracture propagation. In order to make accurate comparisons ensuring that reliable conclusions are drawn, the FLHF for each is calculated at the point, just before the longest fracture reaches the specimen boundary on its surface, where the contact with the overburden load takes place. Figure 4.24 shows the snapshots of all nine tests at that point. Figure 4.25 shows the multiple fracture growth profile with respect to normalized fracture length for every test. The plot of FLHF against the normalized position of Perforation No. 2 is shown in Figure

90 Figure 4.24 Snapshots from all nine tests just before the first fracture reaches the specimen boundary at the surface. Case I, II and III are on column 1, 2 and 3 respectively and Test 1 and 2 and 3 are on row 1, 2 and 3 respectively. 73
91 Normalized fracture length Case I Case II Case III Test 1 Test 2 Test Normalized perforation position Figure 4.25 Fracture growth profiles for the nine tests, showing the normalized length versus normalized position of the perforation from which each generated fracture was initiated. 74
92 Fracture Length Homogeneity Factor (FLHF) Case I Case II Case III 100% homogeneous fracture growth Normalized position of Perforation No. 2 Figure 4.26 Fracture length homogeneity factor versus normalized position for the nine tests. The average (arithmetic mean) FHLF is then calculated for each of the three cases and they are tabulated on Table 4.3, along with the standard deviations. Figure 4.27 shows a plot of these average FLHF values against the normalized position of the middle perforation. A polynomial curve is then fitted between the points. Table 4.3 Average results per case. Case position N 2 Average FLHF Standard deviation I II III
93 Fracture Length Homogeneity Factor (FLHF) Case I Case II Case III Case averages l 1 = l 2 = l Normalized position of Perforation No. 2 Figure 4.27 Average fracture length homogeneity factor versus normalized position for the three cases. There is some inconsistency in the test results for each case. Tests of all three Cases produced a single fracture at least once. There was no test in which all 3 fractures were initiated at the same time; substantial delay was observed between fracture initiations in every test that produced more than one fracture. This can be explained, by considering the wellbore pressure at each perforation along the horizontal lateral. The wellbore pressure in Perforation No. 1 is higher to pressure in No. 2, which is higher than that in No. 3, because of the fluid injected in that direction (from Perforation No. 1 to No. 3). This along with irregularities in the bonding between the wellbore and the gelatin, determine how many fractures will be generated and if more than one, at which sequence. Assuming a constant value of gelatin breakdown pressure in all three perforations it means that the wellbore pressure at the first perforation (No. 1) will reach the gelatin 76

94 breakdown pressure before No. 2 and No. 3. Figure 4.28 shows conceptually how the relationship between wellbore and breakdown pressures changes with injection time at three different time steps; t+δt 1, t+δt 2 and t+δt 3, where t is the time at which injection begins and Δt 1 < Δt 2 < Δt 3. Figure 4.28 Schematic of wellbore and breakdown pressure profiles along a horizontal lateral during various time intervals of fluid injection (t+δt 1 < t+δt 2 < t+δt 3 ). As the fluid is injected, the wellbore pressure increases and, theoretically, the slope stays constant. According to the Hagen-Poiseulle equation for flow of a Newtonian through a cylindrical tube and neglecting gravity (Bird et al., 2002), it will be equal to, P L = 8Qμ πr 4 (4.1) where P L is the average pressure gradient, Q is the flow rate, R is the radius of the cylindrical tube and μ is the viscosity oif the fluid. At time t+δt 1 the wellbore pressure at all three perforations is lower than the breakdown pressure. Later at time t+δt 2, the wellbore pressure at Perforation No. 1 77
Gas Shale Hydraulic Fracturing, Enhancement. Ahmad Ghassemi
 Gas Shale Hydraulic Fracturing, Stimulated Volume and Permeability Enhancement Ahmad Ghassemi Tight Gas A reservoir that cannot produce gas in economic quantities without massive fracture stimulation treatments
Robustness to formation geological heterogeneities of the limited entry technique for multi-stage fracturing of horizontal wells
 Rock Mech Rock Eng DOI 10.1007/s00603-015-0836-5 TECHNICAL NOTE Robustness to formation geological heterogeneities of the limited entry technique for multi-stage fracturing of horizontal wells Brice Lecampion
Stress Shadows Explained: What It Is, What It Isn t, And Why You Should Care
 Stress Shadows Explained: What It Is, What It Isn t, And Why You Should Care Introduction Much is now made about Stress Shadows (SSs) and its impact on hydraulic fracturing. In fact, many (most?) of the
Impact of fracture spacing and mechanical parameter anisotropy on fracture width in horizontal wells in shales
 Scholars' Mine Masters Theses Student Research & Creative Works Spring 2014 Impact of fracture spacing and mechanical parameter anisotropy on fracture width in horizontal wells in shales Deepak Gokaraju
2015 Training Course Offerings
 2015 Training Course Offerings OilField Geomechanics offers a wide-range of the geomechanics-related training including: 1) Geomechanics for Unconventional Plays; 2) Basic Geomechanics for the Oilfield;
Reservoir Geomechanics and Faults
 Reservoir Geomechanics and Faults Dr David McNamara National University of Ireland, Galway david.d.mcnamara@nuigalway.ie @mcnamadd What is a Geological Structure? Geological structures include fractures
Critical Borehole Orientations Rock Mechanics Aspects
 Critical Borehole Orientations Rock Mechanics Aspects By R. BRAUN* Abstract This article discusses rock mechanics aspects of the relationship between borehole stability and borehole orientation. Two kinds
URTeC: Abstract
 URTeC: 2902950 Can Seismic Inversion Be Used for Geomechanics? A Casing Deformation Example Jeremy J. Meyer 1*, Jeremy Gallop 1, Alvin Chen 1, Scott Reynolds 1, Scott Mildren 1 ; 1. Ikon Science Copyright
Title: Application and use of near-wellbore mechanical rock property information to model stimulation and completion operations
 SPE OKC Oil and Gas Symposium March 27-31, 2017 Best of OKC Session Chairperson: Matthew Mower, Chaparral Energy Title: Application and use of near-wellbore mechanical rock property information to model
Understanding hydraulic fracture variability through a penny shaped crack model for pre-rupture faults
 Penny shaped crack model for pre-rupture faults Understanding hydraulic fracture variability through a penny shaped crack model for pre-rupture faults David Cho, Gary F. Margrave, Shawn Maxwell and Mark
Abstracts ESG Solutions
 Abstracts ESG Solutions 2015-2016 For more information, please contact Melissa Hoy, Technical Marketing Coordinator at melissa.hoy@esgsolutions.com Visit us online at www.esgsolutions.com Abstract #1 Fracture
A Better Modeling Approach for Hydraulic Fractures in Unconventional Reservoirs
 A Better Modeling Approach for Hydraulic Fractures in Unconventional Reservoirs OUTLINE Numerical Simulation: Comparison of Conventional and NEW Approaches NEW Approach as a Modeling Tool (understanding
Role of lithological layering on spatial variation of natural and induced fractures in hydraulic fracture stimulation
 Role of lithological layering on spatial variation of natural and induced fractures in hydraulic fracture stimulation Vincent Roche *, Department of Physics, University of Alberta, Edmonton roche@ualberta.ca
Road, Vancouver, B.C. V6T 1Z2, Canada, Page 1
 Numerical Simulation of Simultaneous Growth of Multiple Interacting Hydraulic Fractures from Horizontal Wells Andrew P. Bunger 1, Ph.D., and Anthony P. Peirce 2, Ph.D. 1 Assistant Professor, Department
What Microseismicity Tells Us About Re-fracturing An Engineering Approach to Re-fracturing Design
 What Microseismicity Tells Us About Re-fracturing An Engineering Approach to Re-fracturing Design Alireza Agharazi, Sudhendu Kashikar MicroSeismic, Inc. ABSTRACT: Microseismic monitoring of re-fracturing
ractical Geomechanics for Unconventional Resources
 P ractical Geomechanics for Unconventional Resources 24-26 October 2012, Calgary, Canada Practical Geomechanics for Unconventional Resources Nowadays, unconventional resources have been brought into the
Practical Geomechanics
 www.bakerhughes.com Practical Geomechanics Baker Hughes - RDS Geomechanics Services 2015 Baker Hughes Incorporated. All rights reserved Copyright By accepting these materials you agree that all materials
ANALYSIS OF VERTICAL GROWTH OF FRACTURES IN FRAC PACK OPERATIONS IN RESERVOIR ROCKS
 ANALYSIS OF VERTICAL GROWTH OF FRACTURES IN FRAC PACK OPERATIONS IN RESERVOIR ROCKS Paulo Dore Fernandes PETROBRAS S. A., Centro de Pesquisas - CENPES Rio de Janeiro, RJ Paulo Roberto Ribeiro Universidade
M. Y Soliman, PhD, PE, NAI Ali Rezaei
 Role of Geomechanics in Production enhancement in Conventional and Unconventional Reservoirs M. Y. Soliman, PhD, PE, NAI and University of Houston UH Petroleum Engineering Department Energy Research Park
Hydraulic Fracture Mechanics
 Hydraulic Fracture Mechanics Peter Valk6 and Michael J. Economides Texas A & M University, College Station, USA JOHN WILEY & SONS Chichester New York Brisbane Toronto Singapore CONTENTS Preface Ust of
IMPROVED RESERVOIR ACCESS THROUGH REFRACTURE TREATMENTS IN TIGHT GAS SANDS AND GAS SHALES
 IMPROVED RESERVOIR ACCESS THROUGH REFRACTURE TREATMENTS IN TIGHT GAS SANDS AND GAS SHALES Mukul M. Sharma The University of Texas at Austin Petroleum and Geosystems Engineering April 15, 2009 Outline Project
Discrete Element Modeling of Thermo-Hydro-Mechanical Coupling in Enhanced Geothermal Reservoirs
 PROCEEDINGS, Thirty-Eighth Workshop on Geothermal Reservoir Engineering Stanford University, Stanford, California Discrete Element Modeling of Thermo-Hydro-Mechanical Coupling in Enhanced Geothermal Reservoirs
THE EFFECT OF THERMOELASTIC STRESS CHANGE IN THE NEAR WELLBORE REGION ON HYDRAULIC FRACTURE GROWTH
 PROCEEDINGS, Thirty-Seventh Workshop on Geothermal Reservoir Engineering Stanford University, Stanford, California, 30 Jan 2011-1 Feb 2012 THE EFFECT OF THERMOELASTIC STRESS CHANGE IN THE NEAR WELLBORE
INCORPORATING RIGOROUS HEIGHT DETERMINATION INTO UNIFIED FRACTURE DESIGN. A Thesis TERMPAN PITAKBUNKATE
 INCORPORATING RIGOROUS HEIGHT DETERMINATION INTO UNIFIED FRACTURE DESIGN A Thesis by TERMPAN PITAKBUNKATE Submitted to the Office of Graduate Studies of Texas A&M University in partial fulfillment of the
Module 5: Failure Criteria of Rock and Rock masses. Contents Hydrostatic compression Deviatoric compression
 FAILURE CRITERIA OF ROCK AND ROCK MASSES Contents 5.1 Failure in rocks 5.1.1 Hydrostatic compression 5.1.2 Deviatoric compression 5.1.3 Effect of confining pressure 5.2 Failure modes in rocks 5.3 Complete
FLUID FLOW MODELING IN MULTI-STAGE HYDRAULIC FRACTURING PATTERNS FOR PRODUCTION OPTIMIZATION IN SHALE RESERVOIRS
 FLUID FLOW MODELING IN MULTI-STAGE HYDRAULIC FRACTURING PATTERNS FOR PRODUCTION OPTIMIZATION IN SHALE RESERVOIRS by Abdulraof Almulhim A thesis submitted to the Faculty and Board of Trustees of the Colorado
Exploring the physicochemical processes that govern hydraulic fracture through laboratory experiments
 ARMA 12-678 Exploring the physicochemical processes that govern hydraulic fracture through laboratory experiments Alpern, J. S., Marone, C. J. and Elsworth, D. College of Earth and Mineral Sciences, The
Brittle Deformation. Earth Structure (2 nd Edition), 2004 W.W. Norton & Co, New York Slide show by Ben van der Pluijm
, 2004 W.W. Norton & Co, New York Slide show by Ben van der Pluijm") Lecture 6 Brittle Deformation Earth Structure (2 nd Edition), 2004 W.W. Norton & Co, New York Slide show by Ben van der Pluijm WW Norton, unless noted otherwise Brittle deformation EarthStructure (2 nd
Lecture 6 Brittle Deformation Earth Structure (2 nd Edition), 2004 W.W. Norton & Co, New York Slide show by Ben van der Pluijm WW Norton, unless noted otherwise Brittle deformation EarthStructure (2 nd
Geomechanics for Unconventionals Series, Vol III:
 Geomechanics for Unconventionals Series, Vol III: Hydraulic Fracturing: Of Magic and Engineering By Dr. Neal B. Nagel Part 1 Several years ago, I attended an industry conference where a well-known rock
Analysis of stress variations with depth in the Permian Basin Spraberry/Dean/Wolfcamp Shale
 ARMA 15-189 Analysis of stress variations with depth in the Permian Basin Spraberry/Dean/Wolfcamp Shale Xu, Shaochuan and Zoback, M.D. Stanford University, Stanford, California, USA Copyright 2015 ARMA,
Sand Control Rock Failure
 Sand Control Rock Failure Why? A bit of Mechanics on rock failure How? Some choices that depend on the rock What is moving? Sand grains? Fines? 3/14/2009 1 Young s Modulus, E Young s Modulus is a material
Optimal Perforation Location and Limited entry design for Promoting Simultaneous Growth of Multiple Hydraulic Fractures
 SPE-179158-MS Optimal Perforation Location and Limited entry design for Promoting Simultaneous Growth of Multiple Hydraulic Fractures Cheng Cheng and Andrew P. Bunger, University of Pittsburgh; Anthony
This paper was prepared for presentation at the Unconventional Resources Technology Conference held in San Antonio, Texas, USA, 1-3 August 2016.
 URTeC: 2461621 Determining Maximum Horizontal Stress With Microseismic Focal Mechanisms Case Studies in the Marcellus, Eagle Ford, Wolfcamp Alireza Agharazi*, MicroSeismic Inc. Copyright 2016, Unconventional
Analysis of Fracture Propagation under Thermal Stress in Geothermal Reservoirs
 Proceedings World Geothermal Congress 2015 Melbourne, Australia, 19-25 April 2015 Analysis of Fracture Propagation under Thermal Stress in Geothermal Reservoirs Ahmad Ghassemi, Sergej Tarasovs Mailing
Understanding the Mechanical Behavior of Drilling-induced Tensile Fractures through Photoelasticity Lab Tests Conducted on Glass Cubes
 Understanding the Mechanical Behavior of Drilling-induced Tensile Fractures through Photoelasticity Lab Tests Conducted on Glass Cubes Qing Jia, Douglas R. Schmitt, Randy Kofman and Xiwei Chen University
Microseismic Geomechanical Modelling of Asymmetric Upper Montney Hydraulic Fractures
 Microseismic Geomechanical Modelling of Asymmetric Upper Montney Hydraulic Fractures Drew Chorney, Byungtark Lee, Shawn Maxwell (IMaGE) Summary Geomechanical modelling is a powerful tool to quantitatively
A Better Modeling Approach for Hydraulic Fractures in Unconventional Reservoirs
 A Better Modeling Approach for Hydraulic Fractures in Unconventional Reservoirs OUTLINE Numerical Simulation: Comparison of Conventional and NEW Approaches NEW Approach as a Modeling Tool (understanding
FRACTURE REORIENTATION IN HORIZONTAL WELL WITH MULTISTAGE HYDRAULIC FRACTURING
 SPE Workshop OILFIELD GEOMECHANICS Slide 1 FRACTURE REORIENTATION IN HORIZONTAL WELL WITH MULTISTAGE HYDRAULIC FRACTURING A. Pimenov, R. Kanevskaya Ltd. BashNIPIneft March 27-28, 2017 Moscow, Russia Slide
Lab-scale Investigation of a Multi Well Enhanced Geothermal Reservoir
 PROCEEDINGS, 43rd Workshop on Geothermal Reservoir Engineering Stanford University, Stanford, California, February 12-14, 2018 SGP-TR-213 Lab-scale Investigation of a Multi Well Enhanced Geothermal Reservoir
Strength, creep and frictional properties of gas shale reservoir rocks
 ARMA 1-463 Strength, creep and frictional properties of gas shale reservoir rocks Sone, H. and Zoback, M. D. Stanford University, Stanford, CA, USA Copyright 21 ARMA, American Rock Mechanics Association
An Open Air Museum. Success breeds Success. Depth Imaging; Microseismics; Dip analysis. The King of Giant Fields WESTERN NEWFOUNDLAND:
 VOL. 7, NO. 4 2010 GEOSCIENCE & TECHNOLOGY EXPLAINED GEO EXPRO VOL. 7, NO. 4 2010 Success breeds Success geoexpro.com Country Profile: Senegal Ocean Bottom Node Seismic WESTERN NEWFOUNDLAND: An Open Air
Microdeformation: combining direct fracture height measurement with microseismic response Natalia Verkhovtseva, Greg Stanley
 Microdeformation: combining direct fracture height measurement with microseismic response Natalia Verkhovtseva, Greg Stanley Principal Geophysicist Pinnacle a Halliburton service Outline Introduction Microseismic
Optimized Recovery from Unconventional Reservoirs: How Nanophysics, the Micro-Crack Debate, and Complex Fracture Geometry Impact Operations
 Optimized Recovery from Unconventional Reservoirs: How Nanophysics, the Micro-Crack Debate, and Complex Fracture Geometry Impact Operations Salt Lake City Bratislava Calgary Houston Jammu London Sydney
Keys to Successful Multi-Fractured Horizontal Wells In Tight and Unconventional Reservoirs
 Keys to Successful Multi-Fractured Horizontal Wells In Tight and Unconventional Reservoirs Presented by: Larry K. Britt NSI Fracturing & Britt Rock Mechanics Laboratory Key Questions for Horizontal Success
Microseismic data illuminate fractures in the Montney
 Spectraseis White Paper August 16, 2012 2013 Spectraseis Microseismic data illuminate fractures in the Montney Brad Birkelo and Konrad Cieslik, Spectraseis High-quality data reveal fracture orientation
TRANSIENT AND PSEUDOSTEADY-STATE PRODUCTIVITY OF HYDRAULICALLY FRACTURED WELL. A Thesis ARDHI HAKIM LUMBAN GAOL
 TRANSIENT AND PSEUDOSTEADY-STATE PRODUCTIVITY OF HYDRAULICALLY FRACTURED WELL A Thesis by ARDHI HAKIM LUMBAN GAOL Submitted to the Office of Graduate Studies of Texas A&M University in partial fulfillment
Revitalizing Mature Fields
 JOURNAL OF PETROLEUM TECHNOLOGY www.jptonline.org OCTOBER 2012 O C TO B E R 2 0 1 2 VO LU M E 6 4, N U M B E R 1 0 Revitalizing Mature Fields Field Development Projects Tight Reservoirs Knowledge Management
J.V. Herwanger* (Ikon Science), A. Bottrill (Ikon Science) & P. Popov (Ikon Science)
, A. Bottrill (Ikon Science) & P. Popov (Ikon Science)") 29829. One 4D geomechanical model and its many applications J.V. Herwanger* (Ikon Science), A. Bottrill (Ikon Science) & P. Popov (Ikon Science) Main objectives (i) Field case study demonstrating application
29829. One 4D geomechanical model and its many applications J.V. Herwanger* (Ikon Science), A. Bottrill (Ikon Science) & P. Popov (Ikon Science) Main objectives (i) Field case study demonstrating application
NOTICE CONCERNING COPYRIGHT RESTRICTIONS
 NOTICE CONCERNING COPYRIGHT RESTRICTIONS This document may contain copyrighted materials. These materials have been made available for use in research, teaching, and private study, but may not be used
Tensile stress strain curves for different materials. Shows in figure below
 Tensile stress strain curves for different materials. Shows in figure below Furthermore, the modulus of elasticity of several materials effected by increasing temperature, as is shown in Figure Asst. Lecturer
Exercise: concepts from chapter 8
 Reading: Fundamentals of Structural Geology, Ch 8 1) The following exercises explore elementary concepts associated with a linear elastic material that is isotropic and homogeneous with respect to elastic
Keywords Mechanics, Extraction, Perforation, Fracturing ε = Strain Summary
 Coal Bed Methane Geo-mechanics - Field Experiences & Developing a Computer Application Pushpa Sharma*, Shivam Saxena, Amritansh Tripathi, Abhilasha Bhatnagar, Divya Singhal, Ishita Mathur; University of
Modeling of Propagation of Interacting Cracks Under Hydraulic Pressure Gradient. Hai Huang, Earl Mattson and Rob Podgorney
 Proceedings World Geothermal Congress 2015 Melbourne, Australia, 19-25 April 2015 Modeling of Propagation of Interacting Cracks Under Hydraulic Pressure Gradient Hai Huang, Earl Mattson and Rob Podgorney
Integrated Approach to Drilling Project in Unconventional Reservoir Using Reservoir Simulation
 Integrated Approach to Drilling Project in Unconventional Reservoir Using Reservoir Simulation Jerzy Stopa 1,*, Rafał Wiśniowski 1, Paweł Wojnarowski 1, Damian Janiga 1, and Krzysztof Skrzypaszek 1 1 AGH
Call for Papers. Hydraulic Fracturing Special Issue
 Call for Papers Hydraulic Fracturing Special Issue Hydraulic fracturing of ultra-low and low permeability reservoirs has become the hottest energy-related topic within the oil and gas community as well
ractical Geomechanics for Oil & Gas Industry
 P ractical Geomechanics for Oil & Gas Industry Practical Geomechanics for Oil and Gas Industry The integrity of the wellbore plays an important role in petroleum operations including drilling, completion
Numerical Analysis on the Interaction between Two Zipper Frac Wells with Continuum Damage Model
 Copyright 2013 Tech Science Press SL, vol.9, no.1, pp.1-22, 2013 Numerical Analysis on the Interaction between Two Zipper Frac Wells with Continuum Damage Model Xinpu Shen 1 Abstract: Zipper fracturing
Integrating Lab and Numerical Experiments to Investigate Fractured Rock
 Integrating Lab and Numerical Experiments to Investigate Fractured Rock Bradford H. Hager Director, Earth Resources Laboratory and Cecil and Ida Green Professor Department of Earth, Atmospheric and Planetary
SPE DISTINGUISHED LECTURER SERIES is funded principally through a grant of the SPE FOUNDATION
 SPE DISTINGUISHED LECTURER SERIES is funded principally through a grant of the SPE FOUNDATION The Society gratefully acknowledges those companies that support the program by allowing their professionals
The Frictional Regime
 The Frictional Regime Processes in Structural Geology & Tectonics Ben van der Pluijm WW Norton+Authors, unless noted otherwise 1/25/2016 10:08 AM We Discuss The Frictional Regime Processes of Brittle Deformation
Reservoir Flow Properties Fundamentals COPYRIGHT. Introduction
 Reservoir Flow Properties Fundamentals Why This Module is Important Introduction Fundamental understanding of the flow through rocks is extremely important to understand the behavior of the reservoir Permeability
If your model can t do this, why run it?
 FRACTURE MODEL DESIGN MODEL REQUIREMENTS Describe/Include the basic physics of all important processes Ability to predict (not just mimic) job results Provide decision making capability Understand what
Effect Of The In-Situ Stress Field On Casing Failure *
 Effect Of The In-Situ Stress Field On Casing Failure * Tang Bo Southwest Petroleum Institute, People's Republic of China Lian Zhanghua Southwest Petroleum Institute, People's Republic of China Abstract
Finite Element Solution of Nonlinear Transient Rock Damage with Application in Geomechanics of Oil and Gas Reservoirs
 Finite Element Solution of Nonlinear Transient Rock Damage with Application in Geomechanics of Oil and Gas Reservoirs S. Enayatpour*1, T. Patzek2 1,2 The University of Texas at Austin *Corresponding author:
Modeling pressure response into a fractured zone of Precambrian basement to understand deep induced-earthquake hypocenters from shallow injection
 Modeling pressure response into a fractured zone of Precambrian basement to understand deep induced-earthquake hypocenters from shallow injection S. Raziperchikolaee 1 and J. F. Miller 1 Abstract Analysis
A PKN HYDRAULIC FRACTURE MODEL STUDY AND FORMATION PERMEABILITY DETERMINATION. A Thesis JING XIANG
 A PKN HYDRAULIC FRACTURE MODEL STUDY AND FORMATION PERMEABILITY DETERMINATION A Thesis by JING XIANG Submitted to the Office of Graduate Studies of Texas A&M University in partial fulfillment of the requirements
Practical methodology for inclusion of uplift and pore pressures in analysis of concrete dams
 Practical methodology for inclusion of uplift and pore pressures in analysis of concrete dams Michael McKay 1 and Francisco Lopez 2 1 Dams Engineer, GHD Pty 2 Principal Dams/Structural Engineer, GHD Pty
Geomechanical controls on fault and fracture distribution with application to structural permeability and hydraulic stimulation
 CSPG Luncheon Calgary February 5 th 2015 Geomechanical controls on fault and fracture distribution with application to structural permeability and hydraulic stimulation Scott Mildren - Ikon Science Australian
Summary. Introduction
 Time-lapse seismic data-calibrated geomechanical model reveals hydraulic fracture re-orientation Jorg V. Herwanger*, Farid R. Mohamed, Robert Newman (Schlumberger), and Ole Vejbæk (Hess) Summary The orientation
Tensor character of pore pressure/stress coupling in reservoir depletion and injection
 Tensor character of pore pressure/stress coupling in reservoir depletion and injection Müller, B., Altmann, J.B., Müller, T.M., Weißhardt, A., Shapiro, S., Schilling, F.R., Heidbach, O. Geophysical Institute
THE FIRST SUCSESSFUL MULTI STAGED FRACTURING IN A DEEP VOLCANIC GAS RESERVOIR IN JAPAN
 THE FIRST SUCSESSFUL MULTI STAGED FRACTURING IN A DEEP VOLCANIC GAS RESERVOIR IN JAPAN Hiromi Sugiyama, Teikoku oil, co., ltd. Abstract The first multi-stage completion in a deep, hot, and naturally fractured
Coalbed Methane Properties
 Coalbed Methane Properties Subtopics: Permeability-Pressure Relationship Coal Compressibility Matrix Shrinkage Seidle and Huitt Palmer and Mansoori Shi and Durucan Constant Exponent Permeability Incline
DISCRETE FRACTURE NETWORK MODELLING OF HYDRAULIC FRACTURING IN A STRUCTURALLY CONTROLLED AREA OF THE MONTNEY FORMATION, BC
 DISCRETE FRACTURE NETWORK MODELLING OF HYDRAULIC FRACTURING IN A STRUCTURALLY CONTROLLED AREA OF THE MONTNEY FORMATION, BC Steve Rogers Golder Associates Ltd Pat McLellan McLellan Energy Advisors Inc Gordon
This paper was prepared for presentation at the Unconventional Resources Technology Conference held in San Antonio, Texas, USA, 1-3 August 2016.
 URTeC: 2444366 Using Depletion-Zone Microseismicity to Understand Producing Volumes Jonathan P. McKenna*, Michael H. Grealy, Michael S. Blaz and Nathan M. Toohey, MicroSeismic, Inc. Copyright 2016, Unconventional
Production-induced stress change in and above a reservoir pierced by two salt domes: A geomechanical model and its applications
 Production-induced stress change in and above a reservoir pierced by two salt domes: A geomechanical model and its applications Peter Schutjens, Jeroen Snippe, Hassan Mahani, Jane Turner, Joel Ita and
PART I Hot Dry Rock Geothermal Energy: History and Potential of the Newest and Largest Renewable Energy Resource
 Contents PART I Hot Dry Rock Geothermal Energy: History and Potential of the Newest and Largest Renewable Energy Resource Chapter 1 Serendipity A Brief History of Events Leading to the Hot Dry Rock Geothermal
Focal Mechanism Analysis of a Multi-lateral Completion in the Horn River Basin
 Focal Mechanism Analysis of a Multi-lateral Completion in the Horn River Basin Paige Snelling*, Cameron Wilson, MicroSeismic Inc., Calgary, AB, Canada psnelling@microseismic.com Neil Taylor, Michael de
The Stability Of Fault Systems In The South Shore Of The. St. Lawrence Lowlands Of Québec Implications For Shale Gas Development
 The Stability Of Fault Systems In The South Shore Of The St. Lawrence Lowlands Of Québec Implications For Shale Gas Development John Brodylo, Jean-Yves Chatellier,Guillaume Matton & Michel Rheault Copyright
LECTURE NO. 4-5 INTRODUCTION ULTRASONIC * PULSE VELOCITY METHODS
 LECTURE NO. 4-5 ULTRASONIC * PULSE VELOCITY METHODS Objectives: To introduce the UPV methods To briefly explain the theory of pulse propagation through concrete To explain equipments, procedures, calibrations,
Chapter 7. Highlights:
 Chapter 7 Highlights: 1. Understand the basic concepts of engineering stress and strain, yield strength, tensile strength, Young's(elastic) modulus, ductility, toughness, resilience, true stress and true
A new methodology for estimating field horizontal stress from microseismic focal mechanisms
 A new methodology for estimating field horizontal stress from microseismic focal mechanisms Alireza Agharazi 1*, Peter Duncan 1 and Michael Thornton 1 introduce a new methodology for the estimation of
Mechanics of Earthquakes and Faulting
 Mechanics of Earthquakes and Faulting www.geosc.psu.edu/courses/geosc508 Surface and body forces Tensors, Mohr circles. Theoretical strength of materials Defects Stress concentrations Griffith failure
Geodynamics. Measuring stress and strain Lecture How is stress measured? Lecturer: David Whipp
 Geodynamics Measuring stress and strain Lecture 4.2 - How is stress measured? Lecturer: David Whipp david.whipp@helsinki.fi Geodynamics www.helsinki.fi/yliopisto 1 Goals of this lecture Introduce several
Rock Mechanics Laboratory Tests for Petroleum Applications. Rob Marsden Reservoir Geomechanics Advisor Gatwick
 Rock Mechanics Laboratory Tests for Petroleum Applications Rob Marsden Reservoir Geomechanics Advisor Gatwick Summary A wide range of well established and proven laboratory tests are available for petroleum
Proppant Transport & Screenout Behavior. R.D. Barree
 Proppant Transport & Screenout Behavior R.D. Barree In this session Look at traditional proppant transport and its assumptions Look at common remedies for early screenout What factors actually affect proppant
Finite Element Simulation of Fracture Initiation Pressure of Coal Seam Gas Well Perforation Completion
 Finite Element Simulation of Fracture Initiation Pressure of Coal Seam Gas Well Perforation Completion Tong Du a, Jize Zuo b School of Petroleum Engineering, Northeast Petroleum University, Daqing 163318,
The Effect of Stress Arching on the Permeability Sensitive Experiment in the Su Lige Gas Field
 The Effect of Stress Arching on the Permeability Sensitive Experiment in the Su Lige Gas Field Fanliao Wang, Xiangfang Li, Gary Couples, Mingchuan Wang, Yiqun Zhang and Jingjing Zhao THE EFFECT OF STRESS
Wellbore stability analysis in porous carbonate rocks using cap models
 Wellbore stability analysis in porous carbonate rocks using cap models L. C. Coelho 1, A. C. Soares 2, N. F. F. Ebecken 1, J. L. D. Alves 1 & L. Landau 1 1 COPPE/Federal University of Rio de Janeiro, Brazil
DOWN-HOLE SEISMIC SURVEY AND VERTICAL ELECTRIC SOUNDINGS RABASKA PROJECT, LÉVIS, QUÉBEC. Presented to :
 DOWN-HOLE SEISMIC SURVEY AND VERTICAL ELECTRIC SOUNDINGS RABASKA PROJECT, LÉVIS, QUÉBEC Presented to : TERRATECH 455, René-Lévesque Blvd. West Montreal, Québec HZ 1Z3 Presented by : GEOPHYSICS GPR INTERNATIONAL
Chapter 4 STRESSES AROUND BOREHOLE:BOREHOLE INSTABILITY CRITERIA
 Chapter 4 STRESSES AROUND BOREHOLE:BOREHOLE INSTABILITY CRITERIA 4.1 NEAR WELLBORE STRESS- STATE Before drilling, rock stress is described by the in-situ stresses and effective stresses. As the hole is
and a contribution from Offshore Europe
 Primary funding is provided by The SPE Foundation through member donations and a contribution from Offshore Europe The Society is grateful to those companies that allow their professionals to serve as
AE3610 Experiments in Fluid and Solid Mechanics TRANSIENT MEASUREMENTS OF HOOP STRESSES FOR A THIN-WALL PRESSURE VESSEL
 Objective AE3610 Experiments in Fluid and Solid Mechanics TRANSIENT MEASUREMENTS OF OOP STRESSES FOR A TIN-WA PRESSURE VESSE This experiment will allow you to investigate hoop and axial stress/strain relations
A THREE-DIMENSIONAL STOCHASTIC FRACTURE NETWORK MODEL FOR GEOTHERMAL RESERVOIR STIMULATION
 PROCEEDINGS, Thirty-Sixth Workshop on Geothermal Reservoir Engineering Stanford University, Stanford, California, January 31 - February 2, 2011 SGP-TR-191 A THREE-DIMENSIONAL STOCHASTIC FRACTURE NETWORK
4D stress sensitivity of dry rock frame moduli: constraints from geomechanical integration
 Title 4D stress sensitivity of dry rock frame moduli: constraints from geomechanical integration Authors Bloomer, D., Ikon Science Asia Pacific Reynolds, S., Ikon Science Asia Pacific Pavlova, M., Origin
Hydraulic Fracture Propagation in Unconventional Reservoirs: The Role of Bedding Plane
 Copyright 2012 Tech Science Press SL, vol.8, no.3, pp.173-191, 2012 Hydraulic Fracture Propagation in Unconventional Reservoirs: The Role of Bedding Plane Suling Wang 1, Yang Li 1, He Liu 2 and Minzheng
A NEW SERIES OF RATE DECLINE RELATIONS BASED ON THE DIAGNOSIS OF RATE-TIME DATA
 A NEW SERIES OF RATE DECLINE RELATIONS BASED ON THE DIAGNOSIS OF RATE-TIME DATA A Thesis by ANASTASIOS S. BOULIS Submitted to the Office of Graduate Studies of Texas A&M University in partial fulfillment
Optimization of Hydraulic Fracturing Fluid System in a Sand Oil Reservoir in Southwest of Iran
 Optimization of Hydraulic Fracturing Fluid System in a Sand Oil Reservoir in Southwest of Iran Reza Masoomi #1, Iniko Bassey #2, Dolgow S.V. #3, Fatemeh Shademanfard 4, Innocent Ugbong 5 # Department of
Reservoirs and Production
 Lesson Plan Page 1 Topic: Reservoirs and production Topic Overview: Porosity refers to the percentage of holes (pores) in the rock. Permeability is the ability of fluids to travel through porous rocks.
Chapter 6. Conclusions. 6.1 Conclusions and perspectives
 Chapter 6 Conclusions 6.1 Conclusions and perspectives In this thesis an approach is presented for the in-situ characterization of rocks in terms of the distribution of hydraulic parameters (called SBRC
A Numerical Study on the Effect of Anisotropy on Hydraulic Fractures
 Rock Mechanics and Rock Engineering (219) 52:591 69 https://doi.org/1.17/s63-17-1362-4 ORIGINAL PAPER V. Valliappan 1 J. J. C. Remmers 1 A. Barnhoorn 2 D. M. J. Smeulders 1 Received: 3 April 217 / Accepted: