Report Compiled by: 1 st Reviewer: Contributed and 2 nd Reviewer: Felix Chiramba Qiniso Potgieter Divan de Beer Duncan Lees Jaco J.
|
|
|
- Hope Stafford
- 5 years ago
- Views:
Transcription

1 Saxum Project and Reference Number: DEL Report Prepared for and Distributed to: Private Bag X0002 Delmas, 2210 REPORT ROCK ENGINEERING ASSESSMENT OF THE UNDERGROUND WORKINGS BENEATH THE DELMAS COAL DISCARD DUMP - AUGUST Report Compiled by: 1 st Reviewer: Contributed and 2 nd Reviewer: Felix Chiramba Qiniso Potgieter Divan de Beer Duncan Lees Jaco J. van Vuuren BSc. (Hons.) Mining MSc. Env. Management COMREC, COMSCC ASANIRE B.Sc. Geology & Chemistry COMSCC (Coal) STRATA2, 3 N4 Mech. Eng. B.Sc. (Hons.) Eng. Geology COMREC (Coal), MSANIRE, MSAIMM GDE (Mining) N.H. Dip (Coal Mining) AREC, COMREC (Coal) MSAIMM; MSANIRE; MMVS SAXUM MINING & TRADING C-C PO Box Unit 18, Building 6, Visiomed Office Park Tel: saxum@saxummining.co.za Linden, Beyers Naudé Drive Fax: Web: Johannesburg Blackheath Ext. 1, 2195 Cell:
2 ii Table of Contents 1 INTRODUCTION TERMS OF REFERENCE INFORMATION PROVIDED GEOLOGY Major Geological Structures /Features MINING PARAMETERS RISK FACTORS METHODOLOGY OF ASSESSING PILLAR STABILITY Pillar Load Pillar Strength Pillar Width to Height Ratio Pillar Factor of Safety (FOS) Multi-seam Considerations RISK ASSESSMENT Risk Matrix Analytical Analysis Area A (Baseline Conditions) Area B (Baseline Conditions) Variation of FOS with Theoretical Dump Heights PILLAR STABILITY ASSESSMENT (NUMERICAL MODELLING) Model parameters... 26
3 iii 9.2 Model Output Section A-A LAMODEL Output Section B-B LAMODEL Output Section D-D LAMODEL Output Section C-C LAMODEL Output CONCLUSIONS REFERENCES List of Figures Figure 1-1 Delmas Coal Discard Dump... 1 Figure 1-2 Delmas Discard Dump with No. 2 Seam and No. 4 Seam Outline... 2 Figure 1-3 Delmas Coal s No. 2 Seam in Relation to the Discard Dump... 2 Figure 1-4 Delmas Coal s No. 4 Seam in Relation to the Discard Dump... 3 Figure 1-5 Section D-D Through the Dump in an East West Direction Showing Seam Positions... 3 Figure 4-1 Delmas Discard Dump Area Stratigraphic Representation... 6 Figure 4-2 Delmas Discard Dump Area: No. 4 and No. 2 Seam Parting Thickness... 7 Figure 4-3 Top Dolerite Sill Average Thickness... 8 Figure 4-4 Bottom Dolerite Sill Average Thickness... 8 Figure 4-5 Borehole H Figure 4-6 Borehole H Figure 4-7 Borehole H Figure 4-8 Borehole H Figure 4-9 Borehole H Figure 8-1 Panels Assessed for Stability in Relation to No. 2 Seam Workings... 16
4 iv Figure 8-2 No. 2 Seam Pillar FOS Calculation for Area A Excluding Dump Influence Figure 8-3 Panels Assessed for Stability in Relation to No. 4 Seam Workings Figure 8-4 No. 4 Seam Pillar FOS Calculation for Area A Excluding Dump Influence Figure 8-5 No 2 Seam Pillar FOS Calculation for Area B Excluding Dump Influence Figure 8-6 No 4 Seam Pillar FOS Calculation for Area B Excluding Dump Influence Figure 8-7 Variation of Pillar FOS vs Dump Height for the No. 2 Seam Figure 8-8 Variation of Pillar FOS vs Dump Height for the No. 4 Seam Figure 9-1 Plan Showing the LAMODEL Cross Section Positions Figure 9-2 Overburden Stress on the No. 2 Seam Workings: without Dump (Multi-Seam Mined) Figure 9-3 Overburden Stress on the No. 4 Seam Workings: without Dump (Multi-Seam Mined) Figure 9-4 Overburden Stress on No. 4 Seam & No. 2 Seams without mining, including Dump Figure 9-5 No. 4 Seam Pillar Stress Simulation (LAMODEL) Figure 9-6 No. 2 Seam Pillar Stress Simulation (LAMODEL) Figure 9-7 No. 4 Seam Pillar Stress Calculation on Cross Section along the Y-Axis on A-A Figure 9-8 No. 4 Seam Pillar Stress Calculation on Cross Section along the Y-Axis On E-E Figure 9-9 No. 2 Seam Pillar Stress Calculation on Cross Section along the Y-Axis on A-A Figure 9-10 No. 4 Seam Pillar Stress Calculation on Cross Section along the X-Axis on B-B (From LAMODEL Results) Figure 9-11 No. 2 Seam Pillar Stress Calculation on Cross Section Along the X-Axis on B-B Figure 9-12 Cross Section along the X-Axis on D-D (From LAMODEL Results) Figure 9-13 No 2 Seam Pillar Stress Calculation on Cross Section along the X-Axis on D-D Figure 9-14 No. 2 Seam Pillar Stress Calculation on Cross Section along the X-Axis on D- D
5 v Figure 9-15 No. 4 Seam Cross Section Along The Y Axis On C-C (From LAMODEL Results) Figure 9-16 No. 2 Seam Cross Section along the Y Axis on C-C (From LAMODEL Results) List of Tables Table 4 1 Delmas Borehole Positions... 5 Table 5 1 Delmas Coal s Mining Parameters Table 7 1 Probability of Failure of Witbank Coalfield Table 8 1 Risk Matrix Table 8 2 No. 2 Seam Pillar FOS Calculation for Area A Excluding Dump Influence Table 8 3 No. 4 Seam Pillar FOS Calculation for Area A Excluding Dump Influence Table 8-4 No. 2 Seam Pillar FOS Calculation for Area B Excluding Dump Influence Table 8-5 No. 4 Seam Pillar FOS Calculation for Area B Excluding Dump Influence Table 8 6 Dump Height vs Pillar FOS No. 2 Seam Table 8 7 Dump Height vs Pillar FOS No. 4 Seam Table 9 1 Pillar FOS Calculation on 20m C in the No.4 Seam along the Y-Axis on A-A Table 9 2 No. 4 Seam Pillar Stress Calculation on Cross Section along the Y-Axis on A-A Table 9 3 No. 2 Seam Pillar FOS Calculation on 18m C along the Y-Axis on A-A Table 9 4 Pillar FOS Calculation on 18m C In the No.2 Seam Along The Y-Axis on A-A Table 9 5 No. 2 Seam Risk Rating along the Y-Axis on A-A Table 9 6 No. 4 Seam FOS Calculation on 20m C (Area A) Calculated on Section B-B Parallel to the X-Axis (From LAMODEL Results) Table 9 7 No. 4 Seam FOS Calculation on 15m C (Area B) Calculated on Section B-B Parallel to the X-Axis (From LAMODEL Results) Table 9 8 No. 2 Seam FOS Calculation Calculated on Section B-B Parallel to the X-Axis Table 9 9 No. 4 Seam FOS Calculation Calculated on Section D-D Parallel to the X-Axis Table 9 10 No 4 Seam Pillar FOS Calculation on 15m C along the X-Axis on D-D... 39
6 vi Table 9 11 No. 2 Seam FOS Calculation Calculated on Section D-D Parallel to the X-Axis Table 9 12 No 2 Seam Pillar FOS Calculation on 15m C along the X-Axis on D-D Table 9 13 No. 4 Seam FOS Calculation on Section C-C Parallel to the Y-Axis Table 9 14 No. 4 Seam Pillar FOS Calculation on 15m C along the Y-Axis on C-C Table 9 15 No. 2 Seam FOS Calculation On Section C-C Parallel To The Y-Axis Table 9 16 No. 2 Seam Pillar FOS Calculation on 16.5m C along the Y-Axis on C-C... 43

7 1 1 INTRODUCTION Delmas Coal requested Saxum Mining (Saxum) to conduct a rock engineering assessment of the underground workings that directly underlie the Discard Dump at Delmas Coal s North shaft complex. Both the No. 2 Seam and the No. 4 Seam have been worked directly underneath the Discard Dump. Figure 1-1 shows a photograph of the north-eastern side of the Delmas Coal Discard Dump. Figure 1-1 Delmas Coal Discard Dump The Discard Dump has an estimated footprint of ±82.5 hectares and a circumference of ±3500m with a height of ±40m above the original ground level. It s spatial location and areal extent are shown on plan in Figure 1-2. The plan also shows the outline of the mined No. 2 Seam (red) and the mined No. 4 Seam (green), North Shaft, South Shaft, Salomon Shaft positions as well as the Western and Southern Extension mining area, where mining activities are on-going on the No. 4 Seam. The plan in Figure 1-3 indicates the No. 2 Seam workings in relation to the discard dump and Figure 1-4 shows the spatial extent of the No. 4 Seam workings beneath the dump. The north shaft travel ways (blue dashed line) and conveyor belt way (solid line), are shown on the eastern toe of the discard dump. A section drawn through the dump in an east west (D-D) direction also depicts the seam positions as shown in Figure 1-5. This report aims to outline the possible risks associated with the discard dump located on top of the No. 4 and No. 2 Seam workings by analysing its influence on coal pillar and mine workings stability. The risk assessment serves to fulfil the employer s duties as per Section 17 (8) of the Mine Health and Safety Act, as documented in Section 2 (Terms of reference), of this report.
 North Shaft Footprint of the Discard Dump South Shaft Western")

8 2 No. 2 Seam outline (Red) No. 4 Seam outline (Green) North Shaft Footprint of the Discard Dump South Shaft Western Extension (current mining) Salomon Shaft Southern Extension (current mining) Figure 1-2 Delmas Discard Dump with No. 2 Seam and No. 4 Seam Outline Main Conveyor and Travelling Way Discard Dump Figure 1-3 Delmas Coal s No. 2 Seam in Relation to the Discard Dump


9 3 North Shaft Conveyor Belt Travel Way D Discard Dump D Figure 1-4 Delmas Coal s No. 4 Seam in Relation to the Discard Dump D D Figure 1-5 Section D-D Through the Dump in an East West Direction Showing Seam Positions
10 4 2 TERMS OF REFERENCE The Mine Health and Safety Act MHSA (Act 29 of 1996) regulation numbers 17.8 to as amended in 2011; stipulates: 17(8) No person may erect, establish or construct any buildings, roads, railways, dams, waste dumps, reserve land, excavations or any other structures whatsoever within a horizontal distance of 100 (one hundred) metres from workings, unless a lesser distance has been determined safe (a) in the case of the employer, by risk assessment and all restrictions and conditions determined in terms of the risk assessment are complied with; or (b) in the case of any other person, by a professional geotechnical specialist and all restrictions and conditions determined by him or her or by the Chief Inspector of Mines are complied with; 17(9) The person(s) responsible for activities in terms of regulations 17(7) (a) and 17(8) must: (a) In the case of an employer, provide the Chief Inspector of Mines with the distance and accompanying restrictions and conditions for comment, and; (b) In the case of other persons, provide the Chief Inspector of Mines with the distance and accompanying restrictions and conditions for approval. 17(10) No mining operations, erecting, establishment, or construction, as contemplated in regulations 17(7)(a) and 17(8) respectively, may take place until such written comment or approval, as referred to in 17(9)(a) and 17(9)(b), has been obtained. This report, therefore aims to outline the possible risks associated with having the discard dump on top of the No. 4 and No. 2 Seam workings to fulfil the employer s duties in terms of the Mine Health and Safety Act (Act 29 of 1996) as documented above. 3 INFORMATION PROVIDED The following information was provided by Delmas Coal for use in the assessment: Electronic files in DXF format containing the following: Available No. 2 Seam and No. 4 Seam mining and pillar layout plans, including existing underground workings, shaft positions, underground belt infrastructure, geological borehole locations, main travelling roads and major geological structures. Geological information in the form of borehole logs in Microsoft Excel format, obtained from the Delmas Database. Position of the discard dump with contours.
11 5 4 GEOLOGY The boreholes obtained from the Delmas boreholes database as listed in Table 4 1 below were used as the source of geological and geotechnical information for this investigation. A geological description of the overburden composition is missing on most of these boreholes as shown on the individual logs shown in Figure 4-5 to Figure 4-9. In the absence of these geological descriptions, borehole H52 is used to represent the general stratigraphy of the area under the discard dump as shown in Figure 4-1. In this area three coal seams are intersected; the No. 5 Seam higher up in the succession, the No. 4 Seam and No. 2 Seam at the bottom of the succession. At Delmas Coal the primary mining horizons are the No. 4 Lower Seam and the No. 2 Seam, both of which have been exploited, to one degree or another, via underground mining methods, beneath the discard dump in question. Borehole No. X Y ELEVATION H H H H H H H H H H H H M Table 4 1 Delmas Borehole Positions
12 6 Delmas Coal Borehole Log 0.00 H52 No core Dolerite No. 5 Seam Overburden SS No. 5 Seam coal Depth below surface (m) SS(carb.) No. 4 Seam Coal No. 5 Seam Sequence SS(carb.) Coal No. 4 Seam Sequence SS(carb.) No. 2 Seam Coal Tillite No. 2 Seam Sequence Figure 4-1 Delmas Discard Dump Area Stratigraphic Representation
13 7 The stratigraphy of the area is made up of four domains, the No. 5 Seam overburden, underlain by the No. 5 Seam sequence, the No. 4 Seam sequences and the basal No. 2 Seam sequence. The No. 5 Seam overburden is from the surface to the No. 5 Seam roof and is made up of weathered rock and soils zone. This is underlain by a dolerite intrusion, then laminated sandstone beds. The No. 5 Seam sequence includes the No. 5 Seam and its floor up to the No. 4 Seam roof and is made of a succession of sandstone and siltstones. The No. 4 Seam sequence extends from the No. 4 Seam roof to the No. 2 Seam roof. The No. 4 Seam thickness in this area varies from 1.8m to 3.2m with an average of 2.8m. The sequence is made up of a series of sandstones, siltstones, shales and mudstones which include the ±16m thick parting between the two seams as shown in Figure 4-2. Figure 4-2 Delmas Discard Dump Area: No. 4 and No. 2 Seam Parting Thickness Underlying the No. 4 Seam sequence is the basal No. 2 Seam sequence. This sequence comprises the No. 2 Seam with thickness that varies up to 7.61m in this area, but with an average thickness of 6.6m. The boreholes are drilled up to ±2m below the No. 2 Seam coal, intersecting only the Dwyka Tillite. 4.1 Major Geological Structures /Features The geological structures intersecting the No. 4 Seam have been identified from drill borehole data, airborne magnetometer and the mining of the No. 2 Seam. The main structures recognized are: The Stormberg-age dolerite sill; that dipping transgressive sill-like body that reaches a maximum thickness of approximately 40m in borehole H The sill generally occurs in the No. 5 Seam overburden, with the exception of boreholes H26908, H26911 and H26912, it intrudes the No. 4 Seam roof. The sill is not always a single stratigraphic member, but tends to split up into two or even three layers in places.


14 8 The sill intrusion in the discard dump area generally splits into two (2) layers namely the top sill and the bottom sill. The variation in the sill thickness underneath the dump area is shown in Figure 4-3 and Figure 4-4 for the top and bottom sill respectively. The average top sill thickness varies up to 40m with an average thickness of 8.5m, while the bottom sill varies up to 2.1m and with average thickness of 0.6m. No other major structures such as dykes and faults are known to exist within the area under investigation, or are expected to have an influence on the stability of the underground workings. Figure 4-3 Top Dolerite Sill Average Thickness Figure 4-4 Bottom Dolerite Sill Average Thickness
15 Delmas Coal Borehole Log H32 Soil Dolerite No core Dolerite No core Delmas Coal Borehole Log H33 Dolerite No Core Dolerite No core Delmas Coal Borehole Log H52 No core Dolerite SS Delmas Coal Borehole Log H53 No Core SS Coal Delmas Coal Borehole Log H54 Soil No Core Dolerite No core Dolerite No Core Depth below surface (m) Coal No Core No. 4 Seam Coal No core C No Core Dolerite No Core No. 4 Seam Coal No. 5 Seam coal SS(carb.) No. 4 Seam Coal SS(carb.) Coal SS(carb.) SS(carb.) No. 4 Seam Coal SS(carb.) Coal SS(carb.) No. 2 Seam Coal Coal No Core No. 4 Seam Coal No core No. 2 Seam Coal SS/Gritty No Core No. 2 Seam Coal Tillite No. 2 Seam Coal Tillite No. 2 Seam Coal SS Figure 4-5 Borehole H32 Figure 4-6 Borehole H33 Figure 4-7 Borehole H52 Figure 4-8 Borehole H53 Figure 4-9 Borehole H54
16 10 5 MINING PARAMETERS The available Delmas mining plans and information show that both the No. 2 and No. 4 Seams were mined beneath the discard dump. The mining of the No. 2 Seam at Delmas Coal predates the extraction of the No. 4 Seam by approximately 25 years. Conventional drill and blast methods were employed in the extraction of both the No. 2 and No. 4 Seam coal in the area underneath the discard dump. The No. 2 Seam was mined in the late 1970 s on assumed average bord width of ±6.5m (assumed at 7.0m to include pillar scaling) and a mining height of approximately 3.3m on average. The average mining depth on the No. 2 Seam has been estimated to be 81m based on the available survey peg information, the information available regarding the No. 2 Seam shaft area, as well as the surface contours which were provided. It is commonly known that both selective bottom and top coal mining of the No. 2 Seam occurred, however it cannot be ascertained based on available survey plan information as to the precise spatial locations of both practices. The No. 4 Seam was mined after the No. 2 Seam on pillar centres ranging from 15m on the eastern side to 20m on the western side. The average mining heights used in this investigation were estimated based on the mining heights indicated on the mining plans provided and the pillar centres were estimated based on measurements taken from the available survey plans. The mining parameters and intact coal material properties used are shown in Table 5 1. Mining Parameters Average Max Min Dump height N/A Depth to No. 4 Seam Depth to No. 2 Seam Parting thickness Mining height No. 4 Seam Mining height No. 2 Seam Bord width No. 4 Seam 7 N/A N/A Bord width No. 2 Seam 7 N/A N/A OVERBURDEN* Poisson's Ratio Elastic modulus (GPa) Lamination Thickness (m) 2 Vertical Stress Gradient MPa/m COAL** Coal Modulus (GPa) 4.12 N/A N/A Coal Strength (MPa) 7.2 N/A N/A Poisson's Ratio 0.22 N/A N/A Table 5 1 Delmas Coal s Mining Parameters
17 11 Mining depths to the floor of the respective seams were estimated using surface contours and given survey peg elevations as well as borehole information where available. Two separate mining blocks (A and B) were identified on both the No.2 Seam and the No. 4 Seam in the area below the discard dump, based on the designed pillar centres on the No. 4 Seam. The stability of the workings within each of these two blocks was subsequently analytically assessed. 6 RISK FACTORS The following rock engineering related, major risk factors have been identified: The risk of coal pillar failure below the discard dump within the No. 4 seam workings leading to property loss and possible loss of life or injury. The risk of roof /intersection failure within the No. 4 Seam leading to property/infrastructure damage and or personnel injury/death. A combination of both pillar failure and intersection failure under the dump affecting the areas where the belt and travelling roads are located leading to property/infrastructure damage and or personnel injury/death. The risk of coal pillar collapse/failure below the discard dump in the No. 2 Seam leading to coal pillar failure in the No. 4 Seam and consequently loss as described above. The environmental risks related to the possible fracturing of the overburden, damaging the water table and even influx of discard material into the groundwater system. These risks form the basis of this report and will be discussed and assessed in order to determine the risk beneath the dumps in the No. 4 and No. 2 Seam workings. 7 METHODOLOGY OF ASSESSING PILLAR STABILITY The underground workings beneath the discard dump are divided into blocks based on the original No. 4 Seam pillar centres. The blocks are numbered A and B and the best available mining parameters and assumptions per area are stated. Area A is characterised by predominantly 20m x 20m pillar centres on the No. 4 Seam, on the western half of the dump area, while Area B is made up of 15m x 15m pillar centres on the eastern half of the dump. The conventional pillar stability assessment using Salamon s revised pillar safety factor calculation method was used to calculate pillar stability in the respective areas. The simplified risk ratings for each stated area are completed based on the risk matrix as shown in Table 8 1.
18 12 A numerical analysis using the software LAMODEL (NIOSH) was also utilised to calculate the simulated stress distribution on the pillars with and without the dump. The model is validated or calibrated by comparing the output to results obtained from conventional pillar stability calculations using Salamon s revised pillar calculation method (Seam specific power formula). A risk matrix was devised to take into consideration the pillar factor of safety (FOS) and other relevant factors to arrive at a final risk rating whose magnitude can be used as a stability criterion. The following parameters were therefore used to arrive at a final risk rating: Pillar Centres; Bord Widths; Mining Heights; Mining Depths; Pillar Load; Pillar strength; Pillar Width to Height Ratios (w:h); Factor of Safety (FOS); Perceived Risk Category. 7.1 Pillar Load Pillar load is determined through applying the cover load or Tributary Area Theory (TAT), where each individual pillar is assumed to carry the weight of the overburden immediately above it. This assumption applies where the pillars are of uniform size and the panel width is larger than the depth to the seam, which is the case with these panels. The pillar load (q) for square pillars can be calculated from the formula below: = Where (γ) is the average specific weight of the overburden rock = MPa/m. H is the depth to the seam floor in metres. C is the coal pillar centre distances in metres. w is the coal pillar width in metres. 7.2 Pillar Strength A revision into the pillar safety factor calculation for South Africa, which include a coal seam specific pillar strength calculation for the different South African Coalfields was conducted by Salamon, M.D.G., Canbulat, I. and Ryder, J.A (2006), (Seam Specific Pillar Strength Formulae for South African Collieries, ARMA American Rock Mechanics Association). According to this revision, pillar strength (σ) is given by the following power formulae:
19 13 α σ= Kw β h Where: w and h represent the pillar width and mining height respectively, in metres, K, α and β were determined by statistical analysis, For the Witbank/ Highveld Seams 1, 2 and 4: K = MPa α = β = Pillar Width to Height Ratio According to Rusnak & Mark (2000), pillar failure can be divided into three categories depending on the w: h ratio: Slender pillars (w:h<3) which are subject to sudden collapse in a violent uncontrolled fashion with little residual strength in the pillar. They are prone to massive collapse when used over a large area in the absence of barrier pillars. Intermediate pillars (3<w:h<10) in which pillar failure is slow and controlled and can occur over an extended period of time. They have a high residual strength. Squat pillars (w:h>10) which are dominated more by roadway failures (sidewalls, roof and/or floor) affecting pillar stability more than actual pillar instability. These pillars are virtually indestructible due to their strain hardening characteristics. 7.4 Pillar Factor of Safety (FOS) The pillar safety factor is defined as: strength SF = σ i.e. ( SF= load ) q The factor of safety (FOS) represents the probability of a panel of pillars failing: the higher the FOS, the lower the probability of failure. Salamon (1967) thought it reasonable to suppose that the majority of mining engineers arrived at an acceptable compromise between safety and economic mining, with the optimum Safety Factor lying in the range where 50 per cent of the stable cases are most densely concentrated. For the cases studied by Salamon, this occurs between Safety Factors of 1.3 to 1.9 with the mean being 1.6 and it is this value that was recommended for the design of production pillars in South African bord and pillar workings. Table 7 1 shows the relationship between probability of failure and Factor of Safety for typical Witbank Coalfield pillars.
20 14 FOS Probability of Stability Pillar failures per Million Table 7 1 0% 50% 92% 99.5% 99.85% 99.99% Probability of Failure of Witbank Coalfield When consequences of failure are serious, a reduced probability of failure needs to be adopted in order to achieve the acceptable level of risk. For the Witbank and Highveld coalfields pillars where the in-situ coal strength is ±7.2MPa, those pillars with an observed minimum pillar safety factor of 0.5, have a 100 percent probability of failure (Van der Merwe, 1998). 7.5 Multi-seam Considerations The generally accepted guideline for multiple seam mining states that when the vertical distance between seams is more than 0.75 to 1 x centre distance, the alternating stress influence of bords and pillars becomes less of an influence (Salamon & Oravecz, 1976 and Bradbury & Lear, 1984, cited by Hill, R.W. 2006). The following basic guidelines were drafted for multi-seam mining: i. If the parting > 1.5 x pillar centre distance, then no superimposition is necessary. Pillar Safety Factor = 1.6. ii. If the parting > 0.75 x centre distance, then only the barrier pillars are superimposed. Pillar Safety Factor = 1.6. iii. If the parting > 2 x bord width, then the pillars must be superimposed and designed to a Safety Factor of 1.7. iv. If the parting < 2 x bord width then panel pillars must be superimposed. The Safety Factor of the pillar must be 1.8 with a combined Safety Factor of 1.4. Bradbury and Lear (1984) indicated in their work that this limiting distance (0.75C or 75% of the centre distance), at which the stresses above or below bord and pillar workings return to primitive stress values, decreases with depth and also decrease with increased pillar size. It is reported by Chekan & Matetic (1988) that in the case of rectangular pillars, the interactive distance is controlled by the least width of the pillar. In general, rectangular pillars transfer less load over a shorter distance than square pillars of equal load carrying capacity. Ehgartner (1982, cited by Hill, R.W. 2006) evaluated stress due to pillar loading using photoelastic models and found that the distance the stress was transferred depended on the nature of the rock above and below the pillar. In particular it was found that low modulus, stratified materials (shales) tended to increase the distance through which stress is transferred, while stiff isotropic materials (sandstone) had the opposite effect.
21 15 Therefore, the points stated above can be summarized into guidelines for determining risk, i.e. regarding pillar and panel stability: The superimposing of the No. 4 Seam pillars with the No. 2 Seam pillars, if the total parting width is less than 75% of the size of the pillar centres in the No. 2 Seam, determines the initial risk of pillar stability in both the No. 4 and No. 2 Seams. If the overall mining depth increases, the risk of pillars not superimposed for a parting in the region of 75% of the centre distance, can be reduced. For rectangular pillars this risk can be further reduced. In the presence of a significant and competent sandstone layer within the parting, the risk is further reduced. There are no superimposed panel pillars under the discard dump or anywhere else at Delmas Coal because the parting average thickness of ±16m is considered to be high enough not to warrant the practice. 8 RISK ASSESSMENT 8.1 Risk Matrix The following simplified risk matrix shown in Table 8 1 is used to quantify the risk for each of the two blocks on the No. 4 Seam. The subsequent section and sub-paragraphs briefly state the risks per block and provide a risk rating for the specific area. RISK RATING MATRIX LEVEL OF IMPACT SCORE CATEGORY LOW The areas where a possible collapse of the pillars is highly unlikely based on pillar survival probability 1 MEDIUM The area where pillar collapse is unlikely, typically (SF>1.3 to 1.6). 3 HIGH The areas where pillar collapse is possible (SF 1.3). 6 LIKELIHOOD LOW Based on knowledge at hand it is unlikely to occur. 1 MEDIUM Implies that the probability of the incident occurring cannot be ruled out. 2 HIGH Implies that the probability of the incident occurring is a definite, the time factor is however unknown. 3 CONSEQUENCE LOW Negligible surface subsidence. Invisible to the naked eye. 1 MEDIUM Pillar collapse on a localised area with possible damage to property/ injury to personnel. 2 HIGH Collapse spreading to other u/g workings outside the dump perimeter 3 Risk Rating = Category x Consequence x Likelihood RISK RATING SCORE HIGH >36 MEDIUM 12 to 36 LOW <12 Table 8 1 Risk Matrix

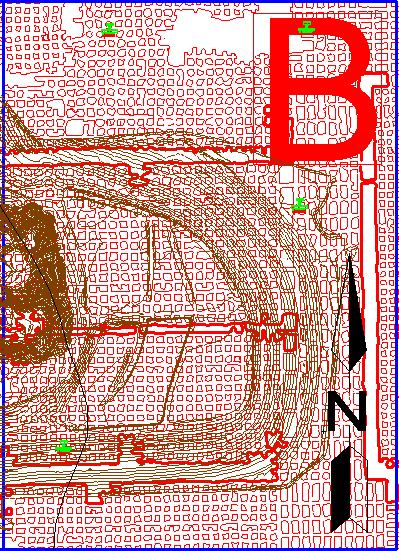
22 Analytical Analysis The underground workings beneath the discard dump are divided into blocks (A and B) as shown in Figure 8-1 roughly based on the original No. 4 Seam pillar centres of similar sizes. Area A is characterised by a mixture of 18m x 18m pillar centres and a few 16.5m x16.5m pillar centres on the No. 4 Seam on the western half of the dump area, while Area B is made up of 15m x 15m pillar centres on the eastern half of the dump. The simplified risk ratings for each stated area are completed based on the risk matrix which is shown in Table 8 1. In all the calculations to follow, the pillar centres and the mining parameters were obtained from the Delmas geotechnical hazard plan. The design bord width for Delmas Coal as stated in the Code of Practice (COP) is 6.8m, however in this study bord width of 7m was assumed. This bord width takes into consideration the effects of pillar scaling. Pillar centres were determined from the geotechnical hazard plan and the mining heights and mining depths determined from the available survey pegs. Figure 8-1 Panels Assessed for Stability in Relation to No. 2 Seam Workings
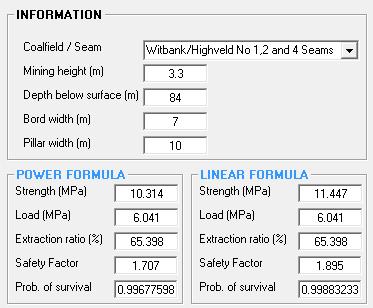
23 Area A (Baseline Conditions) Three safety factor values were calculated based on the mining depth from survey pegs and given contours. The factor of safety for the No. 2 Seam ranges from 1.48 to 1.71, the average FOS is 1.69 at the depth of 91m, with an equivalent pillar width of 17.5m. Based on the analytical calculations the No. 2 Seam workings in this area are considered to be medium risk with pillar survival probability of 0.985, as shown by the FOS calculation shown in Figure 8-2 and summarised in Table 8 2. Area A No. 2 Seam Parameter Mean Maximum Minimum Pillar centres (m) Bord width 7 Pillar width Pillar w:h ratio Mining depth(m) Mining height(m) Pillar FOS Pillar probability of survival Category Likelihood Consequence Risk rating Table 8 2 No. 2 Seam Pillar FOS Calculation for Area A Excluding Dump Influence


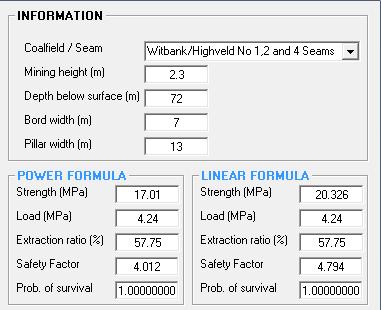
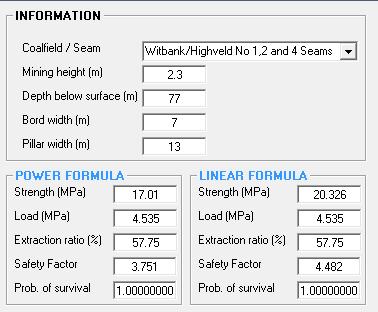
24 18 Figure 8-2 No. 2 Seam Pillar FOS Calculation for Area A Excluding Dump Influence The No. 4 Seam coal in Area A is mined at the depth ranging from 68m to 77m with an average depth of 72m. The FOS at 72m is 4.0 and the pillar probability of survival is 1, therefore based on these calculations the No. 4 Seam workings in this area are considered stable, the FOS calculations at three different depths are shown in Figure 8-4.
 72 77 68 Mining height(m) 2.3 2.3 2.3 Pillar FOS 4.0 4.2 3.7 Pillar probability of survival (%) Table 8 3 1.00 Risk category Likelihood Consequence Risk rating 1 2 2 4 No.")
25 19 Figure 8-3 Panels Assessed for Stability in Relation to No. 4 Seam Workings Area A No. 4 Seam Parameter Mean Maximum Minimum Pillar centres (m) 20 Bord width 7 Pillar width 13 Pillar w:h ratio 5.6 Mining depth(m) Mining height(m) Pillar FOS Pillar probability of survival (%) Table Risk category Likelihood Consequence Risk rating No. 4 Seam Pillar FOS Calculation for Area A Excluding Dump Influence


26 20 Figure 8-4 No. 4 Seam Pillar FOS Calculation for Area A Excluding Dump Influence
27 Area B (Baseline Conditions) Figure 8-5 shows the summarised No. 2 Seam mining parameters, the FOS is calculated for three different depth values. In this area the average depth to No. 2 Seam is 77m. The FOS ranges from 1.7 to 2.0 with average of 1.8 on 10m wide pillars. The No. 4 Seam is mined on 15m x 15m pillar centres in this area and 2.3m mining height as shown in Table 8-5. The calculated factor of safety ranges from 2.2 to 2.5. The average depth to floor of the No. 4 Seam in this area is 62m. Therefore the average FOS calculated using the average depth is 2.2. Area B No. 2 Seam Parameter Mean Maximum Minimum Pillar centres (m) Bord width Pillar width Pillar w:h ratio Mining depth(m) Mining height(m) Pillar FOS Pillar probability of survival Table 8-4 Risk category Likelihood Consequence Risk rating No. 2 Seam Pillar FOS Calculation for Area B Excluding Dump Influence Area B No. 4 Seam Parameter Mean Maximum Minimum Pillar centres (m) 15 Bord width 7 Pillar width 8 Pillar w:h ratio 3.4 Mining depth(m) Mining height(m) Pillar FOS Pillar probability of survival (%) 1 Risk category Likelihood Consequence Risk rating Table 8-5 No. 4 Seam Pillar FOS Calculation for Area B Excluding Dump Influence


28 22 Figure 8-5 No 2 Seam Pillar FOS Calculation for Area B Excluding Dump Influence


29 23 Figure 8-6 No 4 Seam Pillar FOS Calculation for Area B Excluding Dump Influence 8.1 Variation of FOS with Theoretical Dump Heights The pillar stabilities were recalculated for the two areas with a theoretical dump of varying heights as shown in Table 8 6 and Table 8 7. In calculating the underground workings stability parameters after dump placement it was assumed that the discard dump compaction is not the same as that of natural overburden therefore an overburden stress reduction factor of 0.5 was applied owing to its low bulk density. The estimated relative density for the dump is therefore estimated at ±1.23 t/m 3 whilst that of the in situ
30 24 overburden was estimated to be 2.45t/m 3. In other words 20m height of dump would exert as much load as 10m height of in situ overburden. The pillar FOS variation with depth of the discard dump is then calculated using the Coaltech coal seam specific power formula and the results graphically illustrated in Figure 8-7 for the No. 2 Seam workings. C Dump Height m Area A FOS H Total Depth (Area A) m Area B FOS H Total Depth (Area B) Table 8 6 Dump Height vs Pillar FOS No. 2 Seam C Dump Height m Area A FOS H Total Depth (Area A) m Area B FOS Total Depth (Area B) Table 8 7 Dump Height vs Pillar FOS No. 4 Seam Dump height vs FOS # 2 Seam Area A FOS Area B FOS Standard Safety Factor Pillar FOS Dump height (m) Figure 8-7 Variation of Pillar FOS vs Dump Height for the No. 2 Seam
31 25 From the calculations shown for the No. 2 Seam, it is apparent that if the dump height is increased beyond 40m, the pillar safety factors reduces to less than 1.5 in the No. 2 Seam in Area A (west side of dump) and less than 1.6 in Area B. Based on this, stability of the underground pillars could become compromised in both these areas. The pillar FOS calculations for the No. 4 Seam show that at a discard dump depth of ±50m pillars in the No. 4 Seam in both Area A and B are expected to maintain FOS values above 1.6 as illustrated in Figure 8-8 and therefore considered to be stable in both areas. Calculations for both the No. 2 Seam and the No. 4 Seam show that the pillar safety factors decrease exponentially as a function of the dump height. Based on these evaluations, it would therefore be advisable to keep the dump height at any time and throughout the dump area at a value below 40m Dump height vs FOS # 4 Seam Area A FOS Area B FOS Standard Safety Factor Pillar FOS Dump height (m) Figure 8-8 Variation of Pillar FOS vs Dump Height for the No. 4 Seam
32 26 9 PILLAR STABILITY ASSESSMENT (NUMERICAL MODELLING) The numerical modelling package LAMODEL V3 (West Virginia University, 2013) was utilized to simulate and calculate the stress regimes to which the pillars within the panels under investigation are exposed (pillar load) before and after dump influence. LAMODEL is a 2-dimensional boundary-element program for simulating the displacements and stresses in stratified, laminated, sedimentary deposits. It use the displacement-discontinuity variation of the boundary-element method with a simplified laminated overburden model, and because of this formulation, it is able to quickly and effectively analyse large areas of single or multiple-seam workings. LAMODEL is different from other boundary-element codes in that it applies a laminated overburden model (LAMODEL) as opposed to a homogeneous, elastic overburden model. The laminated overburden model has been found to provide more realistic stress and displacement calculations, particularly with layered sedimentary geology that often accompanies coal deposits. The program also has the capability to apply the effect of a variable topography. Seven primary numerical models scenarios as listed below, simulated different scenarios for purposes of validation, calibration and cross checking the stress distributions: 1. Both seams not mined and without dump on top to test virgin stress conditions. 2. Dump effects on the No. 4 Seam only when both seams are unmined. 3. Dump effects on the No. 2 Seam level when both seams are unmined. 4. Mined on the No. 4 Seam only without dump. 5. Mined on the No. 4 Seam only and with dump. 6. Mined on No.4 Seam and No. 2 Seam without dump. 7. Mined on No.4 Seam and No. 2 Seam with dump. The stress regimes at different stages were compared along a grid of five sections, two of which are parallel to the east-west direction (B-B & D-D) and three parallel to the north-south direction (A-A, C-C & E-E) as shown in Figure 9-1. For purposes of analysis, only model No. 6 and No. 7 were compared along each of the five sections for both the No. 4 Seam and the No. 2 Seam. 9.1 Model parameters The following mechanical properties were used to construct the models for the overburden rock and in-situ coal: Overburden Poisson s Ratio 0.29 (based on the Delmas Geotechnical Database). Overburden Elastic Modulus 13.59GPa. Lamination Thickness 15m (Thinner laminations result in longer model running periods. The sensitivity of the model output to this lamination thickness is not significant).
. Coal Poisson s Ratio 0.22 (Ozbay, M.U, 1994). Coal in situ strength 7.2MPa (widely used value in the SA coal industry).")
33 27 Vertical Stress Gradient 0.024MPa/m (Widely accepted value for sedimentary strata in the RSA Coal industry and also based on the Delmas geotechnical data base). In-situ Coal Elastic Modulus 4.12GPa (Ozbay, M.U, 1994). Coal Poisson s Ratio 0.22 (Ozbay, M.U, 1994). Coal in situ strength 7.2MPa (widely used value in the SA coal industry). Mining height (seam thickness) averaged from the plan 3.3m for No. 2 Seam and 2.3m for No. 4 Seam. Average depth to the No. 4 Seam=66m. Average depth to the No. 2 Seam =81m. Bord width=7.0m to include the effects of pillar scaling over time. Due to the fact that compacted discard material is not the same as that of natural overburden, a stress reduction factor of 0.5 was applied to that of the in situ overburden owing to the discard dump s lower bulk density. This therefore effectively reduces the vertical stress gradient within the dump to approximately 12.3kPa/m or half of that of the in situ overburden. However, there is a current drilling program that may produce actual discard dump densities and depending on the outcome of this, the weight exerted by the discard dump may be adjusted. Figure 9-1 Plan Showing the LAMODEL Cross Section Positions
34 Model Output The numerical model simulation was first tested by using the above parameters and running it to calculate overburden stress (virgin conditions), at the respective average seam floor depths excluding dump stress influence. The stress values are found to be within the expected values of 1.62MPa and 1.98MPa for depths of ±66m and ±81m respectively for the No. 4 Seam and No. 2 Seam therefore validating the calibration of the model. The with and without dump stress conditions are displayed as interpolated SURFER graphics in Figure 9-2 to Figure 9-4. Figure 9-2 Overburden Stress on the No. 2 Seam Workings: without Dump (Multi-Seam Mined) The diagrams in Figure 9-2 and Figure 9-3 indicate maximum and average overburden stress on the No. 2 and No. 4 Seam levels, without the discard dump, as ±2MPa and 1.6MPa respectively. This is consistent with expected theoretical (analytical) values for the area. Figure 9-4 indicates the overburden stress distribution on the mined No. 4 and No. 2 Seam level, with the discard dump in place, averaging 2.1MPa and 2.4MPa respectively for an estimated dump height of 40m which is consistent with expected theoretical values for the area. This is the overburden load being exerted and not the actual pillar stress on the mined areas. This serves in validating the typical numerical model values in terms of exerted overburden stress.
 Figure 9-4 Overburden Stress on No.")
35 29 Figure 9-3 Overburden Stress on the No. 4 Seam Workings: without Dump (Multi-Seam Mined) Figure 9-4 Overburden Stress on No. 4 Seam & No. 2 Seams without mining, including Dump
36 30 Once the overburden loading characteristics have been verified, the different numerical model simulations could be run with the actual mining layout and coal pillars as per the Delmas Coal plans for No. 4 and No. 2 seam beneath the discard dump. The multi-seam functionality of LAMODEL assist in producing a mining simulation that is as close as possible to the real world environment where both the loading characteristics of the overburden topography and the abutment loading of over and undersized pillars can be simulated. As per scenario no. 7 which represents the current day mining configuration, where both the No.4 Seam and No. 2 Seam are mined and the discard dump is in place, the total vertical stress exerted on the coal pillars are shown as contour plots in Figure 9-5 (No. 4 seam) and Figure 9-6 (No. 2 Seam). Figure 9-5 No. 4 Seam Pillar Stress Simulation (LAMODEL) Figure 9-5 indicates a high stress concentration in the panels around the centre of the discard dump where the coal pillars typically have a calculated strength of ±12MPa and an average pillar load of ±5-8MPa being exerted. This results in a pillar safety factor of 1.5 to 1.6 which is considered to be marginal. This can be seen in more detail in Figure 9-8. This indicates that the dump is at full capacity (height) for this specific area and adding discard material to it, could possibly result in overloading of the pillars.
37 31 It is also noted from this plot that directly north of the discard dump edge, a No. 4 seam panel consisting of small pillars are also at marginal safety factors, but this falls outside the scope of work of this study. Figure 9-6 indicates the total vertical stress for the No. 2 seam workings in relation to the discard dump footprint. It also indicates an average pillar load of ±6-9MPa being exerted, but the coal pillar are marginally bigger in most of the area beneath the dump. Figure 9-6 No. 2 Seam Pillar Stress Simulation (LAMODEL) The contour plots indicate possible areas of low coal pillar safety factors, but it is difficult to determine the exact margins or extent of this influence. Therefore, for purposes of more detailed comparative analyses, the total vertical pillar loads, without and with discard dump, were compared along six cross sections (A-A, B-B, C-C, D-D, E-E and E-E1) as shown in Figure 9-1. Three cross sections are parallel to the east-west direction and three others are parallel to the north-south direction. The data from this simulation was exported to MSExcel in order to characterise and quantify the pillar stress profile in graph format and compute an average pillar safety factor for the area under the dump foot print. The results for this analysis are shown from Figure 9-7 to Figure 9-15.
 3.4 Average pillar stress (max) 5.95MPa Minimum pillar FOS on 20m C 4.8 Minimum pillar FOS on 20m 2.8 C (worst case) Pillar w:h ratio 5.")
38 Section A-A LAMODEL Output Figure 9-7 No. 4 Seam Pillar Stress Calculation on Cross Section along the Y-Axis on A-A Without Discard Dump With Discard Dump Pillar strength (20m Centre) 16.8 Pillar strength 16.8 MPa Average pillar stress (Load) 3.4 Average pillar stress (max) 5.95MPa Minimum pillar FOS on 20m C 4.8 Minimum pillar FOS on 20m 2.8 C (worst case) Pillar w:h ratio 5.6 Pillar w:h ratio 5.6 Table 9 1 Pillar FOS Calculation on 20m C in the No.4 Seam along the Y-Axis on A-A The FOS calculations show a minimum FOS of 2.8 in the No. 4 Seam under the discard dump. This was calculated along the cross section A-A, which was drawn through the deepest point in the dump and in an area (Area A) on the western half of the discard dump where the pillar centres are mainly 20m on the No. 4 Seam. The Analytical Calculation using the seam specific power formula within the same areas considered by LAMODEL above yield a pillar FOS calculation on the mined No. 4 Seam without the dump as 4.4, and this reduce to 3.4 under the discard dump influence as shown in Table 9 2. The two simulations both imply stability in the No. 4 Seam workings under the dump. The FOS calculation results for the LAMODEL and conventional methods are considered to be in general agreement with each other (within 9%), with no discard dump in place. The ±21% difference when there is discard dump material on surface, is attributed to the fact that LAMODEL factors in the actual dump height and then averages many values using the
 Table 9 2 No.")


39 33 maximum likelihood method, whereas the conventional method in this case is a value based on the mining parameters at a specific location particular area (more discrete). No Discard Dump With Discard Dump (40m) Table 9 2 No. 4 Seam Pillar Stress Calculation on Cross Section along the Y-Axis on A-A (From Analytical Calculation Methods)) An additional vertical cross section E-E was analysed due to lower pillar centres of 15m C. The outcome is shown in Figure 9-8. The graph indicates that the pillars can be divided into three categories; Those with a pillar stress which is less than 6MPa and FOS greater than 2; These are considered to be stable and therefore low risk. There are only a small group of pillars on the southern side of the discard dump that conforms to this. Those with a pillar stress of between 6 and 7.6 MPa, with a pillar FOS of between 1.6 and 2.0; These are considered to be stable but with slightly lower probability of survival but still low risk. Most of the pillars along line E-E conforms to this category. Those with a pillar stress of between 7.6 and 9.0MPa, with a pillar FOS of between 1.3 and slightly below 1.6; these are considered to be of medium risk. These pillars are typically a panel of small pillars located on the most northern segment of E-E. It further indicates that for the area between meter mark 800 and 1200, the pillars are loaded to near capacity and that any further increase in height on the Discard Dump, which will result in an increase in overburden load, could result in the overloading of these No. 4 seam pillars.


40 34 Figure 9-8 No. 4 Seam Pillar Stress Calculation on Cross Section along the Y-Axis On E-E Figure 9-9 No. 2 Seam Pillar Stress Calculation on Cross Section along the Y-Axis on A-A
 Table 9 3 shows the No. 2 Seam FOS calculated for Area A using LAMODEL.")


41 35 No. 2 pillar FOS under Discard Dump Pillar strength on 18m C 11MPa Average pillar stress (Load) 5.80MPa Minimum pillar FOS on 18m C 1.89 Pillar w:h ratio 3.3 Table 9 3 No. 2 Seam Pillar FOS Calculation on 18m C along the Y-Axis on A-A (From LAMODEL Results) Table 9 3 shows the No. 2 Seam FOS calculated for Area A using LAMODEL. The table shows that the 18m pillar centres under the discard dump have the lowest FOS of 1.89 and this also implies stability on a macro scale within the No. 2 seam under the discard dump. Calculations using conventional methods yield a FOS of as low as 1.3 (Error! Reference source not found.), under the discard dump in areas which are up to 117m deep (inclusive of 40m high dump). This is considered to be a low FOS and pillars are expected to remain stable only in the short to medium term. It is expected that pillar stability will eventually be compromised on a localised level. However, the presence of wide barrier pillars is considered to be a positive factor as the barrier pillars would be expected to arrest a pillar run should one occur on the No. 2 Seam. On a macro scale, the risk is therefore considered to be medium to low. No Dump With Dump Table 9 4 Pillar FOS Calculation on 18m C In the No.2 Seam Along The Y-Axis on A-A Risk category Likelihood Consequence Risk rating (medium) Table 9 5 No. 2 Seam Risk Rating along the Y-Axis on A-A
 Without Discard Dump With Discard Dump Pillar strength(20m C) 16.8MPa Pillar strength (20m C) 16.")
42 Section B-B LAMODEL Output Figure 9-10 No. 4 Seam Pillar Stress Calculation on Cross Section along the X-Axis on B-B (From LAMODEL Results) Without Discard Dump With Discard Dump Pillar strength(20m C) 16.8MPa Pillar strength (20m C) 16.8MPa Average pillar stress (Load) 3.57MPa Average pillar stress (Load) 4.55MPa FOS 4.7 FOS 3.69 Table 9 6 No. 4 Seam FOS Calculation on 20m C (Area A) Calculated on Section B-B Parallel to the X-Axis (From LAMODEL Results) Without Discard Dump With Discard Dump Pillar strength(15m C) 12MPa Pillar strength (15m C) 12MPa Average pillar stress on 15m C 4.95MPa Average pillar stress (Load) 6.32MPa FOS 2.42 FOS 1.89 Table 9 7 No. 4 Seam FOS Calculation on 15m C (Area B) Calculated on Section B-B Parallel to the X-Axis (From LAMODEL Results) The pillar FoS calculation shown in Table 9 6 and in Table 9 7 indicates the coal pillars along to be high enough to ensure long term pillar stability on the No. 4 Seam. The No. 4 Seam workings risk rating is therefore considered to be low in both Area A and B.
43 37 Section B-B, West to East through dump centre Centre [#2s] with dump, multiseam, both mined Pillar Strength #2 Seam Pillar stress Pillar strength on 16.5m C=9.9MPa Stress (MPa) 10 Capacity within system, SF = 1.68 Average Pillar Load=5.9MPa Distance (m) Figure 9-11 No. 2 Seam Pillar Stress Calculation on Cross Section Along the X-Axis on B-B No. 2 pillar FOS under Discard Dump Pillar strength 9.9MPa Average pillar stress (Load) 5.9MPa Minimum pillar FOS on 20m C 1.68 Pillar w:h ratio 2.8 Table 9 8 No. 2 Seam FOS Calculation Calculated on Section B-B Parallel to the X-Axis The No. 2 Seam FOS calculations show a minimum FOS of 1.68 under the discard dump along the Section B-B using LAMODEL generated pillar stresses. The width to height ratio for the pillars is 2.8. This indicates current stability in the No. 2 Seam. However, the margin is considered to be low and adding discard material to the dump in these areas can increase the load on the pillars. The analytical method of calculation indicates a FOS of 1.7 without the dump on top. When considering the dump influence this FOS can be expected to go as low as 1.59, (assuming a 40m high dump) as shown in Table 8 6. This FOS is considered to be high enough for pillars to remain stable in the medium to long term and therefore low to medium risk. It is also noted from the modelled pillars that this specific area is contained within barrier pillars which are expected to stop any possible pillar run in the event of failure in the No. 2 Seam. On a macro scale the risk is considered to be low along this section.
 Before dump placement After dump placement Pillar strength (minimum) 12.0 MPa Pillar strength (minimum) 12.")
44 Section D-D LAMODEL Output Pillars strength =5.65MPa Figure 9-12 Cross Section along the X-Axis on D-D (From LAMODEL Results) Before dump placement After dump placement Pillar strength (minimum) 12.0 MPa Pillar strength (minimum) 12.0 MPa Average pillar stress (Load) 5.3 MPa Average pillar stress (Load) 6.4 MPa FOS (minimum) 2.26 FOS 2.0 Pillar w:h ratio (minimum) 3.47 Pillar w:h ratio (minimum) 3.47 Table 9 9 No. 4 Seam FOS Calculation Calculated on Section D-D Parallel to the X-Axis The model shows a minimum FOS which is 2.3 without the dump. This FOS drops to 2.0 on the No. 4 Seam under the influence of the dump, indicating that pillar stability is maintained in both cases. The conventional method of pillar FOS calculation including the dump influence gives a FOS of between 1.61 (assuming full 40m dump height above) and FOS 2.1 for no dump conditions as shown in Table These values are lower than the model calculated one by between 20% and 7% respectively. The higher variation is where the calculation is done assuming a full 40m dump height loading on top of the workings whereas the model uses the actual dump contours to give a more accurate depth to floor calculation.


45 39 No Dump With Dump Table 9 10 No 4 Seam Pillar FOS Calculation on 15m C along the X-Axis on D-D Both methods indicate stability in the No. 4 Seam under the influence of the discard dump. The southern area of the discard dump, along which the modelled section results are taken, is therefore considered to be a low risk area on the No. 4 Seam. The model results were extracted for two parallel sections D-D and D-D1 which are 27m apart as shown in Figure 9-1. The pillar stress profiles are shown in Figure 9-13 and Figure The graph for Section D-D indicates zero stress for large parts of this cross-section due to it being plotted along roadways instead of coal pillars. Figure 9-13 No 2 Seam Pillar Stress Calculation on Cross Section along the X-Axis on D-D
46 40 Therefore Section D-D1 is moved southwards to coincide with a row of pillars. This graph indicates that the No. 2 seam pillars are considered to be relatively stable along this cross section, however increasing the load by adding material to the discard dump, could decrease the pillar safety factors. Section DD1, West to East through Centre [#2s] with dump, multiseam, both mined Pillar Strength #2 Seam Average Pillar load Stress (MPa) 10 Pillar strength =9.9MPa on 16.5m C Capacity within system, SF = 1.8 Average Pillar Load=5.5MPa Distance (m) Figure 9-14 No. 2 Seam Pillar Stress Calculation on Cross Section along the X-Axis on D-D1 No. 2 Seam Pillar FOS under Discard Dump Pillar strength 9.9MPa Average pillar stress (Load) 5.98MPa Minimum pillar FOS on 16.5m C 1.7 (on section D-D) Pillar w:h ratio 2.8 Table 9 11 No. 2 Seam FOS Calculation Calculated on Section D-D Parallel to the X-Axis The No. 2 Seam FOS calculations show a minimum FOS of 1.7 under the discard dump along Section D-D and D-D1 using LAMODEL generated pillar stresses. The width to height ratio for the pillars is 2.8. This indicates stability of the No. 2 Seam pillars. The conventional method also indicates a FOS of 1.6 when considering the dump influence in the same area (Table 9 12 ). This FOS is considered to be in close agreement with the model computed value. Overall the FOS indicates stability of the No. 2 Seam pillars. The section is also well contained by barrier pillars which are expected to prevent the widespread effects of a pillar run if it should occur. Failure will likely be localised to bords or intersections depending on


47 41 the quality and integrity of the roof support that was installed as well as the prevailing geotechnical conditions in that area. No Dump With Dump Table 9 12 No 2 Seam Pillar FOS Calculation on 15m C along the X-Axis on D-D 9.6 Section C-C LAMODEL Output Section C-C was drawn through an area which is in proximity to the current Delmas travel and belt roads within the No 4 Seam workings on the eastern periphery of the dump. This was done in in order to quantify the pillar stress and stability in the area in proximity to the said bords. The area does not directly lie under the discard dump foot print, but is expected to be influenced by it. The stress distribution and FOS calculations on the No.4 Seam pillars are shown in Figure 9-15 and in Table 9 13 respectively. As can be seen on the pillar stress profile, there is no marked difference between the stress on the pillars before and after the dump. Therefore the effects of the dump along this section can be considered to be negligible. The model shows a minimum pillar FOS of 2.1 both with and without the dump. This pillar FOs implies pillar stability within the No. 4 Seam and also implies that the dump has no noticeable influence on the stability of pillars in this area. The conventional methods of calculation for pillar FOS yield 2.3 on the #4 Seam (Table 9 14 ). The two methods of calculation are considered to be in general agreement therefore pillar stability is maintained. The area is considered to be a low risk area on the No. 4 Seam. The No. 2 Seam analysis yields a FOS of 1.84 using LAMODEL as shown in Figure 9-16 and Table There does not seem to be any noticeable influence of the dump in this area. The conventional methods of calculation for pillar FOS also yields 1.84 on the same area (Table 9 16 ). The two methods of calculation are in general agreement therefore pillar stability is maintained. The area is considered to be a low risk area on the No. 2 Seam.
 5.6MPa Average pillar stress (Load) 5.6MPa FOS (minimum) 2.1 FOS 2.1 Pillar w:h ratio (minimum) 3.47 Pillar w:h ratio (minimum) 3.47 Table 9 13 No.")
48 42 Figure 9-15 No. 4 Seam Cross Section Along The Y Axis On C-C (From LAMODEL Results) Before dump placement After dump placement Pillar strength (minimum) 12.0MPa Pillar strength (minimum) 12.0MPa Average pillar stress (Load) 5.6MPa Average pillar stress (Load) 5.6MPa FOS (minimum) 2.1 FOS 2.1 Pillar w:h ratio (minimum) 3.47 Pillar w:h ratio (minimum) 3.47 Table 9 13 No. 4 Seam FOS Calculation on Section C-C Parallel to the Y-Axis Table 9 14 No. 4 Seam Pillar FOS Calculation on 15m C along the Y-Axis on C-C
 4.8MPa Average pillar stress (Load) 4.8MPa FOS (minimum) 1.84 FOS 1.84 Pillar w:h ratio (minimum) 2.56 Pillar w:h ratio (minimum) 2.56 Table 9 15 No.")
49 43 Figure 9-16 No. 2 Seam Cross Section along the Y Axis on C-C (From LAMODEL Results) Before dump placement After dump placement Pillar strength (minimum) 8.86MPa Pillar strength (minimum) 8.86MPa Average pillar stress (Load) 4.8MPa Average pillar stress (Load) 4.8MPa FOS (minimum) 1.84 FOS 1.84 Pillar w:h ratio (minimum) 2.56 Pillar w:h ratio (minimum) 2.56 Table 9 15 No. 2 Seam FOS Calculation On Section C-C Parallel To The Y-Axis. Table 9 16 No. 2 Seam Pillar FOS Calculation on 16.5m C along the Y-Axis on C-C
A BOOKLET ON. T Rangasamy, A R Leach and A P Cook. Facilitating safety and health research in the South African mining industry
 A BOOKLET ON THE HYDRAULIC DESIGN OF COAL BARRIER PILLARS T Rangasamy, A R Leach and A P Cook Facilitating safety and health research in the South African mining industry A BOOKLET ON THE HYDRAULIC DESIGN
SYLLABUS AND REFERENCES FOR THE STRATA CONTROL CERTIFICATE COAL MINING OPTION
 CHAMBER OF MINES OS SOUTH AFRICA SYLLABUS AND REFERENCES FOR THE STRATA CONTROL CERTIFICATE COAL MINING OPTION 1. PART 1 : THEORY 1.1 Basic principles of rock engineering 1.1.1 Terms, definitions and basic
Engineering Geophysical Application to Mine Subsidence Risk Assessment
 Engineering Geophysical Application to Mine Subsidence Risk Assessment By: Kanaan Hanna, Sr. Mining Engineer Steve Hodges, Sr. Geophysicist Jim Pfeiffer, Sr. Geophysicist Dr. Keith Heasley, Professor West
Multi-seam mining of the deep Waterberg resources
 Multi-seam mining of the deep Waterberg resources by C.K. Chabedi* and T. Zvarivadza* http://dx.doi.org/10.17159/2411-9717/2016/v116n11a5 This paper discusses the difficulties associated with the potential
SESE MEASURED RESOURCE EXCEEDS 650MT COAL
 For electronic distribution 15 th August 2012 SESE MEASURED RESOURCE EXCEEDS 650MT COAL Highlights: Initial Measured Resource at Sese calculated at 651Mt coal. Sese Coal & Power Project: Resource Summary
DEPILLARING DEPILLARING OF THE ANJAN HILL 0 SEAM WORKINGS
 DEPILLARING DEPILLARING OF THE ANJAN HILL 0 SEAM WORKINGS Jaco J. van Vuuren Gerald Webster Gordon M c Cormack Sri N. Kumar R M T R M T Mechanised Depillaring Successful Mechanised Depillaring (stooping;
2013/09/03. Lessons From Coalbrook. Base evaluation on Coalbrook disaster. Geology and Dimensions Production build-up
 On January 960, the North Mine collapsed. 437 miners perished in the event. Lessons From It still is the single most tragic accident in South African mining. Presentation to SACMA August 03 Prof Nielen
Design considerations for pillar systems in deep mines. Tobias Ladinig Hannes Blaha Horst Wagner
 Design considerations for pillar systems in deep mines Tobias Ladinig Hannes Blaha Horst Wagner Content Role of pillars in mining Stope pillar loading approaches Pillar design Pillars in deep open-stoping
Successful Construction of a Complex 3D Excavation Using 2D and 3D Modelling
 University of Wollongong Research Online Coal Operators' Conference Faculty of Engineering and Information Sciences 2015 Successful Construction of a Complex 3D Excavation Using 2D and 3D Modelling Yvette
Assessing Pillar Geometries in the Witbank and Highveld Coalfields Using Geostatistical Techniques
 Assessing Pillar Geometries in the Witbank and Highveld Coalfields Using Geostatistical Techniques Gavin H Lind Department of Mining Engineering University of the Witwatersrand Private Bag X3, WITS, 2050
Methods of Interpreting Ground Stress Based on Underground Stress Measurements and Numerical Modelling
 University of Wollongong Research Online Coal Operators' Conference Faculty of Engineering and Information Sciences 2006 Methods of Interpreting Ground Stress Based on Underground Stress Measurements and
MEMORANDUM SUBJECT: CERTIFICATE IN ROCK MECHANICS PAPER 1 : THEORY SUBJECT CODE: COMRMC MODERATOR: H YILMAZ EXAMINATION DATE: OCTOBER 2017 TIME:
 MEMORANDUM SUBJECT: CERTIFICATE IN ROCK MECHANICS PAPER 1 : THEORY EXAMINER: WM BESTER SUBJECT CODE: COMRMC EXAMINATION DATE: OCTOBER 2017 TIME: MODERATOR: H YILMAZ TOTAL MARKS: [100] PASS MARK: (60%)
Successful Use of a Stress Relief Roadway at Appin Colliery
 University of Wollongong Research Online Coal Operators' Conference Faculty of Engineering and Information Sciences 2004 Successful Use of a Stress Relief Roadway at Appin Colliery R. Doyle BHP Billiton
Strong Weighting Events in Shallow Multi-seam Longwall Mining
 University of Wollongong Research Online Coal Operators' Conference Faculty of Engineering and Information Sciences 2018 Strong Weighting Events in Shallow Multi-seam Longwall Mining Weibing Zhu China
Introduction and Background
 Introduction and Background Itasca Consulting Group, Inc. (Itasca) has been participating in the geomechanical design of the underground 118-Zone at the Capstone Minto Mine (Minto) in the Yukon, in northwestern
Geotechnical roof classification for an underground coal mine from borehole data
 University of Wollongong Research Online Coal Operators' Conference Faculty of Engineering and Information Sciences 2013 Geotechnical roof classification for an underground coal mine from borehole data
Seismic analysis of horseshoe tunnels under dynamic loads due to earthquakes
 University of Wollongong Research Online Coal Operators' Conference Faculty of Engineering and Information Sciences 2010 Seismic analysis of horseshoe tunnels under dynamic loads due to earthquakes Navid
25th International Conference on Ground Control in Mining
 ANALYTICAL INVESTIGATION OF SHAFT DAMAGES AT WEST ELK MINE Tim Ross, Senior Associate Agapito Associates, Inc. Golden, CO, USA Bo Yu, Senior Engineer Agapito Associates, Inc. Grand Junction, CO, USA Chris
LWB4 to LWB7 Coal Resource Recovery Plan. September 2017
 LWB4 to LWB7 Coal Resource Recovery Plan September 2017 DOCUMENT CONTROL DOCUMENT DETAILS Title LWB4 LWB7 Coal Resource Recovery Plan Reference Document Status Austar Coal Mine Longwalls B4 B7 Extraction
SYLLABUS AND REFERENCES FOR THE STRATA CONTROL CERTIFICATE. METALLIFEROUS MINING OPTION Updated November 1998
 CHAMBER OF MINES OF SOUTH AFRICA SYLLABUS AND REFERENCES FOR THE STRATA CONTROL CERTIFICATE METALLIFEROUS MINING OPTION Updated November 1998 1 PART 1 : THEORY 1.1 Basic principles of rock engineering
Taming the Soutpansberg SACMA Presentation - Exxaro Tshikondeni Coal November 2011
 Taming the Soutpansberg SACMA Presentation - Exxaro Tshikondeni Coal November 2011 0 BRIEF OVERVIEW 1 Located some 140 km east of Musina in Limpopo province, this underground mine employs 770 people and
Subsidence Management Plan ANNEX M. Roof Support for Initial Entries. Ashton Coal Longwall Panels 1-4. Subsidence Management Plan.
 Subsidence Management Plan ANNEX M Roof Support for Initial Entries Ashton Coal Longwall Panels 1-4 Subsidence Management Plan Written Report STRATA ENGINEERING Consulting and Research Engineering A.B.N.
The Mine Geostress Testing Methods and Design
 Open Journal of Geology, 2014, 4, 622-626 Published Online December 2014 in SciRes. http://www.scirp.org/journal/ojg http://dx.doi.org/10.4236/ojg.2014.412046 The Mine Geostress Testing Methods and Design
Further Research into Methods of Analysing the October 2000 Stability of Deep Open Pit Mines EXECUTIVE SUMMARY
 EXECUTIVE SUMMARY This report presents the results of a program of further research into the use of a combined approach of numerical and centrifuge modeling in assessing the stability of deep open pit
Development of a method to estimate coal pillar loading
 Safety in Mines Research Advisory Committee Final Report Development of a method to estimate coal pillar loading DP Roberts, JN van der Merwe, I Canbulat EJ Sellers and S Coetzer Research Agency : CSIR
5 Further Case Histories
 5 Further Case Histories Chapter outline Cavity/old workings detection Detailed pillar detection Near-surface cavity detection Dyke, sill and fault detection In-seam disruptions (lenses, etc.) Coal thickness
Geotechnical & Mining Engineering Services
 Geotechnical & Mining Engineering Services Southwest Research Institute San Antonio, Texas A s an independent, nonprofit research and development organization, Southwest Research Institute (SwRI ) uses
Establishing a Methodology for the Assessment of Remnant Stability Using Recorded Seismic Events on Harmony Mines
 SHIRMS 2008 Y. Potvin, J. Carter, A. Dyskin, R. Jeffrey (eds) 2008 Australian Centre for Geomechanics, Perth, ISBN 978-0-9804185-5-2 Establishing a Methodology for the Assessment of Remnant Stability Using
The effect of discontinuities on stability of rock blocks in tunnel
 International Journal of the Physical Sciences Vol. 6(31), pp. 7132-7138, 30 November, 2011 Available online at http://www.academicjournals.org/ijps DOI: 10.5897/IJPS11.777 ISSN 1992-1950 2011 Academic
16. Mining-induced surface subsidence
 16. Mining-induced surface subsidence 16.1 Types and effects of mining-induced subsidence Subsidence - Lowering of the ground surface following underground extraction of an orebody. - Types: continuous
Bosl/Brac _Arnot_Gumeni Undermining Study_Stage1_InterimFinal_ docx
 SRK Consulting: 453803: Arnot to Gumeni High Voltage Lines-Stage 1 Undermining Study (Interim) Pagee 7 Figure 4-4 Geological map showing Stratigraphy in relation to proposed routes Bosl/Brac 453803_Arnot_Gumeni
THE DESIGN AND BEHAVIOUR OF CRUSH PILLARS ON THE MERENSKY REEF
 Thesis Summary THE DESIGN AND BEHAVIOUR OF CRUSH PILLARS ON THE MERENSKY REEF MICHAEL DU PLESSIS i ABSTRACT Crush pillars are extensively used in the platinum mines of South Africa as part of the stope
Central Queensland Coal Project Appendix 4b Geotechnical Assessment. Environmental Impact Statement
 Central Queensland Coal Project Appendix 4b Geotechnical Assessment Environmental Impact Statement GEOTECHNICAL ASSESSMENT OF OPEN CUT MINING ADJACENT TO THE BRUCE HIGHWAY, CENTRAL QUEENSLAND COAL PROJECT
Power Cavern Design & Back Analysis Using Phase 2
 Power Cavern Design & Back Analysis Using Phase 2 A Look at the Ingula Power Cavern Project This summary is based on the published paper, The Use of Geotechnical Instrumentation to Monitor Ground Displacements
Strengths and weaknesses of using elastic numerical modelling in mine design at the Callie underground mine
 Deep Mining 2017: Eighth International Conference on Deep and High Stress Mining J Wesseloo (ed.) 2017 Australian Centre for Geomechanics, Perth, ISBN 978-0-9924810-6-3 https://papers.acg.uwa.edu.au/p/1704_59_arbi/
Numerical Approach to Predict the Strength of St. Peter Sandstone Pillars acted upon by Vertical Loads A case study at Clayton, IA, USA.
 IOSR Journal of Engineering (IOSRJEN) ISSN (e): 2250-3021, ISSN (p): 2278-8719 Vol. 05, Issue 01 (January. 2015), V2 PP 36-41 www.iosrjen.org Numerical Approach to Predict the Strength of St. Peter Sandstone
CHAPTER 8 SUMMARY, CONCLUSIONS AND RECOMMENDATIONS
 CHAPTER 8 SUMMARY, CONCLUSIONS AND RECOMMENDATIONS 8.1 SUMMARY This thesis aimed to investigate the mechanisms behind valley closure and upsidence over unmined coal and old longwall panels using UDEC.
Finite difference modelling in underground coal mine roadway
 University of Wollongong Research Online Coal Operators' Conference Faculty of Engineering and Information Sciences 2017 Finite difference modelling in underground coal mine roadway Ali Akbar Sahebi University
CMRR - Practical Limitations and Solutions
 University of Wollongong Research Online Coal Operators' Conference Faculty of Engineering and Information Sciences 2008 CMRR - Practical Limitations and Solutions J. Calleja SCT Operations Australia Publication
Numerical modelling for estimation of first weighting distance in longwall coal mining - A case study
 University of Wollongong Research Online Coal Operators' Conference Faculty of Engineering and Information Sciences 2012 Numerical modelling for estimation of first weighting distance in longwall coal
Update of coal pillar database for South African coal mining
 Update of coal pillar database for South African coal mining by J.N. van der Merwe*, and M. Mathey * Synopsis Following the Coalbrook disaster in 1960, research into coal pillar strength resulted in the
SOUTH AFRICAN NATIONAL INSTITUTE OF ROCK MECHANICS CHAMBER OF MINES OF SOUTH AFRICA CERTIFICATE IN ROCK MECHANICS PART 3-2 SOFT ROCK TABULAR MINING
 SOUTH AFRICAN NATIONAL INSTITUTE OF ROCK MECHANICS CHAMBER OF MINES OF SOUTH AFRICA CERTIFICATE IN ROCK MECHANICS PART 3-2 SOFT ROCK TABULAR MINING SYLLABUS Copyright 2006 SANIRE CONTENTS PREAMBLE... 4
HIGHWALL STABILITY DUE TO GROUND VIBRATIONS FROM BLASTING. Dr. Kyle A. Perry Dr. Kot F. Unrug Kevin Harris Michael Raffaldi
 HIGHWALL STABILITY DUE TO GROUND VIBRATIONS FROM BLASTING Dr. Kyle A. Perry Dr. Kot F. Unrug Kevin Harris Michael Raffaldi PURPOSE Objective: Study the effect of blast vibrations on the stability of highwalls
APPALACHIAN COLLUVIAL
 LANDSLIDE PROBLEMS ON APPALACHIAN COLLUVIAL SLOPES Geohazards in Transportation in the Appalachian Region Charleston, WV August 5 7, 2008 RICHARD E. GRAY DIGIOIA, GRAY & ASSOCIATES, LLC. 570 BEATTY ROAD
1. Rock Mechanics and mining engineering
 1. Rock Mechanics and mining engineering 1.1 General concepts Rock mechanics is the theoretical and applied science of the mechanical behavior of rock and rock masses; it is that branch of mechanics concerned
Prediction of subsoil subsidence caused by opencast mining
 Land Subsidence (Proceedings of the Fifth International Symposium on Land Subsidence, The Hague, October 1995). IAHS Publ. no. 234, 1995. 167 Prediction of subsoil subsidence caused by opencast mining
HYDROGEOLOGICAL PROPERTIES OF THE UG2 PYROXENITE AQUIFERS OF THE BUSHVELD COMPLEX
 R. Gebrekristos, P.Cheshire HYDROGEOLOGICAL PROPERTIES OF THE UG2 PYROXENITE AQUIFERS OF THE BUSHVELD COMPLEX R. Gebrekristos Digby Wells Environmental P. Cheshire Groundwater Monitoring Services Abstract
Strata control monitoring in a contiguous seam depillaring working
 Recent Advances in Rock Engineering (RARE 2016) Strata control monitoring in a contiguous seam depillaring working Sandeep K Sahoo, A Galav, B Behera, Sanjay K Sharma and GSP Singh Department of Mining
NZQA unit standard New US6 to replace and version 1 Page 1 of 5
 Page 1 of 5 Title Demonstrate knowledge of mining methods, and analyse and select plant for metalliferous underground extraction Level 6 Credits 20 Purpose People credited with this unit standard are able
FIRST INTERNATIONAL SEMINAR DEEP AND HIGH STRESS MINING 6-8 NOVEMBER 2002 PERTH, AUSTRALIA. Potential. T. Wiles Mine Modelling Pty Ltd, Australia
 FIRST INTERNATIONAL SEMINAR ON DEEP AND HIGH STRESS MINING 6-8 NOVEMBER 22 PERTH, AUSTRALIA Loading System Stiffness A Parameter to Evaluate Rockburst Potential T. Wiles Mine Modelling Pty Ltd, Australia
Blast design parameters and their impact on rock fragmentation
 Blast design parameters and their impact on rock fragmentation By Pradeep K Singh, Chief Scientist & Professor, Academy of Scientific & Innovative Research CSIR Central Institute of Mining and Fuel Research,
SHUMBA COAL UPGRADES GROSS IN-SITU TONNES COAL TO 1.14BT AT SECHABA
 31 st January, 2014 BSE ANNOUNCEMENT BSE: SHU SHUMBA COAL UPGRADES GROSS IN-SITU TONNES COAL TO 1.14BT AT SECHABA Following the completion of a 4,000m drill programme at Sechaba focused on delineating
Calculation of periodic roof weighting interval in longwall mining using finite element method
 Calculation of periodic roof weighting interval in longwall mining using finite element method Navid Hosseini 1, Kamran Goshtasbi 2, Behdeen Oraee-Mirzamani 3 Abstract The state of periodic loading and
THE INFLUENCE OF ROOF BOLTS LOCATION ON ITS INTERACTION WITH THE ROCK MASS.
 THE INFLUENCE OF ROOF BOLTS LOCATION ON ITS INTERACTION WITH THE ROCK MASS. M. Cała 1, A. Tajduś 1 ABSTRACT This paper examines the influence of roof bolts location on its interaction with rock mass in
Understanding the Causes of Roof Control Problems on A Longwall Face from Shield Monitoring Data - a Case Study
 University of Wollongong Research Online Coal Operators' Conference Faculty of Engineering and Information Sciences 2011 Understanding the Causes of Roof Control Problems on A Longwall Face from Shield
Haulage Drift Stability Analysis- A Sensitivity Approach
 Haulage Drift Stability Analysis- A Sensitivity Approach W. Abdellah University of Assiut, Assiut, Egypt ABSTRACT Haulage drifts are the primary access to the mining blocks of an ore body in a multi-level
WEIR INTERNATIONAL, INC. Mining, Geology and Energy Consultants
 WEIR INTERNATIONAL, INC. Mining, Geology and Energy Consultants Introduction to Coal Mining History of Coal in the United States Coal was one of man s earliest sources of heat and light Coal was first
Undermining Surface Water Resources at Goedehoop South and North Collieries Addendum 1
 Undermining Surface Water Resources at Goedehoop South and North Collieries Addendum 1 Report Prepared for Anglo American Thermal Coal Report Number 445324 Addendum 1) Report Prepared by May 2016 SRK Consulting:
EXAMINATION PAPER MEMORANDUM
 EXAMINATION PAPER MEMORANDUM SUBJECT: CERTIFICATE IN ROCK MECHANICS PAPER 3.1 : HARD ROCK TABULAR EXAMINER: PJ LE ROUX SUBJECT CODE: COMRMC EXAMINATION DATE: MAY 2015 TIME: MODERATOR: WM BESTER TOTAL MARKS:
Practical guidelines for strain burst hazard awareness for development miners
 Practical guidelines for strain burst hazard awareness for development miners Ryan R. Lyle, Sr. Geotechnical Engineer Alun Price Jones, Technical Director John Renaud, Safety and Training Coordinator (Totten)
Redesigning the geometry of the Makala Coal Mine to improve safety and productivity
 Paper No. 197 ISMS 2016 Redesigning the geometry of the Makala Coal Mine to improve safety and productivity Jean-Pierre Tshibangu*, Fanny Descamps Department of Mining Engineering, University of Mons (UMONS),
Surface auger mining at Rietspruit Mine Services (Pty) Ltd
 Ltd") Surface auger mining at Rietspruit Mine Services (Pty) Ltd by M.J. Lukhele* Paper written on project work carried out in partial fulfilment of B.Tech (Mining Engineering) degree Synopsis A number of high
Surface auger mining at Rietspruit Mine Services (Pty) Ltd by M.J. Lukhele* Paper written on project work carried out in partial fulfilment of B.Tech (Mining Engineering) degree Synopsis A number of high
IMPROVED UNDERGROUND MINING DESIGN METHOD FOR ESTONIAN OIL SHALE DEPOSIT IN LATVIAN IN LATVIAN
 IMPROVED UNDERGROUND MINING DESIGN METHOD FOR ESTONIAN OIL SHALE DEPOSIT IN LATVIAN IN LATVIAN Jyri-Rivaldo Pastarus Tallinn University of Technology, Department of Mining 5 Ehitajate tee St, Tallinn,
MINERAL RESOURCE AND ORE RESERVE UPDATE PAMPALO GOLD MINE
 REPORT Pampalo Pekka Lovén, Markku Meriläinen 15.February. 2012 1 (14) MINERAL RESOURCE AND ORE RESERVE UPDATE PAMPALO GOLD MINE 31.12.2011 FOR ENDOMINES OY Outotec Oyj Riihitontuntie 7 C, PO Box 86 FI-02201
EXAMINATION PAPER NUMBER OF PAGES: 4
 EXAMINATION PAPER SUBJECT: CERTIFICATE IN STRATA CONTROL (COAL) SUBJECT CODE: EXAMINATION DATE: 18 OCTOBER 011 TIME: 14h30 17h30 EXAMINER: D. NEAL MODERATOR: B. MADDEN TOTAL MARKS: [100] PASS MARK: 60%
Defining the role of elastic modelling in underground mine design
 Underground Design Methods 2015 Y Potvin (ed.) 2015 Australian Centre for Geomechanics, Perth, ISBN 978-0-9924810-3-2 https://papers.acg.uwa.edu.au/p/1511_03_barsanti/ Defining the role of elastic modelling
ROCKMA Digital Strata Mapping Based on Drill Monitoring. Presentation by Warwick Smyth GeoConsult BBUGS & BOHUGS 2014
 ROCKMA Digital Strata Mapping Based on Drill Monitoring Presentation by Warwick Smyth GeoConsult BBUGS & BOHUGS 2014 Brief Introduction - GeoConsult 1. GeoConsult is a geological and laboratory services
Module 9 : Foundation on rocks. Content
 FOUNDATION ON ROCKS Content 9.1 INTRODUCTION 9.2 FOUNDATION TYPES ON ROCKS 9.3 BEARING CAPCITY- SHALLOW FOUNDATION 9.3.1 Ultimate bearing capacity 9.3.2 Safe bearing pressure 9.3.3 Estimation of bearing
Demonstration of the Advanced Radio Imaging Method (RIM): Ground Truth Results for Three-Dimensional Imaging of Coal Seams
: Ground Truth Results for Three-Dimensional Imaging of Coal Seams") Demonstration of the Advanced Radio Imaging Method (RIM): Ground Truth Results for Three-Dimensional Imaging of Coal Seams Joseph Duncan, RIM Geophysicist Larry G. Stolarczyk, President Stolar Horizon,
Demonstration of the Advanced Radio Imaging Method (RIM): Ground Truth Results for Three-Dimensional Imaging of Coal Seams Joseph Duncan, RIM Geophysicist Larry G. Stolarczyk, President Stolar Horizon,
Case study 2: Using seismic reflection to design a mine
 Case study 2: Using seismic reflection to design a mine Rob Knipe, Graham Stuart * and Stephen Freeman Rock Deformation Research & School of Earth and Environment * University of Leeds Seismic Reflection
EOSC433: Geotechnical Engineering Practice & Design
 EOSC433: Geotechnical Engineering Practice & Design Lecture 1: Introduction 1 of 31 Dr. Erik Eberhardt EOSC 433 (Term 2, 2005/06) Overview This course will examine different principles, approaches, and
Seepage Analysis for Shurijeh Reservoir Dam Using Finite Element Method. S. Soleymani 1, A. Akhtarpur 2
 Seepage Analysis for Shurijeh Reservoir Dam Using Finite Element Method S. Soleymani 1, A. Akhtarpur 2 1 Group of Dam Construction, Toossab Company, P.O. Box 917751569, Mashhad City, Iran, PH (+98) 511-7684091;
Imaging VTEM Data: Mapping Contamination Plumes In Tarlton, South Africa
 Imaging VTEM Data: Mapping Contamination Plumes In Tarlton, South Africa M. Combrinck Geotech Airborne Limited Summary VTEM data were acquired during a test survey flown over the Tarlton region in South
Curriculum Document Mining Technician: Strata Control Practitioner (Surface) Occupational Curriculum
 Occupational Curriculum") Curriculum Document Curriculum Code Curriculum Title 311701-008 Mining Technician: Strata Control Practitioner (Surface) TABLE OF CONTENTS SECTION 1: CURRICULUM OVERVIEW 1 Occupational Information 1 Associated
Curriculum Document Curriculum Code Curriculum Title 311701-008 Mining Technician: Strata Control Practitioner (Surface) TABLE OF CONTENTS SECTION 1: CURRICULUM OVERVIEW 1 Occupational Information 1 Associated
ANALYSIS OF A SLOPE FAILURE IN AN OPEN PIT MINE USING TSLOPE
 ANALYSIS OF A SLOPE FAILURE IN AN OPEN PIT MINE USING TSLOPE 1. Background In 1996 a slope failure occurred at the Round Hill open pit mine, operated by Macraes Mining Company Ltd. The failure as shown
CNSC Review of the Long-Term Safety Case for a Deep Geologic Repository
 CNSC Review of the Long-Term Safety Case for a Deep Geologic Repository T. Son Nguyen Geoscience Specialist Brugg, Switzerland May 13, 2016 e-doc 4972224 nuclearsafety.gc.ca Content Ontario Power Generation
Numerical Study on Effect of Longwall Mining on Stability of Main Roadway under Weak Ground Conditions in Indonesia
 Journal of Geological Resource and Engineering 3 (2017) 93-104 doi:10.17265/2328-2193/2017.03.001 D DAVID PUBLISHING Numerical Study on Effect of Longwall Mining on Stability of Main Roadway under Weak
Practical long-term planning in narrow vein mines a case study
 Underground Design Methods 2015 Y Potvin (ed.) 2015 Australian Centre for Geomechanics, Perth, ISBN 978-0-9924810-3-2 https://papers.acg.uwa.edu.au/p/1511_31_khani/ Practical long-term planning in narrow
Critique of the South African squat coal pillar strength formula
 http://dx.doi.org/10.17159/2411-9717/2016/v116n3a11 Critique of the South African squat coal pillar strength formula by M. Mathey* and J.N. van der Merwe* The South African squat coal pillar strength formula,
Mechanics of Rib Deformation at Moranbah North Mine - A Case Study
 University of Wollongong Research Online Coal Operators' Conference Faculty of Engineering and Information Sciences 2018 Mechanics of Rib Deformation at Moranbah North Mine - A Case Study Yvette Heritage
End-wall Slope Stability Analysis of Surface Coal Mine under the Combined Open-pit Mining with Underground Mining
 End-wall Slope Stability Analysis of Surface Coal Mine under the Combined Open-pit Mining with Underground Mining Hongge Peng* School of Mines, China University of Mining & Technology, Xuzhou, Jiangsu
Coal Mining Methods. Underground Mining. Longwall & Room and Pillar Mining. Fig. 1: Longwall Mining
 Coal Mining Methods Underground Mining Longwall & Room and Pillar Mining Longwall mining and room-and-pillar mining are the two basic methods of mining coal underground, with room-and-pillar being the
CO 2 Atlas Assessment of Geological Storage Potential
 CO 2 Atlas Assessment of Geological Storage Potential by M. Cloete 08/04/2010, Gaberone Introduction The aim of a CO2 storage atlas is to identify the availability of geological sites that are both safe
SEISMIC PEAK PARTCILE VELOCITY AND ACCELERATION RESPONSE TO MINING FACES FIRING IN A LIGHT OF NUMERICAL MODELING AND UNDERGROUND MEASUREMENTS
 1990 1991 1992 1993 1994 1995 1996 1997 1998 1999 2000 2001 2002 2003 2004 2005 2006 2007 2008 2009 2010 2011 2012 2013 2014 2015 2016 Number of tremors SEISMIC PEAK PARTCILE VELOCITY AND ACCELERATION
Mining through areas affected by abnormal stress conditions at Syferfontein Colliery
 Mining through areas affected by abnormal stress conditions at Syferfontein Colliery by C. egote* Paper written as project work carried out in partial fulfilment for BEng (Mining Engineering) degree Synopsis
Main Means of Rock Stress Measurement
 Real Stress Distributions through Sedimentary Strata and Implications for Reservoir Development and Potential Gas and Coal Development Strategies Ian Gray Sigra Pty Ltd 93 Colebard St West, Acacia Ridge,
Longwalls 201 to 204 Coal Resource Recovery Plan. November 2016
 Longwalls 201 to 204 Coal Resource Recovery Plan November 2016 DOCUMENT CONTROL DOCUMENT DETAILS Title LW201-204 Coal Resource Recovery Plan Reference Document Status Ashton Longwalls 201 to 204 Extraction
SLOPE STABILITY EVALUATION AND ACCEPTANCE STANDARDS
 INFORMATION BULLETIN / PUBLIC - BUILDING CODE REFERENCE NO.: LABC 7006.3, 7014.1 Effective: 01-01-2017 DOCUMENT NO.: P/BC 2017-049 Revised: 12-21-2016 Previously Issued As: P/BC 2014-049 SLOPE STABILITY
Large scale three-dimensional pit slope stability analysis of the structurally controlled mechanism in Mae Moh coal mine
 APSSIM 2016 PM Dight (ed.) 2016 Australian Centre for Geomechanics, Perth, ISBN 978-0-9924810-5-6 https://papers.acg.uwa.edu.au/p/1604_40_chaiwan/ Large scale three-dimensional pit slope stability analysis
THIS IS A NEW SPECIFICATION
 THIS IS A NEW SPECIFICATION ADVANCED GCE GEOLOGY Environmental Geology F794 * OCE / 12441* Candidates answer on the Question Paper OCR Supplied Materials: None Other Materials Required: Electronic calculator
Longwall Caving in Potash Mining Geomechanical Assessment of Damage and Barrier Integrity
 Longwall Caving in Potash Mining Geomechanical Assessment of Damage and Barrier Integrity Wolfgang Minkley, Christoph Lüdeling Institut für Gebirgsmechanik, Leipzig 50th ARMA Symposium, Houston 29 June
Application of Core Logging Data to generate a 3D Geotechnical Block Model
 Application of Core Logging Data to generate a 3D Geotechnical Block Model Engineering Geology and Innovation: Research Infrastructure - Sustainable Development (I.A.E.G) Eleftheria Vagkli, M.Sc. Senior
Uniaxial Compressive Strength Variation for Multi-point Support Design and Discontinuity..
 IOSR Journal of Applied Geology and Geophysics (IOSR-JAGG) e-issn: 2321 0990, p-issn: 2321 0982.Volume 5, Issue 4 Ver. I (Jul. Aug. 2017), PP 53-62 www.iosrjournals.org Uniaxial Compressive Strength Variation
Geotechnical modelling based on geophysical logging data
 University of Wollongong Research Online Coal Operators' Conference Faculty of Engineering and Information Sciences 2013 Geotechnical modelling based on geophysical logging data Peter Hatherly Coalbed
2. Initial Summary of Preliminary Expert Opinion of Converse and Psomas Reports
 UNITED WALNUT TAXPAYERS PRELIMINARY REVIEW OF NEGATIVE GEOTECHNICAL AND GEOLOGICAL ASPECTS OF CONSTRUCTING EARTHFILL PAD FOR A SOLAR FARM ON THE WEST PARCEL - DRAFT 1. Introduction A licensed Engineering
Tuesday 6 June 2017 Afternoon
 Oxford Cambridge and RSA Tuesday 6 June 2017 Afternoon A2 GCE GEOLOGY F794/01 Environmental Geology *6783378785* Candidates answer on the Question Paper. OCR supplied materials: None Other materials required:
Effect of buttress on reduction of rock slope sliding along geological boundary
 Paper No. 20 ISMS 2016 Effect of buttress on reduction of rock slope sliding along geological boundary Ryota MORIYA *, Daisuke FUKUDA, Jun-ichi KODAMA, Yoshiaki FUJII Faculty of Engineering, Hokkaido University,
Lima Project: Seismic Refraction and Resistivity Survey. Alten du Plessis Global Geophysical
 Lima Project: Seismic Refraction and Resistivity Survey Alten du Plessis Global Geophysical Report no 0706/2006 18 December 2006 Lima Project: Seismic Refraction and Resistivity Survey by Alten du Plessis
Prevention and Control of Rockbursts in Dongguashan Copper Mine
 Prevention and Control of Rockbursts in Dongguashan Copper Mine L. Tang Central South University, Changsha, P. R. China K. Xia University of Toronto, Toronto, Canada ABSTRACT: A seismic monitoring system
Appin Colliery - Longwall 705
 REPORT: END OF PANEL SUBSIDENCE MONITORING REPORT BHP BILLITON ILLAWARRA COAL: Appin Colliery - Longwall 705 End of Panel Subsidence Monitoring Report for Appin Longwall 705 MSEC JUNE 2014 REPORT NUMBER: