Titanium Oxide Nanotubes: Synthesis, Properties, and. Applications for Solar Energy Harvesting
|
|
|
- August Bishop
- 5 years ago
- Views:
Transcription
1 Titanium Oxide Nanotubes: Synthesis, Properties, and Applications for Solar Energy Harvesting A dissertation presented by Eugen Panaitescu to The Department of Physics in partial fulfillment of the requirements for the degree of Doctor of Philosophy in the field of Physics Northeastern University Boston, Massachusetts April
2 Titanium Oxide Nanotubes: Synthesis, Properties, and Applications for Solar Energy Harvesting by Eugen Panaitescu ABSTRACT OF DISSERTATION Submitted in partial fulfillment of the requirements for the degree of Doctor of Philosophy in Physics in the Graduate School of Arts and Sciences of Northeastern University, April
3 Abstract Titanium oxide (titania) nanotubes, although relatively recently discovered (less than 15 years ago), have already shown great promise regarding solar energy harvesting applications, exhibiting very good photocatalytic and photovoltaic properties. An alternative anodization route for production of titania nanotubes at the surface of a titanium foil using chloride ions as catalyst instead of the routinely used highly toxic fluorides, is presented in this work. Moreover, the fabrication parameters are extensively studied, thus providing both an insight into the synthesis mechanism and hints towards possible process optimization routes. Although not forming uniformly over the sample surface and lacking long range ordering, very high aspect ratio (over 1000:1) nanotubes are rapidly formed (in minutes) by a self assembling mechanism. Thus, the method is a viable alternative route for the fast production of partially ordered titania nanotubes, both as films on top of a titanium foil, or as microscopic grains (powders or suspended in solutions). Since the as formed nanotubes are amorphous, attention is also given to the crystallization process, especially in the case of poorly studied powders. Attachment of other nanostructures such as cadmium telluride quantum dots, bio-composites (proteins), or gold nanoparticles for the synthesis of hybrid materials combining properties of both composites have been studied too. Also, possible applications of these new materials in two solar energy technologies: photovoltaic electricity generation using dye sensitized solar cells (DSSC s), and hydrogen production by the photoelectrochemical (PEC) splitting of water are investigated. 3
4 Acknowledgments I would like to take this opportunity to thank everybody who helped me during my doctoral studies at Northeastern for their contributions to this work and their continued support. Prof. Latika Menon, a true advisor and guide, who continuously helped me in all aspects of my work. Her broad knowledge and experience in the field of nanoscience and nanotechnology, coupled with her energetic and continuously inquiring personality offered me invaluable help and kept me on a fast track towards finishing my projects. Prof. Don Heiman and Nathan Israeloff, who helped me with valuable assistance, advices, inquiries and input throughout all the stages of the present work. Prof Alain Karma for his theoretical insights and advices, for the valuable computational physics skill I acquired during our collaboration. My lab colleagues Christiaan Richter, Wu Zhen, Adam Friedman, who made my passage from theoretical physics into experimental work much easier, and who were my partners in most of the projects I completed during the three years I worked in the nanofabrication laboratory. My colleague Mohamed AbdElmoula, who joined the lab with a lot of enthusiasm and fresh ideas, and with whom I gladly and successfully collaborated in the past year and a half. The Department of Physics at Northeastern University, and the University s scientific community, for the working environment they created, helping me to accomplish all the scientific projects I was involved in. 4
5 Table of Contents Abstract...3 Acknowledgments...4 Table of Contents...5 List of Figures...9 List of Tables...15 Chapter Introduction Motivation Overview...17 Chapter Titania Nanotubes Synthesis: Review of Fabrication Methods Introduction Electrochemical Anodization and Its Applications in Nanotechnology Titanium Oxide Nanostructures Obtained by Anodization Early Work First Ordered Nanotubes Arrays Synthesized by Anodization in Fluoride Ion Containing Media Evolution of the Fluoride Synthesis Method
6 Recent Results in Fluorides: Towards Unlimited Nanotube Length Fluoride Method - the Role of Various Anodization Parameters in Nanotube Morphology Replacing the Fluoride Ions by Chloride and Perchlorate Ions Other Synthesis Methods...26 Chapter Titania Nanotubes Synthesis: A New Anodization Route Chloride Ions as Alternative Catalyst Anodization Setup Initial Results Anodization Parameters Acid s Nature Anodization Voltage Chloride Ions Concentration Cations Nature Non-Aqueous Electrolytes Other Parameters...47 Chapter Chlorine Nanotubes: Properties, Formation Mechanism, and Process Optimization48 6
7 4.1. Nanotubes Properties Morphological Characterization Carbon Content Optical Properties Tubes Formation Mechanism Process Optimization Particularities of Nanotubes Formation in Chlorine Salts Optimization by Double Anodization Optimization by Using Non-Aqueous Electrolytes...76 Chapter Crystallization of Titania Nanotubes Powders...82 Chapter Applications Photovoltaic Cells Dye Sensitized Solar Cells - Introduction Experimental Setup and Calibration Measurements Photovoltaic Properties of Titania Nanotubes Produced in Chlorine Containing Electrolytes Photovoltaic Properties of CdTe decorated Titania Nanotubes Arrays
8 6.2. Photoelectrochemical Hydrogen Production Gold Attachment for Photocatalytic Applications Chapter Conclusions and Future Outlook References
9 List of Figures Figure 1 A schematic diagram from O Sullivan and Wood article [14] illustrating their theory that it is the focusing of electric field lines through the barrier layer that causes pore formation Figure 2 Scanning electron microscopy image of a typical nanotubes bundle. In the inset the bundle is shown under high magnification revealing that it is indeed made up of a tightly packed collection of individual nanotubes. Anodization conditions for this particular sample were 13 V in 0.5 M oxalic acid with 0.3 M NH 4 Cl Figure 3 Schematic representation of the two-electrode anodization setup used throughout this work Figure 4 Typical curve I (A) vs. t (s) during the anodization process Figure 5 Scanning electron microscopy image of titania nanotubes (side view) fabricated by anodizing titanium foil at 18 V in an electrolyte consisting of 0.5 M oxalic acid, 0.1 M KCl, 0.15 M NH 4 Cl, and 0.15 M KOH Figure 6 Typical plots of current versus time also depicting the way we calculate the average plateau current of anodization the (samples presented were anodized in 0.5 M gluconic acid and 0.4 M ammonium chloride at different voltages indicated in the figure) Figure 7 Plot of the plateau current versus voltage for the different organic acids we used (the plateau current was calculated as an average of the anodization current over the 100-s interval from t = 60 s to t =160 s; see Figure 6) Figure 8 Dependence of the average plateau current with the chlorine ions concentration of the solution, for different anodization voltages. a) V = 11V; b) V = 13V Figure 9 Average plateau current for different cations. No significant dependence is observed in the range of voltages 11-16V Figure 10 SEM images of samples anodized in non-aqueous electrolytes: top row in formamide at 40V, step-like corrosion and nanofibers formation after 30 minutes of anodization; bottom left in glycerol at 90V, uniform porous and scattered 9
10 nanotubular structures are formed after 1h of anodization; bottom right in dimethylsulfoxide (DMSO) at 40 V ordered bundles of nanotubes are formed in sites of the order of hundreds of micron squared covering the whole sample surface after 15 minutes of anodization Figure 11 Evolution of anodization current as it was recorded during anodization of two samples batches (2% water containing electrolyte, up, 20% water down); straight lines are representations of how the average current was calculated in order to construct the data points from the first plot. Three different zones can be identified in both cases, corresponding to three different outcomes of the anodization process Figure 12 Dependence of the average anodization current with the anodization voltage for two different values of water content (see Figure 11 for details). The three different zones regarding the outcome of the anodization are also indicated Figure 13 SEM images showing different morphologies and views of the titania nanotubes bundles formed by anodization of titanium sheets in chlorine (0.4M NH 4 Cl) containing electrolytes. The experimental conditions are not necessarily related to the morphology depicted. a) Bundles up to 10 μm long and 3 μm wide of nanotubes loosely ordered in one direction (0.5M formic acid, 14V). b) Tightly packed nanotubes forming ordered grains with quasi-rectangular facets (0.5M gluconic acid, 13V). c) Tubes agglomerations allowing a top view of the bundles (0.02M hydrochloric acid, 17V) d) Large formations of nanotubes with a preferred growing direction (0.02M hydrochloric acid, 18V) Figure 14 SEM images depicting various types and degrees of ordering of the titanium oxide nanotubes. The specific experimental conditions are not necessarily related to the morphology depicted. a) Totally disordered agglomerations of relatively short (less than 500nm) nanotubes (0.5M formic acid, 15.5V). b) Highly disordered agglomerations of long nanotubes (0.5M gluconic acid, 13V). c) Loosely packed nanotubes with one preferred direction, allowing formation of bundles (0.5M gluconic acid, 12V). d) Tightly packed nanotubes with one preferred direction, allowing formation of grains (0.5M trichloroacetic acid, 14V). e) Tightly packed nanotubes with two perpendicular preferred directions, allowing formation of interwoven bundles (0.5M formic acid, 15.5V). f) Top view of a bundle clearly showing the tubular aspect of the constituents (0.02M hydrochloric acid, 18V) Figure 15 SEM images of TiO 2 nanotubes released on a silicon substrate. a) bundle formed of tightly packed tubes relatively ordered along one direction; b) individual tubes up to several microns long
11 Figure 16 HRTEM images of the amorphous TiO 2 nanotubes Figure 17 Typical EDX spectra of: (A) A sample anodized at 12V in a 0.5M trichloroacetic acid solution and (B) a sample anodized at 13V in a 0.05M sulfuric acid solution. Peaks are labeled by element and transition (Kα, Kβ, Lα etc.) Figure 18 XRD spectra of a sample prepared in 0.02M hydrochloric acid (black) and 0.5M oxalic acid (red). Samples were annealed at 400 C in an Argon atmosphere for 4h before being powdered. Samples were found to be amorphous prior to annealing. The broad peaks at 2θ angles of approximately 10 and 18.6 were also consistently observed, irrespective of the acid used. Also given are the powder diffraction patterns of anatase (PDF ) and rutile (PDF ) Figure 19 Diffuse reflection spectra of titania nanotube samples anodized in Oxalic, Formic and Sulfuric acid with chlorine (0.4M NH 4 Cl) and a nanotube sample anodized in Hydrofluoric acid (0.5wt%). The spectrum of commercial anatase powder (Alfa Aesar 99.9%) is included for reference. The solar spectrum is also plotted as a dashed line corresponding to the right axis Figure 20 Macroscopic view of the samples, showing localization of the electric field and preferential formation of nanotubes. a) optical photo of the samples, showing that production of the nanotubes at the edges is always coupled with less intense production in the bulk (darker areas); b) low magnification SEM image, demonstrating preferential alignment of the nanotube formation sites along preexistent patterns in the original sheet (horizontal lines); c) low magnification SEM image showing tube formation originating from irregularities at the edge of the sample and occurring much more rapidly than in the bulk area Figure 21 Insight details on the formation of titanium oxide nanotubes at the surface of the titanium foil. a) Occurrence of a site where the nanotubes are still lying inside the bulk of the sample, tightly packed along the direction perpendicular to the surface of the sample; b) More usual view of a formation site, with tube bundles sticking out of the surface Figure 22 HRTEM pictures showing effects of the high speed formation of the tubes. a) Several layers of cup-like particles (right), and tubes showing easy breaking after the release on the TEM grid (left); b) Detailed view of a cup-like particle with the same diameter as the nanotubes
12 Figure 23 SEM images of the sample surface a) after the first anodization in a HF solution; b) after the second anodization in a chloride containing solution Figure 24 Current versus time plot for two samples anodized in standard chloride containing solutions (~0.02M HCl, 0.2M NH 4 Cl, ph = 1.65), with, and without preanodization in 0.5wt% hydrofluoric acid solution Figure 25 SEM images showing time evolution of nanotubes formation at 40V with 2% H 2 O content; after 60s of anodization, tubes several microns in length have already developed in a formation site Figure 26 HRSEM images showing top view of nanotubes obtained in DMSO after 15 minutes anodization with 2% H2O content, at 50 V (top), and tilted view of nanotubes anodized in similar conditions at 40V Figure 27 Titania nanotubes bundles several microns long are formed in DMSO (left), reaching up to 20 microns (right) Figure 28 Low resolution SEM image of initiation sites and demonstrating very good local sample coverage after 5 minutes of anodization Figure 29 Histogram of nanotubes diameters (132 total measurements) showing a wide distribution of values in the range of nm, with an average of 36 nm Figure 30 SEM views of titania nanotubes powders synthesized by anodization in chlorine (a-d) and fluorine (e-h) electrolytes Figure 31 SEM images of chlorine (a-c) and fluorine (d-f) titania nanotubes bundles after annealing at 400 C, suffering morphological damage at the nanoscale Figure 32 Typical DSC diagram of a sample heated and cooled to and from 350 C with a scan rate of 1 C/min Figure 33 TEM images of titanium nanotubes annealed at 1 C/min up to 250 C without crystallization (a), 350 C when crystallization was associated with partial granulation (b), and 300 C respectively when crystallization in relatively large single crystals and no tube damage occurred (c) Figure 34 XRD spectra for samples annealed to 250 C (a), and 350 C (b) respectively
13 Figure 35 Identification of annealing outcome for various parameters in the Temperature Scan / Final Temperature space Figure 36 The chemical structure of the N3 ruthenium dye (Ru(SCN) 2 L 2 with L = 2,2'- bipyridyl-4,4'-dicarboxylic acid) used to sensitize titania nanotubes. This is a common dye used in DSSC s for the past ten years. The dye used by us was synthesized by collaborators at Yale University Figure 37 Schematic representation of the custom setup used for photovoltaic measurements Figure 38 I-V curves of the same dye sensitized nanotube sample. The top curve is measured in fresh electrolyte and the lower curve is in the same electrolyte after it was exposed to the ambient containing humidity for 60 min. Although there is a sharp decline in performance over the first 60 min further exposure did not lead to anymore further significant decline in the maximum power output measured in the electrolyte Figure 39 I-V characteristics of DSSC s employing titanium oxide nanotubes obtained by anodization in chlorine containing solutions Figure 40 SEM images of CdTe nanoparticles supported on titania nanotubes arrays. First trials (a, b) were unsuccessful, micron size clumps of nanoparticles forming on top of the nanotubes. Successful trials (c, d) involved more uniform coverage (darker areas) of the nanotubes, without clumping and clogging Figure 41 Experimental setup for photoluminescence measurements Figure 42 a) Photoluminescence spectra for the CdTe nanoparticles attached on TNT s. b) Photoluminescence decay plot for one of the samples. Measurements were taken at a wavelength of 618 nm Figure 43 a) I-V curves for the TNT s CdTe NP s hybrid structures, compared to a reference sample of pure nanotubes arrays without the nanoparticles attached. b) Long time measurements performed on the maximum power point of one of the sample after adding new electrolyte, revealing that stabilization of the voltage occurs after about 75 minutes
14 Figure 44 Schematic diagram of the PEC cell with light source, electrolyte and the three electrodes. The main photoelectrochemical reactions involved are also represented Figure 45 Falsely colored SEM image presenting morphology details of the nanotubes arrays used in this section measurements Figure 46 (a) Photocurrent I ph per unit area of the sample (b) Bias voltage, V bias and (c) Percentage of PEC efficiency η c calculated using equation (4) for various working electrode potential values. Vertical dashed lines at maximum η c are added as a convenience to the reader Figure 47 High resolution SEM image of low aspect ratio titania nanotubes before (left) and after (right) the first successful deposition of approximately 2 nm diameter gold nanoparticles on the tubes walls. Scale bar is 20 nm for both images Figure 48 SEM image of high aspect ratio titania nanotubes. Side view showing uniform deposition on the whole length of the nanotubes (top left); Side view of broken nanotubes demonstrating similar uniformity of gold nanoparticles deposition both inside and outside the tubes (top right); Detailed view of gold supported high aspect ratio nanotubes on a falsely colored SEM image. All scale bars are 200 nm Figure 49 a) TEM image of gold nanoparticles supported on a fragment of a high aspect ratio titania nanotube b) TEM image of the nanotube wall exhibiting gold particles on both sides. c) HRTEM image revealing the crystalline structure of the gold nanoparticles on the amorphous titania support d) EDX spectrum of the TEM sample, with the relative concentration of the elements of interest shown in the inset
15 List of Tables Table 1 Experimental conditions for the different acids used Table 2 Tube diameters for different experimental conditions (no significant dependence with the nature of acid, or anodization voltage observed) Table 3 Atomic percentages of carbon, oxygen, chlorine, and titanium in the titania nanotubes for different acid solutions used Table 4Summary of synthesis and annealing conditions for titania nanotubes samples.. 96 Table 5 Summary of photovoltaic properties of DSSC s employing titania nanotubes Table 6 Photovoltaic properties of the CdTe attached samples with respect to a blank reference. Values from previous measurements in the same setup corresponding to a typical dye sensitized sample containing approximately 10 times longer nanotubes (and correspondingly 10 times larger total active surface) were added in the last row also for reference Table 7 Fabrication conditions and morphological properties for all samples tested
16 Chapter 1 Introduction 1.1. Motivation Predicted and pioneered by the revolutionary discoveries in quantum and solid state physics from the first half of the twentieth century, boldly announced by the visionary speech There s Plenty of Room at the Bottom by Richard Feynman[1] at the annual American Physics Society meeting in December 1959, nanoscience and nanotechnology emerged as a powerful field which nowadays is at the fringe of scientific and technological progress, continuously attracting growing interest. The discovery of an interesting alternative route for the fabrication of titanium oxide nanotubes in our nanofabrication lab[2] prompted me to tap into this exciting field. Moreover, one of the most promising technologies for solar energy production is represented by the relatively recently discovered dye sensitized solar cells (DSSC s or Grätzel cells[3]), which use nanoparticulate semiconductors (specifically titanium oxide) coated with solar spectrum matching dyes. Since titania nanotubes seem to fit perfectly this kind of applications, this placed my research at the confluence of nanotechnology with another contemporary challenge, the search for alternative energy resources. The projects I completed had also an educational and formational side for me, as they offered me the opportunity to access and study nanotechnology in almost all of its aspects, from the fabrication stage to specific characterization, theoretical insights, 16
17 process optimization, all the way to device design and fabrication and specific applications. The following section offers an overview of all the stages of my study which are then presented in details throughout the following chapters Overview The goal of this thesis is to study the synthesis of titania nanotubes using electrochemical anodization techniques, create hybrid materials by the addition of other nanoparticulate composites, and furthermore approach some solar energy harvesting applications of these new materials. The important electrochemical parameters controlling the growth of the nanotubes have been extensively studied and optimized. Also, appropriate post-fabrication processing conditions such as heat treatment conditions have been optimized for the production of crystalline anatase titania nanotubes. Chapter 2 offers a literature survey on the development of fabrication methods for titania nanotubes. Our experimental work on titania nanotubes arrays by anodization of titanium sheets has led to the discovery of electrochemical fabrication of titania nanotubes by using chloride ions in place of fluorine ions. Chapter 3 describes our detailed work in this regard [4, 5], and the important electrochemical parameters controlling the synthesis are discussed. Chapter 4 reviews the detailed characteristics of the nanotubes as revealed by electron microscopy and by spectral and optical studies. A mechanistic explanation of the synthesis process[5, 6], much faster and with radically different results than the anodization in fluoride ions containing electrolytes is also presented. 17
18 Chapter 5 describes the challenges encountered when annealing titania nanotubes powders for crystallization purposes, and how related parameters have been adjusted for optimal results. Chapter 6 presents our results on photovoltaic properties of titania nanotubes and modified titania nanotubes[7, 8] (CdTe-attached, gold-attached, etc.). A custom experimental setup, easy to adapt for both photovoltaic and photocatalytic[9] (water splitting) measurements has been developed and subsequently used for these studies. Finally, Chapter 7 provides a summary of the results and describes future outlook. 18
19 Chapter 2 Titania Nanotubes Synthesis: Review of Fabrication Methods 2.1. Introduction Electrochemical Anodization and Its Applications in Nanotechnology Electrochemically oxidized metals have been used for long time because the oxide coating had a protective and sometimes decorative role, especially in the case of aluminum and aluminum alloys. After the discovery of micro- and nanoscale characterization techniques like scanning electron microscopy (SEM), it was also discovered that for given anodization parameters well ordered nanoscale structure are obtainable by electrochemical anodization [10]. After this initial discovery, the new field gathered increasing interest, and notable progress has been achieved since. In 1953, Keller et al. [11] described for the first time porous alumina as a duplex structure consisting of a micron size wide porous layer, and a few nanometer size one, interfacing the pores with the aluminum support, called the barrier layer. Keller also studied the relationship between pore structure (pore diameter and ordering) and applied voltage. In 1968 J. W. Diggle and T. C. Downie[12] published the first review paper dealing with anodic oxide films on aluminum. The Manchester group led by Thompson and Wood then dedicated my studies to anodized alumina in the decades from 1970 to 1990[13]. The 1970 article by O Sullivan and Wood The Morphology and Mechanism of 19
20 Formation of Porous Anodic Films on Aluminium [14] is one of the most cited articles on anodization of aluminum to obtain porous alumina structures. This article also paved the first steps to a theoretical understanding of electrochemical anodization, as they attributed the inherent instability of field focusing as the mechanism for pore creation in the barrier oxide (see Figure 1). Figure 1 A schematic diagram from O Sullivan and Wood article [14] illustrating their theory that it is the focusing of electric field lines through the barrier layer that causes pore formation. Comprehensive recent reviews of nanoporous alumina such as those of L. Menon [15, 16] and that of S. Shingubara [17] provide a detailed up-to-date description of the field. 20
21 2.2. Titanium Oxide Nanostructures Obtained by Anodization Early Work First Ordered Nanotubes Arrays Synthesized by Anodization in Fluoride Ion Containing Media Early works on anodic titania nanoporous and nanotubular structures were conducted during late 1990 s and early 2000 s by several research groups, mainly those of E. Darque-Ceretti of the Ecole des Mines de Paris, P. Schmuki of Friedrich-Alexander University in Erlangen Germany and that of C. Grimes at Pennsylvania State University. Zwilling & Darque-Ceretti used chromic acid combined with a small amount of hydrofluoric acid in their 1997 [18] and 1999 trials [19, 20]. These were the first reports of the formation of a nanoporous structure in titania. It was clear that the nanoporous structure observed only formed when sufficient HF was added to the electrolyte mixture, as pure chromic acid was leading to the formation of a thin but stable oxide layer with no apparent pore structure. In 2001 the Grimes group discovered that titania nanotubes could be grown by using an electrolyte consisting primarily of HF acid (0.5wt%) together with higher anodization voltages [21]. This finding revived interest in the anodization of titania. Grimes and co-workers initially focused primarily on promising sensor applications [22-24], but soon also realized the potential of these arrays in photocatalytic applications [25-30]. The group of P. Schmuki, using a mixture of sulfuric acid and a small amount of HF (0.15wt%) [31], reported the synthesis tube-like structures in In 2005 they published a series of articles [32-43], primarily exploring the use of 21
22 alternative acid combinations, like phosphoric acid [41] (as did Zhao et al. [44]) and acetic acid [32] in combination with HF or other sources of fluorine like NH 4 F. Tubes up to 500 nm long were produced by this method in about minutes of anodization Evolution of the Fluoride Synthesis Method A second important innovative step of the Grimes group was to find anodic conditions under which longer nanotubes can be grown. Unlike anodized alumina, where pore length increases indefinitely with anodization time, both porous titania and titania nanotubes reach a steady state length when anodized. That is, after typically 10 to 20 minutes of anodization the rate of etching of the pore (or tube) floor equals the rate of dissolution of the pore (or tube) walls so that the pore (or tube) depth does not show any further increase with additional anodization time. At least, this is what was observed for the acidic electrolytes mentioned in the previous section. Grimes and co-workers were motivated to overcome this limitation since they felt that an increase in length of these nanotubes not only enhances the effective surface area of the nanotubes but also reduces failures in devices such as high temperature sensors, where the electrode material can diffuse and come into contact with the unanodized part of the titanium substrate [45]. Recognizing that there appears to be a connection between ph and/or fluoride ions concentration and the dissolution rate of titanium dioxide during anodization Grimes and co-workers experimented with the use of other fluorine salts (as fluorine ion source besides HF) and combined buffers, bases and milder acids to adjust the ph and fluorine 22
23 ion content. Salts like KF, NH 4 F and NaF totally dissociate in aqueous solution and then hydrolyze with water to form HF. Moreover, HF is a relatively mild acid and in acidic solutions (ph<3.45) more than 50% of the fluorine exists in the form of HF. As a result ph and fluorine ion concentration are closely related (and solutions with KF, NaF or NH 4 F and no additional acid are basic.) The experiment worked and Grimes and coworkers found that they could grow nanotubes up to 4.4 µm using a solution of 0.1M KF as fluorine source, 1M H 2 SO 4 as acid, 0.2M citric acid (trisodium citrate) presumably serving as buffer and NaOH as base to be added until the desired ph of 4.5 was obtained. The anodization voltage was 25V and the anodization time was 20 h [45]. Later in 2005 Grimes and co-workers reported even longer nanotubes of up to 6 µm, over 17 to 20 h of anodization at 25V [26, 28, 45] using the same electrolyte as before. Schmuki and co-workers followed the new breakthrough with their own studies in which long titania nanotubes were grown using fluorine salts like NaF and NH 4 F. These reports explore finer points like the time resolved growth characteristics [46], controlling morphological aspects [34, 39, 40, 47], wettability characteristics [43, 48], electrochemical measurements [49], photoelectrochemical measurements [42, 50], annealing [51] and different acid combinations [41]. Raja et al. published a study addressing the theory of titania nanotube formation [52]. Two studies, in addition to those of Grimes and co-workers, making use of the new longer titania nanotubes in photocatalytic application have also recently appeared, that of Park & Bard [53] and that of Quan et al. [54]. 23
24 Recent Results in Fluorides: Towards Unlimited Nanotube Length The next major development in the fabrication of titania nanotubes was to replace water by other solvents. In 2003 the groups of Schmuki [37, 55] & Grimes [56] independently demonstrated that titania nanotubes could also be obtained by anodization of titanium foil in non-aqueous electrolytes containing fluoride ions. It was immediately apparent that there are several benefits to using non-aqueous solvents. Most importantly it appears that protons (or acidity ) play an important role in the chemical dissolution of nanotube walls [57, 58]. Since water, even at higher ph, has a relatively higher acidity than many other solvents wall dissolution rates and hence the length of nanotubes obtainable. In 2007 Grimes and co-workers published the synthesis of 0.36mm long nanotubes [59], practically demonstrating that the nanotube lengths was only limited by the initial titanium foil thickness. The nanotubes were grown from a 0.25mm thick titanium foil. The final thickness of the titanium dioxide nanotube array post anodization was 0.72 mm with virtually all titanium consumed by nanotubes that grew from both sides of the foil. Since firstly the molar specific volume of titanium dioxide in general, and that of oxide nanotubes with their significant void space in particular, is greater than that of the metal and secondly Ti 2+ loss to the solution is low in non-aqueous electrolytes the sample expands as it gets oxidized. In theory, any length of nanotubes is now obtainable given a sufficiently thick starting foil and enough anodization time. 24
25 In addition to low acidity, another major advantage is the ability to more precisely control and especially limit the concentration of oxygen donors in the electrolyte. The primary oxygen donor during anodization appears to be hydroxyl ions with oxygen ions from dissolved oxygen possibly playing a secondary role. When using water as the solvent one necessarily has high (relative to most anhydrous non-aqueous solvents) hydroxyl concentrations. Very acidic solutions are not desirable for the reasons outlined in the previous paragraph When an anhydrous non-aqueous solvent is used the hydroxyl content can be controlled from very low levels by using neat solvents to higher levels obtainable by adding controlled amounts of water. Water content has indeed emerged as a critical parameter in the length and quality of nanotubes obtained by anodization in nonaqueous solvents [59, 60]. Moreover, the high viscosity of the electrolytes slowed considerably the mobility of F - ions, consequently slowing down the dissolution of already formed nanotubes walls, and allowing for the oxidation to lead the formation process Fluoride Method - the Role of Various Anodization Parameters in Nanotube Morphology The dependence of pore diameter on voltage in titania nanotubes and pores mirror that of aluminum in the sense that pore or tube diameter increase with anodization voltage (see for instance [61]). As have been discussed extensively in the previous section, higher ph allow for the fabrication of longer tubes. In a very interesting study 25
26 Grimes and co-workers found that lowering the anodization bath temperature increase the titania nanotube wall thickness [29]. Hence, the anodization parameters of electrolyte ph, bath temperature and voltage allow for consider leverage in tuning the morphological characteristics to whatever is deemed desirable. But for its effect on ph and possible effect on fluorine content (as when using HF) the nature of the underlying acid used does not appear to have an additional significant impact on the final form of the titania nanotubes obtained Replacing the Fluoride Ions by Chloride and Perchlorate Ions In contrast to the previous research results, our group recently demonstrated the possibility of titania nanotubes synthesis by anodization in the absence of the fluoride ions in the electrolyte, an ingredient thought to be indispensable before. The presence of chloride ions instead of fluoride plays a similar catalytic role, and very high aspect-ratio nanotubes are formed[2]. This new synthesis method [4, 5] will be the focus of the next two chapters. In the light of these results other groups have demonstrated similar results using chloride, perchlorate and even bromide ions in aqueous and non-aqueous electrolytes Other Synthesis Methods In addition to electrochemical anodization, other methods have been developed to grow titania nanotubes, such as the hydrothermal route pioneered by Kasuga et al.[62, 63], or starting from porous alumina templates. 26
27 In the hydrothermal method, nanotubes powders are produced from nanoparticulate anatase precursors chemically treated with NaOH solutions and subsequently with dilute HCl solutions at high temperatures (over 100 C), resulting in the production of spaghetti-like crystalline nanotubes dispersed on the substrate. In 1996 Hoyer et al. demonstrated [64] a route for the electrochemical deposition of TiO 2 in PMMA negative molds starting from porous alumina templates. While the arrays were very ordered before removing the molds, many nanotubes collapsed after heating and removing the PMMA negative template, so that ordering was no longer present. Recent sol-gel methods, again starting from alumina templates, have been also reported. A titanium isopropoxide solution in an organic solvent (isopropanol) was the precursor for the titanium oxide. After circulating the solution through the porous alumina membrane and then subsequent heating and cooling followed by alumina template dissolution in NaOH, titanium oxide arrays with a good ordering have been obtained. However, all these methods are quite tedious, and imply several time consuming steps, thus constituting a less desirable alternative to the direct self assembly method of anodizing titanium foil. 27
28 Chapter 3 Titania Nanotubes Synthesis: A New Anodization Route 3.1. Chloride Ions as Alternative Catalyst As presented in the previous chapter, until recently it was believed that fluoride ions are critical and maybe impossible to replace as catalyst[45] for the synthesis of titania nanotubes arrays by anodization, due to their unique property of reacting with titanium oxide forming the TiF 2-6 complex which was furthermore dissolved into the solution [29, 47]. As a consequence, all anodic nanotubes arrays reported before 2007 were produced in fluoride ions containing electrolytes. Assuming the possibility that chloride ions could have similar catalytic properties, thus constituting (at least) a less hazardous alternative to the highly toxic hydrofluoric acid, several trials have been performed in our laboratory in the summer of 2006 involving solutions of various acids (organic or inorganic) in combination with chlorine salts as the anodization electrolyte. While those trials resulted in the expected formation of a thin oxide layer on the surface of the original titanium foil, followed in some cases by the quick formation of corrosion pits in various weak spots on the sample surface, or on its edges. However, closer inspection of those corrosion pits revealed the presence of titania nanotubes bundles with lengths up to microns and a cross section of the order of square microns (see Figure 2). The successful synthesis of high aspect ratio titania nanotubes in chloride ions 28
![containing electrolytes has been thus for the first time reported by our lab [2], and systematic studies have been employed for further optimization of the process.](/docs-images/89/99388811/images/29-0.jpg "Figure 2 Scanning electron microscopy image of a typical nanotubes bundle.")
29 containing electrolytes has been thus for the first time reported by our lab [2], and systematic studies have been employed for further optimization of the process. Figure 2 Scanning electron microscopy image of a typical nanotubes bundle. In the inset the bundle is shown under high magnification revealing that it is indeed made up of a tightly packed collection of individual nanotubes. Anodization conditions for this particular sample were 13 V in 0.5 M oxalic acid with 0.3 M NH 4 Cl Anodization Setup All the samples synthesized in our lab throughout this work were produced by a two-electrode DC anodization process in a beaker containing the desired electrolyte, with the initial titanium foil acting as the working anode, and a platinum mesh as the cathode (see Figure 3). The electrodes were separated by a distance of 4 cm. The two-electrode 29

30 configuration was preferred to the standard three-electrode configuration for simplicity and cost effectiveness reasons, as the results were proven to be similar Figure 3 Schematic representation of the two-electrode anodization setup used throughout this work. The constant voltage was provided by a computer-assisted Agilent 6811B power supply (Agilent Technologies, Santa Clara, CA), which was also employed for measuring and recording the external current with the aid of a LabVIEW program. Figure 4 is depicting a typical curve of the current variation during anodization. Common features can be observed: an initial current burst due to the rapid formation of an oxide layer all over the surface of the metal foil, followed by a rapid decrease, and a relative stabilization of the current corresponding to the continuous tubes formation. 30
31 Figure 4 Typical curve I (A) vs. t (s) during the anodization process Initial Results As presented before, a first success in the synthesis of titania nanotubes by anodization at V DC in chloride ion containing electrolytes was obtained through the use of various acid solutions (oxalic acid 0.5M, formic acid 0.5M, sulphuric acid 0.05M) in combination with chlorine salts (NH 4 Cl, KCl) in concentrations varying from 0.3 to 0.6M. KOH or NaOH was also added sometimes in order to control solution s ph, and successful results were obtained for ph values in the range. Micron size 31

32 bundles of nanotubes averaging around 25 nm in diameter and with a wall thickness around 5 nm were spotted both on select attack areas on the sample (see Figure 5), and also forming a precipitate on the bottom of the beaker as they were released into the solution. Figure 5 Scanning electron microscopy image of titania nanotubes (side view) fabricated by anodizing titanium foil at 18 V in an electrolyte consisting of 0.5 M oxalic acid, 0.1 M KCl, 0.15 M NH 4 Cl, and 0.15 M KOH. The most striking result when compared with similar conditions employing fluoride ions was the extremely quick formation (occurring in the first 60 seconds of anodization and continuing throughout the process with the release of nanotubes bundles in the solution) of very long nanotubes (aspect ratio of the order of 1000:1). By comparison, such lengths (and corresponding aspect ratios) are attained in fluorides only 32
33 after tens of hours of anodization. This motivated us to further continue our study in order to optimize the anodization parameters for better, more uniform sample coverage with formation sites, ideally leading to the formation of ordered nanotubes arrays while keeping the advantages of using chlorine instead of fluorine Anodization Parameters The anodization process can be influenced, and maybe controlled, by many external factors, as demonstrated also in the case of using fluoride ions. Such factors include the anodization voltage, duration, and temperature, the concentration of chloride ions in the solution, the nature of substances composing the electrolyte (acid s nature, aqueous or non-aqueous solvent, the nature of cations in the chlorine salt, addition of other compounds), solution ph (determined also by the concentration of acids), to name just a few of them. An exhaustive study of all these parameters would be almost impossible, so that we used instead a feedback mechanism, by finding the optimal fabrication conditions for few parameters, and then adjusting other parameters while keeping the first ones around optimal values, and so on. While far from perfect, this method still allowed us to find a quick route for improving the synthesis conditions, while also providing us with significant details regarding the formation mechanism, which could be inserted further in the feedback loop as theoretical aids. Our systematic study started by analyzing the role of voltage and chlorine ions concentrations in the formation of the nanotubes for several acid solutions used as electrolytes. A typical anodization current versus time plot (Figure 4) is quite similar to 33
34 the current versus time plot obtained in the case of porous alumina[65] or titanium oxide nanotubes arrays in fluorine containing media[66]. Initially, an abrupt initial drop of current is observed which is attributed to the formation of a titanium oxide film on the surface of the sample. This is followed by a plateau region where the nanotubes form. The average magnitude of plateau current is directly related to the reactivity of the solution, while the smoothness of the plateau current can be correlated with the uniformity of tube-formation Acid s Nature To fabricate the nanotubes, titanium foil was anodized at room temperature using the two-electrodes setup described above, with the foil serving as anode and a platinum mesh serving as cathode. All acids and chemicals were reagent grade, and for consistency reasons we used the same standard conditions for each acid. Acid name Acid concentration (M) NH 4 Cl concentration (M) Solution ph Trichloroacetic Oxalic Gluconic Formic Hydrochloric Sulfuric Table 1 Experimental conditions for the different acids used The chosen standard conditions consisted of a solution with ph around 1.5, and a chlorine ion content of 0.4 M. At the same time we kept a constant acid concentration of 0.5 M for the organic acids, in order to be able to compare the results related to the carbon content of the nanotubes. All the acids chosen have high dissociation constants so 34
35 that differences in dissociation were small enough to be neglected. The standard anodization conditions for each acid are summarized in Table 1. The anode active area was kept constant (1cm x 2.5cm), while the electrode spacing was 4 cm V = 19V, Ip = 861mA 0.6 I (A) 0.4 V = 16V, Ip = 344mA V = 13V, Ip = 56mA V = 11V, Ip = 1mA t (s) Figure 6 Typical plots of current versus time also depicting the way we calculate the average plateau current of anodization the (samples presented were anodized in 0.5 M gluconic acid and 0.4 M ammonium chloride at different voltages indicated in the figure). 35
36 1.0 Trichloroacetic acid (ph = 1.20) Oxalic acid (ph = 1.30) Gluconic acid (ph = 1.75) Formic acid (ph = 1.80) I p (A) Voltage (V) Figure 7 Plot of the plateau current versus voltage for the different organic acids we used (the plateau current was calculated as an average of the anodization current over the 100-s interval from t = 60 s to t =160 s; see Figure 6). In order to explore the role of the electrolyte acid used on the formation of these new titania nanotubes, titanium was anodized in electrolytes containing chlorine in combination with oxalic, formic, trichloroacetic, gluconic, hydrochloric, and sulfuric acid. Samples were anodized in a standard solution (defined above) for each of the acids at fixed voltages as low as 8V and as high as 20V. For all solutions anodization at 36
37 lower voltages (typically below 11V) did not yield any nanotubes. However, for voltages above a specific threshold, titania nanotubes were obtained with every one of the acids chosen for this study Anodization Voltage For titania nanotubes fabricated by anodization in fluoride media, the nanotube (or pore) diameter increase steadily with an increase in anodization voltage[21, 45]. This is not the case for the nanotubes fabricated in chlorine media reported on here. That is, there appear to be no variation of nanotube diameter with voltage. Diameters of all tubes were typically between 15 and 35 nm with an average around 25nm. Wall thicknesses were typically around 5nm. Nanotube length appears to be a function not so much of anodization time or conditions (f.i. acidity or voltage) but of where the rapidly forming tube bundles break. The fact that the upper limit tube length observed (around 60μm) is approximately half the initial foil thickness suggests that longer tubes could be grown using thicker titanium foil. The chemistry and underlying processes by which these nanotubes formed appeared to be very rapid. The anodization current density is typically high (around 0.5 A/cm 2 ) and the electrolyte bubbles vigorously at the cathode; most likely due to the evolution of H 2. A distinct chlorine smell suggests that chlorine is also generated. Unlike morphology, there do appear to be differences in reaction rates and the rate of nanotube formation between the different acids. The current vs. time plots recorded for each anodized sample were used to characterize the reactivity. Typical current vs. time plots 37
38 for samples anodized in gluconic acid are shown in Figure 6. In all cases a steep drop in anodization current were observed over the first few seconds. An initial spike in anodization current that rapidly decay is a feature common to the anodization of most metals and can be attributed to the rapid thickening of the pacifying oxide layer on the outside of the sample (titanium foil). If the applied voltage was below a threshold value for nanotube formation in the particular acid used, the initial rapid decline in the current transitioned into a much more gradual but sustained decline to very low levels (typically around or below 1mA see f.i. the 11V curve in Figure 6). In these samples, anodized at sub-threshold voltages, none of the macroscopic signs of nanotube formation like sample corrosion in attack areas were observed, even after anodization times of up to 1 hour. However, if the voltage was above the acid s threshold voltage the current reached a nonzero plateau (or asymptote) that was approximately maintained until the sample was completely consumed by the anodization process and started to disintegrate (See f.i. the curves in Figure 6 with applied voltage > 11V.). The first signs of sample corrosion appeared usually within one minute after the anodization started. The magnitude of this plateau appears to be a good indication of the reactivity of the sample and was found to be in good agreement with the visible effects of the reaction rate (the magnitude of gas formation at the cathode, and the speed of the sample corrosion at the anode). Figure 7 is a plot of the average height of the anodization current plateau I P for different voltages and organic acids (the average being always taken over the [60s, 160s] interval). Note that the average anodization current (I P ) increases monotonically with the applied voltage 38
39 for every acid used. Moreover, the data for every acid, except perhaps oxalic acid, fits a smooth curve. It was observed that contrary to all the other acids the 0.4M ammonium chloride formed a saturated solution and did not completely dissolve in the oxalic acid solution. It appeared that dissolution continued during the course of the reaction as chlorine ions were being consumed at the anode. This may perhaps account for the more erratic scatter of data encountered in the case of oxalic acid. From the plots it is however clear that nanotube formation is accompanied by a drastic increase in anodization current. Furthermore, from these curves one can find approximate values of the threshold voltage for every one of the acids used. For all voltages below the threshold, the average plateau current was less than 2mA. On the other hand, voltages only 0.5V above the threshold value yielded a plateau current that is at least an order of magnitude larger. The threshold voltage appears to be somewhat particular to the acid (or ph) used, but the values for the studied acids nonetheless lie in a very narrow range between 10.5 and 12V. There also appear to be a general, but not exact, trend that a higher ph results in a higher anodization current for any given value Chloride Ions Concentration As discussed in a previous section, anodization current as a function of time can provide a good insight into the reactivity of the solution, which in turn can be related to the formation speed and total yield of nanotubes. There, the chlorine concentration was maintained at 0.4M and it was noted that the average plateau current exponentially increases with anodization voltage. For different acids, we identified a threshold voltage 39
40 around the value of 11V associated with plateau currents of the order of 1mA/cm 2, below which nanotube formation is not detected after the initial formation of oxide layer. Figure 8 Dependence of the average plateau current with the chlorine ions concentration of the solution, for different anodization voltages. a) V = 11V; b) V = 13V. Next, we analyzed the role of chlorine ion concentration on the tube formation. The plots in Figure 8 show the dependence of the plateau current on chlorine 40
41 concentration for two different anodization voltages. This in turn may be related to the dependence of the reactivity on the chlorine concentration. For anodization voltage, V A = 11V identified as a threshold value in previous experiments at 0.4M [Cl - ] (see previous section), we observed nanotube formation for concentrations above 0.5M for hydrochloric acid, and 0.7M for formic acid. Thus a decrease of the threshold voltage is seen at high concentrations. Conversely at 13V, a value well above the threshold at 0.4M [Cl - ], barely leads to tube formation for small concentrations around 0.1M. This suggests that the threshold voltage is higher at smaller concentrations Cations Nature A similar experiment has been carried out in order to identify the influence of cation nature on the nanotube formation. For this, the standard ammonium chloride salt has been replaced by potassium chloride and calcium chloride respectively, keeping constant the other conditions such as voltage and chlorine ions concentration. Figure 4 is a plot of anodization plateau for the three different salts at three different voltages. No significant dependence with the cation nature can be identified in the 11V 16V range. Slight variations are thought to be a result of different dissociation constants of the salts. 41
42 Figure 9 Average plateau current for different cations. No significant dependence is observed in the range of voltages 11-16V Non-Aqueous Electrolytes A separate study has been conducted involving the use of non-aqueous electrolytes containing solutions of chlorine salts (NaCl). We expected, as in the case of fluoride salts, that the non-aqueous electrolytes would slow-down the dissolution while having a better control over the oxidation process. 42


 at 40 V ordered bundles of nanotubes are")


43 Figure 10 SEM images of samples anodized in non-aqueous electrolytes: top row in formamide at 40V, step-like corrosion and nanofibers formation after 30 minutes of anodization; bottom left in glycerol at 90V, uniform porous and scattered nanotubular structures are formed after 1h of anodization; bottom right in dimethylsulfoxide (DMSO) at 40 V ordered bundles of nanotubes are formed in sites of the order of hundreds of micron squared covering the whole sample surface after 15 minutes of anodization Formamide, ethylene glycol, glycerol, formamide and dimethyl sulfoxide (DMSO) have been used in the initial trials. These trials didn t yield expected results, but for the samples prepared in DMSO at voltages between 30 and 60 volts successful nanotubes synthesis has been achieved. 43
44 We extended our study for the DMSO electrolyte in a similar fashion as in section 3.4.2, investigating the role of anodization voltage. Previous experience with titania nanotubes produced in non-aqueous electrolytes containing fluoride salts [67] has shown that there is a trade-off between the smoothness of the process (and of the nanotubes obtained) and the adherence of the nanotubes arrays to the titanium substrate. This has been overcome in that case by adding various amount of water to the electrolyte, thus creating mixed aqueous non-aqueous solutions. We repeated this procedure also in the case of the chlorine tubes studied here. Two batches of samples were studied, one prepared in almost pure non-aqueous electrolyte (2% of water was still added for the initial dissolution of the salts used), and one containing 20% water. Both batches were anodized for the same amount of time (15 minutes) at various voltages in the V range. For both batches, for anodization voltages under 50 V, the anodization process was stable for the whole duration, thus creating uniform nanotubes ordered over relative long range (up to mm size, see section for details). The current versus time plots reflected this fact, as in the case of previous studies, as the plateau currents remained relatively constant throughout the anodization period (see zone II in Figure 11). In the same time, anodization voltages under 30 V resulted just in the formation of a passivated oxide layer without the nanotubes formation (reflected in the current versus time plots from zone I of Figure 11), while voltages over 50V produced a massive amount of corrosion together with nanotube formation, holes appearing both on the samples edges and in the bulk (zone III in the current versus time plots in Figure 11). 44


45 45

46 Figure 11 Evolution of anodization current as it was recorded during anodization of two samples batches (2% water containing electrolyte, up, 20% water down); straight lines are representations of how the average current was calculated in order to construct the data points from the first plot. Three different zones can be identified in both cases, corresponding to three different outcomes of the anodization process. The plateau current versus voltage plots for the two batches studied exhibited the same exponential increase for voltages above the threshold value (30V), as one can see in Figure 12. Figure 12 Dependence of the average anodization current with the anodization voltage for two different values of water content (see Figure 11 for details). The three different zones regarding the outcome of the anodization are also indicated. 46
47 Other Parameters Experiments have also been conducted in order to identify the role of other parameters, such as ph of the solution. Using slight variations in the hydrochloric acid concentration while keeping constant the overall chlorine ions concentration and the anodization voltage we varied the ph of the solution in the range 1-3 without significant variations in other parameters. As expected, a slight increase of reactivity is observed with increasing acidity of the solution (decreasing the ph). Thus, the notion of threshold voltage can be generalized to include a whole set of threshold parameters, the anodization voltage, and chlorine concentration being the most important. 47
48 Chapter 4 Chlorine Nanotubes: Properties, Formation Mechanism, and Process Optimization 4.1. Nanotubes Properties Morphological Characterization As we have seen in the previous chapter, for voltages above a specific threshold, titania nanotubes were obtained in organic or inorganic acid solution containing chloride ions. The nanotubes were typically observed in various attack areas, most often around the edges or holes that were etched through the surface of the anodized foils. It appears that samples are rapidly etched by the formation of nanotubes in these areas with bundles of nanotubes being released continuously into the electrolyte. The tubes themselves were either relatively ordered in bundles up to 60μm long or, sometimes, irregular agglomerations. SEM images of the nanotubes bundles described above can be seen in Figure 13. The bundles consist either of nanotubes that are packed parallel to each other along one direction, or of interwoven arrays of tubes in perpendicular directions. Usually all types of the previous structures were found on the same sample, so they could not be related to specific conditions. 48
49 Figure 13 SEM images showing different morphologies and views of the titania nanotubes bundles formed by anodization of titanium sheets in chlorine (0.4M NH 4 Cl) containing electrolytes. The experimental conditions are not necessarily related to the morphology depicted. a) Bundles up to 10 μm long and 3 μm wide of nanotubes loosely ordered in one direction (0.5M formic acid, 14V). b) Tightly packed nanotubes forming ordered grains with quasirectangular facets (0.5M gluconic acid, 13V). c) Tubes agglomerations allowing a top view of the bundles (0.02M hydrochloric acid, 17V) d) Large formations of nanotubes with a preferred growing direction (0.02M hydrochloric acid, 18V). 49
50 Figure 14 SEM images depicting various types and degrees of ordering of the titanium oxide nanotubes. The specific experimental conditions are not necessarily related to the morphology depicted. a) Totally disordered agglomerations of relatively short (less than 50
51 500nm) nanotubes (0.5M formic acid, 15.5V). b) Highly disordered agglomerations of long nanotubes (0.5M gluconic acid, 13V). c) Loosely packed nanotubes with one preferred direction, allowing formation of bundles (0.5M gluconic acid, 12V). d) Tightly packed nanotubes with one preferred direction, allowing formation of grains (0.5M trichloroacetic acid, 14V). e) Tightly packed nanotubes with two perpendicular preferred directions, allowing formation of interwoven bundles (0.5M formic acid, 15.5V). f) Top view of a bundle clearly showing the tubular aspect of the constituents (0.02M hydrochloric acid, 18V). There were no significant morphological differences between titania nanotubes manufactured in the different acids, or for different voltages (see Table 2 below). Several images showing the various morphologies and orientations of the nanotubes are presented in Figure 14. Acid name Voltage (V) Diameter Acid Diameter Voltage (V) (nm) name (nm) Gluconic ± 3.5 Formic ± 5.3 Trichloroacetic ± 3.8 Formic ± 4.3 Oxalic ± 2.5 Formic ± 4.6 Hydrochloric ± 2.8 Formic ± 5.5 Sulfuric ± 3.2 Formic ± 4.1 Table 2 Tube diameters for different experimental conditions (no significant dependence with the nature of acid, or anodization voltage observed). For titania nanotubes fabricated by anodization in fluoride media nanotube (or pore) diameter increase steadily with an increase in anodization voltage[21, 45]. This is not the case for the nanotubes fabricated in chlorine media reported on here. In particular, there appear to be no variation of nanotube diameter with voltage. Diameters of all tubes were typically between 16 and 35 nm with an average around 25nm. Wall thicknesses were typically around 5nm. Average diameters for different acids and anodization voltages were summarized in Table 2. Nanotube length appears to be a function not so 51
52 much of anodization time or conditions (f.i. acidity or voltage) but of where the rapidly forming tube bundles break. The fact that the upper limit tube length observed (around 60μm) is approximately half the initial foil thickness suggests that longer tubes could be grown with thicker foil. Further morphological details of the tubes were also obtained from electron microscopy images of the powder recovered from the sample or from the precipitate continuously released in the solution, and then released on a silicon substrate. SEM images reveal a tight packing of the tubes in the form of bundles. Many of them remained in the form of grains up to 50 microns length and several microns across even after several hours of sonication (Figure 15, a). On the other hand the individual tubes released were much shorter, of the order of 3 microns (aspect ratio up to 150). This suggests that individual tubes are very brittle (Figure 15, b). One can also observe the presence of individual tubes of various lengths before and after sonication, particularly of many hemispherical particles of the same diameter as the tubes, of the order of 20 nm (Figure 15b, Fig. 8). The latter may provide insight into the strength of the reaction, as we will discuss in the next section. 52
 bundle formed of tightly packed tubes relatively ordered along one direction; b) individual tubes up to several microns long.")

53 Figure 15 SEM images of TiO 2 nanotubes released on a silicon substrate. a) bundle formed of tightly packed tubes relatively ordered along one direction; b) individual tubes up to several microns long. The same precipitates can be also released on a TEM grid. Figure 16 presents HRTEM images of the individual nanotubes, confirming the diameter of about 20 nm, with a wall thickness of about 5 nm. The tubes are in an amorphous state, similar to those synthesized in fluorine containing media. EDAX measurement confirmed the 1:2 ratio of titanium to oxygen, with traces of chlorine (less than 5%) and carbon content which cannot be analytically interpreted due to the carbon content of the TEM grids. However, 53


54 we will see in the next section that a significant amount of carbon can be also detected through EDX measurement under SEM, on the nanotubes produced in solutions containing organic acids that were still attached to the sample. Figure 16 HRTEM images of the amorphous TiO 2 nanotubes Carbon Content The atomic composition of these nanotubes was analyzed using energy dispersive x-ray analysis (EDX). A summary of the quantification results are given in Table 3 and corresponding spectra are given in Figure 17. A significant amount of carbon was found in nanotubes fabricated in every one of the organic acids. The carbon content of tubes grown in formic, oxalic and gluconic acid were virtually the same; around 20%. The only exception was trichloroacetic acid where tube bundles with a carbon content of up to 45% were found. By comparing the carbon content of the organic acid tubes with the sulfur 54
55 content (around 4%) of the sulfuric acid tubes it does appear that organic anions are much more readily incorporated than inorganic ones. Interestingly enough the number of carbon atoms in the organic anion does not appear to be a factor in the final carbon content since formic (1 atom), oxalic (2 atoms) and gluconic acid (6 atoms) all have virtually the same carbon content. The chemistry forming the carbon containing layer or particles on the nanotubes appear to be very similar for these anions. The fact that trichloroacetic acid (2 atoms) carry additional chlorine atoms do however appear to impact this chemistry giving it a much higher carbon content. The chlorine role will be discussed shortly. (A) 1000 TiKα Intensity (Counts) ClKα 200 TiL CK OK TiKβ ClKβ Energy (kev) 55
56 (B) TiKα 1400 Intensity (counts) ClKα OK TiKβ SK TiL ClKβ Energy (kev) Figure 17 Typical EDX spectra of: (A) A sample anodized at 12V in a 0.5M trichloroacetic acid solution and (B) a sample anodized at 13V in a 0.05M sulfuric acid solution. Peaks are labeled by element and transition (Kα, Kβ, Lα etc.). Acid name Ti at% O at% C at% Cl at% S at% Trichloroacetic Oxalic Gluconic Formic Hydrochloric Sulfuric Table 3 Atomic percentages of carbon, oxygen, chlorine, and titanium in the titania nanotubes for different acid solutions used. 56
57 To determine the phase of the nanotubes the precipitate was scraped from the anodized samples where it was confirmed nanotubes have formed. This precipitate was annealed 400 C in an Argon atmosphere for 4 hours and powdered. The powder diffraction spectra of some of the samples thus analyzed is shown in Figure 18. Whilst the powder diffraction patterns indicated that samples were amorphous prior to annealing, the annealed samples have a distinct anatase pattern (e.g. oxalic acid curve in Figure 18) and in some cases traces of rutile structure also emerged (e.g. HCl curve in Figure 18). These XRD results exactly mirror those obtained for nanotubes fabricated in fluorine containing media. Fluorine based nanotubes are reported to be amorphous as fabricated and crystallize to anatase at around 230 C with rutile only emerging at around 430 C[51, 68]. While the data presented here is relevant for the carbon content discussion, a more detailed study regarding crystallization of chlorine nanotubes will be presented in the following chapter. The interpretation of these results is that the as fabricated tubes are amorphous titania. This conclusion is supported by the EDX data for the chlorine based tubes fabricated in sulfuric and hydrochloric acid (i.e. the non-organic acids) that revealed an approximately 1:2 ratio of Ti to O. The XRD data did not however show any trace of graphite or contain any peaks indicating the presence of titanium oxycarbide (TiC x O y ) for the organic acid samples[69, 70]. This result is consistent with that of Shanmugam et al.[71] who studied core-shell carbon coated titania particles with roughly the same carbon content observed here. They suggest that the carbon containing layers are too thin 57
58 (~2nm) to have the long range order necessary to give a detectable X-ray diffraction peak. The fact that the anatase to rutile transition appears to be suppressed in the carbon containing compared to the non-carbon containing samples (red vs. black spectrum in Figure 18) has been attributed by several authors as a sign and/or consequence of carbon coating[71, 72] A Sample: HCl Sample: Oxalic Rutile Anatase Intensity (Counts) R A R R A A A A&R A A A A&R A AA A A&R A θ (degrees) Figure 18 XRD spectra of a sample prepared in 0.02M hydrochloric acid (black) and 0.5M oxalic acid (red). Samples were annealed at 400 C in an Argon atmosphere for 4h before being powdered. Samples were found to be amorphous prior to annealing. The broad peaks at 2θ angles of approximately 10 and 18.6 were also consistently observed, irrespective of the 58
59 acid used. Also given are the powder diffraction patterns of anatase (PDF ) and rutile (PDF ). These results clarify the role of carbon in the formation chemistry of the new chlorine based nanotubes. In non-electrochemical systems it is a well documented fact that the combination of chlorine and TiO 2 alone is non-reactive. Fracassi et al.[73] for instance wrote that the pure chemical reaction between TiO 2 and Cl 2 needs high temperature (350 C) and the presence of a reducing agent, such as carbon to occur. A good discussion of the chemical and thermodynamic reasons informing this observation is given by Yang & Hlavek[74]. Yang & Hlavek demonstrated, using gas phase kinetic data, that the only reasonable mechanism for the low temperature chlorination of TiO 2 involves a ternary activated complex of TiO 2 -C-Cl. In the light of these facts the initial assumption that carbon is perhaps involved in the chlorine based chemistry responsible for the newly discovered nanotubes was not unreasonable. The results reported here, in particular the finding that nanotubes of similar dimensions and composition can be grown in purely inorganic electrolytes (0.02M HCl and 0.05M H 2 SO 4 ), indicate that chlorine (in conjunction with ph) alone is the only essential electrolyte ingredients for nanotube formation. There are several applications where the carbon coating of titania is desirable on account of benefits like the thermal stabilization of the anatase phase, increased or selective adsorption of reactants and better overall photocatalytic performance[71, 72, 75]. Some authors have also reported that carbon doping of titania can lead to its photo- 59
60 harvesting capability being expanded from the UV into the visible region[53, 76, 77]. In fact, we will see in the next section that carbon rich titania nanotube samples fabricated by the chlorine based anodization described here have significantly increased green region absorption[4]. As reported here it appears that organic acids together with chlorine salts can be used to fabricate titania nanotubes with considerable carbon content. Hence, the methods described here may be an efficient means of fabricating titania-carbon composites for use in photocatalytic applications. In fact, nanotubes appear to be a superior morphology for many photocatalytic applications [45, 78] Optical Properties The more vigorous chlorine chemistry appears to facilitate the incorporation of significant amounts of carbon derived from the organic anions in the acid into titanium oxycarbide surface layers. The carbon containing phase appears to be deposited or wrapped around the nanotubes, similar to the core-shell structure found by Shanmugam et al. [71] and others. As is the case with the titania-carbon core-shell nanoparticles of Shanmugam et al. the carbon and/or oxycarbide layer is too thin to have the long range order necessary to give a distinct XRD pattern. Since both carbon doping [53, 76] and the addition of an oxycarbide surface layer [22] usually induce a red shift in the titania bandgap the presence of an organic phase should enhance the photocatalytic hydrogen production efficiency. In fact, this has been observed in the case of other photocatalytic applications [71, 72, 75]. In sharp contrast to only a small red-shift observed for samples 60
61 anodized in sulfuric acid (see Figure 19), samples fabricated in organic electrolytes showed a broadening of reflection around the anatase absorption band edge Anatase Reference Sample: Hydrofluoric acid Sample: Sulfuric Acid Sample: Oxalic Acid Sample: Formic Acid Reflection (%) Wavelength (nm) Intensity (W/(m 2 nm)) Figure 19 Diffuse reflection spectra of titania nanotube samples anodized in Oxalic, Formic and Sulfuric acid with chlorine (0.4M NH 4 Cl) and a nanotube sample anodized in Hydrofluoric acid (0.5wt%). The spectrum of commercial anatase powder (Alfa Aesar 99.9%) is included for reference. The solar spectrum is also plotted as a dashed line corresponding to the right axis. However, unlike commercial anatase or inorganic samples they have a prominent second reflection minimum centered within the green region of the visible spectrum (500 to 550 nm). Shankar et al. [25] also observed a local reflection minimum around 520nm in the reflection spectra of some of their fluorine based titania nanotube samples after these samples have been carbon doped by flame annealing. They only observed this minimum for shorter nanotubes (anodized in HF as opposed to fluorine salts and 61
62 weaker acids). These shorter nanotubes had superior photocatalytic performance over longer (visible) wavelengths. The carbon content of Shankar et al. s flame doped nanotubes were around 3% compared to 20% for the nanotubes reported on here. This, in addition to the significantly different fabrication conditions and nanotube morphologies, may account for the fact that the minimum observed for chlorine based nanotubes appear to be much broader and deeper Tubes Formation Mechanism From the above analysis, we have obtained important insight into the mechanism resulting in the extremely rapid etching and nanotube formation apparently catalyzed by chloride. First of all, as is the case with other anodization methods, we are dealing with a competition between two main processes: formation of an oxide layer at the surface of the sample (oxidation) and its dissolution in chlorine species (corrosion). Extreme conditions (e.g. either very low or very high anodization voltage) can decisively turn the balance in favor of oxidation, or corrosion respectively. For intermediate conditions, a local equilibrium is reached, giving birth to patterns such as the porous alumina or titania nanotubes or nanopores. The simplest explanation for the high reactivity is that chloride ions penetrate and break down the pacifying titanium oxide layer under sufficiently high bias voltage. Although such chloride induced oxide dissolution has indeed been observed in the case of aluminum oxide[79], the strongly hygroscopic nature of the chlorination products of titanium make this mechanism very unlikely[80]. In the case of titanium chlorination 62
63 products rapidly react with water to form oxychlorides and hydrated oxides that typically build up on the surface and stop further chlorination. Also weighing in against this simple explanation of the chloride induced reactivity underlying nanotube formation is the finding by D'Agostino et al.[81] that chloride ions are a lot less mobile and able to penetrate titanium oxide than ions like fluorine or oxygen species (OH -, O 2- etc.). Hence, based on this finding one may expect that a higher bias voltage should perhaps favor the supply of oxygen species above chlorine species and thus have a stabilizing effect on oxide formation. A possible clue to the mechanism responsible for the high chlorine reactivity observed is supplied by the findings of Rojas et al.[82] and Arikawa et al.[83]. Rojas and co-workers studied the relative evolution of O 2 and Cl 2 on TiO 2 -Pt electrodes. As one would expect, they found that the rates of both gas evolution reactions decrease as the titanium oxide layer thickness is increased inhibiting electron transfer. However, they found that the reduction in the rate of oxygen evolution with oxide thickness is much more rapid than that of chlorine, that is, thicker oxide shifts the selectivity of the gas evolution reaction away from oxygen towards chlorine. A similar result was reported by Arikawa et al.[83]. They found that the threshold bias potential at which oxygen and chlorine evolution starts increases as the width of the initial titanium oxide layer is increased. Moreover, they found that this increase in threshold is significantly more rapid for oxygen than it is for chlorine. These results indicate that the oxidation of chloride ions (Cl - ) gain in prevalence relative to the oxidation of oxygen species (primarily OH - ) as 63
64 oxide thickness increase. We have recently shown that the titanium oxide barrier layer thickness of titania nanotubes increases with increasing anodization voltage[61], a result that is analogous to the anodization behavior of aluminum and other metals[14, 84]. Together, these experimental observations suggest the following: 1) When a new titanium foil is first introduced into the electrolyte the oxide layer is thin and the oxidation of oxygen species proceed much more rapidly than that of chlorine species resulting in the evolution of oxygen and, more importantly, the rapid oxidation and thickening of the oxide layer by the overall anodic reaction: 2OH - (aq) + Ti(s) TiO 2 (s) + 2H + (aq) + 4e - (1) The initial rapid increase in oxide layer thickness, together with the evolution of O 2, is responsible for the large initial spike observed in the anodization current vs. time plots, as the applied bias potential (V) causes the inward migration of electronegative oxygen atoms. Titanium atoms (or ions) that are left behind towards the electrolyte surface are reincorporated by new oxygen atoms generated by electron transfer through the relatively thin oxide layer. 2) The barrier oxide thickness ( δ ) increases by this mechanism until a steady state barrier thickness ( δ SS ) is reached where electron transfer become sufficiently slow so that titanium atoms at the electrolyte surface are preferentially dissolved instead of being reincorporated into the oxide layer. This steady state with very slow titanium etching is what the system will evolve to if there is no chlorides present in the electrolyte. 64
65 This slow etching steady state can apparently also be maintained even in the presence of chlorides, as long as the voltage is low enough - below the system specific threshold voltage discussed above. If chloride is present in the electrolyte, the chlorine species will compete with oxygen species for oxidation at the anode. This can have one of two outcomes: - For a low anodization voltage δss ( ) V is thin enough so that oxidation of oxygen species still dominates that of chlorine species, even after the oxide thickness reaches the steady state value δ = δ SS. Hence, in spite of the presence of chlorides the barrier layer thickness will, at low applied voltages, approach a steady state thickness that is close to its steady state thickness ( δss ( ) V ) in a chloride free electrolyte. Subsequently, reactivity will be low and etching slow. This is indeed what we observe if sub-threshold voltages are used. - For higher anodization voltages, a critical point is reached where δ becomes sufficiently large so that chlorine chemistry begin to be competitive with oxygen chemistry. This will reduce the rate of oxidation of oxygen species and interfere with the mechanism responsible for oxide growth in step 1. That is, as relatively less hydroxyl ions get oxidized there is less oxygen ions and radicals at the electrode surface. A decrease in these oxygen species at the surface will lead to a relative decrease in the fraction of Ti 3+/4+ that gets reincorporated into the oxide layer with an increase in the relative number of Ti 3+/4+ ions that get etched (i.e. dissolve into the solution forming complexes like TiF 2-6, TiOH 2+ x+y-4, TiF x (OH) y etc. [85, 86]). Hence, under the influence 65
66 of chloride ions we expect that the oxide thickness will approach a new thinner steady state oxide layer ( δ * SS ) as the balance is swayed toward the etching of, and away from reincorporation of, Ti ions. The situation can be summarized as follows: (2) However, higher V means that the rate of inward migration or diffusion of oxygen atoms is sped up. In fact, to a first order the solid diffusion of these atoms through the oxide layer is proportional to the gradient of the potential (i.e. the force) and since most of the potential drop occurs across the barrier layer we can write for the diffusive flux: φ V δ (3) Therefore, it is clear that the combination of a higher potential and a thinner * barrier layer ( δ δss < δss ) results in a very reactive situation. At higher anodization voltages chlorine inhibits the growth of a pacifying oxide layer with the result that the inward migration of oxygen atoms and oxidation of titanium will be maintained at its rapid initial levels. At the same time titanium atoms at the electrolyte-oxide interface can be swept away either by dissolution with chlorine species or with hydroxyl ions that are, 66
67 at higher voltages, less likely to be oxidized themselves than is Cl -. Because of the hygroscopic nature of most chorine products, the latter mechanism is likely to dominate. The experimental data are in agreement with the mechanism proposed. No nanotubes are formed at lower voltages and after an initial surge the anodization current approaches a very low steady state value typically less than 1 ma/cm 2. Beyond a threshold voltage, typically around 11V there is a rapid change in the reaction dynamics. The plateau value of the current rapidly increases by at least one order of magnitude. The rapid evolution of hydrogen at the cathode is visible as vigorous bubbling of the reaction vessel. That a significant amount of chlorine gas is also evolved at the anode is indicated by a distinctive chlorine odor. It is true in the case of both porous alumina and titania nanotubes grown in fluoride electrolytes that a thinner barrier layer and smaller pore or tube diameters always go together. The mechanism proposed and the fact that the new chloride nanotubes have smaller diameters than any other grown in fluoride-based electrolytes is consistent with this trend. That is, we have found that nanotubes anodized at 15V in fluoride electrolytes typically have diameters of ~50nm (nanotubes were fabricated in a 0.5wt% HF solution as described elsewhere [61]). In fact, the smallest diameter fluoride-based tubes obtained both by our group (in HF) [61] and by Bauer et al. (in H 3 PO 4 /HF electrolytes) [87] are on average ~30nm. At lower voltage there is a transition from tubes to pores that can have diameters down to15nm [61, 87]. 67
68 The chloride tubes reported here, anodized at around 15V, have diameters of around nm. Hence, the mechanism proposed here, suggesting that in chloride ion containing electrolytes a thinner barrier layer with higher voltage gradient forms, is consistent with the fact that these tubes consistently have small diameters and are long (very rapidly etched). Although one should perhaps be careful in drawing parallels between dielectric or passivity breakdown as it occurs in the context of macroscopic phenomena like pitting and corrosion, the mechanism proposed above (responsible for creating a very nonpassive/reactive surface) has some features in common with mechanisms proposed for the above mentioned phenomena in chloride media. In particular, the findings of Ahn et al. [88] (leading to a hypothesis similar to the earlier work of Foroulis & Thubrikar [79]) supporting the theory that it is metal cation vacancy generation at the barrier layer/solution interface that are responsible for the depassivation of iron and nickel oxide films is very similar to the mechanism described above where chlorine enhanced cation dissolution also play a critical role Process Optimization Particularities of Nanotubes Formation in Chlorine Salts Our experimental investigation into the synthesis conditions offers a statistically averaged view of the phenomena involved, by dealing with macroscopic quantities such as average anodization current, anodization voltage and average chloride concentration. 68
69 The values of these quantities show good reproducibility, so they offer an accurate global view of the anodization process. On the other hand, the anodization of titanium in chloride aqueous solutions occurs in a much more violent way than in fluoride, with several orders of magnitude bigger speeds of tube formation. This provides an important advantage regarding the synthesis time, but the trade-off is a dramatic loss in the uniformity of the tube formation both individually for each tube, and globally over the sample surface. Indeed, as observed also by Hahn et al.[89], the dissolution action of chlorine species under voltage bias is much more sensitive to slight variations in the electric field and/or in the sample uniformity, local behavior being drastically different from one place to another. This imposes a more careful study of the local phenomena involved. Figure 20 provides visual information regarding localized tube formation in chloride containing media. It occurs more likely in pre-existing sites of local disruption of the titanium foil uniformity, such as the edges (Figure 20c) or along linear patterns formed during the titanium sheet fabrication (Figure 20b). These disruptions are also the sites of local spikes in the electric field, the combination of the two most important factors in tube formation generating an avalanche effect in that area, and leaving neighboring areas less affected (Figure 20a). Experiments with various thickness of the initial titanium foil further highlight this trend, as very thin (32 µm) foils were found to need smaller anodization voltages for the breakdown of titanium oxide pacifying layer, and the tube formation occurred practically only at the edges of the samples. 69
 optical photo of the samples, showing that production of the nanotubes at the edges is always coupled with less intense production in the bulk (darker")
; c) low magnification SEM image showing tube formation originating from irregularities at the edge of the sample and occurring much")
70 Figure 20 Macroscopic view of the samples, showing localization of the electric field and preferential formation of nanotubes. a) optical photo of the samples, showing that production of the nanotubes at the edges is always coupled with less intense production in the bulk (darker areas); b) low magnification SEM image, demonstrating preferential alignment of the nanotube formation sites along preexistent patterns in the original sheet (horizontal lines); c) low magnification SEM image showing tube formation originating from irregularities at the edge of the sample and occurring much more rapidly than in the bulk area. 70
71 In addition, the ultra-rapid reaction leaves no time for relaxation of the processes and accommodation of the increased volume associated with the nanotube formation, so that the uniform tubes arrays tend to form locally on areas several square microns wide (Figure 21a). These areas experience a violent burst of material possibly due to some local gas bubbling, but more probably due to the local mechanical stress imposed by surrounding areas of unaffected titanium oxide which are not allowing the increase in volume associated with the formation of the nanotubes. The result is a periodic release of tubes in the solution, as debris of these local explosions most often in the form of grains or bundles of various sizes, leaving part of them still attached to the sample usually in a flower-like pattern (Figure 21b). 71
 Occurrence of a site where the nanotubes are still lying inside the bulk of the sample, tightly packed along the direction")

72 Figure 21 Insight details on the formation of titanium oxide nanotubes at the surface of the titanium foil. a) Occurrence of a site where the nanotubes are still lying inside the bulk of the sample, tightly packed along the direction perpendicular to the surface of the sample; b) More usual view of a formation site, with tube bundles sticking out of the surface. The reaction speed can also play an important role in the formation of defects in individual tubes, causing segmentation and brittleness. These effects can go to such 72


.")

, and tubes showing easy breaking")
 Detailed view of a cup-like particle")
73 extents, that they cause interruption in tube formation right from the start, and the release in the solution of the initial layer made of hemispherical shaped particles of the same diameter as the tubes (Fig. 7). Figure 22 HRTEM pictures showing effects of the high speed formation of the tubes. a) Several layers of cup-like particles (right), and tubes showing easy breaking after the release on the TEM grid (left); b) Detailed view of a cup-like particle with the same diameter as the nanotubes. 73
74 Optimization by Double Anodization A possible solution is to pre-pattern the sample in order to provide a uniform distribution of defects all over the foil. To test this idea, we pre-anodized the samples first in a hydrofluoric acid solution (0.5 wt %) for several minutes, resulting in the covering of the sample with a thin nanoporous/nanotubular titanium oxide film (Figure 23a). The second anodization in standard conditions (V=13V) in a chloride based solution (~0.02M HCl, 0.2M NH 4 Cl, ph = 1.65) yielded a total, more uniform coverage of the sample with tube formation sites (for a comparison of sample coverage without and with preanodization in HF, one can check Figure 20b, and Figure 23b respectively). This would result in a more efficient usage of the titanium foil, and in a production of large quantities (of the order of grams) titanium oxide tubes precipitate/powder in less than two hours. Further optimization of this method may provide a fast alternative route for the production of titanium oxide nanotubes powders, now routinely synthesized via a hydrothermal method derived from the one pioneered by Kasuga et al.[62] 74

.")
75 Figure 23 SEM images of the sample surface a) after the first anodization in a HF solution; b) after the second anodization in a chloride containing solution. Finally, another indication of the fact that the pre-patterned anodization indeed leads to a more uniform tube formation is provided by the current versus time plot (fig. 9). Indeed, for similar anodization conditions, the pre-anodized foil is exhibiting a higher value of the plateau current (more formation sites present), and also a smoother evolution 75
76 of anodization current (3 times smaller percentage standard deviation) indicating that the tubes formation process occurs closer to the desired steady state rate. Figure 24 Current versus time plot for two samples anodized in standard chloride containing solutions (~0.02M HCl, 0.2M NH 4 Cl, ph = 1.65), with, and without pre-anodization in 0.5wt% hydrofluoric acid solution Optimization by Using Non-Aqueous Electrolytes Another possible solution for a smoother and a more uniform tube formation is the extensive cleaning and polishing of the sample, and careful setup for uniform distribution of electric field and chloride concentration. The use of non-aqueous electrolytes, or a mixture of aqueous and non-aqueous electrolytes may extend the range 76

 as in the case of aqueous solutions, the anodization process was kept stable for up to")
77 of equilibrium conditions in the same way as for fluoride media, as we have seen in the previous chapter. Figure 25 SEM images showing time evolution of nanotubes formation at 40V with 2% H 2 O content; after 60s of anodization, tubes several microns in length have already developed in a formation site. The anodization trials involving non-aqueous electrolytes resulted in a much smoother shape of the plateau current versus time. Although the tube formation was undergoing as soon as in the first 60 s (see Figure 25) as in the case of aqueous solutions, the anodization process was kept stable for up to 15 minutes, and the total coverage area was much bigger than in the case of aqueous solutions. 77

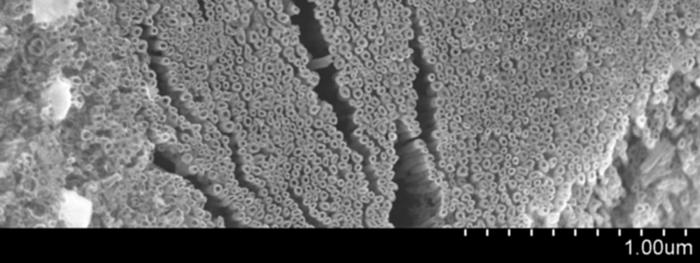


78 78
, and tilted view of nanotubes anodized in similar conditions at 40V.")
 Present investigations with DMSO as electrolyte yielded indeed smoother nanotubes (see Figure 26,")
.")
79 Figure 26 HRSEM images showing top view of nanotubes obtained in DMSO after 15 minutes anodization with 2% H2O content, at 50 V (top), and tilted view of nanotubes anodized in similar conditions at 40V. Figure 27 Titania nanotubes bundles several microns long are formed in DMSO (left), reaching up to 20 microns (right) Present investigations with DMSO as electrolyte yielded indeed smoother nanotubes (see Figure 26, Figure 27), with a longer range ordering, together with a better coverage of the sample, as more initiation places were formed (see Figure 28). Although the tubes diameter didn t vary significantly over the voltage range used, they still had a 79


80 slightly higher average diameter (Figure 29) than those produced in aqueous electrolytes, so adjusting the water content could control this parameter too. Figure 28 Low resolution SEM image of initiation sites and demonstrating very good local sample coverage after 5 minutes of anodization. 80

81 Figure 29 Histogram of nanotubes diameters (132 total measurements) showing a wide distribution of values in the range of nm, with an average of 36 nm. These optimizations can ultimately lead to uniform arrays of nanotubes all over the sample, but may also increase the time of fabrication up to tens of hours, nonetheless still constituting a better alternative to the highly toxic fluorides used nowadays. 81
82 Chapter 5 Crystallization of Titania Nanotubes Powders As we have shown in the previous chapters, the nanotubes obtained by anodization are amorphous, and further employment in solar energy harvesting devices requires crystallization, routinely acquired by annealing. Titania nanotubes powders synthesized by anodization of titanium foils in solutions fluoride ions (resulting in long range ordered arrays with hexagonal orientation detached from the titanium substrate as free standing films), or chloride (short range ordered bundles formed as a precipitate in the solution and subsequently dried for nanotubes powders) were used Figure 30. While annealing temperatures lower than 300 C are insufficient for crystallization to occur, for temperatures higher than 400 C the nanotubes morphology is affected. While they are keeping the original ordering, the individual tubes are changing into one dimensional nanoparticulate structures (Figure 31). This leaves a small window for annealing condition which would result in crystallization of the powders to the anatase phase, while keeping the nanotube structure intact. Annealing time may also play an important role, as solid diffusion may occur after crystallization, possibly changing the structure at the nanoscale. 82
83 83
84 Figure 30 SEM views of titania nanotubes powders synthesized by anodization in chlorine (a-d) and fluorine (e-h) electrolytes. 84
85 Figure 31 SEM images of chlorine (a-c) and fluorine (d-f) titania nanotubes bundles after annealing at 400 C, suffering morphological damage at the nanoscale. Differential scanning calorimetry studies revealed for all samples heated to a final temperature higher than 350 that the phase transition occurs between 270 C and 320 C, while for temperatures lower than 260 C no phase transition was observed Figure 32. Figure 32 Typical DSC diagram of a sample heated and cooled to and from 350 C with a scan rate of 1 C/min. Subsequent trials at temperatures between 270 C and 300 C with a scan rate of 1-2 C/min still produced (sometimes partially) crystalline structures, as revealed by TEM imaging (Figure 33) and X-Ray Diffraction (Figure 34). 85

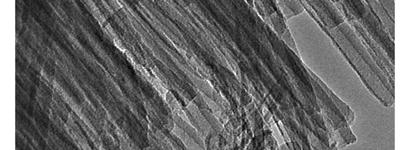


86 86
87 Figure 33 TEM images of titanium nanotubes annealed at 1 C/min up to 250 C without crystallization (a), 350 C when crystallization was associated with partial granulation (b), and 300 C respectively when crystallization in relatively large single crystals and no tube damage occurred (c). Figure 34 XRD spectra for samples annealed to 250 C (a), and 350 C (b) respectively. 87
88 This study results show that there is a narrow window in the annealing temperature and temperature scanning ranges where crystallization happens without damaging the tubes structure. Temperatures above 300 C are necessary for full crystallization, while scanning rate values above 2-5 C/min, coupled with temperatures above 350 C damage the nanotube structure of the material, breaking it into quasispherical particles (see Figure 35). Figure 35 Identification of annealing outcome for various parameters in the Temperature Scan / Final Temperature space. 88
89 Chapter 6 Applications 6.1. Photovoltaic Cells Dye Sensitized Solar Cells - Introduction Recently the research groups of Grimes, Schmuki and Frank demonstrated that dye-sensitized solar cells (DSSC s) using of titania nanotube arrays obtain comparable or even slightly higher efficiencies than cells using of standard nanoparticulate films [60, 90, 91]. It has been suggested that titania nanotube arrays (or nanowires) will be superior conduits for charge transfer compared to sintered particulate films because it is thought that their use will eliminate resistance to electron transfer due to inter-particle contacts and shorten percolation pathways [92-97]. In a recent study the group of Frank et al., however, suggested electron transport times for titania nanotubes to be roughly equal to that measured using nanoparticles [98]. Nanotube based cells nonetheless had superior efficiencies in the Frank study. They attributed the higher efficiencies to recombination rates that were more than 10 times slower in nanotubes and also suggested that nanotubes have a light harvesting efficiency that is approximately 20% higher than it is in particulate films. In two studies the group of Grimes confirmed the apparent lack of recombination centers in TiO 2 nanotubes compared to particulate films by voltage decay 89
90 measurements [99, 100]. One weakness in current nanotube configurations to which Frank et al. attributed the lower fill factor for nanotube based cells in their study is the resistance between the titanium dioxide nanotubes and the titanium substrate to which they are connected. We together with others have found that the mechanical adhesion of titania nanotubes to their titanium substrate are strong and thermally stable when fabricating relatively short titania nanotubes ( 500 nm) by anodizing titanium foil aqueous hydrofluoric acid based (low ph) electrolytes [68, 101]. However it is estimated that arrays in the order of μm in length are needed to achieve optimal film thicknesses for use in DSSC s [91, 99, 102]. As a response the groups of Grimes and Schmuki explored anodization in non-aqueous fluorine based electrolytes that yielded significantly longer nanotubes [37, 56, 103]. The longest nanotubes reported to date (360 μm) are fabricated in ethylene glycol and have very poor adhesion to their titanium substrate, in fact it is suggested that anodization in ethylene glycol be used to fabricate free-standing TiO 2 membranes [59]. Anodization in solvents like formamide, DMSO or glycerol typically yield relatively shorter nanotubes (5-100 μm) that flake and/or peel less readily from the titanium substrate than does samples anodized in ethylene glycol [37, 59, 60, 91]. To summarize, it was shown that titania nanotubes have superior charge recombination and light scattering characteristics. However, contrary to the common expectation that they would have superior electron transport rates, recent intensity modulated photocurrent spectroscopy suggests that electron collection rates of nanotubes 90
91 and nanoparticulate films may be similar [91]. However the same report noted that the fill factor of nanotube samples are lower than it is for particulate films and attributed this to resistance at the barrier-layer and conductor/semi-conductor interface. It is therefore not clear whether nanotube arrays have slow electron transfer rates, comparable to that of nanoparticulate films, because they have the same inherent slow electron diffusion characteristics (equally many trapping and scattering sites) or whether it is attributable to resistance at the metal to metal-oxide interface. Figure 36 The chemical structure of the N3 ruthenium dye (Ru(SCN) 2 L 2 with L = 2,2'-bipyridyl-4,4'- dicarboxylic acid) used to sensitize titania nanotubes. This is a common dye used in DSSC s for the past ten years. The dye used by us was synthesized by collaborators at Yale University. 91
92 Nanotube samples were heated to 80 C in air and then immersed in a 0.3 mm solution of N3 ruthenium dye [Ru(SCN) 2 L 2 with L = 2,2'-bipyridyl-4,4'-dicarboxylic acid] in acetonitrile for 48 h Experimental Setup and Calibration Measurements An open cell design was created in our lab for rapid relative photovoltaic measurements (see Figure 37). While in the conventional design of Gratzel cells [5] the active titanium oxide anode was separated from the platinum-deposited conductive glass by a thin (tens of microns) layer of electrolyte, and the device was then illuminated through the conductive glass, in our setup both electrodes were immersed in an open cell containing the iodine based electrolyte bath, with the anode as closed to the cell s window as possible and frontally illuminated, while the cathode (platinum mesh) was placed perpendicularly on one side of the anode, about 1 mm apart. The whole circuit was closed by an external load together with measurement instrumentation coupled to a computer and controlled by a LabVIEW program. Measurements involving addition of fresh electrolyte were started after 90 minutes in order to allow for electrolyte stabilization, as explained in more detailed in the results section. Repeatability and consistency of the results were assured by test measurements on a reference sample at the beginning and at the end of each measurements session. 92

93 Figure 37 Schematic representation of the custom setup used for photovoltaic measurements. Exposure of ruthenium based dye sensitized cells to the ambient air with humidity leads to a decrease in their performance. This decay in performance with time can clearly be observed in. The cell used was an open cell implying that the electrolyte containing the nanotube electrodes sensitized with dye was exposed to the air. This decay in performance was observed for all samples whose PV performance was measured (see Figure 38). As a result great effort is taken to completely seal commercial cells. It is often suggested that it is water in the atmosphere that is responsible for the decay in performance. It is believed that water molecules directly attack the dye molecules or cause them to desorb by reversing the ester-type bonds that is assumed to bind the dye to the TiO 2 surface through the reaction. 93
94 Figure 38 I-V curves of the same dye sensitized nanotube sample. The top curve is measured in fresh electrolyte and the lower curve is in the same electrolyte after it was exposed to the ambient containing humidity for 60 min. Although there is a sharp decline in performance over the first 60 min further exposure did not lead to anymore further significant decline in the maximum power output measured in the electrolyte Photovoltaic Properties of Titania Nanotubes Produced in Chlorine Containing Electrolytes In order to determine whether our rapidly formed chlorine nanotubes with an optimal annealing conditions indeed have superior electron collecting properties when used in DSSC s, we employed relative photovoltaic measurements on samples 94
95 synthesized by our group in chloride ion containing solution [5] with respect to samples fabricated both in fluorides solutions, and in the chlorides/perchlorate solutions according to the protocol of Hahn et al [90]. The nanotubes on all samples were sensitized with standard N3 ruthenium dye and their photovoltaic performance evaluated under simulated solar radiation. For this particular study titania nanotubes were fabricated by the electrochemical anodization of titanium foil (Alfa Aesar, 0.25mm thick) in aqueous acidic electrolytes containing either ammonium fluoride, ammonium chloride, or a mixture of sodium chloride with sodium perchlorate. Anodization and post synthesis annealing conditions are given in Table 4, along with references for more details where conditions used by other groups have been reproduced. The samples were subsequently heated to 80 C in air and then immersed in a 0.3mM solution of N3 ruthenium dye (Ru(SCN) 2 L 2 with L = 2,2'- bipyridyl-4,4'-dicarboxylic acid) in acetonitrile for at least 48h. The I-V characteristics of the sensitized samples were measured in an open photo-electrochemical cell (see previous section for details) with the original titanium sheet substrate acting as the anode, and a platinum counter electrode (2 cm x 1 cm x 0.2 cm and at a right angle with respect to the sensitized electrode sample). The electrolyte consisted of 0.6M 1-Methyl-3-propylimidazolium iodide (PMII), 30mM I 2, 0.5M 4-tertbutylpyridine, 0.1M guanidine thiocyanate in acetonitrile. All open cell measurements were made after 60 minutes of electrolyte exposure in order to avoid data inconsistencies due to the significant decay in the electrolyte performance during the first hour of 95
96 exposure to atmosphere. A reference sample was also measured both at the beginning and at the end for every 4-6 hours of measurements. A 150 W Xenon lamp with an intensity of 980 (±20) W/m 2 was employed as the light source. The spectrum and intensity of the light source was recorded using an Ocean Optics HR4000-UV-NIR spectrophotometer equipped with a cosine irradiance probe, and the distance between the lamp and the sample was adjusted in order to achieve an absolute irradiance similar to that of AM 1.5 solar radiation. The results of the open cell photovoltaic measurements are shown in Table 5 and Figure 39. The poor results for absolute efficiencies were expected, as the setup we used was not intended for best performance, but for relative measurements. Factors inherent to the setup which contributed were air exposure of the electrolyte (see previous section), distances of the order of millimeters between the electrodes and their perpendicular orientation, absorption in the electrolyte before the light reached the anode. We also used an active area of 1cm 2 which is 2 to 6 times bigger than the area used in regular closed cell DSSC laboratory experiments; it is well known that the photovoltaic properties don t scale linearly with the active area, bigger active areas yielding poorer performances per square centimeter. Sample ID Anodization conditions Annealing Temp. Annealing Time Heating rate S292 See Hahn et. al [90] 350 C 1h 1 /min S M NH 4 Cl solution 350 C 1h 1 /min S291 See Hahn et. al [90] 450 C 3h 10 /min S M NH 4 Cl solution 450 C 3h 10 /min B89 Fluorine salts 400 C 3h 1 /min Table 4Summary of synthesis and annealing conditions for titania nanotubes samples 96
97 Sample ID Isc (ma) Voc (mv) Power (mw) Efficiency Filling Factor S % 78.7% S % 81.4% S % 82.3% S % 73.7% B % 67.2% Table 5 Summary of photovoltaic properties of DSSC s employing titania nanotubes However, these measurements allowed us to test our initial theoretical prediction. First, we have confirmed that even though the area coverage was much poorer than in the case of the ordered arrays of nanotubes obtained in fluorine salts, our results confirm those of Hahn et al, the chlorine nanotubes having better performance, and the 20% increase in power can translate in much bigger differences when adjusted for area coverage. Then, our anodization method proved to be better when compared to the chlorides/perchlorates method (10-30% better efficiency), and we attribute that increase in efficiency to our optimizations related to the area coverage. Also, the post-anodization treatment was critical for the cells performance, as the samples which maintained the tubular morphology after annealing had almost double the efficiency of those annealed at high temperatures which had structural damage. This also proves once more the better carriers transport in nanotubes than in micro- and nano-granular crystalline titania, showing good promise of performance superiority for DSSCs employing nanotubes powders. 97
98 2.5 2 Hahn et al, low temp anneal Our group, low temp anneal Hahn et al, hight temp anneal Our group, high temp anneal Fluorine solution 1.5 I (ma) V (mv) Figure 39 I-V characteristics of DSSC s employing titanium oxide nanotubes obtained by anodization in chlorine containing solutions Photovoltaic Properties of CdTe decorated Titania Nanotubes Arrays As we have seen in the previous sections, the specific architectures of the ordered arrays of titania nanotubes seem to be the ideal candidate for photovoltaic applications, providing in addition to the material properties, both a significant increase in the active surface and natural 1D paths for electrons transport through the nanotubes walls [21, 31]. The disadvantage of poor absorption (only in the ultraviolent range) is usually attenuated by the use of coating dyes (dye sensitization) [3] or doping [53, 76]. Recent efforts 98
99 involved the design of hybrid structures by the attachment of nanoparticles (quantum dots) which should in principle also enhance solar light absorption properties. To date, experiments involving conjugation of CdS, CdSe, PbS and other types of quantum dots to TiO 2 nanotubes resulted in efficiencies as high as 20%, with a theoretical upper limit of 80% in highly optimized configurations [ ]. In 2006 two attempts at creating hybrid films consisting of CdS deposited in or onto TiO 2 nanotube or other nanoporous arrays have been published. Larramona et. al.[108] was aiming at fabricating a three-component porous heterojunction of the type n-a-p [109]. n stands for n-type, a for absorber and p for p-type. The idea is to use a nanostructured n-type semiconductor (f.i. TiO 2 ) as a template, deposit a thin layer of an inorganic absorber over the internal surface and fill the rest of its pores or tubes with a transparent p-type semiconductor. Ideally this device or cell will work as follows: Photons are to be absorbed only by the absorber layer, and the generated electron/hole pairs are to be injected into the n-type and p-type phases respectively. As a consequence of such separation, the chances of charge recombination are highly reduced. On the other hand, if the absorber layer is thin enough (lower than the diffusion length of carriers within the absorber), the absorber material would have much lower restrictions concerning the number of defects. This latter feature has earned these cells the acronym of eta (extremely thin absorber) cells. The n-a-p strategy is clearly intended to minimize charge recombination losses. It is still an open question as to whether the reduced recombination rates will increase efficiency more than the expected loss in 99
100 catalytic efficiency due to the reduction of n-type surface area exposed to the electrolyte. For Larramona et al. this was not of concern for they are primarily interested in photovoltaic applications (i.e. generating electricity). An additional problem could be the degree of transparency of the p-type material. Any reflection of wavelengths within the absorption spectrum of the absorber would reduce light harvesting efficiency. In our initial experiments on CdTe attachment, as support materials, we used ordered titania nanotubes arrays (TNT) fabricated by anodization in a hydrofluoric acid solution, a method pioneered by Gong et al [21]. Titanium foil (Alfa Aesar, 99.99%, 45 x 25 x mm) were cleaned by sonication for 20 minutes, then rinsed with ethanol, deionized water, and dried in air. A 45 x 20 mm active area was immersed in a beaker containing 0.25 M HF, and anodized for 35 minutes under constant bias (15 or 20 V), the result being the formation of an ordered array of nanotubes (diameter depending on the anodization voltage, and several hundreds of nanometers long) on both sides of the samples. The as-formed nanotubes were amorphous, and crystallization to anatase was obtained by annealing in oxygen for 1h at 350 C, with heating and cooling rates of 1 C. 100
 were unsuccessful, micron size clumps of nanoparticles forming on top of the nanotubes.")


101 Figure 40 SEM images of CdTe nanoparticles supported on titania nanotubes arrays. First trials (a, b) were unsuccessful, micron size clumps of nanoparticles forming on top of the nanotubes. Successful trials (c, d) involved more uniform coverage (darker areas) of the nanotubes, without clumping and clogging. For the synthesis of CdTe nanoparticles, first 0.5 M sulfuric acid was added drop by drop to Al 2 Te 3. The resulting product (H 2 Te) was transferred to a solution of CdCl 2 and glutathione (C 10 H 17 N 3 O 6 S) under continual stirring. Glutathione is commonly used as a capping molecule, as it contains radicals which can chemically attach both to CdTe nanoparticles and to a TiO 2 surface [105]. This solution was then heated to 95 C for
102 minutes, resulting in the growth of CdTe nanoparticles which were then precipitated with isopropanol. The resultant powder was allowed to dry for several days before being resuspended in water (these will be further named raw nanoparticles). Further purification (resulting in pure nanoparticles) was accomplished by centrifuging, precipitating and re-suspending the nanoparticles, which necessarily resulted in lower density in the solution, allowing for a better attachment control. TNT s were soaked for 72 hours in the CdTe nanoparticles solution, and then removed and dried in air. These initial trials resulted in low conjugation of CdTe, the NP s clumping in 1-30 microns large formations on top of the nanotubes (Figure 40 a, b), so a second trial was conducted in which all the samples were placed in a rocker during the soaking period to provide additional kinetic energy and maximize coating yield. The samples were then removed from the sensitizers and rapidly dried with pressurized air. A Hitachi S4800 field emission scanning electron microscope was used for SEM imaging and for EDX characterization, and a simple optical configuration was used for photoluminescence measurements (see Figure 41). A 580 nm diode laser was directed through a neutral-density filter (to nearly evenly diminish the excitation source) at a mirror which redirected the beam to the edge of the sample. The resultant emission light was then directed through a 25 mm focal length convex lens and a 590 nm cutoff filter (to remove the excitation signal) into a 50 micron fiber optic cable. Data was collected via Ocean Optics instrumentation and software. 102
103 Figure 41 Experimental setup for photoluminescence measurements. The successful attachment of CdTe nanoparticles was probed using SEM imaging (see Figure 40), and EDX spectra were used for elemental analysis. The spectra indicated very low amounts of Cd and Te, and although the concentrations (less than 0.5%) were too low for validation of the peaks with respect to the background, the parity Cd to Te was usually close to the expected 1:1, thus indicating the presence of those elements. Further validation was achieved through investigations regarding optical properties of the samples. Figure 42 shows the photoluminescence spectra for the two 103
104 types of quantum dots attached. The samples clearly exhibit a peak around 620 nm, thus indicating a red shift towards the visible range of the nanotubes array s absorption spectrum. Also, separate measurements of photoluminescence decay (Figure 42 b) revealed a good stability of the samples, a plateau being reached after about 5 minutes of irradiation, following an initial spike in the photoluminescence intensity. Figure 42 a) Photoluminescence spectra for the CdTe nanoparticles attached on TNT s. b) Photoluminescence decay plot for one of the samples. Measurements were taken at a wavelength of 618 nm. Photovoltaic measurements were performed for samples containing both raw nanoparticles and purified ones, and compared against a blank sample containing only crystalline nanotubes arrays, without further treatment. The samples were cut from the same anodized titanium sheet, assuring thus the same morphology of the nanotubes. The plot in Figure 43 a together with the values in Table 6 clearly indicate superior photovoltaic performance of the cells containing nanoparticles attached to the nanotubes with respect to the blank sample. 104
105 Figure 43 a) I-V curves for the TNT s CdTe NP s hybrid structures, compared to a reference sample of pure nanotubes arrays without the nanoparticles attached. b) Long time measurements performed on the maximum power point of one of the sample after adding new electrolyte, revealing that stabilization of the voltage occurs after about 75 minutes. Attached NP s Type V oc (mv) I sc (ma) P max (µw) Efficiency (%) No NP s, Blank Reference Raw NP's Purified NP's No NP's, Dye Sensitized [11] Table 6 Photovoltaic properties of the CdTe attached samples with respect to a blank reference. Values from previous measurements in the same setup corresponding to a typical dye sensitized sample containing approximately 10 times longer nanotubes (and correspondingly 10 times larger total active surface) were added in the last row also for reference. The reasons for the low absolute values of the efficiency and short-circuit current may be explained as arising due to the following reasons. Firstly, we used short nanotubes samples, easier to fabricate and to manipulate for nanoparticles attachment, but exhibiting lower photovoltaic performances due to the smaller active surface. As the fourth row of Table 6 indicates, previous measurements involving dye sensitized samples 105
106 containing 10 times longer nanotubes [67] achieved average efficiencies of about 0.6%. Secondly, the open cell configuration implies lower absolute performance due to the increased distance between the two electrodes, and to the degradation in time of the electrolyte when exposed to the humid atmosphere, as revealed by the measurements performed immediately after adding fresh electrolyte (see Figure 43 b, and [67] for details). However, our measurements are still relevant regarding relative performance, as they indicate superior efficiency of cells employing the attached CdTe to the blank samples, due to superior light absorption in the visible range. Also, the second attachment method involving purification of the CdTe quantum dots and lower concentrations allowing a more controlled and more uniform deposition resulted in better light-toelectrical energy conversion efficiency Photoelectrochemical Hydrogen Production Another possible solar energy harvesting application for titania nanotubes is their use for photoelectrochemical hydrogen production (water splitting). For PEC experiments the custom setup previously described was slightly modified (see Figure 44). The same Oriel 150W Xenon light source has been used with corresponding igniter and power supply. A Model 600C CHI instruments potentiostat was used to set the applied bias relative to the Ag/AgCl reference electrode and measure the photocurrent response. A simple experiment has been conducted, revealing that for some applications the nature of 106

 were prepared in electrolytes with varying concentration of KF, and for reference titania nanotube")
107 the cations used during the nanotubes synthesis by anodization can still play an important role. Figure 44 Schematic diagram of the PEC cell with light source, electrolyte and the three electrodes. The main photoelectrochemical reactions involved are also represented. Three sets of samples (labeled K1, K2 and K3) were prepared in electrolytes with varying concentration of KF, and for reference titania nanotube samples were also prepared in ammonium fluoride (NH1) electrolytes that produced nanotubes with no adsorbed potassium ions on the surface (see Table 7 for detailed conditions). Anodization 107
108 of titanium foil in these electrolytes resulted in the formation of amorphous titania nanotube arrays (see Figure 45). The morphologies of the nanotube samples obtained from the different fabrication conditions do not differ significantly. The average nanotube inner diameters were in the range nm, the wall thicknesses 8-9 nm and lengths μm were noted for all samples fabricated (see Table 7 for details). This morphological similarity arises as the parameters identified as critical for controlling nanotube morphology, namely fluorine concentration, acidity (ph was maintained at the constant value of 5 for all the electrolytes by adding small amounts of NH 4 OH solution when needed see Table 7), anodization voltage, anodization time and bath temperature [29, 61, 110], were kept as constant as possible in the current study. Label Fabrication Electrolyte NH4OH added for constant ph Nanotube inner diameter (nm) Nanotube wall thickness (nm) NH1 0.15M HF M NH 4 F 0.2 % 71 ± ± 1.2 K1 0.15M HF M KF - 77 ± ± 1.8 K2 0.25M HF M KOH - 73 ± ± M HF M KF K3 0.1 % 70 ± ± M NH 4 F Table 7 Fabrication conditions and morphological properties for all samples tested. 108


109 Figure 45 Falsely colored SEM image presenting morphology details of the nanotubes arrays used in this section measurements. To induce crystallinity, the samples were annealed at 400 C in oxygen for 2 h, with heating and cooling rates of 1 C/min [2, 68]. Upon annealing the nanotubes are converted to polycrystalline anatase [2, 4, 51, 68], as confirmed by x-ray diffraction (XRD). 109
110 The cell schematically shown in Figure 44 was used for characterizing the water splitting performance of all samples. A titania nanotube sample was employed as the working electrode, Pt as the counter electrode and Ag/AgCl as the reference electrode, as shown in the figure. A 0.05 M Ba(OH) 2 solution was used as the PEC electrolyte; no potassium salt was added to the electrolyte so as to allow unambiguous investigation of the influence of surface-adsorbed potassium on the PEC properties. The three representative titania nanotube samples (henceforth denoted K1, K2, and K3) prepared in electrolytes containing decreasing K + ion concentration K1(0.15M) > K2(0.137M) > K3(0.03M), were studied. For reference, titania nanotube samples were also prepared in a potassium-free electrolyte containing NH 4 F (denoted sample NH1). The potential of the working electrode V WE (the TiO 2 nanotube sample, with respect to the reference electrode) was incrementally raised by applying an external bias and the corresponding value of photocurrent I ph was determined at its steady state value. Additionally, at steady state, the bias voltage V bias between the TiO 2 nanotube sample and the counter electrode was measured independently by a second voltmeter. For all samples studied, I ph was found to decrease and V bias was found to increase with increasing V WE. This trend is shown for two representative samples, K2 and NH1 in Figures 3a and 3b. The photoelectrochemical conversion efficiency η c quantifying the amount of light energy converted into chemical energy by a given sample at the bias voltage may be calculated from these data as shown below [111, 112]: 110
111 E I (%) CE EEB 100 ph ηc = = E I0A IN ( ΔGrxn Vbias ) 100 (4) In Eq. (4) E CE describes the chemical energy consumed for production of hydrogen from water over a time interval t and is calculated as E CE = I ΔG t with ph rxn ΔG rxn =1.23 V as the Gibbs free energy per coulomb of electrons for splitting water at room temperature. The externally-provided electrical energy E EB is calculated as E EB = I V t and = I 0 A t is the energy of the incident light with I 0 as the ph bias E IN irradiance (W/m 2 ) and A as the irradiated area (m 2 ). Figure 46 c shows the dependence of η c, calculated from Eq (4), as a function of working electrode potential V WE and illustrates a tradeoff between the advantage of increased photocurrent and the disadvantage of increased bias. This tradeoff leads to a maximum in the PEC efficiency, η c, max. While it appears that the maximum efficiencies are comparable for both samples, a distinct difference in how these efficiencies were achieved does exist (see the dashed lines of Figure 46 a,b,c). The K + -free nanotubes (NH1) achieved maximum efficiency for larger values of V WE and consequently at increased photocurrents driven by larger bias voltages. The K + -containing samples consistently exhibited maximum efficiency at lower V WE with lower photocurrents and lower bias voltages. Indeed, a comparison of I ph, V bias and η c,max of the nanotube samples containing varying amount of potassium adsorption illustrates this trend. Although η c,max 111
112 appears to be independent of the amount of potassium adsorption, both I ph and V bias decrease with increasing potassium adsorption for all samples studied. Figure 46 (a) Photocurrent I ph per unit area of the sample (b) Bias voltage, V bias and (c) Percentage of PEC efficiency η c calculated using equation (4) for various working electrode potential values. Vertical dashed lines at maximum η c are added as a convenience to the reader 112
113 It may be shown that V bias is the only parameter that accounts for the external energy input necessary to produce a fixed quantity of H 2 from PEC splitting of water. This deduction is illustrated by the chemical reaction for the formation of hydrogen from water: + 1 H 2O + 2e + 2h = O2 + H 2 2 (5) For every two electron (e - )-hole (h + ) pairs formed, a single hydrogen molecule is produced at the cathode in the PEC circuit. Thus the chemical energy needed for hydrogen production E CE may be written in terms of the total number of electrons, N e, passing through the circuit, or equivalently in terms of the total number of hydrogen molecules, N H 2, produced: E CE ( 2N ) = ΔG I t = ΔG q N = ΔG q (6) rxn ph rxn e rxn H 2 Here q is the electron charge in coulombs and N e = 2 N H 2 from Eq. (5). Equations (4) and (6) allow the external electrical energy input per hydrogen molecule produced via the PEC process to be written as: E N EB H 2 Vbias I pht = = 2 q V 1 I pht 2 q bias (7) 113
114 confirming that the external energy input per hydrogen molecule produced is directly proportional to V bias; this is an important consideration for optimizing the practical performance of water splitting. Thus, at the maximum PEC efficiency, K + -containing nanotube samples produce hydrogen at a lower rate than K + -free samples (as indicated by the lower values of the photocurrent I ph ), but also required a significantly lower external energy input per liter of hydrogen produced (as indicated by the low V bias ). Specifically, Table 1 shows that while the maximum PEC efficiencies for all samples studied are nearly equal, the required bias voltage at the maximum efficiency decreases with increasing amount of adsorbed potassium. In fact, for sample K1 (with the highest amount of adsorbed potassium) the required bias voltage is approximately 2.5 times lower than that for the potassium-free sample, NH1. Hence, K1 would require 2.5 times lower external electrical energy for operation than NH1. This observation implies that only approximately 40% of the electrical energy input for potassium-containing nanotubes is required in comparison with potassium-free nanotubes to produce the same amount of hydrogen. The adsorption of K + ionic species onto the surface of titania nanotubes has been demonstrated with synchrotron-based NEXAFS spectroscopy[67] and has been correlated with the enhanced PEC performance of nanotube photoelectrodes synthesized in electrolytes containing potassium. As potassium hydroxide is by far the most common base used in PEC water-splitting cells [3,4,7,8] employing titania nanotubes, potassium is likely to be present, but remain unexamined, on the titania surface in many studies. It is 114
115 thus important to quantify and further clarify the impact of adsorbed potassium species on TiO 2 and on its PEC properties. The current results suggest that the potassium content of titania nanotube anodes for hydrogen solar cells may be used as a control variable to optimize the trade-off between high photocurrent (high H 2 output) and low external voltage (lower electrical energy input) input per liter of H 2 produced Gold Attachment for Photocatalytic Applications Controlled attachment of gold nanoparticles on ordered arrays of amorphous titania nanotubes was recently demonstrated by our lab[8]. Gold enhanced titanium oxide thin films have already demonstrated very good photocatalytic properties (light assisted CO oxidation), and these properties can be furthermore enhanced by the huge increase in surface offered by the titanium oxide nanotubes. Two types of titania samples, low aspect ratio (~3-5:1) nanotubes arrays and high aspect ratio (~50:1) nanotubes arrays, were used as support for the gold nanoparticles. Titania nanotubes with low aspect ratio were fabricated using the technique pioneered by the group of Grimes[21] involving DC anodization in a beaker containing a 0.25M HF aqueous solution for less than 1 hour (details of our experimental setup can be found elsewhere[66]). Typical samples had a surface area of 1 cm x 2cm, and nanotubes with average inner diameter of 58 nm and average length of 400 nm were formed on both sides of the sample. Such low aspect ratio nanotube samples were furthermore subjected to a systematic investigation into the attachment of gold nanoparticles for different deposition parameters. Good size uniformity and good surface coverage of the 115
116 nanoparticles on both the inside and outside surfaces of the nanotubes has been achieved. Nanoparticles diameters < 5 nm, optimum for maximum photocatalytic efficiency[113] and large surface coverage have been achieved. Gold nanoparticles formation and attachment to the nanotube surfaces was achieved with a variation of the deposition-precipitation method pioneered by Haruta et al.[114] and successfully employed by Moreau et al.[115] for titanium oxide thin films. This process involves soaking the samples in a basic (NaOH) solution containing an appropriate gold salt. In previous experiments[115] a key element to obtain small diameter nanoparticles was to maintain a constant ph solution value of 9. This constraint necessitated periodic adjustment of the concentration of NaOH during the deposition process, since the ph evolved in time as the solution was depleted in gold salt. This adjustment created further complications in controlling the nanoparticle deposition when adjusting other parameters such as the total surface area of the sample or the morphology of the nanotubes For the gold source, a solution of M HAuCl 4 3H 2 O (Alfa Aesar, metals basis, 99.99%) was mixed with another solution of M NaOH (flakes, Fisher Scientific), both in de-ionized water. 25 ml of each solution were mixed to produce a final 50 ml mix of M HAuCl 4 3H 2 O and M NaOH ( standard NaOH concentration ). The nanotubes samples were immediately soaked in the final solution, and the container was closed and placed on hot plate with temperature of 140 C for one hour ( standard soaking time ). Typical solution temperature varied from a starting value 116
117 of ~20 C and reached a value of ~70 C towards the end of the deposition process. After the deposition, the samples were taken out and washed with DI water for seconds and then dried using air stream for 1 min. In our fabrication approach only two external parameters: the initial concentrations of gold and NaOH in the solution and a high heating temperature for the solution were found to be critical in producing a good coverage of the gold nanoparticles on the titania nanotube surface. Figure 47 shows an SEM image of gold nanoparticle attachment on a titania nanotube (small aspect ratio: 70 nm diameter and 400 nm length) substrate with a total sample surface area of 4 cm 2 (2cm x 1 cm x 2 sides). The sample was soaked for one hour in a 50 ml mixed solution of HAuCl 4 and NaOH. Uniform deposition can be observed, together with a very good coverage of the nanotubes. Figure 47 High resolution SEM image of low aspect ratio titania nanotubes before (left) and after (right) the first successful deposition of approximately 2 nm diameter gold nanoparticles on the tubes walls. Scale bar is 20 nm for both images. While the above characteristics were obtained on low-aspect-ratio titania nanotubes, very similar results were obtained on high-aspect-ratio tubes (Figure 48). 117


;")
118 Such high aspect ratio titania nanotubes were synthesized by DC anodization in a beaker containing a solution of 0.5 wt % KF in a mixture of 95% vol. glycerol and 5% vol. DI water. Nanotubes with average inner diameter of 140 nm and average length of 6 μm were formed on both sides of a 0.5cm x 2.5 cm sample. Figure 48 SEM image of high aspect ratio titania nanotubes. Side view showing uniform deposition on the whole length of the nanotubes (top left); Side view of broken nanotubes demonstrating similar uniformity of gold nanoparticles deposition both inside and outside the tubes (top right); Detailed view of gold supported high aspect ratio nanotubes on a falsely colored SEM image. All scale bars are 200 nm. 118
119 In order to obtain uniform deposition of nanosized gold particles on such high aspect ratio tubes, we used the same standard deposition conditions, except that the concentration of NaOH in the soaking solution was reduced from M to M in the final 50 ml mixture. Large aspect-ratio nanotubes are easily transferred from the sample to transmission electron microscopy (TEM) grids for more detailed imaging and characterization (Fig. 5). Figs. 5a and 5b confirm the uniform coverage of gold nanoparticles on the nanotubes walls. The size of the gold particles for this particular sample was found to be 2.08 nm ± 0.93 nm, as averaged over 80 particles. In the highresolution (HR) TEM images (Fig. 5c) the morphology of the gold nanoparticles may be analyzed in detail; many nanoparticles with well-defined facets (pentagonal, hexagonal and octagonal) can be observed, suggesting that most of them are single crystals. The average lattice spacing may be determined from the HRTEM images (Fig. 5c) as 2.48 Å. This result is within 5% of the literature value for the (111) plane spacing distance of 2.35 Å. Energy-dispersive X-ray spectroscopic analysis (Fig. 5d) indicates that the elemental concentrations are as follows: the atomic ratio Ti:O is very close to the predicted 1:2 value, and the weight percent of gold nanoparticles with respect to titania nanotubes is estimated as 22.3%. 119
 TEM image of the nanotube")
 HRTEM image revealing the crystalline structure of the gold")

120 Figure 49 a) TEM image of gold nanoparticles supported on a fragment of a high aspect ratio titania nanotube b) TEM image of the nanotube wall exhibiting gold particles on both sides. c) HRTEM image revealing the crystalline structure of the gold nanoparticles on the amorphous titania support d) EDX spectrum of the TEM sample, with the relative concentration of the elements of interest shown in the inset. 120
CHAPTER 4. SYNTHESIS, CHARACTERIZATION OF TiO 2 NANOTUBES AND THEIR APPLICATION IN DYE SENSITIZED SOLAR CELL
 93 CHAPTER 4 SYNTHESIS, CHARACTERIZATION OF TiO 2 NANOTUBES AND THEIR APPLICATION IN DYE SENSITIZED SOLAR CELL 4.1 INTRODUCTION TiO 2 -derived nanotubes are expected to be applicable for several applications,
Study and Synthesis of Titanium Nanotube Arrays at High Temperature by Electrochemical Method
 International Journal of Current Engineering and Technology E-ISSN 2277 4106, P-ISSN 2347 5161 2015 INPRESSCO, All Rights Reserved Available at http://inpressco.com/category/ijcet Research Article Study
Title of file for HTML: Supplementary Information Description: Supplementary Figures and Supplementary References
 Title of file for HTML: Supplementary Information Description: Supplementary Figures and Supplementary References Supplementary Figure 1. SEM images of perovskite single-crystal patterned thin film with
A Study of Titania Nanotube Synthesis in Chloride-Ion-Containing Media
 A Study of Titania Nanotube Synthesis in Chloride-Ion-Containing Media E. Panaitescu, C. Richter and L. Menon J. Electrochem. Soc. 2008, Volume 155, Issue 1, Pages E7-E13. doi: 10.1149/1.2800170 Email
5. Building Blocks I: Ferroelectric inorganic micro- and nano(shell) tubes
 tubes") 5. Building Blocks I: Ferroelectric inorganic micro- and nano(shell) tubes 5.1 New candidates for nanoelectronics: ferroelectric nanotubes In this chapter, one of the core elements for a complex building
5. Building Blocks I: Ferroelectric inorganic micro- and nano(shell) tubes 5.1 New candidates for nanoelectronics: ferroelectric nanotubes In this chapter, one of the core elements for a complex building
P.O. Box: , Tehran, Iran. Tehran, Iran
 Effect of fluoride concentration and water content on morphology of titania nanotubes in ethylene glycol solution M. Naghizadeh 1,a, S. Ghannadi 1,b, H. Abdizadeh 1,2,c, M.R. Golobostanfard 1,d 1 School
REFRACTORY METAL OXIDES: FABRICATION OF NANOSTRUCTURES, PROPERTIES AND APPLICATIONS
 REFRACTORY METAL OXIDES: FABRICATION OF NANOSTRUCTURES, PROPERTIES AND APPLICATIONS S.K. Lazarouk, D.A. Sasinovich BELARUSIAN STATE UNIVERSITY OF INFORMATICS AND RADIOELECTRONICS Outline: -- experimental
Supporting Information
 Supporting Information Dynamic Interaction between Methylammonium Lead Iodide and TiO 2 Nanocrystals Leads to Enhanced Photocatalytic H 2 Evolution from HI Splitting Xiaomei Wang,, Hong Wang,, Hefeng Zhang,,
Supplementary Figure 1. Cross-section SEM image of the polymer scaffold perovskite film using MAI:PbI 2 =1:1 in DMF solvent on the FTO/glass
 Supplementary Figure 1. Cross-section SEM image of the polymer scaffold perovskite film using MAI:PbI 2 =1:1 in DMF solvent on the FTO/glass substrate. Scale bar: 1 m. Supplementary Figure 2. Contact angle
Chapter 1 INTRODUCTION AND LITERATURE REVIEW XXIII
 Chapter 1 INTRODUCTION AND LITERATURE REVIEW XXIII CHAPTER 1 INTRODUCTION AND LITERATURE REVIEW I. INTRODUCTION Nanotubes are of great interest for a wide array of technological and biological applications,
Supporting Information:
 Supporting Information: Enhancing Visible Light Photo-Oxidation of Water with TiO 2 Nanowire Arrays via Co-treatment with H 2 and NH 3 : Synergistic Effects between Ti 3+ and N. Son Hoang, Sean P. Berglund,
Supporting Information:
 Supporting Information: High Efficiency Photoelectrocatalytic Hydrogen Generation Enabled by Palladium Quantum Dots Sensitized TiO 2 Nanotube Arrays Meidan Ye, Jiaojiao Gong, Yuekun Lai, Changjian Lin,*,
SUPPLEMENTARY INFORMATION
 In the format provided by the authors and unedited. DOI: 10.1038/NNANO.2016.257 Multiple nanostructures based on anodized aluminium oxide templates Liaoyong Wen, Rui Xu, Yan Mi, Yong Lei * 1 NATURE NANOTECHNOLOGY
Synthesis and characterization of titania nanotube arrays by electrochemical method for dye sensitized solar cells
 Available online at www.scholarsresearchlibrary.com Archives of Applied Science Research, 2013, 5 (5):28-32 (http://scholarsresearchlibrary.com/archive.html) ISSN 0975-508X CODEN (USA) AASRC9 Synthesis
Application of Hierarchical Titanate and Titania nanotubes in Dye Sensitized Solar Cells Dmitry V. Bavykin and Frank C. Walsh
 Application of Hierarchical Titanate and Titania nanotubes in Dye Sensitized Solar Cells Dmitry V. Bavykin and Frank C. Walsh Energy Technology and Materials Engineering Research Groups School of Engineering
The goal of this project is to enhance the power density and lowtemperature efficiency of solid oxide fuel cells (SOFC) manufactured by atomic layer
 manufactured by atomic layer") Stanford University Michael Shandalov1, Shriram Ramanathan2, Changhyun Ko2 and Paul McIntyre1 1Department of Materials Science and Engineering, Stanford University 2Division of Engineering and Applied
Stanford University Michael Shandalov1, Shriram Ramanathan2, Changhyun Ko2 and Paul McIntyre1 1Department of Materials Science and Engineering, Stanford University 2Division of Engineering and Applied
Nano-engineered materials for H 2 production by water photo-electrolysis
 Nano-engineered materials for H 2 production by water photo-electrolysis C. Ampelli, R. Passalacqua, S. Perathoner, G. Centi Department of Industrial Chemistry and Materials Engineering, University of
Nanotechnology Fabrication Methods.
 Nanotechnology Fabrication Methods. 10 / 05 / 2016 1 Summary: 1.Introduction to Nanotechnology:...3 2.Nanotechnology Fabrication Methods:...5 2.1.Top-down Methods:...7 2.2.Bottom-up Methods:...16 3.Conclusions:...19
Supplementary Figure 1 XRD pattern of a defective TiO 2 thin film deposited on an FTO/glass substrate, along with an XRD pattern of bare FTO/glass
 Supplementary Figure 1 XRD pattern of a defective TiO 2 thin film deposited on an FTO/glass substrate, along with an XRD pattern of bare FTO/glass and a reference pattern of anatase TiO 2 (JSPDS No.: 21-1272).
CHAPTER 3. OPTICAL STUDIES ON SnS NANOPARTICLES
 42 CHAPTER 3 OPTICAL STUDIES ON SnS NANOPARTICLES 3.1 INTRODUCTION In recent years, considerable interest has been shown on semiconducting nanostructures owing to their enhanced optical and electrical
Unit 4: Chemical Changes (Higher Content)
") Metals react with oxygen to produce metal oxides. E.g. Copper + Oxygen > Copper Oxide The reactions are oxidation reactions because the metals gain oxygen. Reactivity of Metals Metal Extraction Metals
Metals react with oxygen to produce metal oxides. E.g. Copper + Oxygen > Copper Oxide The reactions are oxidation reactions because the metals gain oxygen. Reactivity of Metals Metal Extraction Metals
Scientific report 2016 January September. Designing composite nanoarchitectures for hydrogen production and environmental depollution
 Scientific report 2016 January September Designing composite nanoarchitectures for hydrogen production and environmental depollution Synthesis of the spherical Pt nanoparticles We have chosen to synthesize
Efficient Hydrogen Evolution. University of Central Florida, 4000 Central Florida Blvd. Orlando, Florida, 32816,
 Electronic Supplementary Material (ESI) for Energy & Environmental Science. This journal is The Royal Society of Chemistry 2017 MoS 2 /TiO 2 Heterostructures as Nonmetal Plasmonic Photocatalysts for Highly
Supporting Information
 Electronic Supplementary Material (ESI) for Journal of Materials Chemistry A. This journal is The Royal Society of Chemistry 2015 Supporting Information 1. Synthesis of perovskite materials CH 3 NH 3 I
High-Performance Silicon Battery Anodes Enabled by
 Supporting Information for: High-Performance Silicon Battery Anodes Enabled by Engineering Graphene Assemblies Min Zhou,, Xianglong Li, *, Bin Wang, Yunbo Zhang, Jing Ning, Zhichang Xiao, Xinghao Zhang,
Low temperature anodically grown silicon dioxide films for solar cell. Nicholas E. Grant
 Low temperature anodically grown silicon dioxide films for solar cell applications Nicholas E. Grant Outline 1. Electrochemical cell design and properties. 2. Direct-current current anodic oxidations-part
Photocatalysis: semiconductor physics
 Photocatalysis: semiconductor physics Carlos J. Tavares Center of Physics, University of Minho, Portugal ctavares@fisica.uminho.pt www.fisica.uminho.pt 1 Guimarães Where do I come from? 3 Guimarães 4 Introduction>>
The first three categories are considered a bottom-up approach while lithography is a topdown
 Nanowires and Nanorods One-dimensional structures have been called in different ways: nanowires, nanorod, fibers of fibrils, whiskers, etc. The common characteristic of these structures is that all they
Supplementary Figure S1. Verifying the CH 3 NH 3 PbI 3-x Cl x sensitized TiO 2 coating UV-vis spectrum of the solution obtained by dissolving the
 Supplementary Figure S1. Verifying the CH 3 NH 3 PbI 3-x Cl x sensitized TiO 2 coating UV-vis spectrum of the solution obtained by dissolving the spiro-ometad from a perovskite-filled mesoporous TiO 2
Nanostructured Organic-Inorganic Thin Film Photovoltaics
 Supporting Information Fabrication of Coaxial TiO 2 /Sb 2 S 3 Nanowire Hybrids for Nanostructured Organic-Inorganic Thin Film Photovoltaics Juliano C. Cardoso, a Craig A. Grimes,*,a Xinjian Feng, b Xiaoyan
A One-Step Low Temperature Processing Route for Organolead Halide Perovskite Solar Cells
 Electronic Supplementary Information A One-Step Low Temperature Processing Route for Organolead Halide Perovskite Solar Cells Matthew J. Carnie, a Cecile Charbonneau, a Matthew L. Davies, b Joel Troughton,
Two Dimensional Graphene/SnS 2 Hybrids with Superior Rate Capability for Lithium ion Storage
 Electronic Supplementary Information Two Dimensional Graphene/SnS 2 Hybrids with Superior Rate Capability for Lithium ion Storage Bin Luo, a Yan Fang, a Bin Wang, a Jisheng Zhou, b Huaihe Song, b and Linjie
Supplementary information
 Supplementary information Electrochemical synthesis of metal and semimetal nanotube-nanowire heterojunctions and their electronic transport properties Dachi Yang, ab Guowen Meng,* a Shuyuan Zhang, c Yufeng
Fabrication Methods: Chapter 4. Often two methods are typical. Top Down Bottom up. Begins with atoms or molecules. Begins with bulk materials
 Fabrication Methods: Chapter 4 Often two methods are typical Top Down Bottom up Begins with bulk materials Begins with atoms or molecules Reduced in size to nano By thermal, physical Chemical, electrochemical
N-doped Carbon-Coated Cobalt Nanorod Arrays Supported on a Titanium. Mesh as Highly Active Electrocatalysts for Hydrogen Evolution Reaction
 Electronic Supplementary Material (ESI) for Journal of Materials Chemistry A. This journal is The Royal Society of Chemistry 2014 Electronic Supplementary Information N-doped Carbon-Coated Cobalt Nanorod
Synthesis of Optimized InP/ZnS Core/Shell Nanocrystals and TiO2 Nanotubes for Quantum Dot Sensitized Solar Cells
 University of Arkansas, Fayetteville ScholarWorks@UARK Theses and Dissertations 5-2013 Synthesis of Optimized InP/ZnS Core/Shell Nanocrystals and TiO2 Nanotubes for Quantum Dot Sensitized Solar Cells Seungyong
Transparent TiO 2 nanotube/nanowire arrays on TCO coated glass substrates: Synthesis and application to solar energy conversion
 Transparent TiO 2 nanotube/nanowire arrays on TCO coated glass substrates: Synthesis and application to solar energy conversion Craig A. Grimes Department of Electrical Engineering Center for Solar Nanomaterials
Creating New Barriers with Graphene
 Creating New Barriers with Graphene Authors: Richard Akam, Lynn Chikosha & Tim von Werne Introduction Graphene was first isolated in 2004 by Andre Geim and Konstantin Novoselov at Manchester University.
Electronic Supplementary Information
 Electronic Supplementary Information High Electrocatalytic Activity of Self-standing Hollow NiCo 2 S 4 Single Crystalline Nanorod Arrays towards Sulfide Redox Shuttles in Quantum Dot-sensitized Solar Cells
Journal of Science and Technology Fabrication Of Titania Nanotubes By A Modified Hydrothermal Method
 Fabrication Of Titania Nanotubes By A Modified Hydrothermal Method Meor Yusoff M.S., Masliana M., Wilfred Paulus, Parimala Devi, Mahdi E. Mahmoud Materials Technology Group, Malaysian Nuclear Agency, Bangi,
electrodeposition is a special case of electrolysis where the result is deposition of solid material on an electrode surface.
 Electrochemical Methods Electrochemical Deposition is known as electrodeposition - see CHEM* 1050 - electrolysis electrodeposition is a special case of electrolysis where the result is deposition of solid
GRAPHENE ON THE Si-FACE OF SILICON CARBIDE USER MANUAL
 GRAPHENE ON THE Si-FACE OF SILICON CARBIDE USER MANUAL 1. INTRODUCTION Silicon Carbide (SiC) is a wide band gap semiconductor that exists in different polytypes. The substrate used for the fabrication
One-Dimensional Nanomaterials for Energy and Electronics Applications
 #1/28 One-Dimensional Nanomaterials for Energy and Electronics Applications Latika Menon Advanced Nanomaterials Laboratory Department of Physics l.menon@neu.edu 617-373-4530 617-373-4530 Menon Laboratories,
Effect of Electrolyte Concentration during Solution Plasma on Copper Nanoparticle Size
 IOP Conference Series: Materials Science and Engineering PAPER OPEN ACCESS Effect of Electrolyte Concentration during Solution Plasma on Copper Nanoparticle Size To cite this article: M H S Al Anbouri
The Photoelectrochemical Response of Various Surface Morphologies of Titanium Anodic Oxide Films
 Journal of Engineering Science, Vol. 9, 21 30, 2013 21 The Photoelectrochemical Response of Various Surface Morphologies of Titanium Anodic Oxide Films Chin Wei Lai and Srimala Sreekantan * School of Materials
SUPPORTING INFORMATION
 Nucleation of FAU and LTA Zeolites from Heterogeneous Aluminosilicate Precursors Matthew D. Oleksiak 1, Jennifer A. Soltis 2,4, Marlon T. Conato, 1,3 R. Lee Penn 2, Jeffrey D. Rimer 1* 1 University of
Markus Niederberger Max Planck Institute of Colloids and Interfaces, Potsdam, Germany.
 Markus Niederberger Max Planck Institute of Colloids and Interfaces, Potsdam, Germany Markus.Niederberger@mpikg-golm.mpg.de Outline of the Lecture Self-Assembly of Nanocrystals to Superstructures What
Electronic Supplementary Information. Enhanced Photocatalytic/photoelectrocatalytic Activities
 Electronic Supplementary Material (ESI) for CrystEngComm. This journal is The Royal Society of Chemistry 2017 Electronic Supplementary Information Electrospun BiVO 4 Nanobelts with Tailored Structures
Supplementary Figure 1.
 Supplementary Figure 1. Supplementary Figure 1. Effects of the unlimited current. (a) Photograph of a AAO formed by pulsed anodization in the following conditions: V MA=25 V, t MA=180 s; V HA,N =36 V,
Supplementary Materials for
 advances.sciencemag.org/cgi/content/full/3/8/e1700732/dc1 This PDF file includes: Supplementary Materials for Oriented assembly of anisotropic nanoparticles into frame-like superstructures Jianwei Nai,
Kentaro INOUE. Introduction. Measurement principle (membrane polarographic method)
") FFeature Article Article Performance of the Dissolved Oxygen Monitor Used in the Semiconductor Wet Process; Low Concentration Monitoring, High Temperature, Small Amount of Sampling Volume, Chemical Resistance
FFeature Article Article Performance of the Dissolved Oxygen Monitor Used in the Semiconductor Wet Process; Low Concentration Monitoring, High Temperature, Small Amount of Sampling Volume, Chemical Resistance
Angel International School - Manipay 1 st Term Examination November, 2015
 Grade 11B Angel International School - Manipay 1 st Term Examination November, 2015 Chemistry - I Duration: 1.00 Hour Part 1 1) A liquid boils at a temperature of 100 o C. Which other property of the liquid
Catalytic Decomposition of Formaldehyde on Nanometer Manganese Dioxide
 Modern Applied Science April, 29 Catalytic Decomposition of Formaldehyde on Nanometer Manganese Dioxide Xiujuan Chu & Hua Zhang (Corresponding author) Tianjin Municipal Key Lab of Fibres Modification and
Supplementary Information. Seeding Approach to Noble Metal Decorated Conducting Polymer Nanofiber Network
 Supplementary Information Seeding Approach to Noble Metal Decorated Conducting Polymer Nanofiber Network Zhen Liu, Selcuk Poyraz, Yang Liu, Xinyu Zhang* Department of Polymer and Fiber Engineering, Auburn
PREPARATION OF LUMINESCENT SILICON NANOPARTICLES BY PHOTOTHERMAL AEROSOL SYNTHESIS FOLLOWED BY ACID ETCHING
 Phase Transitions Vol. 77, Nos. 1 2, January February 2004, pp. 131 137 PREPARATION OF LUMINESCENT SILICON NANOPARTICLES BY PHOTOTHERMAL AEROSOL SYNTHESIS FOLLOWED BY ACID ETCHING X. LI, Y. HE, S.S. TALUKDAR
CHEMISTRY Matter and Change
 CHEMISTRY Matter and Change UNIT 18 Table Of Contents Section 18.1 Introduction to Acids and Bases Unit 18: Acids and Bases Section 18.2 Section 18.3 Section 18.4 Strengths of Acids and Bases Hydrogen
High-Performance Flexible Asymmetric Supercapacitors Based on 3D. Electrodes
 Supporting Information for: High-Performance Flexible Asymmetric Supercapacitors Based on 3D Porous Graphene/MnO 2 Nanorod and Graphene/Ag Hybrid Thin-Film Electrodes Yuanlong Shao, a Hongzhi Wang,* a
e - Galvanic Cell 1. Voltage Sources 1.1 Polymer Electrolyte Membrane (PEM) Fuel Cell
 Fuel Cell") Galvanic cells convert different forms of energy (chemical fuel, sunlight, mechanical pressure, etc.) into electrical energy and heat. In this lecture, we are interested in some examples of galvanic cells.
Galvanic cells convert different forms of energy (chemical fuel, sunlight, mechanical pressure, etc.) into electrical energy and heat. In this lecture, we are interested in some examples of galvanic cells.
Nanostrukturphysik (Nanostructure Physics)
") Nanostrukturphysik (Nanostructure Physics) Prof. Yong Lei & Dr. Yang Xu Fachgebiet 3D-Nanostrukturierung, Institut für Physik Contact: yong.lei@tu-ilmenau.de; yang.xu@tu-ilmenau.de Office: Unterpoerlitzer
Nanostrukturphysik (Nanostructure Physics) Prof. Yong Lei & Dr. Yang Xu Fachgebiet 3D-Nanostrukturierung, Institut für Physik Contact: yong.lei@tu-ilmenau.de; yang.xu@tu-ilmenau.de Office: Unterpoerlitzer
PROGRESS REPORT FOR AINGRA09119
 Date electronic copy received at AINSE: 14 September 2009 PROGRESS REPORT FOR AINGRA09119 PROJECT TITLE TEM characterisation of novel supported silver and gold nanoparticle catalysts INVESTIGATOR(S) Institution
Q. Shen 1,2) and T. Toyoda 1,2)
 and T. Toyoda 1,2)") Photosensitization of nanostructured TiO 2 electrodes with CdSe quntum dots: effects of microstructure in substrates Q. Shen 1,2) and T. Toyoda 1,2) Department of Applied Physics and Chemistry 1), and
Photosensitization of nanostructured TiO 2 electrodes with CdSe quntum dots: effects of microstructure in substrates Q. Shen 1,2) and T. Toyoda 1,2) Department of Applied Physics and Chemistry 1), and
Supplementary Figures
 Supplementary Figures Supplementary Figure 1. AFM profiles of the charge transport and perovskite layers. AFM Image showing the thickness (y axis) of the layer with respect to the horizontal position of
Synthesis of nano-sized anatase TiO 2 with reactive {001} facets using lamellar protonated titanate as precursor
 Supporting Information Synthesis of nano-sized anatase TiO 2 with reactive {001} facets using lamellar protonated titanate as precursor Liuan Gu, Jingyu Wang *, Hao Cheng, Yunchen Du and Xijiang Han* Department
Synthesis and Characterization of Innovative Multilayer, Multi Metal Oxide Thin Films by Modified Silar Deposition Method
 STUDENT JOURNAL OF PHYSICS Indian Association of Physics Teachers Presentations Synthesis and Characterization of Innovative Multilayer, Multi Metal Oxide Thin Films by Modified Silar Deposition Method
performance electrocatalytic or electrochemical devices. Nanocrystals grown on graphene could have
 Nanocrystal Growth on Graphene with Various Degrees of Oxidation Hailiang Wang, Joshua Tucker Robinson, Georgi Diankov, and Hongjie Dai * Department of Chemistry and Laboratory for Advanced Materials,
Fabrication and Characterization of Metal and Metal Oxide Nanostructures Grown by Metal Displacement Deposition into Anodic Alumina Membranes
 Fabrication and Characterization of Metal and Metal Oxide Nanostructures Grown by Metal Displacement Deposition into Anodic Alumina Membranes Rosalinda Inguanta, Germano Ferrara, Salvatore Piazza, Carmelo
Supporting Information
 Copyright WILEY-VCH Verlag GmbH & Co. KGaA, 69469 Weinheim, Germany, 2015. Supporting Information for Adv. Energy Mater., DOI: 10.1002/aenm.201500060 Interconnected Nanorods Nanoflakes Li 2 Co 2 (MoO 4
Supporting Information. Synthesis of Metallic Magnesium Nanoparticles by Sonoelectrochemistry. Iris Haas and Aharon Gedanken*
 Supporting Information Synthesis of Metallic Magnesium Nanoparticles by Sonoelectrochemistry Iris Haas and Aharon Gedanken* Experimental Materials and chemical preparation The Gringard reagents, ethyl-mgcl
Nickel Phosphide-embedded Graphene as Counter Electrode for. Dye-sensitized Solar Cells **
 Nickel Phosphide-embedded Graphene as Counter Electrode for Dye-sensitized Solar Cells ** Y. Y. Dou, G. R. Li, J. Song, and X. P. Gao =.78 D 1359 G 163 a =.87 D 138 G 159 b =1.3 D 1351 G 1597 c 1 15 1
Supplementary Figure 1 a-c, The viscosity fitting curves of high-molecular-weight poly(vinyl alcohol) (HMW-PVA) (a), middle-molecular-weight
 (HMW-PVA) (a), middle-molecular-weight") Supplementary Figure 1 a-c, The viscosity fitting curves of high-molecular-weight poly(vinyl alcohol) (HMW-PVA) (a), middle-molecular-weight poly(vinyl alcohol) (MMW-PVA) (b) and low-molecular-weight poly(vinyl
Supplementary Figure 1 a-c, The viscosity fitting curves of high-molecular-weight poly(vinyl alcohol) (HMW-PVA) (a), middle-molecular-weight poly(vinyl alcohol) (MMW-PVA) (b) and low-molecular-weight poly(vinyl
Electrophoretic Deposition. - process in which particles, suspended in a liquid medium, migrate in an electric field and deposit on an electrode
 Electrophoretic Deposition - process in which particles, suspended in a liquid medium, migrate in an electric field and deposit on an electrode no redox differs from electrolytic in several ways deposit
Supporting Information
 Supporting Information Universal, In-Situ Transformation of Bulky Compounds into Nanoscale Catalysts by High Temperature Pulse Shaomao Xu 1, (a), Yanan Chen 1, (a), Yiju Li 1, (a), Aijiang Lu 1, Yonggang
Campbell's Biology, 9e (Reece et al.) Chapter 2 The Chemical Context of Life
 Chapter 2 The Chemical Context of Life") Campbell's Biology, 9e (Reece et al.) Chapter 2 The Chemical Context of Life This chapter presents basic chemical principles for understanding the chemical context of living organisms, from atomic structure
Campbell's Biology, 9e (Reece et al.) Chapter 2 The Chemical Context of Life This chapter presents basic chemical principles for understanding the chemical context of living organisms, from atomic structure
Kavli Workshop for Journalists. June 13th, CNF Cleanroom Activities
 Kavli Workshop for Journalists June 13th, 2007 CNF Cleanroom Activities Seeing nm-sized Objects with an SEM Lab experience: Scanning Electron Microscopy Equipment: Zeiss Supra 55VP Scanning electron microscopes
High-Performance Semiconducting Polythiophenes for Organic Thin Film. Transistors by Beng S. Ong,* Yiliang Wu, Ping Liu and Sandra Gardner
 Supplementary Materials for: High-Performance Semiconducting Polythiophenes for Organic Thin Film Transistors by Beng S. Ong,* Yiliang Wu, Ping Liu and Sandra Gardner 1. Materials and Instruments. All
often display a deep green color due to where the SPR occurs (i.e., the wavelength of light that interacts with this specific morphology).
.") Synthesis-Dependent Catalytic Properties of Gold Nanoparticles Nanoscience is the study of materials that have dimensions, intuitively, on the nanoscale, typically between 1 100 nm. This field has received
Synthesis-Dependent Catalytic Properties of Gold Nanoparticles Nanoscience is the study of materials that have dimensions, intuitively, on the nanoscale, typically between 1 100 nm. This field has received
Aligned metal oxide nanotube arrays: key-aspects of anodic TiO 2 nanotube formation and properties
 Aligned metal oxide nanotube arrays: key-aspects of anodic TiO 2 nanotube formation and properties Francesca Riboni 1, Nhat Truong Nguyen 1, Seulgi So 1, Patrik Schmuki 1,2* 1 Department of Materials Science
Supplementary Figure 1 Scheme image of GIXD set-up. The scheme image of slot die
 Supplementary Figure 1 Scheme image of GIXD set-up. The scheme image of slot die printing system combined with grazing incidence X-ray diffraction (GIXD) set-up. 1 Supplementary Figure 2 2D GIXD images
Highly Sensitive, Temperature-Independent Oxygen Gas Sensor based on Anatase TiO 2 Nanoparticles-grafted, 2D Mixed Valent VO x Nanoflakelets
 Highly Sensitive, Temperature-Independent Oxygen Gas Sensor based on Anatase TiO 2 Nanoparticles-grafted, 2D Mixed Valent VO x Nanoflakelets Appu Vengattoor Raghu, Karthikeyan K Karuppanan and Biji Pullithadathil
RESEARCH ON BENZENE VAPOR DETECTION USING POROUS SILICON
 Section Micro and Nano Technologies RESEARCH ON BENZENE VAPOR DETECTION USING POROUS SILICON Assoc. Prof. Ersin Kayahan 1,2,3 1 Kocaeli University, Electro-optic and Sys. Eng. Umuttepe, 41380, Kocaeli-Turkey
Research to Improve Photovoltaic (PV) Cell Efficiency by Hybrid Combination of PV and Thermoelectric Cell Elements.
 Cell Efficiency by Hybrid Combination of PV and Thermoelectric Cell Elements.") UNIVERSITY OF CENTRAL FLORIDA Research to Improve Photovoltaic (PV) Cell Efficiency by Hybrid Combination of PV and Thermoelectric Cell Elements. Page 129 PI: Nicoleta Sorloaica-Hickman, Robert Reedy Students:
UNIVERSITY OF CENTRAL FLORIDA Research to Improve Photovoltaic (PV) Cell Efficiency by Hybrid Combination of PV and Thermoelectric Cell Elements. Page 129 PI: Nicoleta Sorloaica-Hickman, Robert Reedy Students:
Controlled self-assembly of graphene oxide on a remote aluminum foil
 Supplementary Information Controlled self-assembly of graphene oxide on a remote aluminum foil Kai Feng, Yewen Cao and Peiyi Wu* State key Laboratory of Molecular Engineering of Polymers, Department of
SYNTHESIS OF CADMIUM SULFIDE NANOSTRUCTURES BY NOVEL PRECURSOR
 Nanomaterials: Applications and Properties (NAP-2011). Vol. 1, Part I 107 SYNTHESIS OF CADMIUM SULFIDE NANOSTRUCTURES BY NOVEL PRECURSOR M. Salavati Niasari 1,2* 1 Department of Inorganic Chemistry, Faculty
ELECTRODEPOSITION OF CdTe NANORODS IN ION TRACK MEMBRANES
 Journal of Optoelectronics and Advanced Materials Vol. 6, No. 1, March 2004, p. 121-125 ELECTRODEPOSITION OF CdTe NANORODS IN ION TRACK MEMBRANES M. Sima a, I. Enculescu a,b, C. Trautmann b, R. Neumann
Solutions for Assignment-8
 Solutions for Assignment-8 Q1. The process of adding impurities to a pure semiconductor is called: [1] (a) Mixing (b) Doping (c) Diffusing (d) None of the above In semiconductor production, doping intentionally
Electronic Supplementary Information. Low-temperature Benchtop-synthesis of All-inorganic Perovskite Nanowires
 Electronic Supplementary Material (ESI) for Nanoscale. This journal is The Royal Society of Chemistry 2017 Electronic Supplementary Information Low-temperature Benchtop-synthesis of All-inorganic Perovskite
Electronic Supplementary Information for the Manuscript
 Electronic Supplementary Material (ESI) for Journal of Materials Chemistry A. This journal is The Royal Society of Chemistry 214 Electronic Supplementary Information for the Manuscript Enhancing the visible
ST EDWARD S OXFORD. Lower Sixth Entrance Assessment. November Chemistry. 1 Hour. Candidates name:... St Edward's School 1
 ST EDWARD S OXFORD Lower Sixth Entrance Assessment November 2013 Chemistry 1 Hour Candidates name:... St Edward's School 1 St Edward's School 2 1. Complete the table below. Element calcium Symbol Pb S
Optimization of MnO2 Electrodeposits using Graphenated Carbon Nanotube Electrodes for Supercapacitors
 Optimization of MnO2 Electrodeposits using Graphenated Carbon Nanotube Electrodes for Supercapacitors Waleed Nusrat, 100425398 PHY 3090U Material Science Thursday April 9 th 2015 Researchers optimize the
Doctor of Philosophy
 STUDIES ON THE CORROSION INHIBITION BEHAVIOUR OF SOME AMINO ACID SURFACTANT ADDITIVES ABSTRACT SUBMITTED FOR THE AWARD OF THE DEGREE OF Doctor of Philosophy IN APPLIED CHEMISTRY By MOSARRAT PARVEEN UNDER
A Plasmonic Photocatalyst Consisting of Silver Nanoparticles Embedded in Titanium Dioxide. Ryan Huschka LANP Seminar February 19, 2008
 A Plasmonic Photocatalyst Consisting of Silver Nanoparticles Embedded in Titanium Dioxide Ryan Huschka LANP Seminar February 19, 2008 TiO 2 Applications White Pigment Photocatalyst Previous methods to
School of Chemical and Biological Engineering, College of Engineering, Seoul National University, 599 Gwanangno, Gwanakgu, Seoul , Korea ACS
 School of Chemical and Biological Engineering, College of Engineering, Seoul National University, 599 Gwanangno, Gwanakgu, Seoul 151-742, Korea ACS Appl. Mater. Interfaces 2015, 7, 1746 1751 (DOI: 10.1021/am507314t)
A Novel Photo-electrochemical Approach for the Chemical Recycling of Carbon Dioxide to Fuels
 A Novel Photo-electrochemical Approach for the Chemical Recycling of Carbon Dioxide to Fuels Claudio Ampelli*, Rosalba Passalacqua, Chiara Genovese, Siglinda Perathoner, Gabriele Centi Department of Industrial
Synthesis and Characterization Hierarchical Three-Dimensional TiO 2 Structure via Hydrothermal Method
 IOP Conference Series: Materials Science and Engineering PAPER OPEN ACCESS Synthesis and Characterization Hierarchical Three-Dimensional TiO 2 Structure via Hydrothermal Method To cite this article: N.
High Tap Density Secondary Silicon Particle. Anodes by Scalable Mechanical Pressing for
 Electronic Supplementary Material (ESI) for Energy & Environmental Science. This journal is The Royal Society of Chemistry 2015 Electronic Supplementary Information: High Tap Density Secondary Silicon
Recent applications of nanostructured materials - from solar cells and batteries to biological markers
 Recent applications of nanostructured materials - from solar cells and batteries to biological markers Prof. Jan Augustyński o Origins of nanotechnology - limits of miniaturization. o Nanoparticle size
maximal photofluorescence decay time of 6 hours (purchased from Shenzhen HuiDuoSheng
 Electronic Supplementary Material (ESI) for ChemComm. This journal is The Royal Society of Chemistry 2017 Experimental section Preparation of m-tio 2 /LPP photoanodes. TiO 2 colloid was synthesized according
Efficient Grain Boundary Suture by Low-cost Tetra-ammonium Zinc Phthalocyanine for Stable Perovskite Solar Cells with Expanded Photo-response
 Supporting information for Efficient Grain Boundary Suture by Low-cost Tetra-ammonium Zinc Phthalocyanine for Stable Perovskite Solar Cells with Expanded Photo-response Jing Cao 1,*,, Congping Li 1,, Xudong