Chapter 7. Mass Spectrometry
|
|
|
- Katrina Sherman
- 5 years ago
- Views:
Transcription
1 Chapter 7 Mass Spectrometry 1
2 Advantages of Atomic MS over Atomic Optical Spectroscopy Detection limits up to three times better Simple spectra, unique and easily interpretable Ability to measure atomic isotopic ratios Disadvantages Instrument costs 2-3x optical spectroscopy Drift up to 5-10% per hour Interferences 2
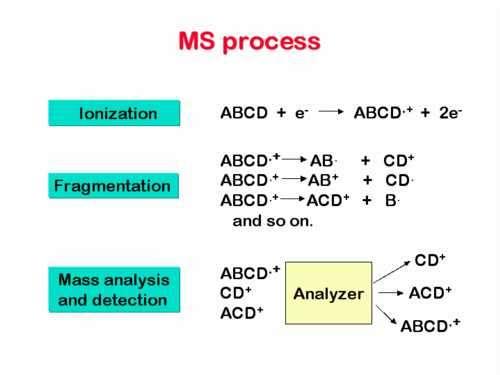
3 Basic Principles of the MS It is based on converting the sample (neutral components) into rapidly moving gaseous ions (+ve or ve ions) Ions are then separated on the basis of mass/charge (m/e) ratio (separation in optical spectroscopy was based upon dispersing wavelengths using a monochromator) Since most ions are singly charged the more convenient term, mass, is used Counting the number of ions of each type or measuring the ion current produced when the ions formed from the sample strike a suitable transducer. 3
4 4
5 Uses of Mass Spectrometry Mass spectroscopy provides information about: the elemental composition of samples of matter the structures o f inorganic, organic, and biological molecules the qualitative and quantitative composition of complex mixtures the structure and composition of solid surfaces the isotopic ratios of atoms in samples. data easier to interpret than IR and/or NMR accurate MW of sample 5
6 Atomic Weights in Mass Spectrometry Atomic and molecular weights are generally expressed in terms of atomic mass units (amu),or dalton. The atomic mass unit, or dalton, is based upon a relative scale in which the reference is the carbon-12 isotope which is assigned a mass of exactly 12 amu. Thus, the amu, or Da, is defined as 1/12 of the mass of one neutral C-12 atom. This definition makes 1 amu, or 1 Da, of carbon equal to 6
7 The atomic weight of an isotope such as Cl-35 is then related to that of the reference C-12 atom by comparing the masses of the two isotopes. Such a comparison reveals that the chlorine-35 isotope has a mass that is times greater than the mass of the carbon iso tope. Therefore, the atomic mass of the chlorine isotope is atomic mass CI-35 = Da X = Da Because 1 mol of C-12 weighs g, the atomic weight CI-35 is g/mol. In mass spectrometry, in contrast to most types of chemistry, we are often interested in the exact mass of particular isotopes of an element or the exact mass of compounds containing a particular set of isotopes. 7
8 8
9 In other contexts, we shall use the term nominal mass, which implies a whole-number precision in a mass measurement. Thus, the nominal masses of the three isomers just cited are 16, 17, and 17 Da, respectively. The chemical atomic weight or the average atomic weight (A) of an element in nature is given by the equation A = A 1 p 1 + A 2 p A n p n where A 1, A 2,... A n are the atomic masses in Daltons of the n isotopes of the element and p 1, p 2... p n are the fractional abundance of these isotopes. 9
10 The average or chemical molecular weight of a compound is then the sum of the chemical atomic weights for the atoms appearing in the formula of the compound. Thus, the chemical molecular weight of CH 4 is X = Da 10
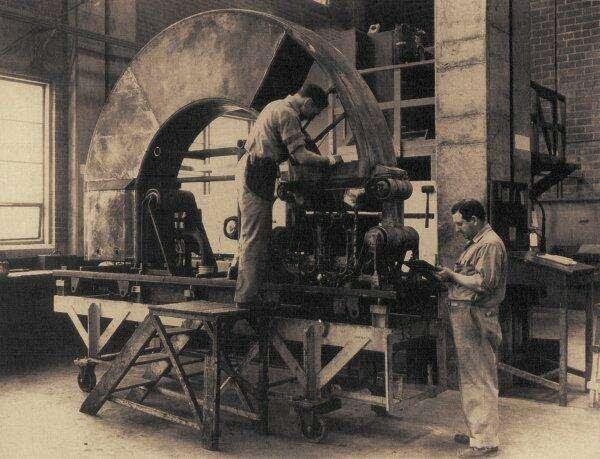
11 History of Mass Spectrometry (MS) Instrumentation Sir J.J. Thompson, electron, parabola spectrograph, m/z of ions Nobel Francis W. Aston, MS based mass resolution, velocity Nobel A.J. Dempster, (Chicago) magnetic deflector instrument, direction focusing, commercial format still used today. Developed first electron impact source 1940s- Magnetic deflector instrument (Model ) analytical MS manufactured by Consolidated Engineering Corporation (Pasadena, CA), used in WWII for quantitative analysis of organic gas mixtures in petroleum 1940s- Prof. Alfred O.C.Nier (Minnesota) developed the magnetic sector MS used for separation of U-235 and U-238. Nier used MS to isolate plutonium. The Calutron was used to separate U-235 at Oak Ridge, TN, for bombs. 1950s-Prof Mattauch-Herzog (Austria), and also Nier-Johnson (MN), developed high resolution double focusing instruments (direction and velocity). 1990s-Dempster, Mattauch-Herzog and Nier-Johnson dominated MS with development time-of-flight, quadruple, ion traps. 11
12 12
13 TOF MS designed, ions separated by differences in their velocity as they move in straight path to a collector in order of increasing m/z. TOF is fast, chrom. detection, good for large molecules -1950s- Quadruple instruments use quadrupolar electrical field (radiofrequency/direct current components), introduced by Prof Wolfgang Paul (Bonn). -Commercially introduced in 1983 by Finnigan (San Jose, CA) -Tandem MS- (MS-MS), precursor ion is mass-selected, fragmented by collision induced dissociation (CID) followed by mass analyses of product ions. Tandem MS triple-stage quadrupoles introduced by Finnigan and Sciex (`1980s) -Ability to study large biomolecules enhanced by electrospray ionization (ESI-MS) and Matrix-assisted laser desorption/ionization MS (MALDI MS) -ESI-MS, charged droplets from a capillary, electric field and ions drawn into MS inlet Put into practice in 1980s by John B Fenn (VCU, Richmond) -MALDI-MS-molecules are laser-desorbed from a solid or liquid matrix -APCI-MS- Useful for sophisticated biomedical analysis, sequencing of peptides and proteins, studies of noncovalent complexes/immunological molecules; DNA sequencing; analyses of viruses. 13
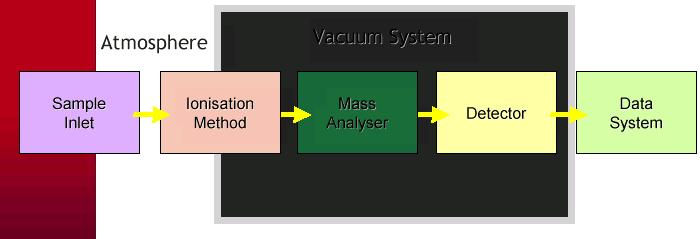
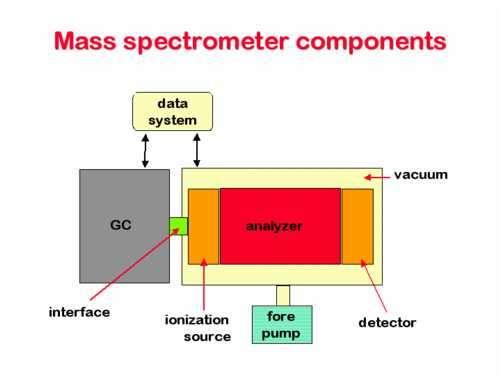
14 Components of Mass Spec Sample Inlet System Ion Source Mass Analyzer Detector torr Vacuum System Signal Processor Readout 14
15 15
16 16 Components of Mass Spectrometer
17 GC- 17
18 18 Molecular Mass Spectrum of Ethyl Benzene
19 Molecular Mass Spectra The analyte is ethyl benzene, which has a nominal molecular mass of 106 D C 6 H 5 CH 2 CH 3 + e - C 6 H 5 CH 2 CH 3 * + + 2e - The collision between energetic electrons and molecules usually imparts enough energy to the molecules to leave them in an excited state. Relaxation occurs by fragmentation of part of the molecular ions to produce ions of lower masses: C 6 H 5 CH + 2. Other smaller positively charged fragments are also formed in lesser amounts. The largest peak, is the base peak. It is assigned a value of 100. Other peaks can be computed as a percentage of the base-peak height. 19
 Mass Spectrum 194 67 109 55 82 42 94 136 165 20 40 60 80 100 120 140 160 180 200 Mass")
20 Molecular Mass Spectra O C H 3 H 3 C O N C C N H C C N N C H Mass Spectrometer Typical sample: isolated compound (~1 nanogram) Mass Spectrum Mass (amu)
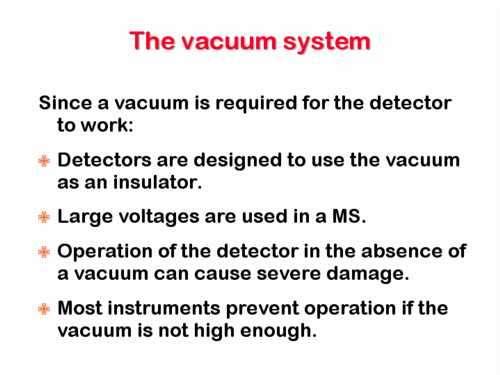
21 Inlet Systems The purpose of the inlet system is to permit introduction of a representative sample into the ion source with minimal loss of vacuum. Most modern mass spectrometers are equipped with several types of inlets to accommodate various kinds of samples The system must be able to vaporize molecules of low vapor pressure such as high molecular weight organic and organometallic compounds The inlet operates at low vapor pressure ( torr) and high temp. (up to 300 o C) The system must be leak-tight high temp vacuum system 21
22 Types of inlet systems batch inlet: 1-5 L surge tank: for gases and volatile liquids direct probe inlet: non-volatile liquids gas chromatographic inlet systems permeable porous material to release carrier gas capillary electrophoretic systems 22
23 Batch Inlet Systems Sample is volatilized externally and then allowed to leak into the evacuated ionization region. Typical system that is applicable to gaseous and liquid samples having boiling points up to about 500 C is shown 23
24 Batch-inlet system Rate of effusion square root of MW Lower MW molecules pass faster Metal or glass diaphragm containing a pinhole Gaseous sample Leaks into ionization area g is volatilized externally 24 Sample is maintained as gas under low P and high T
25 Gas/Liquid Inlet System Batch Inlet System For gas samples 25 The inlet system is used to introduce a micro amount of sample into the ion source where the components of the sample are converted into gaseous ions
26 26 Batch Inlet System
27 Features of Batch Inlet Systems For gaseous samples, a small measured volume of gas is trapped between the two valves enclosing the metering area and is then expanded into the reservoir flask. For liquids, a small quantity of sample is introduced into a reservoir, usually with a microliter syringe. In either case, the vacuum system is used to achieve a sample pressure of 10-4 to l0-5 torr. For samples with boiling points greater than 150 C, the reservoir and tubing must be maintained at an elevated temperature by means of an oven and heating tapes. The maximum temperature of the oven is about 350 C. This maximum limits the system to liquids with boiling points below about 500 C. The sample, which is now in the gas phase, is leaked into the ionization area of the spectrometer via a metal or glass diaphragm containing one or more pinholes. The inlet system is often lined with glass to avoid losses of polar analytes by adsorption. 27
28 The Direct Probe Inlet For solids and nonvolatile liquids ; thermally sensitive samples; sample quantity is limited. Solids and nonvolatile liquids can be introduced into the ionization region by means of a sample holder, or probe, which is inserted through a vacuum lock The lock system is designed to limit the volume of air that must be pumped from the system after insertion of the probe into the ionization region. Probes are also used when the quantity of sample is limited (as a few nanograms), because much less sample is wasted than with the batch system. 28
29 The Direct Probe Inlet Solid/Matrix Inlet Systems Sample 29
30 Features of the Direct Probe Inlet With a probe, the sample is generally held on the surface of a glass or aluminum capillary tube, a fine wire, or a small cup. The probe is positioned within a few millimeters of the ionization source and the slit leading to the spectrometer. The low pressure in the ionization area and the proximity of the sample to the ionization source often make it possible to obtain spectra of thermally unstable compounds before major decomposition has time to occur. The low pressure also leads to elevated concentrations of relatively nonvolatile compounds in the ionization area. Thus, the probe permits the study of such nonvolatile materials as carbohydrates, steroids, metal organic species, and low-molecular-weight polymeric substances. 30
31 31

32 32
33 33
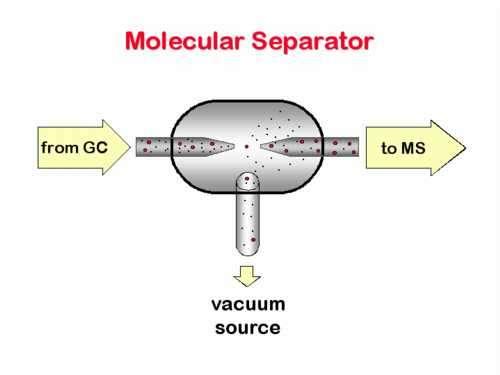
34 He diffusion is much faster than other components, thus it is Preferentially pumped away Jet assembly is contained in an oven At a temp. >column temp. To prevent adsorption or decomposition of sample molecules as with hot metals 34 Jet-separator interface connecting GC and MS
35 35
36 36
37 37
38 38
39 39

40 40

41 41
42 42
")
43 43 Appreciable air pressure would cause filament (ionization source) failiur
44 44

45 45
46 46 Ion Sources
47 Ion Sources The appearance of mass spectra for a given molecular species is highly dependent upon the method used for ion formation. Two types of ion sources gas phase sources: the sample is first vaporized and then ionized Gas-phase sources are restricted to thermally stable compounds that have boiling points less than about 500 C. This limits gaseous sources to compounds with molecular weights less than roughly l000 dalton desorption sources: the sample is directly converted into gaseous ions Desorption sources are applicable to nonvolatile and thermally unstable samples. Applicable to analytes having molecular weights as large as 10 3 Daltons. Currently, commercial mass spectrometers are equipped with accessories that permit use of several of these sources interchangeably. 47
48 Features of Ion Sources Ion sources are also classified as being hard sources or soft sources. Hard sources impart sufficient energy to analyte molecules so that they are left in a highly excited energy state. Relaxation then involves rupture of bonds, producing fragment ions that have mass-to-charge ratios less than that of the molecular ion. 48 The many peaks in a hard source spectrum provide useful information about the kinds of functional groups and thus structural information about analytes. Soft sources cause little fragmentation. Consequently, the resulting mass spectrum consists of the molecular ion peak and only a few, if any other peaks. Soft source spectra are useful because they supply accurate information about the molecular weight of the analyte molecule or molecules
49 49 MS with Hard and Soft Sources
50 50 Techniques used for
51 51 Ion Sources for Mass Spectrometers
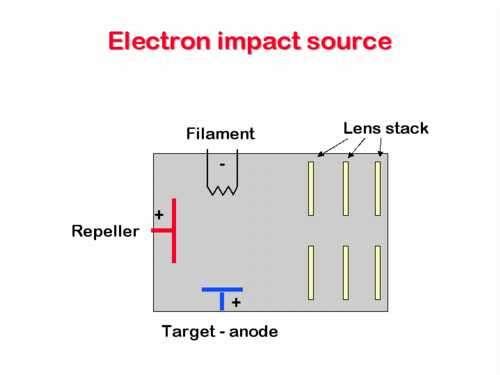
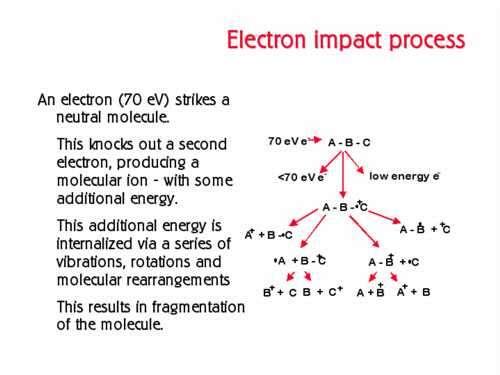
52 The Electron-Impact Source The sample is brought to a temperature high enough to produce a molecular vapor which is then ionized by bombarding the resulting molecules with a beam of energetic electrons. Thus electrons will be dislodged from the sample molecules Despite certain disadvantages, this technique is still of major importance and is the one upon which many libraries of mass spectral data are based. M + e - M + + 2e - 52 M 1 + M 3 + M + M 2 + M 4 + Fragmentation Lower mass ions
53 Electron Impact Ionization Process M + e > M + + 2e - where M + = molecular ion M + reults from removing an electron from a molecule Molecular Ions: (M+1) + results from one atom/molecular of C-13 or H-2 (M+2) + small for most organics because it requires two heavy atoms/molecule 1 C-13 and 1 H-2; 2 C-13s; 2 H-2s sizeable for chlorinated or brominated compounds Peaks for collision products: function of concentration (pressure) stability of the molecular ion stabilized by p e - systems, cyclic base peak highest peak peak height against which all others are measured for use in peak tables 53
54 54

55 55
56 56

57 57
58 58 Passes
59 59

60 60
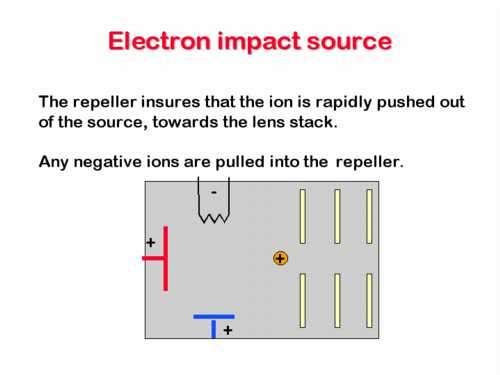
61 It repels ions formed in the source and direct them to exit slit (ion gun) Electron beam is collected here 1/1000 of neutral molecules is ionized Ion gun Area. Acceleratio n to the analyzer 61
62 62 Electron Impact Source
 Repeller + Neutral")

63 Electron Impact Ionization Source ~70 Volts Electron Collector (Trap) Repeller + Neutral Molecules + Inlet _ Positive Ions + to Analyzer e - e - e - _ Electrons Filament Extraction Plate 63
64 64 Typical Reactions during Electron Impact
65 65
66 66
67 67
68 68 Electron Impact Spectra
69 Isotope Peaks Mass spectra show peaks that occur at masses greater than that of the molecular ion. These peaks are attributable to ions having the same chemical formula, but different isotopic compositions. Methylene chloride, the more important isotopic species are: 12 C 1 H 2 35 Cl 2 (84) ; 13 C 1 H 2 35 Cl 2 (85); 12 C 1 H 2 37 Cl 2 (86); 13 C 1 H 2 37 Cl 2 (87); 13 C 1 H 2 35 Cl 37 Cl (88) The size of the various peaks depends upon the relative natural abundance of the isotopes. Isotope peaks sometimes provide a useful means for determining the formula for a compound 69
70 Collision Product Peaks Ion/molecule collisions can produce peaks at higher mass numbers than that of the molecular ion. At ordinary sample pressures, the only important reaction of this type is one in which the collision transfers a hydrogen atom to the ion to give a protonated molecular ion; an enhanced (M + 1) peak results. 70
71 Advantages and Disadvantages of Electron-Impact Sources Convenient to use and produce high ion currents, thus giving good sensitivities Unambiguous identification of analytes due to the extensive fragmentation and consequent large number of peaks As a disadvantage, the possibility of disappearance of the molecular ion peak so that the molecular weight of analytes cannot be established. The need to volatilize the sample, results in thermal degradation of some analytes before ionization can occur. As a solution, volatilization from a heated probe located close to the entrance slit of the spectrometer. At the lower pressure of the source area, volatilization occurs at a low temperature. Electron-impact sources are only applicable to analytes having molecular weights smaller than 1000 daltons. 71
72 Spark Source: SSMS Sparks similar to those in emission spectroscopy Ions are produced by applying a pulsed radio frequency voltage of about 30 kv to a pair of electrodes (analyte itself or graphite) mounted directly behind the ion gun that is about where the electron beam is located in an electron impact source Ions produced are accelerated through the ion gun and then mass analyzed Used for nonvolatile inorganic samples: metal alloys Good for solid samples and trace (1 ppb) analysis where 60 elements were determined simultaneously 72
73 73
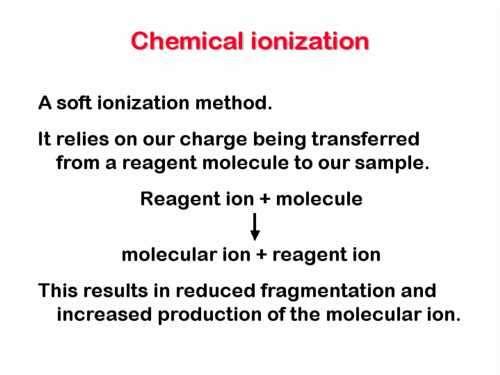
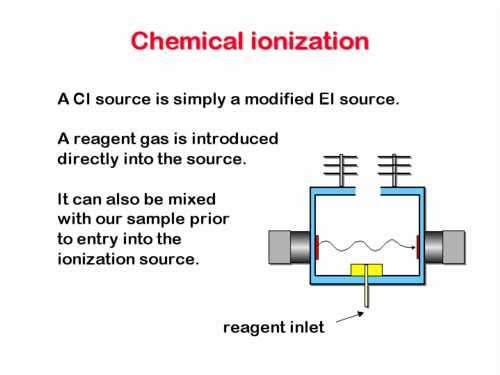
74 Features of Chemical Ionization Sources and Spectra Gentler ionization that leads to enhancement of the abundance of ions containing information on molecular weight and initial fragmentation Most modern mass spectrometers are designed so that electronimpact ionization and chemical ionization can be carried out interchangeably. Gaseous molecules of the sample (from either a batch inlet or a heated probe) are ionized by collision with ions produced by electron bombardment of an excess of a reagent gas CH 4,(Ionmolecule reactions). It is associated with a transfer of proton H + or abstracting a hydride ion H - or an electron Usually positive ions are used, but negative ion chemical ionization is occasionally used with analytes that contain very electronegative atoms. In order to carry out chemical ionization experiments, it is necessary to modify the electron beam ionization area by adding vacuum pump capacity and by reducing the width of the slit to the mass analyzer. 74
75 These measures allow a reagent pressure of about 1 torr to be maintained in the ionization area while maintaining the pressure in the analyzer below 10-5 torr. With these changes, a gaseous reagent is introduced into the ionization region in an amount such that the concentration ratio of reagent to sample is 10 3 to 10 4 Because of this large concentration difference, the electron beam reacts nearly exclusively with reagent molecule Most modern mass spectrometers are designed so that electron-impact ionization and chemical ionization can be carried out interchangeably. CH 4 is the most common reagent used. It reacts with highenergy electrons to give several ions such as CH 4+, CH 3 + and CH 2+. The first two predominate and represent about 90% of the reaction products. These ions react rapidly with additional methane molecules as follows CH CH 4 CH CH 3 CH CH 4 C 2 H H 2 75
76 76
77 Generally, collisions between the sample molecule MH and CH + 5 or C 2 H + 5 are highly reactive and involve proton or hydride transfer. CH MH MH CH 4 Proton transfer C 2 H MH MH C 2 H 4 Proton transfer C 2 H MH M + + C 2 H 6 Hydride transfer Note that proton transfer reactions give the (M +1) + ion whereas the hydride transfer produces (M - l) + ion With some compounds (M + 29) + peak is also produced from transfer of a C 2 H + 5 ion to the analyte. Propane, isobutane and ammonia are also used for chemical ionization. 77

78 78
79 Chemical Ionization MS Sources CH 4 High Energy electrons CH 4 CH 4+ CH 3 + CH 2 + CH CH 4 3 CH CH 4 4 CH C 2 5 H 5 CH H 2 3 Sample Molecule MH 79 CH C C H H 5 5 MH MH MH MH M 2 MH 2 C CH C 2 2 H 4 H 6 4 Molecule Ions
80 80
81 81

82 82
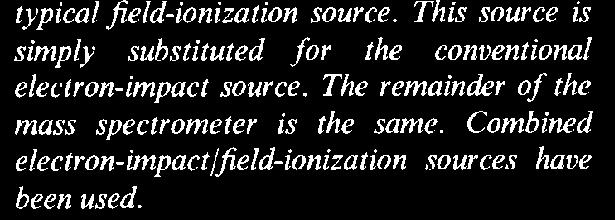
83 Field Ionization /Field Desorption Sources Apply large electric fields to carbon dendrites on a tungsten wire Field Ionization gas is passed over ionization source Metallic anode; cathode acts as slit; 5 to 20 kv potential applied; produces mainly M and M+1 peaks Field Desorption dipped in solution containing sample and placed back in spectrometer 83
84 Field Ionization Sources and Spectra Ions are formed under the influence of a large electric field (108 V/cm). Such fields are produced by applying high voltages (10 to 20 kv) to specially formed emitters consisting of numerous fine tips having diameters of less than I micro meter. The emitter often takes the form of a fine tungsten wire ( l0 micrometer diameter) on which microscopic carbon dendrites, or whiskers, have been grown by the pyrolysis of benzonitrile in a high electric field. The result of this treatment is a growth of many hundreds of carbon microtips projecting from the surface of the wire. Field ionization emitters are mounted 0.5 to 2 mm from the cathode, which often also serves as a slit. 84
85 The gaseous sample from a batch inlet system is allowed to diffuse into the high-field area around the microtips of the anode. The electric field is concentrated at the emitter tips, and ionization occurs via a quantum mechanical tunneling mechanism in which electrons from the analyte are extracted by the microtips of the anode. The +ve ions are repelled from the anode The +ve sample ions are extracted from the ionic chamber and accelerated through slits Little vibrational or rotational energy is imparted to the analyte (due to thermal decomposition or collisional reactions between molecules and ionic species); thus, little fragmentation occurs. Protonic transfer yields (M+1) + or (M-1) + species 85
86 86
87 Field Ionization Source 87 Field Ionization or Field Desorption Source (used as anode)
88 Glutamic Acid Electron Impact (EI) Field Ionization Field Desorption 88
89 89
90 Desorption Sources Mass spectra for thermally delicate biochemical species and species having molecular weights of greater than 100,000 Da have been reported. Energy in various forms is introduced into the solid or liquid sample in such a way as to cause direct formation of gaseous ions. As a consequence, spectra are greatly simplified and often consist of only the molecular ion or the protonated molecular ion. Various types of desorption ionization will be discussed 90
91 1. Field Desorption Sources In field desorption, a multitipped emitter similar to that used in field ionization sources. In this case, the electrode is mounted on a probe that can be removed from the sample compartment and coated with a solution of the sample. After the probe is reinserted into the sample compartment, ionization again takes place by the application of a high potential to this electrode. With some samples it is necessary to heat the emitter by passing a current through the wire. As a consequence, thermal degradation may occur before ionization is complete. Field desorption spectrum for glutamic acid is shown previously. It is even simpler than the spectrum from field ionization and consists of only the protonated molecular ion peak at mass 148 and 91 an isotope peak at mass 149.
92 2. Features of Matrix-Assisted Laser Desorption/Ionization (MALDI) Used for accurate molecular weight information about polar biopolymers ranging in a molecular mass from a few thousand to several hundred thousand dalton. In one of the practices: an aqueous/alcohol solution of the sample was mixed with a large excess of a radiation-absorbing matrix material (for example, nicotinic acid, of usable wavelengths at 266, nm The resulting solution was evaporated on the surface of a metallic probe that was used for introduction of the sample into the mass spectrometer. The solid mixture was then exposed to a pulsed laser beam, which resulted in sublimation of the analyte as ions were drawn into a time-of-flight spectrometer for mass analysis. A typical MS spectrum is shown 92
93 MALDI Spectrum from a nicotinic acid matrix irradiated with 266-nm Laser beam 93
94 94 Solid Matrix Materials for MALDI
95 MALDI Source LASER Beam 95 Solid Matrix Containing analyte
96 3. Electrospray ionization/mass spectrometry (ESI/MS) It is important for analyzing biornolecules, such as polypeptides, proteins, and oligonucleotides having molecular weights of 100,000 Da or more. This method is beginning to find applications to the characterization of inorganic species and synthetic polymers. Electrospray ionization takes place under atmospheric pressures and temperatures A solution of the sample is pumped through a stainless steel capillary needle at a rate of a few microliters per minute. The needle is maintained at several kilovolts with respect to a cylindrical electrode that surrounds the needle. The resulting charged spray of fine droplets then passes through a desolvating capillary, where evaporation of the solvent and attachment of charge to the analyte molecules take place. As the droplets become smaller as a consequence of evaporation of the solvent, their charge density becomes greater and desorption of ions into the ambient gas occurs. Little fragmentation of large and thermally fragile biomolecules occurs. Furthermore, the ions formed are multiply charged so that their m/z values are small enough to make them detectable with a quadrupole instrument with a range of 1500 or less. 96
97 Electrospray Ionization Spectrometer It is readily adapted to direct sample introduction from HPLC desolvating Charged spray of Fine droplets Solvent evaporation and attachment Of charge to molecules 97
98 98 Typical electrospray mass spectra
99 4. Fast atom bombardment (FAB) sources Used for polar high-molecular-weight species. samples in a condensed state, often in a glycerol solution matrix, are ionized by bombardment with energetic (several kev) xenon or argon atoms. Both positive and negative analyte ions are sputtered from the surface of the sample in a desorption process. Very rapid sample heating, which reduces sample fragmentation. The liquid matrix helps to reduce the lattice energy, which must be overcome to desorb an ion from a condensed phase, and provides a means of "healing" the damage induced by bombardment. 99
100 A beam of fast atoms is obtained by passing accelerated argon or xenon ions from an ion source, or gun, through a chamber containing argon or xenon atoms at a pressure of about 10-5 torn The high-velocity ions undergo a resonant electron-exchange reaction with the atoms without substantial loss of translational energy. Thus, a beam of energetic atoms is formed. The lower energy ions from the exchange are readily removed by an electrostatic deflector. Fast atom guns are now available from commercial sources. With fast atom bombardment, molecular weights over 10,000 have been determined, and detailed structural information has been obtained for compounds with molecular weights on the order of
101 101 Particle-bombardment desorption source
102 102 Mass Analyzers

103 103 Ideally, the mass analyzer should be capable of distinguishing between minute mass differences. Should allow passage of a sufficient number of ions to yield readily measurable ion currents.

104 104
105 105 Resolution of Mass Spectrometers Resolution, in MS, refers to the ability of a mass spectrometer to differentiate between masses and is quantitatively defined as R = m / Dm Dm is the mass difference between two adjacent peaks that are just resolved m is the nominal mass of the first peak (the mean mass of the two peaks is sometimes used instead). Two peaks are considered to be separated if the height of the valley between them is no more than a given fraction of their height (often 10%). A spectrometer with a resolution of 4000 would resolve peaks occurring at m/z values of and (or and 40.01). A resolution of 500 is sufficient for many applications in organic chemistry
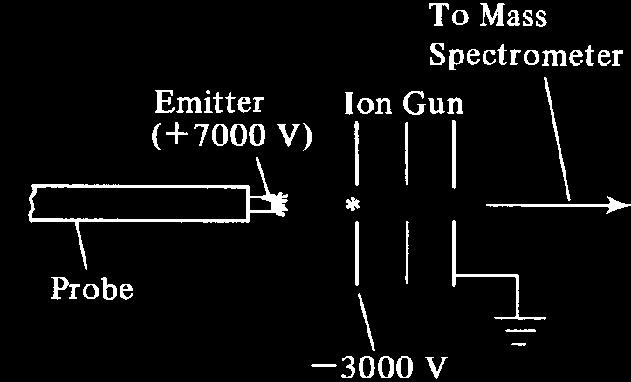
106 1. Magnetic Sector Analyzers Magnetic sector analyzers employ a permanent magnet or electromagnet to cause the beam from the ion source to travel in a circular path of 180, 90, or 60 degrees. Here, ions are formed by electron impact. The magnetic field disperses the ions in curved trajectories that depend on m/e of the ion Ions of different masses can be scanned across the exit slit by varying the field strength of the magnet or the accelerating potential between the last two slits in the ion source. Ions fall on a collector electrode resulting in an ion current 106
107 107
108 Magnetic Sector Analyzer KE zev


109 Magnetic Sector Mass Analyzer ion trajectory not in register (too light) ion trajectory in register S Ion Source N Electromagnet ion trajectory not in register (too heavy) Detector 109
110 Features of Magnetic Sector Analyzers The metal analyzer tube is maintained at 10-7 torr Ions of different masses can be scanned across the exit slit by varying: The field strength of the magnet, or accelerating potential between slits A and B Ions passing through the exit slit fall on a collector electrode resulting in an ion current that is amplified and recorded The translational or kinetic energy, KE, of an ion of mass m with a charge z upon exiting the slit of the ion source : KE = Vq = zev = 1/2 mv 2 V is the voltage between A and B, v is the velocity of the ion after acceleration, and e is the electronic charge (e = 1.60x10⁻¹⁹ C) All ions with the same number of charges z are assumed to have the same kinetic energy after acceleration regardless of their mass. Because all ions leaving the slit have approximately the same kinetic energy, the heavier ions must travel through the magnetic sector at lower velocities. The path in the sector described by ions of a given mass and charge represents a balance between two forces acting upon them. 110
111 The magnetic force F M is given by the relationship : F M = Bzev where B is the magnetic field strength The balancing centripetal force F c is given by: F c = mv 2 /r where r is the radius of curvature of the magnetic sector. In order for an ion to traverse the circular path to the collector, FM and F c must be equal, thus, Bzev = mv 2 /r, consequently v = Bzer/m Since KE = zev = 1/2mv m/z = B 2 r 2 e/2v B = gauss, r= cm, m = amu, z = number of charges Thus mass spectra can be obtained by varying one of the following parameters keeping the other 2 constants: B or V or r Most modern sector mass spectrometers contain an electromagnet in which ions are sorted by holding V and r constant while varying the current in the magnet and thus B.
112 112 Magnetic Sector Physics 2 1 zev KE curvature of radius 2 v v v F F v F Centripetal Force v F M agnetic Force v 2 1 V KE c M 2 c M 2 r V e r B z m m Bzer r m Bze r m Bze m ze

113 113
114 114 Example
115 115
116 Problems with Single Focusing Magnetic Sector It is used when the collection of ions exiting the source with the same mass-to-charge ratio but with small diverging (deviation) directional distribution. When R = <2000. Factors limiting the resolution (i.e., causing divergence): 1. Angular divergence: ions do not experience identical acceleration potentials consequently not all ions are formed at the same location in the ion source 2. Spread in the KE of the ion beam as it leaves the ion gun. Small variations of KE of particles of a given species cause broadening of the beam reaching the collector In order to measure atomic and molecular masses with a precision of a few parts per million, it is necessary to design instruments that correct for both the directional distribution and energy distribution of ions leaving the source. 116
117 Double Focusing Mass Spectrometers The term double focusing is applied to mass spectrometers in which the directional aberrations (deviation from normal) and the energy aberrations of a population of ions are simultaneously minimized. Double focusing is usually achieved by the use of carefully selected combination of electrostatic and magnetic fields. A dc potential is applied (+Ve to the outer and Ve to the inner). This will have the effect of limiting the kinetic energy a the ions reaching the magnetic sector to a closely defined charge range. Ions with energies greater than average strike the upper side of the ESA slit and are lost to ground. Ions with energies less than average strike the lower side of the ESA slit and are thus removed. It focuses only particles of the same KE to the slit. R (radius of curvature) = 2E/V (E = acceleratin Pot; V = pot. difference between the two plates) The electrostatic analyzer serves as KE analyzer Directional focusing in the magnetic sector occurs along the focal plane labeled d in the Figure; energy focusing takes place along the plane labeled e. Thus, only ions of one m/z are double focused at the intersection of d and e for any given accelerating voltage and magnetic field strength. 117
118 Double Focusing Mass Spectrometer Two smooth curved metallic plates across which a dc pot is applied Dc pot limits the KE of ions reaching the magnetic sector to closely defined range 118

119 Double Focusing Mass Spectrometer Electrostatic field: Focuses only particles Of same KE to slit Divergent beam A beam emanating from a single point, source, is brought to focus at many points 119
120 120
121 121
122 High Resolution MS Resolution as high as 150,000 with mass-measuring accuracy of 0.3 ppm can be achieved with one commercial double-focusing spectrometer, and a resolution of 20,000 to 50,000 is not uncommon. Thus, the exact weight of a compound of nominal molecular weight 600 could be measured to approximately ± mass unit using the 150,000 resolution instrument. This accuracy allows unambiguous assignment of the elemental composition (chemical formula) of the sample ion and consequently of the neutral sample. Example: C 9 H 10 O 2 = (± ) This rules out other samples of nominal mass 150 e.g.: C 5 H 10 O 5 ( ) C 7 H 6 N 2 O 2 ( ) C 9 H 14 N 2 ( ) 122
123 2. Time-of-Flight Analyzers... In time-of-flight instruments, positive ions are produced periodically by bombardment of the sample with brief pulses of electrons, secondary ions or laser generated photons. The ions produced are then accelerated by an electric field and then made to pass into a field-free drift tube about a meter long. 123
124 Time- of- Flight Analyzers, TOF Principle: Ions exiting the ionic source have essentially identical KE Because the masses of ions differ, the velocities must differ If a group of ions that have different masses simultaneously enter the mass analyzer, the heavier ions will have a velocity that is less than that of the lighter atoms Consequently the time that is required for an ion to travel a fixed distance in the analyzer through a fieldfree region varies with the mass of the ion. That is, various ions will have a time-of-flight that is mass dependent 124
125 125
126 Features of the Analyzer 126 A modified electron-impact source will be used in which an electron beam is pulsed through the ionization region for 1 sec at some pre-selected energy (typically 70 ev). Continuous ionization and acceleration would lead to a continuous output of the detector with overlapping of various masses. Thus, +ve ions will be produced periodically as a result of bombarding the sample with brief pulses of electrons. Accelerating voltage (10 3 to 10 4 V) is applied for 10-4 sec to draw ions into the flight tube (1 m length). All powers are then shut off for allowing the ion packet to move unhindered down the flight tube. The electron gun is turned on again for a new packet of ions The accelerated particles then passed into a field-free drift evacuated tube (about 1 meter) in carefully timed pulses.
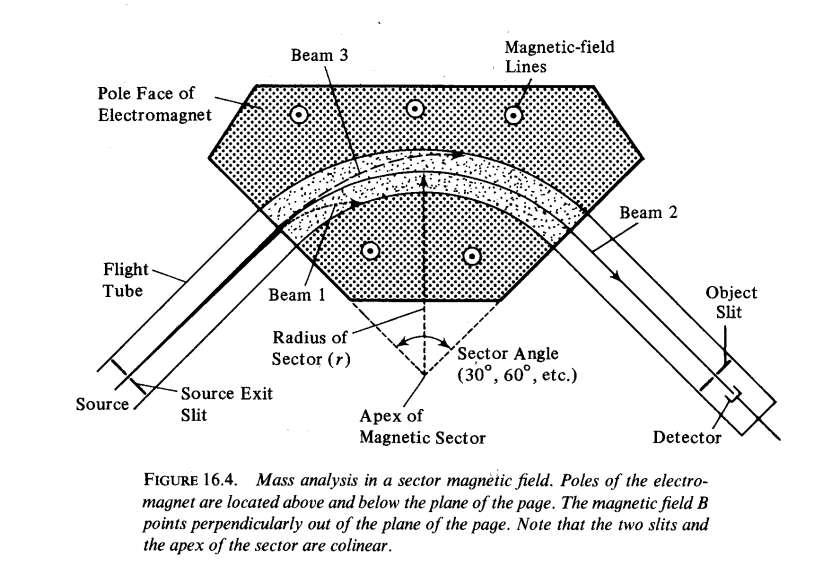
127 The tube must be evacuated to a pressure at which ions are unlikely to strike another body between the last accelerating plate and the detector Lighter ions will strike the detector before heavier ions. Hence the original beam becomes separated into wafers of ions according to their masses. The wafers of ions impact sequentially on the flat cathode of the ion detector The separation in time of different ions which strike the detector is short (less than 1 sec) thus the electronics of the analyzer must be fast Potential difference between the last grid and the slit is zero during a measurement To allow a detector and readout device to measure the intensity of a single ion before another one enters, a repelling potential is placed on the slit after an ion of interest has passed and before ions of next m/z enter. 127
128 128 Time-of-Flight MS
129 129 Time of Flight MS
130 130 Schematic diagram of a time-of-flight mass spectrometer
131 131 Schematic diagram of a time-of-flight mass spectrometer
132 132
133 Calculation of the difference in time (Dt) separating one ion from another mv 2 2 ze m= mass of the ion, E = potential drop between the accelerating electrodes z= the charge on the ion in coulombs v= velocity of the ion m 2E z v 2 133
134 v 2vE ( m ) 1 / 2 v 1 m t d v d ( m 2Ez ) / 2 k ( 1 z m ) Then, 134
135 t 1 t 2 ( d v 1 d v 2 ) 1 v D t = d ( ) 1 1 v 2 m1 Dt d ( 2Ez m2 2Ez Dt d ( m 1 m 2 ) 2Ez 135
136 Advantages and Disadvantages of Time-of-Flight Mass Analyzer Rapid scanning Useful for kinetic studies of fast reactions Useful for GC/MS applications Possible overlap of pulse masses. Insertion of an energy selector grid before the detector limits ions that are allowed to reach the detector to only selected masses 136
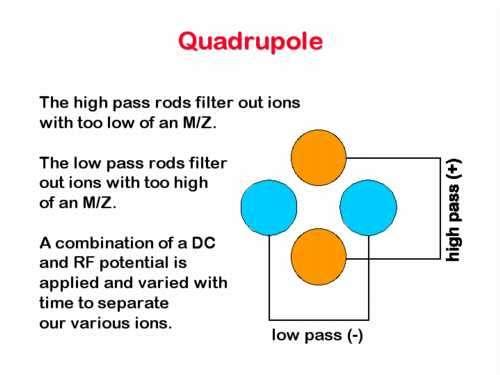
137 3. Quadrupole Mass Analyzers Features of the Quadrupole Mass Analyzers This instrument is more compact, less expensive, and more rugged than most other types of mass spectrometers. It also has the advantage of high scan rates so that an entire mass spectrum can be obtained in less than 100 ms. The heart of a quadrupole instrument is the four parallel cylindrical rods that serve as electrodes. Opposite rods are connected electrically, one pair being attached to the positive side of a variable dc source and the other pair to the negative terminal. In addition, variable radiofrequency ac potentials, which are 180-deg out of phase, are applied to each pair of rods. 137
138 In order to obtain a mass spectrum with this device, ions are accelerated into the space between the rods by a potential of 5 to 10 V Meanwhile, the ac and dc voltages on the rods are increased simultaneously while maintaining their ratio constant. At any given moment, all of the ions except those having a certain m/z value strike the rods and are converted to neutral molecules. Thus, only ions having a limited range of m/z values reach the transducer. Mass range up to m/z. Typically, quadrupole instruments easily resolve ions that differ in mass by one unit. (Mass-filter) 138
139 139 Features of the Quadrupole Mass Analyzer
140 140
141 Quadrupole Mass Spectrometer Positive Ions 141
142 142 Quadrupole MS

143 143
144 144
145 145
146 146
147 147
148 Ion Trajectories in a Quadrupole To understand the filtering capability of a quadrupole, the effect of the dc and ac potentials on the trajectory of ions as they pass through the channel between the rods should be known 148
149 Quadrupole in xz Plane Positive Ions Under AC influence, ions will converge to center of channel during positive cycle, diverge during negative cycle. Momentum depends on square root of mass, so heavier ions will not respond as strongly. 149
150 In the absence of a dc potential, ions in the channel will tend to converge in the center of the channel during the positive half of the ac cycle and will tend to diverge during the negative half. If during the negative half cycle an ion strikes the rod, the positive charge will be neutralized, and the resulting molecule will be carried away. Whether or not a positive ion strikes the rod will depend upon the rate of movement of the ion along the z axis, its mass-to- charge ratio, and the frequency and magnitude of the ac signal. The accelerated ionic beam from the ionic source passes through a collimating hole that is aligned with the space between the four rods Diagonally opposite rods are electrically connected A dc potential difference superimposed by radio frequency ac potential are simultaneously applied between the two groups of rods. The dc electric fields tend to focus the positive ions in the positive plane and defocus them in the negative plane Positive ions that enter the space between the rods are repelled by the rods that are momentarily positively charged and attracted to the rods that are negatively charged Because the relative charge on the sets of rods is continuously changing, the ions flow an irregular oscillating path between the rods 150
151 Only those ions that can pass through strike the exit hole and reach to the detector. Other ions that strike one of the rods are not detected. It would be more difficult to deflect a heavier ion than to deflect a lighter one. If an ion in the channel is heavy and/or the frequency of the ac potential is large, the ion will not respond significantly to the alternating potential and will be influenced largely by the dc potential. Under these circumstances, the ion will tend to remain in the space between the rods. In contrast, if the ion is light and/or the frequency is low, the ion may collide with the rod and be eliminated dur ing the negative excursion of the ac potential. Now let us turn to the pair of rods that are maintained at a negative dc potential. In the absence of the ac potential, all positive ions will tend to be drawn to the rods, where they are annihilated. For the lighter ions, however, this movement may be offset by the excursion of the ac potential. In order for an ion to travel through the quadrupole to the detector, it must have a stable trajectory in both the xz and yz planes. Thus, the ion must be sufficiently heavy so that it will not be eliminated by the high mass filter in the xz plane and must be sufficiently light so that it will not be removed by the low-mass filter in the yz plane. The total quadrupole transmits a band of ions that have a limited range of m/z values. 151
152 Quadrupole in xz and yz Planes Quadrupole acts as double-filter. Ion must be big enough not to be filtered in AC field, small enough not to be filtered in DC field. High-Pass Filter Low-Pass Filter Combined Filter 152
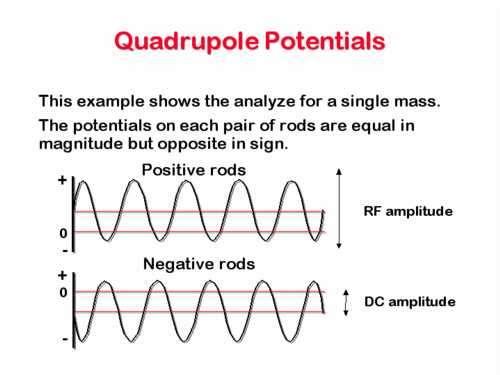
153 153 Voltages for Scanning a Quadrupole MS
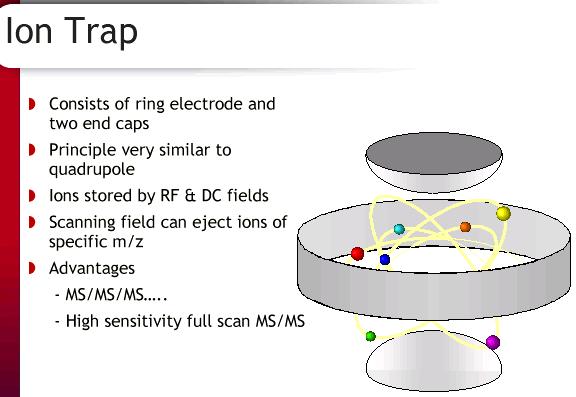
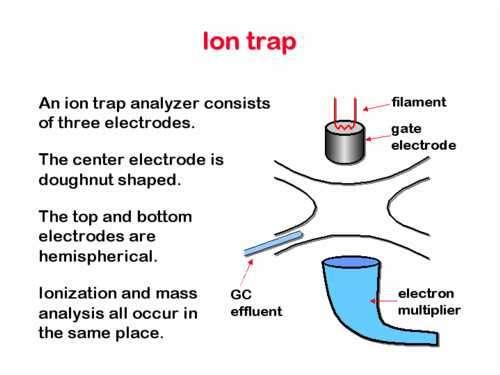
154 Ion Trap Analyzer Variable radio frequency voltage applied to the ring electrode ions of appropriate m/z circulate in stable orbit scan rf, heavier particles stable, lighter particles collide with ring electrode ejected ions detected by transducer as an ion current 154
155 155 Ion Trap Mass Spectrometer
156 156
157 Ion Traps Mass Separation in time High sensitivity Full Scan Lower sensitivity SRM Offer mutiple stages of MS n Offers higher resolution Quadrupoles Mass Separation in space Lower sensitivity Full Scan High sensitivity SIM and SRM No mutiple stages of MS Lower resolution Parent and neutral loss scans 157

158 158
159 159
160 160

161 161

162 162
163 MS Transducers Electron Multiplier Most frequently used, similar to photomultiplier. Series of Cu/Be coated dynodes, each at successively higher voltage. Faraday Cup Ions strike collector electrode (surrounded by cage to prevent escape of reflected ions). Collector and cage connected to ground potential by a large resistor. Potential drop across resistor amplified by high-impedance amplifier. Photographic plates 163
164 Detectors Electron Multipliers: A discrete-dynode electron multiplier is designed for detection of positive ions. Each dynode is held at successively higher voltage and there is a burst of electrons that is emitted when struck by energetic electrons or ions. A continuous-dynode electrons electron multiplier is a trumpet-shaped device made of glass that is heavily doped with lead. 164
165 165 Electron Multiplier Detectors
166 Detectors The Faraday Cup detector: This detector functions as follows. When positive ions strike the surface of the cathode, electrons move flow from the ground through the resistor to neutralize the charge. The resulting potential drop across the resistor is amplified via a high-impedance amplifier. 166
167 167 Faraday Cup Detector

168 168
169 169
170 170 ICPMS
171 171 Mass Spectrum from ICPMS
172 172 Applications of MS
173 Identification of Pure Compounds Molecular weight of the compound and its molecular formula. Fragmentation patterns provide information about the functional groups. Finally, the actual identity of a compound can often be established by comparing its mass spectrum with those of known compounds until a close match is realized. 173
174 Molecular Weights from Mass Spectra This requires identification of the molecular ion peak, or (M + 1) or the (M -1) peak. The location of the peak on the abscissa then gives the molecular weight with an accuracy that cannot be realized easily by any other method. Molecular weight requires the knowledge of the identity of the molecular ion peak. Caution is advisable, with electron-impact sources. Other sources can be used 174
175 Molecular Formulas from Exact Molecular Weights the molecular ion peak should be identified and its exact mass determined. High-resolution instrument capable of detecting mass differences of a few thousandths of a mass units required. Example: m/z of the molecular ions of the following compounds: purine, C 5 H 4 N 4 (in = ); benzamidine, C 7 H 8 N 2 (m = ); ethyltoluene, C 9 H 12 (m = ); and acetophenone, C 8 H 8 O (m = ). If the measured mass of the molecular ion peak is (±0.005). then all but C 7 H 8 N 2 are excluded as possible formulas. Very high-resolution double-focusing instruments are needed. Tables that list all reasonable combinations of C, H, N, and 0 by molecular weight to the third or fourth decimal place have been compiled. 175
176 Molecular Formulas from Isotopic Ratios The data from a low-resolution instrument that can only discriminate between ions differing in mass by whole mass numbers can yield information about the formula of a compound, It requires that the molecular ion peak is sufficiently intense that its height and the heights of the (M + I ) and (M + 2) isotope peaks can be determined accurately. 176
177 177 Identification of Pure Compounds Interpretation of Mass Spectra
178 Interpretation of Mass Spectra A specific molecule would give a unique fragmentation pattern that would distinguish it from all other substances. This expectation is often realized, but not always. Interpretation requires considerable skill and experience. Select a candidate peak for the molecular ion (M + ) Examine spectrum for peak clusters of characteristic isotopic patterns Test (M + ) peak candidate by searching for other peaks correspond to reasonable losses Look for characteristic low-mass fragment ions Compare spectrum to reference spectra 178
179 Assignment of the Molecular Ion Molecular ion has a mass that corresponds to the molecular mass of the neutral molecule. Because one electron has been removed, it is a radical cation, symbolized by M.+ or often just M +. Most substances produce a recognizable molecular ion, although there are important exceptions. High-molecular-weight hydrocarbons, aliphatic alcohols, ethers, and amines produce only a small number of molecular ions because of extensive fragmentation. Polyfunctional compounds such as carbohydrates and polyamines often do not yield a molecular ion upon electron impact. Molecules possessing an aromatic ring often give abundant molecular ions, presumably because of their ability to delocalize positive charge. 179
180 Identification of the molecular ion M + should have the highest mass, ignoring isotopic contributions. The molecular mass will be an even mass number if it contains an even number (0, 2, 4,... ) of nitrogen atoms, and will be an odd mass number otherwise; this is known as the "nitrogen rule." Some examples are: benzene, C 6 H 6, M + = 78; ethanol, C 2 H 5 OH, M + = 46; cholesterol, C 27 H 46 O, M + = 386; dimethyl hydrazine, CH 3 NHNHCH 3, M + = 60; methylamine, CH 3 NH 2, M + = 31; and pyridine, C 5 H 5 N, M + = 79. No illogical losses should be found. Seldom do organic molecules lose more than four hydrogen atoms, to give (M - 4) fragments. The next reasonable fragmentations of molecular ions are losses of a methyl group (M - 15), NH 2 or O (M-16),OH or NH 3 (M-17),H 2 O(M-18), F (M-19), HF(M-20),and C 2 H 2 (M - 26). Thus, if a tentative molecular ion has lost 4 to 14 or 21 to 25 mass units, either the assignment of M + is incorrect or the spectrum is of a mixture. 180

181 181
182 Elemental Composition of the Molecular Ion In the spectrum of methane (CH 4 ), a small peak located at m/z = 17 has an intensity 1.1 % that of the M + peak at m/z = 16. The signal at m/z = 17 arises because carbon consists of two naturally occurring stable isotopes: 12 C and 13 C. Assigning the value 100 to the quantity of 12 C (an incorrect, but useful, procedure), we find that 13 C is 1.1 %. Thus, m/z = 17 in methane is 13 CH 4+. A molecule that contains six carbon atoms, such as benzene (C 6 H 6 ), will have M + at m/z = 78 and 13 CC 5 H 6 at m/z = 79, but then the intensity at 79 is 6.6% (1.1 % x 6), because the probability of finding one 13 C is six times greater. 182
183 Use of the natural abundance of 13 C to assign the number of carbon atoms in M + For example, if M + is 100 and (M + 1) + is 7.7%, M + contains 7 carbons. Often, M + is not the largest peak in a mass spectrum and therefore is not assigned an intensity of 100 (the largest peak in a spectrum is usually arbitrarily assigned an intensity of 100 and all other peaks are measured relative to this). In this case, a useful formula is Number of Carbon Atoms = M 1 ( )/0.011 M where M + 1 and M are the intensities of the respective peaks. This procedure is valid for M + contains 10 carbon atoms. 183
184 A relative error of 10% in the measurement of M + 1 or impurities in the spectrum make the number of carbon atoms at best a maximum rather than exact number. If M + = 100 and M + 1 = 17.8, the maximum number of carbon atoms, is 16 (1.1% x 16 = 17.60); although the molecule may contain 15 carbon atoms, it cannot contain
185 Elemental Composition of M + ion from Isotopic Ratio The isotopic ratio is useful for the detection and estimation of the number of sulfur, chlorine, and bromine atoms in a molecule due to their large contribution to (M+2) + For example, an (M + 2) + that is about 65% of the M+ peak is strong evidence for a molecule containing two chlorine atoms; (M + 2) + peak of 4%, suggests the presence of one atom of sulfur (S32 and S34). 185
186 Most abundant isotope atoms 186
187 187 Example Problem
188 188
189 Isotopic Abundances 189
190 Determination of Molecular Formula distinguish between compounds of same MW: C 5 H 10 O 4 or C 10 H 14 C 5 H 10 O 4 13 C 5 * 1.08% = 5.40% 2 H 10 * 0.016% = 0.16% 17 O 4 * 0.04% = 0.16% peak/ 134 peak 5.72% 190
191 C 10 H C 10 * 1.08% = 10.8% 2 H 14 * 0.016% =0.22% peak/ 134 peak 11.0% 191
192 Nitrogen Rule organic compounds with even MW, O or even (could be zero) number of N atoms odd MW, odd number of nitrogen atoms 192
193 Computerized Mass Spectrometers... Minicomputers and microprocessors are integral part of modern mass spectrometers. The figure below is a block diagram of the computerized control and data acquisition system of a triple quadrupole mass spectrometer. 193
194 194
195 TANDEM MASS SPECTROSCOPY: This type of spectroscopy simply involves the coupling of one mass spectrometer to another and this hyphenated technique has resulted in dramatic progress in the analysis of complex mixtures. SECONDARY ION MASS SPECTROSCOPY: This is one of the most highly developed of the mass spectrometric surface methods, with several manufacturers offering instruments for this technique. It involves the bombarding of a surface with a beam of ions formed in an ion gun. The ions generated from the surface layer are then drawn into a spectrometer for mass analysis. 195

196 196 MS/MS instrument Schematic of a tandem quadrupolems/ms instrument.
Chemistry Instrumental Analysis Lecture 34. Chem 4631
 Chemistry 4631 Instrumental Analysis Lecture 34 From molecular to elemental analysis there are three major techniques used for elemental analysis: Optical spectrometry Mass spectrometry X-ray spectrometry
Instrumental Analysis. Mass Spectrometry. Lecturer:! Somsak Sirichai
 303351 Instrumental Analysis Mass Spectrometry Lecturer:! Somsak Sirichai Mass Spectrometry What is Mass spectrometry (MS)? An analytic method that employs ionization and mass analysis of compounds in
Harris: Quantitative Chemical Analysis, Eight Edition
 Harris: Quantitative Chemical Analysis, Eight Edition CHAPTER 21: MASS SPECTROMETRY CHAPTER 21: Opener 21.0 Mass Spectrometry Mass Spectrometry provides information about 1) The elemental composition of
History of Mass spectroscopy. Mass Spectroscopy. Introduction... Uses of Mass Spec. Where are Mass Spectrometers Used? Mass Spectroscopy Units
 History of Mass spectroscopy Mass Spectroscopy CHEM 466 Upali Siriwardane Marilyn Cox Jim Plamer http://www.chemistry.ohiostate.edu/~allen/587%20w04/587%20w0 4%20130-136%20std.pdf http://www.cem.msu.edu/~cem333/week1
Lecture 8: Mass Spectrometry
 intensity Lecture 8: Mass Spectrometry Relative abundance m/z 1 Ethylbenzene CH 2 CH 3 + m/z = 106 CH 2 + m/z = 91 C 8 H 10 MW = 106 CH + m/z = 77 + 2 2 What information can be obtained from a MS spectrum?
MS Goals and Applications. MS Goals and Applications
 MS Goals and Applications 3 Several variations on a theme, three common steps Form gas-phase ions choice of ionization method depends on sample identity and information required Separate ions on basis
Lecture 8: Mass Spectrometry
 intensity Lecture 8: Mass Spectrometry Relative abundance m/z 1 Ethylbenzene experiment CH 2 CH 3 + m/z = 106 CH 2 + m/z = 91 C 8 H 10 MW = 106 CH + m/z = 77 + 2 2 What information can we get from MS spectrum?
Molecular Mass Spectrometry
 Molecular Mass Spectrometry Mass Spectrometry: capable of providing information about (1) Elemental composition of samples of matter: atomic mass (2) Structures of inorganic, organic, and biological molecules
Molecular Mass Spectrometry
 Molecular Mass Spectrometry Mass Spectrometry: capable of providing information about (1) Elemental composition of samples of matter: atomic mass (2) Structures of inorganic, organic, and biological molecules
Mass Spectrometry. General Principles
 General Principles Mass Spectrometer: Converts molecules to ions Separates ions (usually positively charged) on the basis of their mass/charge (m/z) ratio Quantifies how many units of each ion are formed
Fundamentals of Mass Spectrometry. Fundamentals of Mass Spectrometry. Learning Objective. Proteomics
 Mass spectrometry (MS) is the technique for protein identification and analysis by production of charged molecular species in vacuum, and their separation by magnetic and electric fields based on mass
MS Goals and Applications. MS Goals and Applications
 MS Goals and Applications 1 Several variations on a theme, three common steps Form gas-phase ions choice of ionization method depends on sample identity and information required Separate ions on basis
Chemistry 311: Topic 3 - Mass Spectrometry
 Mass Spectroscopy: A technique used to measure the mass-to-charge ratio of molecules and atoms. Often characteristic ions produced by an induced unimolecular dissociation of a molecule are measured. These
Chemistry Instrumental Analysis Lecture 35. Chem 4631
 Chemistry 4631 Instrumental Analysis Lecture 35 Principle components: Inlet Ion source Mass analyzer Ion transducer Pumps Signal processor Mass analyzers Quadrupole Time of Flight Double Focusing Ion
Mass Spectrometry in MCAL
 Mass Spectrometry in MCAL Two systems: GC-MS, LC-MS GC seperates small, volatile, non-polar material MS is detection devise (Agilent 320-MS TQ Mass Spectrometer) Full scan monitoring SIM single ion monitoring
20.2 Ion Sources. ions electrospray uses evaporation of a charged liquid stream to transfer high molecular mass compounds into the gas phase as MH n
 20.2 Ion Sources electron ionization produces an M + ion and extensive fragmentation chemical ionization produces an M +, MH +, M +, or M - ion with minimal fragmentation MALDI uses laser ablation to transfer
Mass Spectrometry. What is Mass Spectrometry?
 Mass Spectrometry What is Mass Spectrometry? Mass Spectrometry (MS): The generation of gaseous ions from a sample, separation of these ions by mass-to-charge ratio, and measurement of relative abundance
Ionization Techniques Part IV
 Ionization Techniques Part IV CU- Boulder CHEM 5181 Mass Spectrometry & Chromatography Presented by Prof. Jose L. Jimenez High Vacuum MS Interpretation Lectures Sample Inlet Ion Source Mass Analyzer Detector
Lecture 15: Introduction to mass spectrometry-i
 Lecture 15: Introduction to mass spectrometry-i Mass spectrometry (MS) is an analytical technique that measures the mass/charge ratio of charged particles in vacuum. Mass spectrometry can determine masse/charge
TANDEM MASS SPECTROSCOPY
 TANDEM MASS SPECTROSCOPY 1 MASS SPECTROMETER TYPES OF MASS SPECTROMETER PRINCIPLE TANDEM MASS SPECTROMETER INSTRUMENTATION QUADRAPOLE MASS ANALYZER TRIPLE QUADRAPOLE MASS ANALYZER TIME OF FLIGHT MASS ANALYSER
ICPMS Doherty Lecture 1
 ICPMS Doherty Lecture 1 Mass Spectrometry This material provides some background on how to measure isotope abundances by means of mass spectrometry. Mass spectrometers create and separate ionized atoms
M M e M M H M M H. Ion Sources
 Ion Sources Overview of Various Ion Sources After introducing samples into a mass spectrometer, the next important step is the conversion of neutral molecules or compounds to gas phase ions. The ions could
CEE 772 Lecture #27 12/10/2014. CEE 772: Instrumental Methods in Environmental Analysis
 Updated: 10 December 2014 Print version CEE 772: Instrumental Methods in Environmental Analysis Lecture #21 Mass Spectrometry: Mass Filters & Spectrometers (Skoog, Chapt. 20, pp.511 524) (Harris, Chapt.
CEE 772: Instrumental Methods in Environmental Analysis
 Updated: 10 December 2014 Print version CEE 772: Instrumental Methods in Environmental Analysis Lecture #21 Mass Spectrometry: Mass Filters & Spectrometers (Skoog, Chapt. 20, pp.511-524) (Harris, Chapt.
Mass Spectroscopy. Base peak. Molecular Ion peak. The positively charged fragments produced are separated, based on their mass/charge (m/z) ratio. M+.
 ratio. M+.") Mass spectrometry is the study of systems causing the formation of gaseous ions, with or without fragmentation, which are then characteried by their mass to charge ratios (m/) and relative abundances.
Mass spectrometry is the study of systems causing the formation of gaseous ions, with or without fragmentation, which are then characteried by their mass to charge ratios (m/) and relative abundances.
Mass Analyzers. Principles of the three most common types magnetic sector, quadrupole and time of flight - will be discussed herein.
 Mass Analyzers After the production of ions in ion sources, the next critical step in mass spectrometry is to separate these gas phase ions according to their mass-to-charge ratio (m/z). Ions are extracted
RECOMMENDATIONS FOR NOMENCLATURE OF MASS SPECTROMETRY
 international UNION OF PURE AND APPLIED CHEMISTRY ANALYTICAL CHEMISTRY DIVISION COMMISSION ON ANALYTICAL NOMENCLATURE RECOMMENDATIONS FOR NOMENCLATURE OF MASS SPECTROMETRY RULES APPROVED 1973 LONDON BUTTER
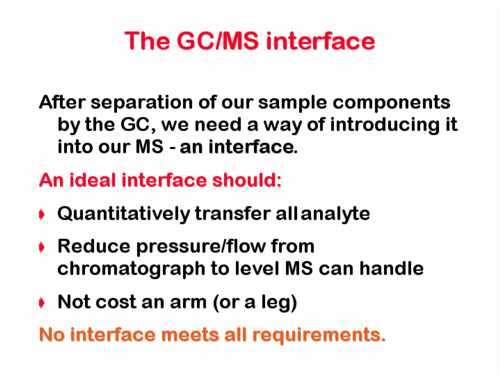
Introduction to GC/MS
 Why Mass Spectrometry? Introduction to GC/MS A powerful analytical technique used to: 1.Identify unknown compounds 2. Quantify known materials down to trace levels 3. Elucidate the structure of molecules
Mass Spectrometry. Electron Ionization and Chemical Ionization
 Mass Spectrometry Electron Ionization and Chemical Ionization Mass Spectrometer All Instruments Have: 1. Sample Inlet 2. Ion Source 3. Mass Analyzer 4. Detector 5. Data System http://www.asms.org Ionization
MS/MS .LQGVRI0606([SHULPHQWV
 0DVV6SHFWURPHWHUV Tandem Mass Spectrometry (MS/MS) :KDWLV0606" Mass spectrometers are commonly combined with separation devices such as gas chromatographs (GC) and liquid chromatographs (LC). The GC or
Welcome to Organic Chemistry II
 Welcome to Organic Chemistry II Erika Bryant, Ph.D. erika.bryant@hccs.edu Class Syllabus 3 CHAPTER 12: STRUCTURE DETERMINATION 4 What is this solution Soda Tea Coffee??? 5 What is this solution Soda Tea
Mass spectrometry and elemental analysis
 Mass spectrometry and elemental analysis A schematic representation of a single-focusing mass spectrometer with an electron-impact (EI) ionization source. M: + e _ M +. + 2e _ Ionization and fragmentation
Mass Spectrometry: Introduction
 Mass Spectrometry: Introduction Chem 8361/4361: Interpretation of Organic Spectra 2009 Andrew Harned & Regents of the University of Minnesota Varying More Mass Spectrometry NOT part of electromagnetic
Chemistry Instrumental Analysis Lecture 37. Chem 4631
 Chemistry 4631 Instrumental Analysis Lecture 37 Most analytes separated by HPLC are thermally stable and non-volatile (liquids) (unlike in GC) so not ionized easily by EI or CI techniques. MS must be at
2. Separate the ions based on their mass to charge (m/e) ratio. 3. Measure the relative abundance of the ions that are produced
 ratio. 3. Measure the relative abundance of the ions that are produced") I. Mass spectrometry: capable of providing both quantitative and qualitative information about samples as small as 100 pg (!) and with molar masses in the 10 4-10 5 kdalton range A. The mass spectrometer
I. Mass spectrometry: capable of providing both quantitative and qualitative information about samples as small as 100 pg (!) and with molar masses in the 10 4-10 5 kdalton range A. The mass spectrometer
Mass Spectrometry. Introduction EI-MS and CI-MS Molecular mass & formulas Principles of fragmentation Fragmentation patterns Isotopic effects
 Mass Spectrometry Introduction EI-MS and CI-MS Molecular mass & formulas Principles of fragmentation Fragmentation patterns Isotopic effects 1 Introduction to MS Mass spectrometry is the method of analysis
Mass spectrometry.
 Mass spectrometry Mass spectrometry provides qualitative and quantitative information about the atomic and molecular composition of inorganic and organic materials. The mass spectrometer produces charged
12. Structure Determination: Mass Spectrometry and Infrared Spectroscopy
 12. Structure Determination: Mass Spectrometry and Infrared Spectroscopy Determining the Structure of an Organic Compound The analysis of the outcome of a reaction requires that we know the full structure
1) In what pressure range are mass spectrometers normally operated?
 In what pressure range are mass spectrometers normally operated?") Exercises Ionization 1) In what pressure range are mass spectrometers normally operated? Mass spectrometers are usually operated in the high vacuum regime to ensure mean free paths significantly longer
Exercises Ionization 1) In what pressure range are mass spectrometers normally operated? Mass spectrometers are usually operated in the high vacuum regime to ensure mean free paths significantly longer
sample was a solution that was evaporated in the spectrometer (such as with ESI-MS) ions such as H +, Na +, K +, or NH 4
 ions such as H +, Na +, K +, or NH 4") Introduction to Spectroscopy V: Mass Spectrometry Basic Theory: Unlike other forms of spectroscopy used in structure elucidation of organic molecules mass spectrometry does not involve absorption/emission
Introduction to Spectroscopy V: Mass Spectrometry Basic Theory: Unlike other forms of spectroscopy used in structure elucidation of organic molecules mass spectrometry does not involve absorption/emission
Mass Spectrometry. A truly interdisciplinary and versatile analytical method
 Mass Spectrometry A truly interdisciplinary and versatile analytical method MS is used for the characterization of molecules ranging from small inorganic and organic molecules to polymers and proteins.
This is the total charge on an ion divided by the elementary charge (e).
.") 12.2 Fundamentals and general terms Accelerator mass spectrometry An ultra-sensitive technique using tandem accelerators employed mainly for the study of long-lived radioisotopes, and stable isotopes at
12.2 Fundamentals and general terms Accelerator mass spectrometry An ultra-sensitive technique using tandem accelerators employed mainly for the study of long-lived radioisotopes, and stable isotopes at
(Refer Slide Time 00:09) (Refer Slide Time 00:13)
 (Refer Slide Time 00:13)") (Refer Slide Time 00:09) Mass Spectrometry Based Proteomics Professor Sanjeeva Srivastava Department of Biosciences and Bioengineering Indian Institute of Technology, Bombay Mod 02 Lecture Number 09 (Refer
(Refer Slide Time 00:09) Mass Spectrometry Based Proteomics Professor Sanjeeva Srivastava Department of Biosciences and Bioengineering Indian Institute of Technology, Bombay Mod 02 Lecture Number 09 (Refer
Secondary Ion Mass Spectroscopy (SIMS)
") Secondary Ion Mass Spectroscopy (SIMS) Analyzing Inorganic Solids * = under special conditions ** = semiconductors only + = limited number of elements or groups Analyzing Organic Solids * = under special
Secondary Ion Mass Spectroscopy (SIMS) Analyzing Inorganic Solids * = under special conditions ** = semiconductors only + = limited number of elements or groups Analyzing Organic Solids * = under special
LC-MS Based Metabolomics
 LC-MS Based Metabolomics Analysing the METABOLOME 1. Metabolite Extraction 2. Metabolite detection (with or without separation) 3. Data analysis Metabolite Detection GC-MS: Naturally volatile or made volatile
Introduction to the Q Trap LC/MS/MS System
 www.ietltd.com Proudly serving laboratories worldwide since 1979 CALL +1.847.913.0777 for Refurbished & Certified Lab Equipment ABI Q Trap LC/MS/MS Introduction to the Q Trap LC/MS/MS System The Q Trap
Introduction to Elemental Analysis
 Introduction to Elemental Analysis A dust storm charges across the Sahara desert, whipping up sand and blowing it west, towards the ocean. Meanwhile, in the middle of the Atlantic Ocean, a team of scientist
MASS ANALYSER. Mass analysers - separate the ions according to their mass-to-charge ratio. sample. Vacuum pumps
 ION ANALYZERS MASS ANALYSER sample Vacuum pumps Mass analysers - separate the ions according to their mass-to-charge ratio MASS ANALYSER Separate the ions according to their mass-to-charge ratio in space
1. The range of frequencies that a measurement is sensitive to is called the frequency
 CHEM 3 Name Exam 1 Fall 014 Complete these problems on separate paper and staple it to this sheet when you are finished. Please initial each sheet as well. Clearly mark your answers. YOU MUST SHOW YOUR
Analytical Technologies in Biotechnology Prof. Dr. Ashwani K. Sharma Department of Biotechnology Indian Institute of Technology, Roorkee
 Analytical Technologies in Biotechnology Prof. Dr. Ashwani K. Sharma Department of Biotechnology Indian Institute of Technology, Roorkee Module - 6 Spectroscopic Techniques Lecture - 6 Atomic Spectroscopy
Mass Spectrometry for Chemists and Biochemists
 Erasmus Intensive Program SYNAPS Univ. of Crete - Summer 2007 Mass Spectrometry for Chemists and Biochemists Spiros A. Pergantis Assistant Professor of Analytical Chemistry Department of Chemistry University
CHROMATOGRAPHY AND MASS SPECTROMETER
 22 CHROMATOGRAPHY AND MASS SPECTROMETER 22.1 INTRODUCTION We know that the biochemistry or biological chemistry deals with the study of molecules present in organisms. These molecules are called as biomolecules
Analysis of Polar Metabolites using Mass Spectrometry
 Analysis of Polar Metabolites using Mass Spectrometry TransMed Course: Basics in Clinical Proteomics and Metabolomics. Oct 10-19, 2012 dd.mm.yyyy Vidya Velagapudi, Ph.D, Adjunct Professor Head of the Metabolomics
CHAPTER A2 LASER DESORPTION IONIZATION AND MALDI
 Back to Basics Section A: Ionization Processes CHAPTER A2 LASER DESORPTION IONIZATION AND MALDI TABLE OF CONTENTS Quick Guide...27 Summary...29 The Ionization Process...31 Other Considerations on Laser
Propose a structure for an alcohol, C4H10O, that has the following
 Propose a structure for an alcohol, C4H10O, that has the following 13CNMR spectral data: Broadband _ decoupled 13CNMR: 19.0, 31.7, 69.5 б DEPT _90: 31.7 б DEPT _ 135: positive peak at 19.0 & 31.7 б, negative
Mass Spectrometry and Proteomics - Lecture 2 - Matthias Trost Newcastle University
 Mass Spectrometry and Proteomics - Lecture 2 - Matthias Trost Newcastle University matthias.trost@ncl.ac.uk Previously: Resolution and other basics MALDI Electrospray 40 Lecture 2 Mass analysers Detectors
Auxiliary Techniques Soft ionization methods
 Auxiliary Techniques The limitations of the structural information in the normal mass spectrum can be partly offset by special mass-spectral techniques. Although a complete description of these is beyond
GRADUATE COURSE IN MASS SPECTROMETRY: LECTURE 2
 DEPARTMENTS OF CHEMISTRY AND BIOCHEMISTRY GRADUATE COURSE IN MASS SPECTROMETRY: LECTURE 2 Mass Analysers Shabaz Mohammed October 20, 2015 High Vacuum System Turbo pumps Diffusion pumps Rough pumps Rotary
Chemistry 311: Instrumentation Analysis Topic 2: Atomic Spectroscopy. Chemistry 311: Instrumentation Analysis Topic 2: Atomic Spectroscopy
 Topic 2b: X-ray Fluorescence Spectrometry Text: Chapter 12 Rouessac (1 week) 4.0 X-ray Fluorescence Download, read and understand EPA method 6010C ICP-OES Winter 2009 Page 1 Atomic X-ray Spectrometry Fundamental
Selecting an LC/MS Interface Becky Wittrig, Ph.D.
 Selecting an LC/MS Interface Becky Wittrig, Ph.D. RESTEK CORPORATION LC/MS Interfaces I. Background of LC/MS I. Historical Perspective II. Reasons for use II. Interfaces I. Transport devices II. Particle
Quadrupole Mass Spectrometry Concepts. Mass spectrometers for residual gas analysis: Intermediate Level Users Guide
 Quadrupole Mass Spectrometry Concepts Mass spectrometers for residual gas analysis: Intermediate Level Users Guide What does Residual Gas Analysis allow us to do? RGA is the examination of the molecular
Skoog/Holler/Crouch Chapter 19 Principles of Instrumental Analysis, 6th ed. CHAPTER 19
 Skoog/Holler/Crouch Chapter 19 Principles of Instrumental Analysis, 6th ed. Instructor s Manual CHAPTER 19 19-1. In a continuous wave NMR experiment, the intensity of the absorption signal is monitored
Mass Spectrometry - Background
 Mass Spectrometry - Background In mass spectrometry, a substance is bombarded with an electron beam having sufficient energy to fragment the molecule. The positive fragments which are produced (cations
Courtesy of ESS and TheRGA web pages part of a series of application and theory notes for public use which are provided free of charge by ESS.
 ESS The RGA freenotes Theory page 1 of 14 RGA Theory Notes Courtesy of ESS and TheRGA web pages part of a series of application and theory notes for public use which are provided free of charge by ESS.
Practical 1P4 Energy Levels and Band Gaps
 Practical 1P4 Energy Levels and Band Gaps What you should learn from this practical Science This practical illustrates some of the points from the lecture course on Elementary Quantum Mechanics and Bonding
IDENTIFICATION OF ORGANOMETALLIC COMPOUNDS USING FIELD DESORPTION IONIZATION ON THE GCT
 IDETIFICATIO OF ORGAOMETALLIC COMPOUDS USIG FIELD DESORPTIO IOIZATIO O THE GCT David Douce 1, Michael Jackson 1, Robert Lewis 1, Peter Hancock 1, Martin Green 1 and Stuart Warriner 2 1 Waters Corporation,
EXPERIMENT 2-6. e/m OF THE ELECTRON GENERAL DISCUSSION
 Columbia Physics: Lab -6 (ver. 10) 1 EXPERMENT -6 e/m OF THE ELECTRON GENERAL DSCUSSON The "discovery" of the electron by J. J. Thomson in 1897 refers to the experiment in which it was shown that "cathode
CEE 772: Instrumental Methods in Environmental Analysis
 Updated: 10 December 2014 Print version CEE 772: Instrumental Methods in Environmental Analysis Lecture #22 Mass Spectrometry: Chemical Ionization (Skoog,) (Harris, Chapt.) Mercer/Goodwill CEE 772 #22
Mass Spectrometry Course
 Mass Spectrometry Course Árpád Somogyi Mass Spectrometry Laboratory, Department of Chemistry and Biochemistry University of Arizona, Tucson, AZ Eötvös University, Budapest April 11-20, 2012 1 2 UA Chemistry
Quattro Micro - How does it work?
 Quattro Micro - How does it work? 1 Introduction This document is designed to familiarise you with the principles behind how the Quattro Micro works. The level of this document is designed as Level One
MASS SPECTROMETRY. Topics
 MASS SPECTROMETRY MALDI-TOF AND ESI-MS Topics Principle of Mass Spectrometry MALDI-TOF Determination of Mw of Proteins Structural Information by MS: Primary Sequence of a Protein 1 A. Principles Ionization:
Practical 1P4 Energy Levels and Band Gaps
 Practical 1P4 Energy Levels and Band Gaps What you should learn from this practical Science This practical illustrates some of the points from the lecture course on Elementary Quantum Mechanics and Bonding
Because light behaves like a wave, we can describe it in one of two ways by its wavelength or by its frequency.
 Light We can use different terms to describe light: Color Wavelength Frequency Light is composed of electromagnetic waves that travel through some medium. The properties of the medium determine how light
FAIMS Technology at a Glance
 FAIMS Technology at a Glance Field asymmetric ion mobility spectrometry (FAIMS), also known as differential mobility spectrometry (DMS), is a gas detection technology that separates and identifies chemical
An ion source performs the following two functions:
 Ionization The Ion Source An ion source performs the following two functions: 1) converts sample atoms or molecules to ionized particles (ions) in the gas phase (sometimes the task of introducing the atoms
Mass Analyzers. mass measurement accuracy/reproducibility. % of ions allowed through the analyzer. Highest m/z that can be analyzed
 Mass Analyzers Double Focusing Magnetic Sector Quadrupole Mass Filter Quadrupole Ion Trap Linear Time-of-Flight (TOF) Reflectron TOF Fourier Transform Ion Cyclotron Resonance (FT-ICR-MS) Mass Analyzers
( 1+ A) 2 cos2 θ Incident Ion Techniques for Surface Composition Analysis Ion Scattering Spectroscopy (ISS)
 2 cos2 θ Incident Ion Techniques for Surface Composition Analysis Ion Scattering Spectroscopy (ISS)") 5.16 Incident Ion Techniques for Surface Composition Analysis 5.16.1 Ion Scattering Spectroscopy (ISS) At moderate kinetic energies (few hundred ev to few kev) ion scattered from a surface in simple kinematic
5.16 Incident Ion Techniques for Surface Composition Analysis 5.16.1 Ion Scattering Spectroscopy (ISS) At moderate kinetic energies (few hundred ev to few kev) ion scattered from a surface in simple kinematic
Harris: Quantitative Chemical Analysis, Eight Edition CHAPTER 23: GAS CHROMATOGRAPHY
 Harris: Quantitative Chemical Analysis, Eight Edition CHAPTER 23: GAS CHROMATOGRAPHY Chapter 23. Gas Chromatography What did they eat in the year 1,000? GC of Cholesterol and other lipids extracted from
2401 Gas (liquid) Chromatography
 Chromatography") 2401 Gas (liquid) Chromatography Chromatography Scheme Gas chromatography - specifically gas-liquid chromatography - involves a sample being vaporized and injected onto the head of the chromatographic
2401 Gas (liquid) Chromatography Chromatography Scheme Gas chromatography - specifically gas-liquid chromatography - involves a sample being vaporized and injected onto the head of the chromatographic
Ch. 22 Mass Spectrometry (MS)
") Ch. Mass Spectroetry (MS).1 MS easures ass of atos, olecules, or fragents of olecules -1. What is MS? Gaseous ato fro condensed phase ionized Accelerated & separated By ass to charge ratio /z M=00: 1 ion
Ch. Mass Spectroetry (MS).1 MS easures ass of atos, olecules, or fragents of olecules -1. What is MS? Gaseous ato fro condensed phase ionized Accelerated & separated By ass to charge ratio /z M=00: 1 ion
EEE4106Z Radiation Interactions & Detection
 EEE4106Z Radiation Interactions & Detection 2. Radiation Detection Dr. Steve Peterson 5.14 RW James Department of Physics University of Cape Town steve.peterson@uct.ac.za May 06, 2015 EEE4106Z :: Radiation
CHEM 241 UNIT 5: PART A DETERMINATION OF ORGANIC STRUCTURES BY SPECTROSCOPIC METHODS [MASS SPECTROMETRY]
![CHEM 241 UNIT 5: PART A DETERMINATION OF ORGANIC STRUCTURES BY SPECTROSCOPIC METHODS [MASS SPECTROMETRY]](/thumbs/83/88348834.jpg "CHEM 241 UNIT 5: PART A DETERMINATION OF ORGANIC STRUCTURES BY SPECTROSCOPIC METHODS [MASS SPECTROMETRY]") CHEM 241 UNIT 5: PART A DETERMINATION OF ORGANIC STRUCTURES BY SPECTROSCOPIC METHODS [MASS SPECTROMETRY] 1 Introduction Outline Mass spectrometry (MS) 2 INTRODUCTION The analysis of the outcome of a reaction
CHEM 241 UNIT 5: PART A DETERMINATION OF ORGANIC STRUCTURES BY SPECTROSCOPIC METHODS [MASS SPECTROMETRY] 1 Introduction Outline Mass spectrometry (MS) 2 INTRODUCTION The analysis of the outcome of a reaction
4. How can fragmentation be useful in identifying compounds? Permits identification of branching not observed in soft ionization.
 Homework 9: Chapters 20-21 Assigned 12 April; Due 17 April 2006; Quiz on 19 April 2006 Chap. 20 (Molecular Mass Spectroscopy) Chap. 21 (Surface Analysis) 1. What are the types of ion sources in molecular
Particle Position Relative Mass Relative Charge Proton Nucleus 1 +1 Neutron Nucleus 1 0 Electron Orbitals 1/ Atomic Symbol
 Atomic Structure Details of the three Sub-atomic (fundamental) Particles Particle Position Relative Mass Relative Charge Proton Nucleus 1 +1 Neutron Nucleus 1 0 Electron Orbitals 1/1840-1 Behaviour of
Extrel Application Note
 Extrel Application Note Real-Time Plasma Monitoring and Detection of Trace H 2 O and HF Species in an Argon Based Plasma Jian Wei, 575 Epsilon Drive, Pittsburgh, PA 15238. (Presented at the 191st Electrochemical
Secondary Ion Mass Spectrometry (SIMS)
") CHEM53200: Lecture 10 Secondary Ion Mass Spectrometry (SIMS) Major reference: Surface Analysis Edited by J. C. Vickerman (1997). 1 Primary particles may be: Secondary particles can be e s, neutral species
CHEM53200: Lecture 10 Secondary Ion Mass Spectrometry (SIMS) Major reference: Surface Analysis Edited by J. C. Vickerman (1997). 1 Primary particles may be: Secondary particles can be e s, neutral species
Mass Spectrometry. Hyphenated Techniques GC-MS LC-MS and MS-MS
 Mass Spectrometry Hyphenated Techniques GC-MS LC-MS and MS-MS Reasons for Using Chromatography with MS Mixture analysis by MS alone is difficult Fragmentation from ionization (EI or CI) Fragments from
Monday (March 28)- Mass spectrometry Tuesday (March 29)- Experiment 6: Separa>ons ICP-MS calcula>ons
- Mass spectrometry Tuesday (March 29)- Experiment 6: Separa>ons ICP-MS calcula>ons") LOOKING AHEAD Monday (March 28)- Mass spectrometry Tuesday (March 29)- Experiment 6: Separa>ons ICP-MS calcula>ons Thursday (March 31)- Poster crea>on? Hayes on travel Monday (April 4)- Chromatographic
LOOKING AHEAD Monday (March 28)- Mass spectrometry Tuesday (March 29)- Experiment 6: Separa>ons ICP-MS calcula>ons Thursday (March 31)- Poster crea>on? Hayes on travel Monday (April 4)- Chromatographic
1.1 Atomic structure
 1.1 Atomic structure History of the atom The model of the atom has changed as our observations of its behavior and properties have increased. A model is used to explain observations. The model changes
Chapter 31 Gas Chromatography. Carrier Gas System
 Chapter 31 Gas Chromatography GAS-LIQUID CHROMATOGRAPHY In gas chromatography, the components of a vaporized sample are fractionated as a consequence of being partitioned between a mobile gaseous phase
Mass Spectrometry (MS)
") Mass Spectrometry (MS) MW Molecular formula Structural information GC-MS LC-MS To Do s Read Chapter 7, and complete the endof-chapter problem 7-4. Answer Keys are available in CHB204H MS Principles Molecule
Mass Spectrometry (MS) MW Molecular formula Structural information GC-MS LC-MS To Do s Read Chapter 7, and complete the endof-chapter problem 7-4. Answer Keys are available in CHB204H MS Principles Molecule
LIQUID CHROMATOGRAPHY-MASS SPECTROMETRY (LC/MS) Presented by: Dr. T. Nageswara Rao M.Pharm PhD KTPC
 Presented by: Dr. T. Nageswara Rao M.Pharm PhD KTPC") LIQUID CHROMATOGRAPHY-MASS SPECTROMETRY (LC/MS) Presented by: Dr. T. Nageswara Rao M.Pharm PhD KTPC INTRODUCTION Principle: LC/MS is a technique that combines physical separation capabilities of liquid
LIQUID CHROMATOGRAPHY-MASS SPECTROMETRY (LC/MS) Presented by: Dr. T. Nageswara Rao M.Pharm PhD KTPC INTRODUCTION Principle: LC/MS is a technique that combines physical separation capabilities of liquid
Structural Determination Of Compounds
 EXPERIMENT 10 Mass Spectroscopy Structural Determination Of Compounds. Introduction - In mass spectrometry, a substance is bombarded with an electron beam having sufficient energy to fragment the molecule.
Chapter 5 Basic Mass Spectrometry
 Chapter 5 Basic Mass Spectrometry 5.1 Introduction and History The earliest forms of mass spectrometry go back to the observation of canal rays by Goldstein in 1886 and again by Wien in 1899. Thompson
15.04.jpg. Mass spectrometry. Electron impact Mass spectrometry
 Mass spectrometry Electron impact Mass spectrometry 70 ev = 1614 kcal/mol - contrast with energy from IR (1-10 kcal/mol) or NMR (0.2 cal/mol) - typical C-C bond = 100 kcal/mol Point: lots of energy in
= 6 (1/ nm) So what is probability of finding electron tunneled into a barrier 3 ev high?
 So what is probability of finding electron tunneled into a barrier 3 ev high?") STM STM With a scanning tunneling microscope, images of surfaces with atomic resolution can be readily obtained. An STM uses quantum tunneling of electrons to map the density of electrons on the surface
STM STM With a scanning tunneling microscope, images of surfaces with atomic resolution can be readily obtained. An STM uses quantum tunneling of electrons to map the density of electrons on the surface
MASS SPECTRA measure a compound s Mol. Wt. This ionization type is called: electron impact MS
 MASS SPECTRA measure a compound s Mol. Wt. p. 213 M + Molecule e - Molecule + 2 e - + + Mole cule + + Mol ecule IONIZATION CHAMBER repellor plate accelerating plates variable field magnet + Mo + lecule
MASS SPECTROSCOPY (MS)
") MASS SPECTOSCOPY (MS) Castor seeds icin (toxic protein) INTODUCTION Does not involve absorption of electromagnetic radiation. It is a spectroscopic technique, by virtue of its use in structure elucidation.
MASS SPECTOSCOPY (MS) Castor seeds icin (toxic protein) INTODUCTION Does not involve absorption of electromagnetic radiation. It is a spectroscopic technique, by virtue of its use in structure elucidation.
Introduction to Mass Spectrometry (MS)
") Introduction to Mass Spectrometry (MS) MS Mass Spectrometry (MS) This is a very powerful analytical tool that can provide information on both molecular mass and molecular structure. Molecules come in all
Introduction to Mass Spectrometry (MS) MS Mass Spectrometry (MS) This is a very powerful analytical tool that can provide information on both molecular mass and molecular structure. Molecules come in all
Mass spectrometry as analytical tool in catalysis research
 Mass spectrometry as analytical tool in catalysis research Katrin Pelzer Functional Characterization AC, FHI-MPG Berlin 17/11/2006 Mass Spectrometry Modern Methods in Heterogeneous Catalysis Research K.