FOOD CHEMISTRY PRACTICAL MANUAL AND NUTRITION-
|
|
|
- Gabriel Bishop
- 6 years ago
- Views:
Transcription


1 FOOD CHEMISTRY AND NUTRITION- PRACTICAL MANUAL Vedpal Yadav, Lecturer in Food Technology, Government Polytechnic, Mandi Adampur, Hisar, Haryana, India Mobile
2 3.2 FOOD CHEMISTRY & NUTRITION LIST OF PRACTICALS 1. Determination of moisture in a given food sample L T P Determination of protein in a given food sample 3. Determination of carbohydrates in a given food sample 4. Determination of ash in a given food sample 5. Determination of fat in a given food sample 6. Determination of ph of a given sample 7. Determination of acidity of given food sample/beverage 8. Determination of total non reducing and reducing sugars 9. Determination of vitamin C in given food sample 10. Determination of diastase enzyme activity 11. Identification of pigments in a given food sample 12. Effect of Baking Soda in CO2 production 13. Detection of Saccharine in beverages 14. Visit to hospital/slide show on various nutritional deficiency disorders
3 Table of Contents Experiment Page No. Signature Experiment- 1- Moisture Content- Lab Oven Method 4 Experiment- 2- Moisture Content- Using Moisture Meter 7 Experiment- 3- Ash - Total 10 Experiment- 4- Ash- Acid Insoluble 14 Experiment- 5- Crude Protein- Kjeldahl Method 17 Experiment- 6- Crude Protein- Protein by Kjeltec 24 Experiment- 7- Crude Fat- Soxhlet Apparatus Method 29 Experiment- 8- Total Carbohydrates 33 Experiment- 9- Crude Fiber 35 Experiment- 10- Determination of ph using ph paper and Universal Indicator 37 Experiment- 11- Determination of ph using ph Meter 44 Experiment- 12- Determination of acidity of given honey sample 54 Experiment- 13- Determination of acidity of extracted fat in a given sample of biscuit 57 Experiment- 14- Determination of reducing and non- reducing sugars in a given food sample 59 Experiment- 15- Determination of Vitamin- C (Ascorbic Acid) in a given food sample 62 Experiment- 16- Determination of Diastase enzyme (α- amylase) activity in a given food sample by Falling Number test Experiment- 17- Identification of pigments in a given food sample by paper chromatography Experiment- 18- Effect of Baking Soda in CO 2 production 72 Experiment- 19- Detection of Saccharine in beverages 74 Experiment- 20- Visit to hospital/slide show on various nutritional deficiency disorders 76 Food Chemistry and Nutrition- Practical Manual 3
4 Experiment- 1- Moisture Content- Lab Oven Method Objective: To find out the moisture content from a given food sample by lab oven method. Theory: Upon heating water evaporates and loss of weight is equal to the moisture content of material. Materials: 1. Enough food sample to supply three 20 gram samples. 2. Oven (almost any oven will do, provided the temperature can be set reliably at 130 C for an extended period of time). 3. Analytical Balance. 4. Tray (to place the paddy grain samples on before drying in the oven). 5. Simple plastic containers or small paper bags to hold grain. 6. Pen/pencil, paper and calculator to compute the average of three samples and record the moisture content. Procedure: 1. Set the oven temperature to 130 C. 2. From your paddy grain supply, use your scale to measure three 20-gram paddy grain samples. 3. Place the three samples inside the oven and leave for hours. 4. Measure the final weight of each sample after the 16 to 24 hours. 5. Compute the moisture content for each sample using the equation. 6. You now have three separate moisture content results. Compute the average of these results by adding them together and dividing by 3. Calculation: Moisture Content (%) = W1 W2 W1 W x100 Where, W = Weight of empty moisture dish W1 = Weight of moisture dish + Sample W2 = Weight of moisture dish + Dried Sample Observations: Sample Name Wheat Flour Sample Number Weight of Empty Moisture Dish (W) (in gms.) Weight of Moisture Dish + Sample (W1) (in gms.) Weight of Moisture Dish + Dried Sample (W2) (in gms.) 4 Food Chemistry and Nutrition- Practical Manual
5 Sample Number Weight of Empty Moisture Dish (W) (in gms.) Weight of Moisture Dish + Sample (W1) (in gms.) Weight of Moisture Dish + Dried Sample (W2) (in gms.) Weight of Sample (W1-W) (in gms.) Weight of Moisture (W2-W1) (in gms.) Moisture % Average Moisture % % RSD Conclusions: 1. Did each of your samples contain approximately the same amount of moisture content? 2. What was the average moisture of all three samples? 3. Based on what you know about correct moisture content for milling (14%), is the paddy rice you sampled ready for milling? Why or why not? Sample Name Wheat Flour Sample Number Weight of Empty Moisture Dish (W) (in gms.) Weight of Moisture Dish+Sample (W1) (in gms.) Weight of Moisture Dish+Dried Sample (W2) (in gms.) A B C Weight of Sample (W1-W) (in gms.) Weight of Moisture (W1-W2) (in gms.) Moisture % Average Moisture % % RSD Food Chemistry and Nutrition- Practical Manual 5
6 Space for Observations and Calculations 6 Food Chemistry and Nutrition- Practical Manual
7 Experiment- 2- Moisture Content- Using Moisture Meter Objective: To find out the moisture content from a given sample by using moisture meter. Materials: 1. Moisture meter and instructions for use 2. Paddy rice enough to provide three samples for the moisture meter (approximately one handful) 3. Simple plastic containers or small paper bags to hold grain 4. Pen/pencil, paper and calculator to compute the average of three samples and record the moisture content Procedure: 1. Read the operator s instructions. 2. Turn the moisture meter on. 3. Ensure the machine is set for paddy rice. 4. Fill the tray or bowl of the moisture tester with a sample of the paddy rice to be tested 5. Turn or press the knob until the moisture reading is displayed. 6. Test at least three samples and calculate the average of the three readings. Observations & Calculations: Sample Volume Thickness Sample No. Moisture % Average Moisture Content % RSD Conclusions: 1. Did each of your samples contain approximately the same amount of moisture content? 2. What was the average moisture content of all three samples? 3. Is the paddy rice you sampled ready for milling? Why or why not? Food Chemistry and Nutrition- Practical Manual 7
8 Sample Paddy Volume C Thickness 3.25 Sample No. Moisture % Average Moisture Content % RSD Food Chemistry and Nutrition- Practical Manual
9 Space for Observations and Calculations Food Chemistry and Nutrition- Practical Manual 9
10 Objective: To find out the ash in the given food sample. Experiment- 3- Ash - Total Theory: Organic matter is burnt off at as low temperature as possible. Heating is done in stages, first to char the product thoroughly and finally to ash at 550 C in a muffle furnace. The inorganic matter left after burning organic matter is cooled and weighed. Apparatus: Procedure: Calculation: 1. Crucible 2. Heating Plate 3. Muffle Furnace 4. Dessicator 5. Analytical Balance 1. Place the crucibles in muffle furnace to heat at 550 C for 15 minutes. 2. Remove the crucibles, cool in a dessicator for one hour and weigh the crucible (W). 3. Weigh 2 g of sample in the crucible (W1). 4. Keep the sample on a hot plate till smoking ceases and sample become thoroughly charred. 5. Place the crucibles inside the muffle furnace and heat to 550 C for 5 to 6 hours. 6. Let the furnace cool and take out crucibles containing ash, clean and white in appearance. 7. If traces of carbon are still evident, cool the crucible, add 1 2 ml of water and stir with a glass rod to break up the ash. Dry on steam bath and place in muffle furnace and again heat at 550 C. 8. Cool the crucible in a dessicator and reweigh (W2) the crucible containing ash. Ash % = W2 W W1 W x100 Where, W = Weight of empty crucible W1 = Weight of crucible + Sample W2 = Weight of crucible + Ashed Sample Observations: Sample Name Sample Number Weight of Empty Silica Crucible (W) (in gms.) Weight of Silica Crucible + Sample (W1) (in gms.) Weight of Silica Crucible + Ashed Sample (W2) (in gms.) 10 Food Chemistry and Nutrition- Practical Manual
11 Sample Number Weight of Empty Silica Crucible (W) (in gms.) Weight of Silica Crucible + Sample (W1) (in gms.) Weight of Silica Crucible + Ashed Sample (W2) (in gms.) Weight of Sample (W1- W) (in gms.) Weight of Ash (W2- W) (in gms.) Ash % Average Ash % % RSD Food Chemistry and Nutrition- Practical Manual 11
12 Sample Name Sample Number Weight of Sample (W1- W) (in gms.) Wheat Flour Weight of Empty Silica Crucible (W) (in gms.) Weight of Silica Crucible + Sample (W1) (in gms.) Weight of Silica Crucible + Ashed Sample (W2) (in gms.) A B C Weight of Ash (W2- W) (in gms.) Ash % Average Ash % % RSD Food Chemistry and Nutrition- Practical Manual
13 Space for Observations and Calculations Food Chemistry and Nutrition- Practical Manual 13
14 Experiment- 4- Ash- Acid Insoluble Objective: To find out the acid insoluble ash from a given food sample. Reagents: Dil HCL approximately 0.5 N prepared from conc.hcl Procedure: To the ash contained in a dish, add 25 ml of dil, HCl. Cover with a watch glass and heat on a water bath for 10 minutes. Allow to cool and filter the contents of the dish through a Watman filter paper No.42 or its equivalent. Wash the filter paper with water until the washing are free from the acid and return it to the dish. Keep it in an electric oven maintained at 135 ± 2 0 C for about 3 hrs. Ignite in a muffle furnace at C for 1hr. Cool the dish in a dessicator and weigh. Repeat the process of igniting in muffle furnace, cooling and weighing at half hours interval until the difference in mass between 2 successive weighings is less than 1 mg. Note: the lowest mass. Calculation % Ash Insoluble ash (on dry basis) 100(W W) 2 (W1 W) % by mass = Where W 2 - Mass in g of dish + acid insoluble W - Mass in g of empty dish W 1 - Mass in g of dish with the dried material Observation and Result Acid insoluble ash % of a given sample Where W 2 = g W 1 = g W = g 100( ) ( ) % = 8 14 Food Chemistry and Nutrition- Practical Manual
15 Sample Name Sample Number Wheat Flour Weight of Empty Silica Crucible (W) (in gms.) Weight of Silica Crucible+Sample (W1) (in gms.) Weight of Silica Crucible+Acid Insoluble Ashed Sample (W2) (in gms.) A B C Weight of Sample (W1- W) (in gms.) Weight of Acid Insoluble Ash (W2-W) (in gms.) Acid Insoluble Ash % Average Acid Insoluble Ash % % RSD Sample Name Sample Number Weight of Empty Silica Crucible (W) (in gms.) Weight of Silica Crucible+Sample (W1) (in gms.) Weight of Silica Crucible+Acid Insoluble Ashed Sample (W2) (in gms.) Weight of Sample (W1- W) (in gms.) Weight of Acid Insoluble Ash (W2-W) (in gms.) Acid Insoluble Ash % Average Acid Insoluble Ash % % RSD Food Chemistry and Nutrition- Practical Manual 15
16 Space for Observations and Calculations 16 Food Chemistry and Nutrition- Practical Manual

17 Experiment- 5- Crude Protein- Kjeldahl Method Objective: To find out the amount of crude protein in a given food sample. Introduction The protein content of foods can be determined by numerous methods. The Kjeldahl, nitrogen combustion (Dumas) and infrared spectroscopy methods for protein analysis are based on nitrogen determination. The methods are from the Official Methods of Analysis of AOAC International (1), and are used commonly in research laboratories working on proteins. Theory Nitrogen is one of the five major elements found in organic materials such as protein. This fact was recognized by a Danish chemist, Johan Kjeldahl, who used it as a method of determining the amount of protein in samples taken from a wide variety of organisms. In 1883 Kjeldahl presented to the Danish Chemical Society a method (much revised since his day) for determining the amount of nitrogen in mixtures of substances containing ammonium salts, nitrate, or organic nitrogen compounds. The central basis used in this procedure is the oxidation of the organic compound using strong sulfuric acid. As the organic material is oxidized the carbon it contains is converted to carbon dioxide and the hydrogen is converted into water. The nitrogen, from the amine groups found in the peptide bonds of the polypeptide chains, is converted to ammonium ion, which dissolves in the oxidizing solution, and can later be converted to ammonia gas. The Kjeldahl method of nitrogen analysis is the worldwide standard for calculating the protein content in a wide variety of materials ranging from human and animal food, fertilizer, waste water and fossil fules. Principle Figure 1 Trapping the Ammonia The Kjeldahl procedure can be basically divided into three parts: (1) digestion, (2) distillation, (3) titration. In the digestion step, organic nitrogen is converted to an ammonium in the presence of a catalyst at approximately 370ºC. In this experiment, the sample is digested in H 2SO 4, using Copper-based catalyst, converting N to NH 3 which is distilled and titrated. Protein Sulfuric acid Heat, catalyst (NH4)2SO4 Food Chemistry and Nutrition- Practical Manual 17
2SO4 + 2NaOH 2NH3 + Na2SO4 + 2H2O NH3 + H3BO3 (boric acid) NH4 + H2BO3 - (borate ion) The amount of ammonia nitrogen in this solution is quantified by titration with a standard HCl solution.")
18 In the distillation step the digested sample is made alkaline with NaOH and the nitrogen is distilled off as NH 3. This NH 3 is trapped in a boric acid solution. (NH4)2SO4 + 2NaOH 2NH3 + Na2SO4 + 2H2O NH3 + H3BO3 (boric acid) NH4 + H2BO3 - (borate ion) The amount of ammonia nitrogen in this solution is quantified by titration with a standard HCl solution. A reagent blank is carried through the analysis and the volume of HCl titrant required for this blank is subtracted from each determination. H2BO3 - + H + H3BO3 This analysis determines total nitrogen and not usable nitrogen and this is the reason it is called a crude protein analysis. A three step procedure The Kjeldahl method consists of three steps, which have to be carefully carried out in sequence: 1. the sample is first digested in strong sulfuric acid in the presence of a catalyst, which helps in the conversion of the amine nitrogen to ammonium ions, 2. the ammonium ions are then converted into ammonia gas, heated and distilled. The ammonia gas is led into a trapping solution where it dissolves and becomes an ammonium ion once again, 3. finally the amount of the ammonia that has been trapped is determined by titration with a standard solution, and a calculation made. Figure 2 Digetion Step One: Digestion of the Sample This is the most time-consuming step in the analysis. The purpose of this step is to break down the bonds that hold the polypeptides together, and convert them to simpler chemicals such as water, carbon dioxide and, of course, ammonia. Such reactions can be considerably speeded up by the presence of a catalyst and by a neutral substance, such as potassium sulfate (K 2SO 4), which raises the boiling point of the digesting acid and thus the temperature of the reaction. Catalysts are also used to help in the digestion process; many different one have been tried including selenium, mercury, copper, or ions of mercury or copper. 18 Food Chemistry and Nutrition- Practical Manual


19 Figure 3 Digestion by Sulfuric Acid and Heat Digestion is accomplished by: 1. Weighing out approximately 1 gm of the sample containing protein, making a note of the weight, and placing the sample into a digestion flask, along with ml of concentrated sulfuric acid (H 2SO 4). 2. Adding seven grams of potassium sulfate and a catalyst, usually copper. 3. Bringing the digestion tube/flask and mixture to a "rolling boil" (about 370 o C to 400 o C) using a heating a block. 4. Heating the mixture in the tube/flask until white fumes can be seen, and then continuing the heating for about mins. 5. Cooling the tube/flask and cautiously adding 250 mls of water. Step Two: Distillation The purpose of the next step, distillation, is to separate the ammonia (that is, the nitrogen) from the digestion mixture. This is done by, 1. raising the ph of the mixture using sodium hydroxide (45% NaOH solution). This has the effect of changing the ammonium (NH 4+ ) ions (which are dissolved in the liquid) to ammonia (NH 3), which is a gas. 2. separating the nitrogen away from the digestion mixture by distilling the ammonia (converting it to a volatile gas, by raising the temperature to boiling point) and then trapping the distilled vapors in a special trapping solution of about 15 ml HCl (hydrochloric acid) in 70 ml of water. 3. removing the trapping flask and rinsing the condenser with water so as to make sure that all the ammonia has been dissolved. Figure 4 Trapping of Ammonia Step Three: Titration As the ammonia dissolves in the acid trapping solution, it neutralizes some of the HCl it finds there. What acid is left can then be "back titrated", that is titrated with a standard, known solution of base (usually NaOH). In this way the amount of ammonia distilled off from the digestive solution can be calculated, and hence the amount of nitrogen in the protein determined. Food Chemistry and Nutrition- Practical Manual 19

20 Figure 5 Titration The quantities of acid, and hence ammonia are determined by, 1. adding an indicator dye to the acid/ammonia trapping solution. This dye should turn a strong color, indicating that a significant amount of the original trapping acid is still present. 2. putting a standard solution of NaOH (sodium hydroxide) into the buret (a long tube with a tap at the end), and slowly, slowly adding small amounts of the sodium hydroxide solution to the acid solution with the dye. 3. watching for the point at which the dye turns orange, indicating that the "endpoint" has been reached and that now all the acid has been neutralized by the base. 4. recording the volume of the neutralizing base (sodium hydroxide solution) that was necessary to reach the endoint. 5. performing a calculation to find the amount of ammonia, and thus nitrogen, that came from the original sample. Calculations One mole of ammonia coming from the digestion mixture (and hence from the original protein) will neutralize exactly one mole of the acid in the trapping flask. The first calculation, therefore, is to find the number of moles of ammonia that have been produced and then trapped from your sample(s). This is done by, calculating the number of moles of acid in the trapping flask originally (before any ammonia was trapped) by multiplying the molarity of the acid solution by the volume of the trapping solution moles of acid =molarity of acid x volume used in flask (molesa = M x V) calculating the number of moles of base (NaOH) that were added from the buret to neutralize the remaining acid (that NOT neutralized by the ammonia). moles of base =molarity of base x volume added from buret (molesb = M x V) subtracting the "moles of base" added from the "moles of acid" present at the beginning, to get, the number of "moles of ammonia" coming from the protein, the number of "moles of ammonia" is the same as the "moles of nitrogen", so... to calculate the number of grams of nitrogen in the original sample of protein, multiply the "moles of nitrogen" by the atomic mass of nitrogen (mass of atoms of nitrogen), gms nitrogen =moles nitrogen x atomic mass (gn = molesn x ) 20 Food Chemistry and Nutrition- Practical Manual

21 Figure 6 Calculation Percent Nitrogen The percentage of nitrogen found in the orginal sample can now be calculated by: %nitrogen =(gms nitrogen / gms sample) x 100 %N = (gn / gs) x 100 It is also possible to calculate the amount of crude protein in the sample. Although there are differences between different samples, the amount of "crude protein" (CP) can be found by multipling the percent Nitrogen by a factor (usually 6.25). CP = %N x 6.25 Weight of food sample = W1 Volume of acid in sample titration = V1 Volume of acid in blank titration = BL Concentration of acid, M = 0.1 M See below for calculation of total and percentage values Total Nitrogen and Protein in the food, measured in dry sample: Total Nitrogen = (V1 BL) x 0.1 x x Total Dry Matter of Food W1 where 0.1 is molar concentration of the HCl and is factor for equivalence of HCl to NH 3 To convert to protein multiply by the appropriate factor: Food Chemistry and Nutrition- Practical Manual 21
22 x 6.25 for meat and general protein x 6.38 for milk protein x 5.70 for cereal protein. NB These are not perfect and you must choose according to the major type of food in the sample. In most cases this will be the first one. Percentage Nitrogen and Protein In original, wet sample: Nitrogen, % = (V1 BL) x 0.1 x x 100 x %Dry Matter W1 100 To convert to protein multiply by the appropriate factor: x 6.25 for meat and general protein x 6.38 for milk protein x 5.70 for cereal protein. NB These are not perfect and you must choose according to the major type of food in the sample. In most cases this will be the first one. 22 Food Chemistry and Nutrition- Practical Manual
23 Space for Observations and Calculations Food Chemistry and Nutrition- Practical Manual 23
24 Experiment- 6- Crude Protein- Protein by Kjeltec Principle All nitrogen in the sample is converted to NH 4 + by digestion with concentrated H 2SO 4 and H 2O 2 using inorganic salt catalysts at a high temperature. The solution is then made alkaline (with NaOH) and steam is passed through and the ammonia is distilled into a solution of boric acid that contains an indicator (methyl orange). Finally the distilled ammonia, now dissolved in the boric acid, is titrated against 0.1 M HCl. The Kjeldahl method described above is the standard method for determining protein content. The Kjeltec is a semi-automated version of this method. Apparatus/Instrument/Chemicals/Samples Sulfuric acid 98% min. Catalyst tablets to be used: Kjeltabs CX Caustic soda 32% Boric acid solution 2% Indicator Solution M5 (Merck) or similar Standard acid 0.1N or c = 0.1 mol/, alternatively sulfuric acid 0.1N or c = 0.05 mol/l Mechanical comminuting instrument Analytical balance (0.001 g) Kjeldahl digestion block Kjeldatherm, Turbotherm, flask heater for Kjeldahl flask with wide neck opening Vapodest distillation System Burette, 50 ml nominal capacity, with a scale on 0.05 ml or titration system (not with the Vap 50) or ph meter with combined electrode 1 Digestion Wear Gloves and Safety Glasses throughout this Procedure 1. Collect two Kjeldahl digestion tubes and label them with a permanent marker close to the top. Always carry them in a tube rack (share with your colleagues). 2. Accurately weigh out (to nearest mg) in duplicate approximately 0.1 g of dry sample on to a filter paper (W1). 3. If using a wet sample, pipette about 1 g (to nearest mg) directly into the bottom of a labelled digestion tube. 4. Fold up the paper containing the dry sample and carefully transfer the whole parcel to a labelled digestion tube. 5. Place a filter paper in a further digestion tube to act as a blank. 6. Add 2 catalyst tablets (copper sulphate + potassium sulphate) to each tube. Then add 10 cm 3 concentrated H 2SO 4 and mix by gentle swirling. Take care. See the demonstrator before making these additions. 7. Now add 10 cm 3 H 2O 2 in a fume cupboard and beware of frothing. Add the peroxide slowly at first. 8. Place the tubes in the digestion block and digest until clear (30 minutes to 2 hours). Check that there are no black carbon particles visible. 9. Allow the tubes to cool until barely warm but still liquid. Then add approximately 70 cm 3 distilled water. 24 Food Chemistry and Nutrition- Practical Manual
25 CARE - add the water slowly in the early stages and beware of spitting. If necessary the digestion tubes may be left at this stage by covering the top of the tubes with Parafilm. 2 Distillation and Titration a) In turn place the tubes into the distillation unit and twist to seal. If this is not done properly the tube contents may leak out and the results be useless. b) Close the door on the apparatus and start the cycle. c) The exact sequence will depend on which instrument you are using. d) The apparatus will automatically add alkali to the tube and then bubble steam to distil off the ammonia. This is collected in boric acid. The Foss Kjeltec machine used boric containing indicator but the Buchi machine measure ph. The titration is automatic. The volume of acid used is displayed on the front of the apparatus. With both instruments the results are saved and can be accessed later if necessary. e) When the titration is finished the tubes will be emptied automatically. Record the volume of acid used. f) Insert the next tube and continue. Procedure 1. Sample Preparation 1. Weigh accurately 2.00g comminuted sample as a start on a piece of a filter paper. 2. Store the sample air tight so that any changes or decay of the composition is avoided. Prior to the analysis the sample should be at room temperature. The examination of the thus prepared sample has to be done within the following 24 h. 2. Digestion chemicals 1. The chemicals are added. Sulfuric acid is used to wash down any sample residue, which might remain at the glass walls. Chemicals Sulfuric acid 20 ml Kjeltabs 2 Indicator solution M5 Standard acid 0.1N or c=0.1mol/l; alternatively sulfuric acid 0.1N or c=0.05mol/l 3. Digestion with Kjeldatherm When working with a Kjeldatherm-System with 250 ml Kjeldatherm-digestion tubes, the following digestion parameters are recommended: Time in min Temperature in C Comments Digestion tubes are put into the preheated block and time it takes for the sample to become translucent Dehydrate the sample Foaming during the digestion has to be expected, however, the foaming should not go higher then 2/3 of the glass. If excessive reactions should occur, take out the insert rack. Food Chemistry and Nutrition- Practical Manual 25
26 During the digestion black particles remaining at the glass wall are washed back with condensing sulfuric acid. The sample glass has to be translucent after the digestion in order to obtain good results. 4. Digestion with Turbotherm When working with a Turbotherm-System with 250 ml Kjeldatherm-digestion tubes, the following program parameter are recommended: Time in Power in % Comment min 10 to Heating up of the system to bring digestion solution to boiling to 80 Digestion solution is turning translucent after ca 20 to 30 min 5. Digestion with Flask heater For Serial Flask Heater with 500 or 750 ml Kjeldahl flask with wide neck opening the following procedure is recommended: 6. Suction Time in Power Comments min 20 3 Heating up till the digestion solution is boiling 50 1,5 After min. the sample should turn translucent. Wash down remaining sample particles with condensing sulfuric acid into the flask. During the entire digestion period the scrubber should be on. About 1200 ml of a 15% caustic soda is recommended for the washing bottle; this amount is sufficient to neutralize digestion gases of about 60 digestions. The cooling off period after the lifting of the insert rack or the cooling off period after turning off the heating is about 30 minutes; during this time the scrubber should be working as well. 7. Distillation After the digested sample has cooled off the water steam distillation is done according to the following program: Program parameter Vap 50 Water addition in s 9 NaOH addition in s 8 Reaction time in s 0 Distillation time in s 240 Steam output in % 100 Suction sample in s 25 Boric acid addition in s 6 s Suction receiver in s 25 Titration Auto Calculation Auto 26 Food Chemistry and Nutrition- Practical Manual
27 8. Titration (is done automatically when using the Vap 50) 3-4 drops of an indicator mixture M 5 are added to the receiving solution and it is then titrated with 0.1 N titration acid till the color changes from green to grey/violet. If the determination of the endpoint is done with a ph-meter or a titrator, the addition of the indicator mixture is obsolete. 9. Blank Value For the determination of the blank value the analysis (digestion and distillation) is run just using the given chemicals. The consumption of those chemicals has then to be taken into account when the calculation is done. 10. Calculation % N = * c * (V - Vb) Sample weight (g) c : Concentration of the standard-acid solution: Hydrochloric acid 0.1N or c = 0.1 mol/l Alternative: sulfuric acid 0.1N or c = 0.05 mol/l V: Consumption of the standard acid in ml (Sample) Vb: Consumption of the standard acid in ml (Blank Sample) % raw protein= % N * 6.25 Nitrogen to Protein Conversion Factors for Various Foods Product Factor Egg or meat 6.25 Dairy products 6.38 Wheat 5.70 Other cereal grains or oilseeds 6.25 Almonds 5.18 Peanut and Brazil nuts 5.46 Other tree nuts and coconut 5.30 Soybean products 6.08 Food Chemistry and Nutrition- Practical Manual 27
28 Space for Observations and Calculations 28 Food Chemistry and Nutrition- Practical Manual
29 Experiment- 7- Crude Fat- Soxhlet Apparatus Method Objective: To find out the amount of crude fat in a given food sample. Principle: A Soxhlet extractor is a piece of laboratory apparatus invented in 1879 by Franz von Soxhlet. It is a procedure to remove lipids (fats) from food. A solvent is used to wash the solid using a reflux apparatus. The sample is dried and ground and placed in a tube above the extraction solvent. When heated, the solvent evaporates into a gas, then cools into a liquid in a condenser. It then leaks into the sample tube. This continues several hours until the lipid is removed from the sample. The solvent is evaporated off, and the amount of lipid is determined. Apparatus Soxhlet extraction apparatus - A glass Soxhlet extraction apparatus of suitable size (100 ml) for containing the sample and a 250 ml collection flask is required for the conventional Soxhlet procedure. An automated extraction apparatus (Brinkmann Buchi B-810 or equivalent) with circulating oil bath and associated glassware is required for the automated Soxhlet procedure. Alundum extraction thimbles - Medium porosity (10-15 mm pore), sized to fit the Soxhlet extractor. Analytical balance - Sensitive to 0.1 mg. Rotary evaporator with vacuum and water bath - Rotary evaporator equipped with a "bump" trap, condenser, receiving vessel, and vacuum source sufficient to pull a vacuum of less than 150 torr. Vacuum oven or drying oven - Vacuum oven should be controllable to a temperature of 40 ± 1 C and vacuum of between 75 to 100 torr. If drying oven is used in place of the vacuum oven, the drying oven must be able to maintain 45 ± 2 C Reagents and Materials Ethyl alcohol, 95% in water (190 proof), USP grade. Boiling chips. Glass wool. Buchner funnel. Desiccator. Procedure 1. Dry the Soxhlet extraction thimble at 105 C to constant weight. Remove, cool to room temperature in a desiccator, and weigh to the nearest 0.1 mg. 2. Carefully add the sample to the extraction thimble. Do not overfill the thimble, leave at least a 1 cm gap between the sample and the top of the thimble. Weigh the filled thimble to the nearest 0.1 mg. Place a plug of glass wool on top of the sample to prevent sample loss during the extraction. Note: Samples for total solids determination (following Laboratory Analytical Procedure #001, Determination of Total Solids and Moisture in Biomass) must be weighed out at the same time as the samples for the extractives determination. If this determination is done at a later time, an error in the calculation of the amount of extractives will be introduced, since the moisture content of a biomass sample can change rapidly when exposed to air. 3. Place several boiling chips into a clean, dry receiving flask or beaker. Weigh the container, with chips, to the nearest 0.1 mg and record as the tare weight of the container. 4. For a conventional Soxhlet extraction (this procedure was reproduced from the Chemical Technologies Research Branch Procedure #001c, Determination of Extractives Content): 4.1. Assemble the Soxhlet apparatus using at least 160 ml of 95% ethanol. Insert the thimble and heat at reflux for 24 hours. Periodically check the reflux rate and adjust the heating rate to give four to Food Chemistry and Nutrition- Practical Manual 29

30 five solvent exchanges per hour in the Soxhlet thimble. Approximately solvent exchanges are required during the 24 hour period When the extraction time is complete, remove the thimble and carefully transfer the sample to a Buchner funnel. Remove any residual solvent by vacuum filtration and wash the sample thoroughly with 95% ethanol, collecting all of the filtrate. Allow the biomass to air dry in the Buchner funnel while it is still attached to the vacuum system Combine the filtrate from the previous step and any solvent from the upper section of the Soxhlet apparatus with the solvent in the 250 ml flask. Place the flask on the rotary evaporator and remove the solvent under vacuum. Use a water bath temperature of 45 ± 5 C to heat the flask during evaporation After all of the visible solvent is removed by the rotary evaporator, place the flask in a vacuum oven ( torr) at 40 ± 1 C for 24 ± 1 hour. Remove the flask at this time and allow to cool to room temperature in a desiccator. Weigh the flask and record this total weight to the nearest 0.1 mg. Figure 7 A schematic representation of a Soxhlet extractor 1: Stirrer bar 2: Still pot (the still pot should not be overfilled and the volume of solvent in the still pot should be 3 to 4 times the volume of the soxhlet chamber) 3: Distillation path 4: Thimble 5: Solid 6: Siphon top 7: Siphon exit 8: Expansion adapter 9: Condensor 10: Cooling water in 11: Cooling water out 30 Food Chemistry and Nutrition- Practical Manual

31 Figure 8 Mechanism of Soxhlet extractor Calculations 1. Calculate the oven dry weight of the sample, using the average total solids content. 2. Calculate the amount of extractives in the sample, on a percent dry weight basis. Food Chemistry and Nutrition- Practical Manual 31
32 Space for Observations and Calculations 32 Food Chemistry and Nutrition- Practical Manual
33 Experiment- 8- Total Carbohydrates Objective To find out the amount of total carbohydrates in a given food sample. Theory Carbohydrates are the important components of storage and structural materials in the plants. They exist as free sugars and polysaccharides. The basic units of carbohydrates are the monosaccharides which cannot be split by hydrolysis into more simpler sugars. The carbohydrate content can be measured by hydrolyzing the polysaccharides into simples sugars by acid hydrolysis and estimating the resultant monosaccharides. Principle Carbohydrates are first hydrolysed into simple sugars using dilute hydrochloric acid. In hot acidic medium glucose is dehydrated to hydroxymethyl furfural. This compound forms with anthrone a gree colored product with an absorption maximum at 630nm. Materials 2.5 N-HCl Anthrone Reagent: Dissolve 200mg anthrone in 100mL of ice cold 95% H 2SO 4. Prepare fresh before use. Standard Glucose: Stock Dissolve 100mg in 100mL water. Working standard 10mL of stock diluted to 100mL with distilled water. Store refrigerated after adding a few drops of toluene. Procedure 1. Weigh 100mg of the sample into a boiling tube. 2. Hydrolyse by keeping it in boiling water bath for 3 hours with 5mL of 2.5 N-HCl and cool to room temperature. 3. Neutralise it with solid sodium carbonate until the effervescence ceases. 4. Make up the volume to 100mL and centrifuge. 5. Collect the supernatant and take 0.5 and 1mL aliquots for analysis. 6. Prepare the standards by taking 0, 0.2, 0.4, 0.6, 0.8 and 1mL of the working standard. 0 serves as blank. 7. Make up the volume to 1mL in all the tubes including the sample tubes by adding distilled water. 8. Then add 4mL of anthrone reagent. 9. Heat for eight minutes in a boiling water bath. 10. Cool rapidly and read the green to dark green color at 630nm. 11. Draw a standard graph by plotting concentration of the standard on the X-axis versus absorbance on the Y-axis. 12. From the graph calculate the amount of carbohydrate present in the sample tube. Calculation Amount of carbohydrate present in 100mg of the sample = mg of glucose Volume of test sample X 100 Note Cool the contents of all the tubes on ice before adding ice-cold anthrone reagent. Food Chemistry and Nutrition- Practical Manual 33
34 Space for Observations and Calculations 34 Food Chemistry and Nutrition- Practical Manual
35 Experiment- 9- Crude Fiber Objective To find out the amount of crude fiber in a given food sample. Theory Crude fiber consists largely of cellulose and lignin (97%) plus some mineral matter. It represents only 60% to 80% of the cellulose and 4% to 6% of the lignin. The crude fiber content is commonly used as a measure of the nutritive value of poultry and livestock feeds and also in the analysis of various foods and food products to detect adulteration, quality and quantity. Principle During the acid and subsequent alkali treatment, oxidative hydrolytic degradation of the native cellulose and considerable degradation of lignin occur. The residue obtained after final filteration is weighed, incinerated, cooled and weighed again. The loss in weight gives the crude fiber content. Materials 1. Sulphuric acid solution (0.255 ±0.005N) : 1.25g concentrated sulphuric acid diluted to 100mL (concentration must be checked by titration) 2. Sodium hydroxide solution (0.313 ±0.005N) : 1.25g sodium hydroxide in 100mL distilled water (concentration must be checed by titration with standard acid) Procedure 1. Extract 2g of ground material with ether or petroleum ether to remove fat (Initial boiling temperature C and final temperature 52 C). if fat content is below 1%, extraction may be omitted. 2. After extraction with ether boil 2g of dried material with 200mL of sulphuric acid for 30min with bumping chips. 3. Filter through muslin and wash with boiling water until washing are no longer acidic. 4. Boil with 200mL of sodium hydroxide solution for 30min. 5. Filter through muslin cloth again and wash with 25mL of boiling 1.25% H2SO4, three 50mL portions of water and 25mL alcohol. 6. Remove the residue and transfer to ashing dish (preweighed dish W1). 7. Dry the residue for 2h at 130 ±2 C. Cool the dish in a desiccator and weigh (W2). 8. Ignite for 30min at 600 ±15 C. 9. Cool in a desiccator and reweigh (W3). Calculation % crude fiber in ground sample = Loss in weight on ignition (W2 - W 1) (W 3 - W 1) Weight of the sample x 100 Food Chemistry and Nutrition- Practical Manual 35
36 Space for Observations and Calculations 36 Food Chemistry and Nutrition- Practical Manual

37 Experiment- 10- Determination of ph using ph paper and Universal Indicator Objective To determine the ph of a given sample using ph paper and Universal Indicator. Theory There are millions of chemical substances in the world, some are acids, others are bases and some are neutral. Acids and Bases Acids are substances that produce free hydrogen ions (H + ions) when dissolved in water. Bases are substances that produce hydroxyl ions (OH - ions) when dissolved in water. Acidic solutions are rich in hydrogen ions and basic solutions are poor in hydrogen ions. Some acids dissociate only partly, releasing very small amounts of H + ions, and are called weak acids. Others dissociate completely, releasing large amounts of H + ions, and are called strong acids. In the same way, bases that dissociate partly are called weak bases and those that dissociate completely are called strong bases. ph of a Solution The acidic or basic property of substances is measured in terms of ph. It is a measurement of the hydrogen ion concentration. ph is defined as the negative logarithm (base 10) of hydrogen ion concentration. If the hydrogen ion concentration is very high, the ph value is very low. This is determined using a scale ranging from 0-14 called the ph scale. It was introduced by a Danish chemist Soren Peder Lauritz Sorensen. Substances with ph lower than 7 are acidic, those with ph equal to 7 are neutral and those with ph greater than 7 are basic in nature. The ph of pure water is 7. i.e., Figure 9 Danish Chemist Soren Peder Lauritz Sorensen Food Chemistry and Nutrition- Practical Manual 37
 of hydroxyl ion concentration.")

38 Figure 10 ph Scale poh of a Solution poh is used to measure the concentration of hydroxyl ions (OH - ions) or the alkalinity of a solution. poh is defined as the negative logarithm (base 10) of hydroxyl ion concentration. poh is derived from ph and are related by the equation, Measurement of ph ph of a solution is measured using ph indicators. ph indicators are substances that changes colour when in contact with acidic, basic or neutral solutions. Let us discuss some ph measurement methods. ph paper ph paper is a strip of special paper that is prepared by dipping the strip in different chemical compounds and then drying it. It can be used to find the approximate ph of any solution. These paper changes colour when immersed in acidic or basic solutions. To determine the ph, the ph paper is dipped in a given sample solution and the colour developed in the paper is compared with the colour chart and the approximate ph of the solution can be identified. It is commerically available as test papers. Figure 11 ph Paper Universal Indicator Universal indicator is a ph indicator composed of different chemical compounds. When the indicator is poured in the sample solution, the mixture obtained exhibits a smooth colour change over a ph value 38 Food Chemistry and Nutrition- Practical Manual


39 ranging from 1-14 that indicates the acidic or basic property of the solution. It is commercially available as test solutions. Figure 12 Universal ph Indicator ph Meter ph meter is an electronic instrument consisting of a special bulb that is sensitive to hydrogen ions that are present in the test solution. The signal produced by the bulb is amplified and sent to an electronic meter connected to the bulb, which measures and display the ph reading. It gives more precise values than the ph papers. For very precise measurement, the ph meter should be calibrated before each measurement. The calibration should be performed with at least two buffer solutions with known ph. For general purposes, buffer solutions with ph 4 and ph 10 are used. For more precise measurements, three buffer solution calibrations are preferred. After each single measurement, the bulb is rinsed with distilled water or deionised water to remove any traces of solution being measured. Then the bulb is blotted with a blotting paper to remove remaining water that could dilute the sample and alter the reading. When not in use, the bulb must be kept wet at all times to avoid dehydration of the ph sensing membrane. Figure 13 A Digital ph Meter Red Cabbage Juice This is a blue-violet coloured liquid. When it comes in contact with acidic substances, it becomes red. When it comes in contact with basic substances, it becomes green or even yellow. Food Chemistry and Nutrition- Practical Manual 39


40 Figure 14 Colour Scale of Red Cabbage Papers ph helps to determine the acidic and basic strength of acids and bases. Figure 15 Materials Required Procedure Real Lab Procedure Determination of ph using ph Paper Take a ph paper strip and place it on a white tile. Pour a drop of the sample on the ph paper using a clean dropper. Observe the colour of the ph paper. Now compare the colour obtained on the ph paper with the different colour shades of the standard colour ph chart and note down the ph value. Similarly, find the ph of the remaining samples using a fresh strip of ph paper and a separate dropper for each sample. Determination of ph using Universal Indicator Solution Take a small quantity of the given sample in a test tube using a dropper. 40 Food Chemistry and Nutrition- Practical Manual
41 Using a dropper pour a few drops of the universal indicator solution into the test tube containing the sample. Shake the test tube well and note the colour developed in the test tube. Now compare the colour produced in the test tube with the different colour shades of the standard colour ph chart and note down the ph value. Similarly, find the ph of the remaining samples. Simulator Procedure (as performed through the Online Labs) Simulator Link- You can select the aqueous solution from the 'Select the aqueous solution' drop down list. Now choose any one of the sample solutions in the beaker by clicking on it. You can find out the ph value of the solution using any of the two methods mentioned below. Using ph Paper Drag the dropper towards the beaker and dip it into the solution to take the solution in it. Still holding the dropper, move it from the beaker over to the ph paper and release it to pour a few drops of the solution on to the ph paper. The area on the ph paper over which the solution is poured develops a colour. To find the ph value of the solution, select the colour strip from the standard colour ph chart and drag it to the ph paper to compare it. The colour that matches with the spot on the ph paper indicates the ph value of the solution. Using Universal Indicator Solution Click on the dropper in the universal indicator solution bottle and drag it towards the solution in the beaker to pour the universal indicator into it. The solution changes colour. To find the ph value of the solution, select the colour strip from the standard colour ph chart and drag it near to the solution in the beaker to compare it. The colour that matches with the colour of the solution in the beaker indicates the ph value of the solution. Observations Record the observations in a tabular column. Sample Name For ph Paper For Universal Indicator Solution Colour produced on the ph Paper Approximate ph Colour produced in the solution Approximate ph Precautions Use only the standard colour ph chart supplied with the ph paper for assessing the ph value. Keep the ph strips away from chemical fumes. Either use fresh fine dropper or glass rod for each different sample, or wash the dropper or glass rod well with water every time. Food Chemistry and Nutrition- Practical Manual 41
42 To correctly view the colour produced on the ph paper, keep the ph paper on a white tile while performing the experiment. Video Link Food Chemistry and Nutrition- Practical Manual
43 Space for Observations and Calculations Food Chemistry and Nutrition- Practical Manual 43


44 Experiment- 11- Determination of ph using ph Meter Objective To determine the ph of a given sample using ph Meter. Theory Chemists, biologists, environmentalists and lab technicians alike all use ph to measure the acidic and basic potentials of a solution. A ph meter is very useful and the most accurate tool available to test ph levels. It measures the potential usable amount of free moving hydrogen atoms versus the amount of available negatively charged protons. More hydrogen = acidic = ph number less than 7. More protons = basic = ph number greater than 7. Understanding ph Figure 16 Learn about how acids and bases are defined Acidity and alkalinity (the term used to describe bases) are both defined by the hydrogen ions they lose or accept. An acid is a substance that loses (or, some say, donates) hydrogen ions. A base is a substance that accepts additional hydrogen ions. Figure 17 Understand the ph scale The ph number is used to rate the level of acidity or alkalinity of water soluble substances. Water normally contains an equal amount of hydroxide ions (OH-) and hydronium ions (H30+). When an acidic or alkaline substance is added to water, they change the proportion of hydroxide and hydronium ions. 44 Food Chemistry and Nutrition- Practical Manual


45 It is typically said to be on a scale of 0 to 14 (though substances can actually be fall beyond that range). Neutral substances rate close to 7, acidic ones below 7, and alkaline substances are above 7. The ph scale is a logarithmic scale, meaning that differences of a single integer actually represent a tenfold difference in acidity or alkalinity. For instance, a substance that has a ph of 2 is actually ten times more acidic than one with a ph of 3 and 100 times more acidic than a substance with a ph of 4. The scale functions similarly for alkaline substances, with one integer representing a tenfold difference in alkalinity. Figure 18 Get to know why we test the ph of water Pure water should have a ph of 7, though common tap water has a ph between 6 and 5.5. Highly acidic water (water with a low ph) is more likely to dissolve toxic chemicals. These can contaminate the water and make it unsafe for human consumption. It is often considered best to test ph on site. If you collect a water sample for study in a lab, carbon dioxide in the air can dissolve into the water. The dissolved carbon dioxide reacts with the ions in the water to increase acidity in basic or neutral solutions. To prevent carbon dioxide contamination, you must test water within 2 hours of collection. Procedure Using Benchtop Model ph Meter in Laboratory Source- Figure 19 Step-1 Turn on ph meter Food Chemistry and Nutrition- Practical Manual 45


46 Figure 20 Step-2 Eait around 30 minutes for the electronics to warm up Figure 21 Step-3 Take electrode out of storage solution Figure 22 Step- 4 Rinse the electrode with distilled water 46 Food Chemistry and Nutrition- Practical Manual
47 Figure 23 Step-5 Submerse the electrode into the ph 7 buffer Figure 24 Step- 6 Press the calibrate button Figure 25 Step-7 Recalibrate Food Chemistry and Nutrition- Practical Manual 47
48 Figure 26 Step- 8 Rinse the electrode Figure 27 Step- 9 Submerse the electrode into the ph 4 buffer Figure 28 Step- 10 Wait until the ph icon stops flashing and press the measure button 48 Food Chemistry and Nutrition- Practical Manual
49 Figure 29 Step- 11 Rinse the electrode Figure 30 Step- 12 Submerse the electrode in the sample Figure 31 Step- 13 Press the measure button Food Chemistry and Nutrition- Practical Manual 49


50 Using pocket ph meter in the field Figure 32 Step- 14 Record the ph of the sample Source- Figure 33 Calibrate the probe and meter following the manufacturer specifications You may need to calibrate the meter by testing it in a substance with a known ph rating. You can then adjust the meter accordingly. If you will be testing water away from a lab, you may want to perform this calibration several hours before you take the meter to the field. Rinse the probe with clean water before using it. Dry it off with a clean tissue. Figure 34 Collect a sample of the water in a clean container 50 Food Chemistry and Nutrition- Practical Manual


51 The water sample must be deep enough to cover the tip of the electrode. Let the sample sit for a moment so the temperature can stabilize. Measure the temperature of the sample using a thermometer. Figure 35 Adjust the meter to match the sample temperature The probe's sensitivity is affected by the temperature of the water, and so the reading of the meter cannot be accurate if you do not input the temperature data. Figure 36 Put the probe into the sample Wait for the meter to come to equilibrium. The meter has reached equilibrium when the measurement becomes steady. Figure 37 Read the ph measurement of the sample Your ph meter should provide a reading on the scale of If the water is pure it should read close to 7. Record your findings. Observations and Calculations Food Chemistry and Nutrition- Practical Manual 51
52 Sample No. Sample Name Temperature of sample ( C) ph 52 Food Chemistry and Nutrition- Practical Manual
53 Space for Observations and Calculations Food Chemistry and Nutrition- Practical Manual 53
54 Theory Experiment- 12- Determination of acidity of given honey sample Food acids are usually organic acids, with citric, malic, lactic, tartaric, and acetic acids being the most common. However, inorganic acids such as phosphoric and carbonic acids (arising from carbon dioxide in solution) often play an important and even predominant role in food acidulation. The organic acids present in foods influence: Flavor (i.e., tartness) Color (through their impact on anthocyanin and other ph-influenced pigments) Prevent/retard the growth of microorganisms or inhibit the germination of spores Providing the proper environment for metal ion chelation, an important phenomenon in the minimization of lipid oxidation Organic acids may present: Naturally, By Fermentation Added as part of a specific food formulation The importance of determining food acidity 1. Determine the degree of maturity of fruits and vegetables- The titratable acidity of fruits is used, along with sugar content, as an indicator of maturity, generally the higher the maturity, the lower the acid content e.g. in the ripening process, such as tomatoes from green to mature stage, there is an increase in sugar content. 2. To determine the freshness of foods- For example in milk, the more the lactic acid levels, means that milk is rotten. 3. Acidity indicators reflect the quality of food- The amount of organic acids in food directly affects the food flavor, color, stability, and the level of quality. 4. Determination of acid on the microbial fermentation process- Such as fermentation products in soy sauce, vinegar and other acids is an important indicator of quality. There are two ways to express food acidity: 1. Titratable acidity Simple estimate of the total acid content of food Better predictor of acid impact on flavour 2. Hydrogen concentration ph Depend on the strength of acid condition Objective 54 Food Chemistry and Nutrition- Practical Manual
55 To determine the acidity of a given Honey sample. Reagents Standard Sodium Hydroxide solution 0.05 N Phenolpthalein indicator Dissolve 0.5 gm Phenolpthalein in 100 ml of 50% ethyl alcohol (v/v) Procedure 1. Take 10 gm of the sample in a suitable titration flask and dissolve in 75 ml of carbon dioxide free water. 2. Mix thoroughly. 3. Titrate against standard sodium hydroxide solution using 4-6 drops of phenolphthalein indicator till pink colour persists for 10 seconds. 4. Determine blank on water and indicator and correct the volume of sodium hydroxide solution used. Calculation Acidity as formic acid (%) by weight = 0.23 V M Where, V = corrected volume of 0.05 N Sodium Hydroxide used M = weight in gm of the sample taken for test (Ref: - I.S.I. Handbook of Food Analysis (Part II) 1984 page 37) Food Chemistry and Nutrition- Practical Manual 55
56 Space for Observations and Calculations 56 Food Chemistry and Nutrition- Practical Manual
57 Objective Experiment- 13- Determination of acidity of extracted fat in a given sample of biscuit To determine the acidity of extracted fat in a given sample of biscuit. Apparatus Soxhlet Apparatus with a 250 ml flat bottom flask. Reagents Petroleum Ether Boiling point 40 to 80 C Benzene- Alcohol Phenophthalein Stock solution To one L of distilled benzene add one L of alcohol or rectified sprit and 0.4 gm of phenophthalein. Mix the contents well. Standard sodium hydroxide solution 0.05N Procedure 1. Weigh accurately sufficient amount. of biscuit powder (20 25 gm) which will yield 3-4 gm of fat and transfer it to a thimble and plug it from the top with extracted cotton and filter paper. 2. In case of filled and coated biscuits the weight of the biscuits includes the filling and coating material. 3. Dry the thimble with the contents for 15 to 30 minutes at 100 C in an oven. Take the weight of empty dry soxhlet flask. 4. Extract the fat in the soxhlet apparatus for 3 to 4 hours and evaporate off the solvent in the flask on a water bath. 5. Remove traces of the residual solvent by keeping the flask in a hot air oven for about 30 minutes. Cool the flask. 6. Weigh accurately about 3.0 gm of extracted fat in a 250 ml conical flask and add 50 ml of mixed benzene-alcohol-phenolphthalein reagent and titrate the contents to a distinct pink color with the Sodium hydroxide solution taken in a 10 ml micro burette. 7. If the contents of the flask appear cloudy during titration add another 50 ml of the reagent titration. Make a blank titration with 50 ml of the reagent. 8. Subtract from the titer of the fat, the blank titer. Calculation Acidity of extracted fat (as oleic acid) % by weight = 28.2 V N W1 W Where, V = Volume of 0.05N Sodium hydroxide solution used in titration after subtracting the blank N= Normality of Sodium hydroxide (determined using Potassium phthalate) W1 = weight in gm of soxhlet flask containing fat W = weight in gm of the empty soxhlet flask (Ref: - IS 1011: 1992 Biscuits Specification) Food Chemistry and Nutrition- Practical Manual 57
58 Space for Observations and Calculations 58 Food Chemistry and Nutrition- Practical Manual
59 Objective Experiment- 14- Determination of reducing and non- reducing sugars in a given food sample To determine the reducing and non- reducing sugars in a given food sample. Reagents Fehling A: Dissolve g copper sulphate (CuSO 4.5H 2O) in distilled water. Dilute to 1000 ml. Filter and store in amber coloured bottle. Fehling B: Dissolve 346 g Rochelle salt (potassium sodium tartrate) (K Na C 4H 4O 6. 4H 2O) and 100 g NaOH in distilled water. Dilute to 1000 ml. Filter and store in amber coloured bottle. Carrez 1 Add 21.9 g Zinc acetate and 3 ml acetic acid in a 100 ml volumetric flask. Make up the volume with water. Carrez % aqueous solution of Potassium ferrocyanide. Methylene Blue Indicator: Prepare 1% of methylene blue solution in distilled water. Procedure 1. Weigh accurately about 5 g sample, transfer to a 200 ml volumetric flask dissolve in warm water, dilute to about 150 ml. 2. In case solution is not clear, add 5 ml of Carrez 1 solution followed by 5 ml of Carrez 2 solution. 3. Make up to 200 ml. 4. Filter through a dry filter paper. 5. Titrate the solution obtained as such to determine % Reducing sugars. Preliminary Titration: 1. Pipet 5 ml each of Fehling A and B into 250 ml conical flask. 2. Mix and add about 10 ml water and a few boiling chips or glass beads. 3. Dispense solution. 4. Heat the flask to boiling. 5. Add 3 drops of methylene blue indicator. 6. Continue the addition of solution dropwise until the blue colour disappears to a brick-red end point. The concentration of the sample solution should be such that the titre value is between 15 and 50 ml. 7. Note down the titre value. Final Titration: 1. Pipet 5 ml each of Fehling A and B. Add sample solution about 2 ml less than titre value of the preliminary titration. 2. Heat the flask to boiling with in 3 minutes and complete the titration. 3. Perform the titration duplicate and take the average. 4. Calculate the reducing sugar % as shown below. Food Chemistry and Nutrition- Practical Manual 59
60 Dilution Factor of Fehling (in gm) Reducing Sugars % = 100 Weight of Sample Titre Value Determination of Sucrose 1. Take an aliquot of the filterate obtained in Reducing sugar method and invert it with Hydrochloric acid in a water bath at 60º C by keeping for 10 minutes. 2. Cool immediately and neutralize with sodium hydroxide and finally with sodium carbonate. 3. Make upto volume and determine reducing sugar by Lane and Eynon method. Non- Reducing Sugars % (As Invert Sugar)= Dilution Factor of Fehling (in gm) Weight of Sample Titre Value Determination of Factor (for Invert Sugar) of Fehling Solution: Accurately weigh around 4.75 g of analar grade sucrose. 2. Transfer to 500 ml volume flask with 50 ml distilled water. 3. Add 5 ml conc. HCl and allow to stand for 24 hours Neutralize with NaOH solution and make up to volume. 4. Mix well and transfer 50 ml to a 100 ml volumetric flask and makeup to volume. 5. Transfer to a burette having an offset tip. 6. Perform the titration of Fehling solution following the similar procedure as above: Dilution Factor of Fehling (in gm) Fehling Factor (As Invert Sugar)= 100 Weight of Sample Titre Value [Ref: - IS: (Reaffirmed 2010) Methods of Sampling and Analysis for Sugar Confectionery] 60 Food Chemistry and Nutrition- Practical Manual
61 Space for Observations and Calculations Food Chemistry and Nutrition- Practical Manual 61
62 Objective Experiment- 15- Determination of Vitamin- C (Ascorbic Acid) in a given food sample To determine the Vitamin- C (Ascorbic Acid) in a given food sample. Theory The ascorbic acid content in fruits and vegetables can be estimated by macerating the sample with stabilising agents such as 20% metaphosphoric acid. Principle 2, 6 -dichlorophenol indophenol is reduced to a colourless form by ascorbic acid. The reaction is specific for ascorbic acid at ph 1 to 3.5. The dye is blue in alkaline solution and pink in acid. Reagents 1. Standard Indophenol Solution 1.1. Dissolve 0.05 gm 2, 6 dichlorophenol indophenol in 50 ml water, to which 42 mg sodium carbonate is added, and make upto 200 ml. with water and filter Sodium carbonate is added for stability purpose The dye solution keeps for a few weeks if stored in refrigerator. Prepare fresh if possible and standardize before use. Blank correction: 1.4. Dissolve 50 mg 2, 6-dichloroindophenol Na salt that has been stored in desiccator over soda lime, in 50 ml H2O to which has been added 42 mg NaHCO3; shake vigorously, and when dye dissolves, dilute to 200 ml with H2O Filter through fluted paper into amber glass-stoppered bottle Keep stoppered, out of direct sunlight, and store in refrigerator Decomposition products that make end point in distinct occur in some batches of dry indophenol and also develop with time in stock solution Add 5.0 ml extracting solution containing excess ascorbic acid to 15 ml dye reagent If reduced solution is not practically colorless, discard, and prepare new stock solution If dry dye is at fault, obtain new supply.) Transfer three 2.0 ml aliquots ascorbic acid standard solution to each of three 50 ml Erlenmeyers containing 5.0 ml HPO3 CH3COOH solution, B(a)(1) Titrate rapidly with indophenol solution from 50 ml burette until light but distinct rose pink persists 5 s Each titration should require ca 15 ml indophenol solution, and titrations should check within 0.1 ml) Similarly titrate 3 blanks composed of 7.0 ml HPO3 CH3COOH solution, B(a)(1), plus volume H2O ca equal to volume indophenol solution used in direct titrations After substracting average blanks (usually ca 0.1 ml) from standardization titrations, calculate and express concentration of indophenol solution as mg ascorbic acid equivalent to 1.0 ml reagent. 62 Food Chemistry and Nutrition- Practical Manual
63 1.16. Standardize indophenol solution daily with freshly prepared ascorbic acid standard solution. 2. Standard Ascorbic acid solution Dissolve 0.05 gm pure ascorbic acid in 60 ml of 20% metaphosphoric acid (HPO3) and dilute with water to exactly 250 ml in a volumetric flask. 3. Metaphosphoric acid - 20 % 4. Acetone Standardisation of Dye 1. Pipette 10 ml of standard Ascorbic acid solution in a small flask and titrate with indophenol solution until a faint pink colour persists for 15 seconds. 2. Express the concentration as mg Ascorbic acid equivalent to 1 ml of dye solution i.e. 10 ml of Ascorbic acid solution = gm ascorbic acid. 3. If gm ascorbic acid requires V ml dye solution to neutralize it then 1 ml dye solution = 0.002/V gm ascorbic acid. Procedure 1. Pipette 50 ml of unconcentrated juice (or the equivalent of concentrated juice) into a 100 ml volumetric flask, add 25 ml of 20% metaphosphoric acid as stabilizing agent and dilute to volume. 2. Pipette 10 ml in a small flask and add 2.5 ml acetone. 3. Titrate with indophenol solution until a faint pink colour persists for 15 seconds. Calculation Vitamin C (mg/100ml juice) = 20 *(V) *(C) Where, V = ml indophenols solution, C = Vitamin C per ml indophenol solution Note Acetone may be omitted if sulphur dioxide is known to be absent. Its function is to form the acetone bisulphate complex with sulphur dioxide which otherwise interferes with the titration. Sometime a small proportion of the ascorbic acid in foods becomes reversibly oxidized during aging and forms dehydroascorbic acid. If this is suspected, first estimate the ascorbic acid as above, then through another portion of the solution pass a stream of Hydrogen sulphide for 10 minutes. Stopper the flask and allow it to stand overnight in a refrigerator. Then remove hydrogen sulphide by bubbling nitrogen through the mixture and titrated as before. The difference between the two titrations gives a measure of the dehydroascorbic acid. One international unit of vitamin C = 50 μg ascorbic acid. (Ref :- FAO Manuals of Food Quality Control 14 / 8, page 194 / Pearson s Composition and Analysis of Foods 9th edn,1991, page 264 and AOAC Official Method Ascorbic acid in Vitamin preparation and juices ) Food Chemistry and Nutrition- Practical Manual 63
64 Space for Observations and Calculations 64 Food Chemistry and Nutrition- Practical Manual
65 Experiment- 16- Determination of Diastase enzyme (α- amylase) activity in a given food sample by Falling Number test Objective To determine the Diastase enzyme (α- amylase) activity in a given food sample by Falling Number test. Theory The Falling Number test provides an index of -amylase in a ground wheat or flour sample. The procedure relies on the reduction in viscosity of starch paste caused by the action of -amylase. The method is based on the unique ability of alpha-amylase to liquefy a starch suspension. Gelatinization strength is measured by falling number as time in seconds required stirring and allowing the stirrer to fall a measured distance through hot aqueous flour gel undergoing liquefaction. The starch gelatinizes, and the -amylase liquefies the resultant paste. The time it takes (in seconds) for the viscometer stirring rod to fall through the starch paste is the Falling Number. Wheat sample made from sprout-damaged wheat can have a Falling Number of 100s or less. Bread wheat with average -amylase activity has a falling Number of approximately 250s. The upper limit for the Falling Number test is approximately 400s, which occurs for wheat devoid of -amylase. Requirements Analytical balance Wheat grains Grinder Falling Number apparatus Procedure 1. Ensure that the water level in the gauge is up to the mark. 2. Ensure that water connection for cooling of the instrument. 3. Switch on the mains. 4. The distilled water in bath is brought to boil. 5. Weigh 7 g of g ground wheat, transfer it to viscometric tube, and add 25 ml of distilled water, rubber the tube and shake vigorously for obtaining a uniform suspension. 6. Remove stopper and push down flour adhering to sides with the viscometer stirrer. 7. Place the tube with stirrer in the boiling water bath. Start the timer and the instrument. 8. After 5 seconds, automatic stirring starts at the rate of 2 stirs/seconds for 60 seconds. 9. After a total of 60 seconds stirring automatically stops releasing the stirrer at its uppermost position and allows falling by its weight at a fixed distance and time is recorded in seconds Precautions Ensure that the discharge hose is placed in the sink. The water tap should be on for cooling the apparatus. Handle the viscometer tube gently. Observations Food Chemistry and Nutrition- Practical Manual 65
66 Wheat Grains Falling Number (s) Variety 1 Variety 2 Variety 3 Mean Standard Deviation Hard wheat Soft wheat Interpretation of results Falling number (in seconds) Interpretation Below 150 Sprouted wheat, high alpha-amylase activity Normal alpha-amylase activity. 300 and above Amylase activity too low. 66 Food Chemistry and Nutrition- Practical Manual
67 Space for Observations and Calculations Food Chemistry and Nutrition- Practical Manual 67

68 Objective Experiment- 17- Identification of pigments in a given food sample by paper chromatography To identify different pigments present in a given food sample by paper chromatography. Theory The word chromatography originated from two greek words 'chroma' meaning 'colour' and 'graphine' meaning 'to write'. Chromatography means colour writing and it was first employed by a Russian scientist Mikhail Tsvet. This method was first used for the separation of coloured substances in plants. In the chromatographic technique, the mixture of substances is applied onto a phase called the stationary phase. The stationary phase may be solid or liquid. A moving phase that can be a pure solvent or a mixture of solvents, or a gas is allowed to move slowly over the stationary phase. This moving phase is called the mobile phase. When the mobile phase is moved over the mixture on the stationary phase, the components of the mixture gradually separates from one another. Paper Chromatography In paper chromatography, the stationary phase is a special quality paper called chromatography paper. Mobile phase is a solvent or a mixture of solvents. A solution of the mixture is spotted on a line about 2 cm above from the bottom of the paper, called original line or base line and then suspended in a chromatography chamber containing suitable solvent. The solvent rises up the paper by capillary action and flows over the spot. The paper selectively retains different components according to their differing partition in the two phases. The paper strip so developed is called Chromatogram. The spots of the separated coloured compounds are visible at different heights from the position of initial spot on the chromatogram. The spots of the separated colourless components may be observed either under ultraviolet light or by the use of an appropriate spray reagent. The distance travelled by the solvent from the original line is called solvent front. The relative adsorption of each component of the mixture is expressed in terms of its Retardation factor (R f) (Retention factor). R f = Distance travelled by the component from the original line Distance travelled by the solvent from the original line Figure 38 Paper Chromatography 68 Food Chemistry and Nutrition- Practical Manual
69 Requirements Procedure Figure 39 Requirement for Paper Chromatography experiment 1. Take a Whatman filter paper strip and using a pencil draw a horizontal line 4cm from one end of the paper. Then draw another line lengthwise (verticallly) from the centre of the paper. Name the point at which the two lines intersect as P. 2. Using a fine capillary tube, put a drop of the extract of spinach leaves at the point P. Let it dry in air. 3. Put another drop on the same spot and dry again, so that the spot is rich in the leaf extract. 4. Pour equal amounts of isopropyl alcohol and distilled water into a chromatographic chamber and mix it well using a glass rod. This is used as the solvent. 5. Suspend the filter paper vertically in the chromatographic chamber containing the solvent in such a way that the pencil line remains about 2cm above the solvent level. 6. Close the jar with its lid and keep it undisturbed. 7. Notice the rising solvent along with the coloured components of the leaf extract. 8. After the solvent has risen to about 15 cm you will notice two different spots of coloured components on the filter paper. 9. Take the filter paper out of the jar and using a pencil mark the distance that the solvent has risen on the paper. This is called the solvent front. 10. Dry the filter paper and put pencil marks at the centre of each spot. 11. Measure the distance of each spot from the original line and the distance of the solvent front from the original line. 12. Calculate the Rf values of different components of leaf extract by using the formula, R f = Distance travelled by the component from the original line Distance travelled by the solvent from the original line Precautions Use good quality pencil for drawing the reference line so that the mark does not dissolve in the solvent in which the chromatography is carried out. Always use a fine capillary tube. Food Chemistry and Nutrition- Practical Manual 69
70 Keep the jar undisturbed and covered during the experiment. The spot should be small and rich in mixture. Allow the spot to dry before putting the strip in the jar. Keep the strip erect. Do not let it curl. Do not allow the spot to dip in the solvent. Observations Sl. No Component 1. Orange (Carotene) 2. Yellow (Xanthophyll) 3. Light green (Chlorophyll a) 4. Dark green (Chlorophyll b) Distance travelled by the component from the original line (cm) Distance travelled by the solvent from the original line (cm) Rf value Inference Rf value of orange (Carotene) = Rf value of Yellow (Xanthophyll) =.. Rf value of Light green (Chlorophyll a) =.. Rf value of Dark green (Chlorophyll b) =.. 70 Food Chemistry and Nutrition- Practical Manual
71 Space for Observations and Calculations Food Chemistry and Nutrition- Practical Manual 71
72 Objective To observe the effect of baking soda in CO 2 production. Theory Experiment- 18- Effect of Baking Soda in CO 2 production Baking soda (NaHCO 3) Sodium bicarbonate has the property of releasing CO 2 when it is heated: 2NaHCO 3 Na 2CO 3 + H 2O + CO 2 Vinegar (HC 2H3O2) is a solution of acetic acid. It reacts with baking soda, sodium bicarbonate (NaHCO 3), to produce carbon dioxide gas (CO 2) and an aqueous solution of sodium acetate (NaC 2H 3O 2). The reaction can be written as follows: Requirements Safety Goggles Balloon Bottle with a narrow neck Funnel or straw Water Vinegar Baking soda Procedure NaHCO3 (aq) + HC2H3O2 (aq) > CO2 (g) + H2O (l) + NaC2H3O2 (aq) Pour about an inch of liquid (half vinegar, half water) into the bottle. Use the funnel to fill the balloon half full of baking soda. Stretch the open end of the balloon over the neck of the bottle. Make sure it's on tight. Let the heavy end of the balloon dangle, so no baking soda goes in the bottle. Hold onto the balloon at the bottle neck, and pick up the heavy part of the balloon so that all the baking soda falls into the vinegar at the bottom of the bottle. If the balloon does not begin to expand right away, shake the soda bottle slightly to mix the baking soda and vinegar. 72 Food Chemistry and Nutrition- Practical Manual
73 Space for Observations and Calculations Food Chemistry and Nutrition- Practical Manual 73
74 Objective Experiment- 19- Detection of Saccharine in beverages To test the presence of Saccharine in the given sample of beverage. Procedure 1. Curdle an aliquot of the diluted sample (about 25 ml) with dilute acetic acid. 2. Shake well and filter. 3. Acidify the clear filtrate with 2.0 ml of concentrated hydrochloric acid, and extract with two 25 ml portions of diethyl ether. 4. Draw off the aqueous layers and wash the combined ether extract with three successive portions of 5 ml of water, evaporate the ether extract on a water bath, add a drop or two of water, mix well with glass rod and taste a little. 5. A characteristic sweet taste indicates the presence of saccharin. 6. Confirm by heating with NaOH and detecting Salicylic acid from thereby. Conversion to salicylic acid 1. Acidify about ml of filterate obtained above and extract with three portions of ether as above. 2. Wash ether extract with two 5 ml portions of water, evaporate greater portion of ether in porcelain dish on steam bath, let remainder evaporate spontaneously and add 1 drop of 0.5% (v/v) neutral FeCl3 solution. 3. Violet colour indicates Salicylic acid. (Ref: A.O.A.C. 17 th edn,2000 Official Method Saccharin in Food read with A.O.A.C. Official Method Salicylic acid in Food and Beverages) 74 Food Chemistry and Nutrition- Practical Manual
75 Space for Observations and Calculations Food Chemistry and Nutrition- Practical Manual 75


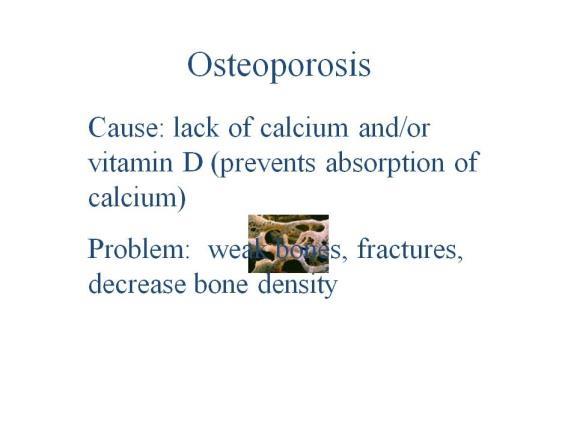
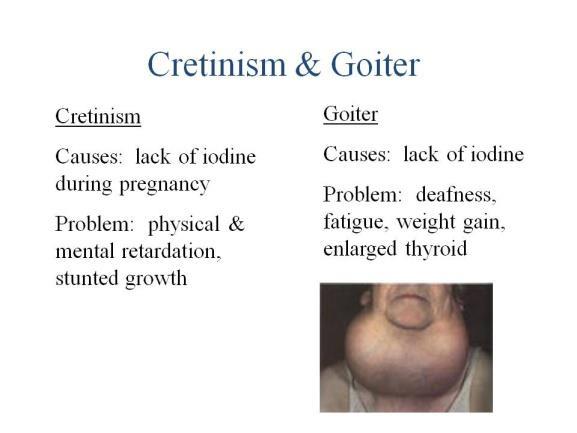
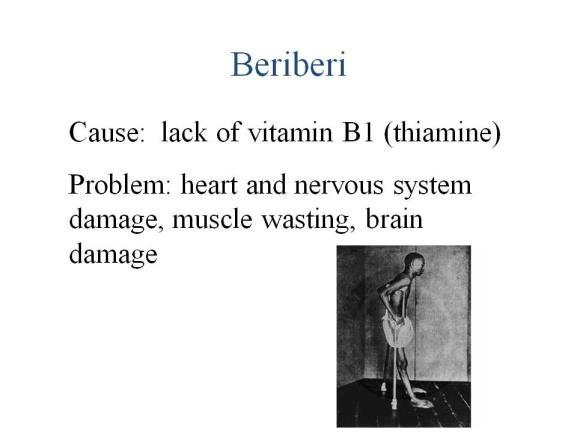
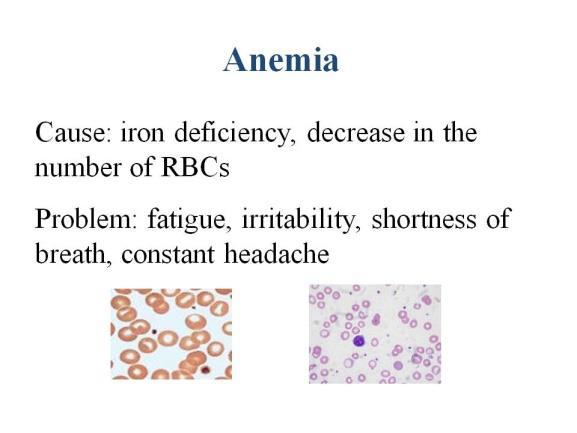
76 Objective Experiment- 20- Visit to hospital/slide show on various nutritional deficiency disorders To know about various nutritional deficiency disorders. Presentation 76 Food Chemistry and Nutrition- Practical Manual


77 Food Chemistry and Nutrition- Practical Manual 77
Kjeldahl Method. Quantiative analysis
 e-learning for Quantiative analysis Kjeldahl Method Introduction Nitrogen is one of the five major elements found in organic materials such as protein. This fact was recognized by a Danish chemist, Johan
Synthesis of Benzoic Acid
 E x p e r i m e n t 5 Synthesis of Benzoic Acid Objectives To use the Grignard reagent in a water free environment. To react the Grignard reagent with dry ice, CO 2(s). To assess the purity of the product
Tex-620-J, Determining Chloride and Sulfate Contents in Soil
 Contents in Soil Contents: Section 1 Overview...2 Section 2 Sample Preparation...3 Section 3 Ion Chromatography Method...5 Section 4 Wet Chemical Method...9 Section 5 Archived Versions...15 Texas Department
Flushing Out the Moles in Lab: The Reaction of Calcium Chloride with Carbonate Salts
 Flushing Out the Moles in Lab: The Reaction of Calcium Chloride with Carbonate Salts Pre-lab Assignment: Reading: 1. Chapter sections 3.3, 3.4, 3.7 and 4.2 in your course text. 2. This lab handout. Questions:
using simple distillation and paper chromatography practical to obtain a
 2.11 Core practical: Investigate the composition of inks using simple distillation and paper chromatography Paper 1 & 2 Topic 1 What do you need to be able to do? Practical: Description Investigate the
Name: Date: AP Chemistry. Titrations - Volumetric Analysis. Steps for Solving Titration Problems
 Name: Date: AP Chemistry Titrations - Volumetric Analysis Term Volumetric analysis Burette Pipette titrate titre aliquot end point equivalence point indicator primary standard standardisation secondary
SpeedDigester K-436, K-439 / KjelFlex K-360 Nitrogen Determination in Nitrate-Free Fertilizer according to the micro-kjeldahl Method 074/2011
 SpeedDigester K-436, K-439 / KjelFlex K-360 Nitrogen Determination in Nitrate-Free Fertilizer according to the micro-kjeldahl Method 074/2011 074/2011 SpeedDigester K-436 / K-439 KjelFlex K-360 SHORT NOTE
GRIGNARD REACTION Synthesis of Benzoic Acid
 1 GRIGNARD REACTION Synthesis of Benzoic Acid In the 1920 s, the first survey of the acceleration of chemical transformations by ultrasound was published. Since then, many more applications of ultrasound
Experiment 8 Introduction to Volumetric Techniques I. Objectives
 Experiment 8 Introduction to Volumetric Techniques I Objectives 1. To learn the proper technique to use a volumetric pipette. 2. To learn the proper technique to use a volumetric flask. 3. To prepare a
Part II. Cu(OH)2(s) CuO(s)
2(s) CuO(s)") The Copper Cycle Introduction In this experiment, you will carry out a series of reactions starting with copper metal. This will give you practice handling chemical reagents and making observations. It
The Copper Cycle Introduction In this experiment, you will carry out a series of reactions starting with copper metal. This will give you practice handling chemical reagents and making observations. It
Unit 5 Part 2 Acids, Bases and Salts Titrations, Indicators and the ph Scale UNIT 5 ACIDS, BASES AND SALTS
 UNIT 5 ACIDS, BASES AND SALTS PART 2 TITRATIONS, INDICATORS AND THE PH SCALE Contents 1. The ph scale 2. Indicators 3. Acid-Base Titrations Key words: acidic, alkaline, neutral, ph, indicator, litmus,
Minneapolis Community and Technical College. Separation of Components of a Mixture
 Minneapolis Community and Technical College Chemistry Department Chem1020 Separation of Components of a Mixture Objectives: To separate a mixture into its component pure substances. To calculate the composition
Chem 2115 Experiment #10. Acids, Bases, Salts, and Buffers
 Chem 2115 Experiment #10 Acids, Bases, Salts, and Buffers OBJECTIVE: The goal of this series of experiments is to investigate the characteristics of acidic and basic solutions. We will explore the neutralization
Chapter 9. Volumetric Analysis
 Chapter 9 Volumetric Analysis The terms volumetric analysis, titrimetry and titration are used interchangeably to describe a procedure which analyses chemicals in solution by accurate volume measurement.
LEAD (Colorimetric) 2. Muffle Furnace: Equipped with pyrometer and capable of operating at controlled temperatures up to 500 C
 2. Muffle Furnace: Equipped with pyrometer and capable of operating at controlled temperatures up to 500 C") LEADX.01-1 LEAD (Colorimetric) PRINCIPLE SCOPE Organic matter in the sample is destroyed by ignition in the presence of sulfuric acid. The residue is dissolved in dilute acid, and the lead is complexed
LEADX.01-1 LEAD (Colorimetric) PRINCIPLE SCOPE Organic matter in the sample is destroyed by ignition in the presence of sulfuric acid. The residue is dissolved in dilute acid, and the lead is complexed
AP Chemistry Lab #5- Synthesis and Analysis of Alum (Big Idea 1 & 2)
") www.pedersenscience.com AP Chemistry Lab #5- Synthesis and Analysis of Alum (Big Idea 1 & 2) 1.A.1: Molecules are composed of specific combinations of atoms; different molecules are composed of combinations
www.pedersenscience.com AP Chemistry Lab #5- Synthesis and Analysis of Alum (Big Idea 1 & 2) 1.A.1: Molecules are composed of specific combinations of atoms; different molecules are composed of combinations
NCERT. [H O] Since water is in large excess, its concentration can be assumed to be constant and combining it with K provides a new constant K w
![NCERT. [H O] Since water is in large excess, its concentration can be assumed to be constant and combining it with K provides a new constant K w](/thumbs/74/71110555.jpg "NCERT. [H O] Since water is in large excess, its concentration can be assumed to be constant and combining it with K provides a new constant K w") UNIT-5 PH AND PH CHANGE IN AQUEOUS SOLUTIONS YOU have already performed experiments on dynamic equilibrium between unionised salt and the ions produced by it on dissolving in a solvent. In this unit we
UNIT-5 PH AND PH CHANGE IN AQUEOUS SOLUTIONS YOU have already performed experiments on dynamic equilibrium between unionised salt and the ions produced by it on dissolving in a solvent. In this unit we
CHEMISTRY CORE PRACTICALS
 CHEMISTRY CORE PRACTICALS Science (9-1) Combined Science / Chemistry Core Practicals www.chemistryinfo.co.uk Modified 23/03/2018 (MJB) Core Practical INDEX Paper 1 Paper 2 CP1a: Topic: 2.11 Investigate
Determination of the K a of a Weak Acid and the K b of a Weak Base from ph Measurements
 Experiment 6 Determination of the K a of a Weak Acid and the K b of a Weak Base from ph Measurements Pre-Lab Assignment Before coming to lab: Read the lab thoroughly. Answer the pre-lab questions that
Experiment 12: Grignard Synthesis of Triphenylmethanol
 1 Experiment 12: Grignard Synthesis of Triphenylmethanol Reactions that form carbon-carbon bonds are among the most useful to the synthetic organic chemist. In 1912, Victor Grignard received the Nobel
Experiment 7: Titration of an Antacid
 1 Experiment 7: Titration of an Antacid Objective: In this experiment, you will standardize a solution of base using the analytical technique known as titration. Using this standardized solution, you will
Experiment 7: ACID-BASE TITRATION: STANDARDIZATION OF A SOLUTION
 Experiment 7: ACID-BASE TITRATION: STANDARDIZATION OF A SOLUTION Purpose: Determine molarity of a solution of unknown concentration by performing acid-base titrations Performance Goals: Apply the concepts
EXPERIMENTS. Testing products of combustion: Reducing Copper(III) Oxide to Copper. Page 4
 Oxide to Copper. Page 4") APPARATUS Page 2 APPARATUS Page 3 Reducing Copper(III) Oxide to Copper EXPERIMENTS Page 4 Testing products of combustion: EXPERIMENTS Showing that oxygen and water is needed for rusting iron Page 5 Showing
APPARATUS Page 2 APPARATUS Page 3 Reducing Copper(III) Oxide to Copper EXPERIMENTS Page 4 Testing products of combustion: EXPERIMENTS Showing that oxygen and water is needed for rusting iron Page 5 Showing
To see how this data can be used, follow the titration of hydrofluoric acid against sodium hydroxide:
 Weak Acid Titration v010516 You are encouraged to carefully read the following sections in Tro (3 rd ed.) to prepare for this experiment: Sec 4.8, pp 168-174 (Acid/Base Titrations), Sec 16.4, pp 769-783
--> Buy True-PDF --> Auto-delivered in 0~10 minutes. GB Translated English of Chinese Standard: GB5009.
 Translated English of Chinese Standard: GB5009.17-2014 www.chinesestandard.net Sales@ChineseStandard.net NATIONAL STANDARD OF GB THE PEOPLE S REPUBLIC OF CHINA National Food Safety Standard-Determination
RAPID KJELDAHL BENCHNOTES
 RAPID KJELDAHL BENCHNOTES Methodology for the Determination of Alcohol in a Mixture by Direct Distillation with the RapidStill II Principle: This method covers the determination of percent alcohol in distilled
CIE Chemistry A-Level Practicals for Papers 3 and 5
 CIE Chemistry A-Level Practicals for Papers 3 and 5 Rate of Reaction Disappearing cross: Change in rate of the reaction of sodium thiosulphate with hydrochloric acid as temperature is changed: Na 2 S 2
LACTIC ACID. The method is applicable to the determination of lactic acid and lactate salts (Note 2) in light or heavy steepwater.
 in light or heavy steepwater.") LACTI.01-1 LACTIC ACID PRINCIPLE SCOPE Lactic acid in steepwater (Note 1) is oxidized to acetaldehyde following treatment with copper sulfate and calcium hydroxide to remove interfering substances. Acetaldehyde
LACTI.01-1 LACTIC ACID PRINCIPLE SCOPE Lactic acid in steepwater (Note 1) is oxidized to acetaldehyde following treatment with copper sulfate and calcium hydroxide to remove interfering substances. Acetaldehyde
General Chemistry I CHEM-1030 Laboratory Experiment No. 2 Physical Separation Techniques
 General Chemistry I CHEM-1030 Laboratory Experiment No. 2 Physical Separation Techniques Introduction When two or more substances that do not react chemically are blended together, the components of the
Acid-Base Titration Acetic Acid Content of Vinegar
 Acid-Base Titration Acetic Acid Content of Vinegar Prelab Assignment Read the entire lab. Write an objective and any hazards associated with this lab in your laboratory notebook. On a separate sheet of
5072 CHEMISTRY (NEW PAPERS WITH SPA) TOPIC 1: EXPERIMENTAL CHEMISTRY 5067 CHEMISTRY (NEW PAPERS WITH PRACTICAL EXAM) TOPIC 1: EXPERIMENTAL CHEMISTRY
 TOPIC 1: EXPERIMENTAL CHEMISTRY 5067 CHEMISTRY (NEW PAPERS WITH PRACTICAL EXAM) TOPIC 1: EXPERIMENTAL CHEMISTRY") 5072 CHEMISTRY (NEW PAPERS WITH SPA) TOPIC 1: EXPERIMENTAL CHEMISTRY 5067 CHEMISTRY (NEW PAPERS WITH PRACTICAL EXAM) TOPIC 1: EXPERIMENTAL CHEMISTRY SUB-TOPIC 1.2 METHODS OF PURIFICATION AND ANALYSIS LEARNING
5072 CHEMISTRY (NEW PAPERS WITH SPA) TOPIC 1: EXPERIMENTAL CHEMISTRY 5067 CHEMISTRY (NEW PAPERS WITH PRACTICAL EXAM) TOPIC 1: EXPERIMENTAL CHEMISTRY SUB-TOPIC 1.2 METHODS OF PURIFICATION AND ANALYSIS LEARNING
EXPERIMENT #4 Separation of a Three-Component Mixture
 OBJECTIVES: EXPERIMENT #4 Separation of a Three-Component Mixture Define chemical and physical properties, mixture, solubility, filtration, sublimation, and percent Separate a mixture of sodium chloride
EXPERIMENT: LIMITING REAGENT. NOTE: Students should have moles of reactants in DATASHEET converted into masses in grams prior to the lab period.
 Revised 12/2015 EXPERIMENT: LIMITING REAGENT Chem 1104 Lab NOTE: Students should have moles of reactants in DATASHEET converted into masses in grams prior to the lab period. INTRODUCTION Limiting reactant
Chemistry Determination of Mixed Acids
 Chemistry 3200 Acid-base titration is one of the most common operations in analytical chemistry. A solution containing an unknown amount of ionizable hydrogen can be titrated with a solution of standard
Introduction to Work in Laboratory
 INSTITUTE OF MEDICAL BIOCHEMISTRY AND LABORATORY MEDICINE Introduction to Work in Measuring volumes, filtration, centrifugation, solubility, separation Practical in Medical Biochemistry General Medicine
Scientific Observations and Reaction Stoichiometry: The Qualitative Analysis and Chemical Reactivity of Five White Powders
 Scientific Observations and Reaction Stoichiometry: The Qualitative Analysis and Chemical Reactivity of Five White Powders Objectives Part 1: To determine the limiting reagent and percent yield of CuCO
Form 4 Chapter 7: Acid and Bases
 Form 4 Chapter 7: Acid and Bases The ph Scale Properties Acids Alkalis Physical. Substances that ionized in water to produce hydrogen ions.. Sour taste.. Turn blue litmus paper red. 4. Give a ph value
To measure ph s in a variety of solutions and mixtures and to account for the results obtained.
 Acid-Base Studies PURPOSE To measure ph s in a variety of solutions and mixtures and to account for the results obtained. GOALS 1 To learn to use ph paper and a ph meter to measure the ph of a given solution.
Experiment 18 - Absorption Spectroscopy and Beer s Law: Analysis of Cu 2+
 Experiment 18 - Absorption Spectroscopy and Beer s Law: Analysis of Cu 2+ Many substances absorb light. When light is absorbed, electrons in the ground state are excited to higher energy levels. Colored
not to be republished NCERT YOU are already aware that a substance is analysed to establish its qualitative TITRIMETRIC ANALYSIS UNIT-6
 UNIT-6 TITRIMETRIC ANALYSIS YOU are already aware that a substance is analysed to establish its qualitative and quantitative chemical composition. Thus, chemical analysis can be categorised as qualitative
INTRODUCTION TO ACIDS, BASES AND TITRATION
 Experiment INTRODUCTION TO ACIDS, BASES AND TITRATION The CCLI Initiative Computers in chemistry Laboratory Instruction LEARNING OBJECTIVES The objectives of this experiment are to... introduce the nature
PRACTICAL 3 ph AND BUFFERS
 PRACTICAL 3 ph AND BUFFERS ph and Buffers Structure 3.1 Introduction 3.2 ph and Buffers: Basic Concept 3.2.1 ph 3.2.2 Buffers and Buffer Solutions 3.3 Methods for Determining ph Experiment 1: Measurement
To understand concept of limiting reagents. To learn how to do a vacuum filtration. To understand the concept of recrystallization.
 E x p e r i m e n t Synthesis of Aspirin Experiment : http://genchemlab.wordpress.com/-aspirin/ objectives To synthesize aspirin. To understand concept of limiting reagents. To determine percent yield.
For this lab, you will determine the purity of the aspirin by titration and by spectrophotometric analysis.
 Introduction: ommercially prepared aspirin tablets are not considered 100% pure acetylsalicylic acid. Most aspirin tablets contain a small amount of binder which helps prevent the tablets from crumbling.
11. Introduction to Acids, Bases, ph, and Buffers
 11. Introduction to Acids, Bases, ph, and Buffers What you will accomplish in this experiment You ll use an acid-base indicating paper to: Determine the acidity or basicity of some common household substances
Application Note No. 310/2018
 Application Note No. 310/2018 Nitrogen determination in compound fertilizer according to Devarda KjelFlex K-360 with Devarda Splash Protector, Metrohm Titrino 877 www.buchi.com Quality in your hands 1.
O H 3 O 1 1 A. O 1 1 OH (K w
 CHAPTER 8 Acid Base Titration Curves Objectives The objectives of this experiment are to: Understand the titration curves for the following solutions: a strong acid: hydrochloric acid, HCl. a weak acid:
Practical 1 Procedure Iron by Titrimetry
 Practical 1 Procedure Iron by Titrimetry Introduction This experiment quantifies Fe 2+, ferrous iron, by reacting it with ceric sulphate in a 1:1 reaction, i.e. one mole of ferrous iron reacts with one
Determinations by Atomic Absorption Spectroscopy and Inductively Coupled Plasma-Atomic Emission
 0 chapter Sodium and Potassium Determinations by Atomic Absorption Spectroscopy and Inductively Coupled Plasma-Atomic Emission Spectroscopy 67 S. S. Nielsen (ed.), Food Analysis Laboratory Manual Springer
Nitrogen Determination by Kjeldahl (Block Digestion(
 National Forage Testing Association -Forage Analysis Procedures Nitrogen Determination by Kjeldahl (Block Digestion( Scope : This method is applicable for the determination of nitrogen (N) in all types
PREPARATIVE TASK GRAND PRIX CHIMIQUE PETNICA SCIENCE CENTER, VALJEVO, SERBIA 9 TH -14 TH OCTOBER 2017
 GRAND PRIX CHIMIQUE PETNICA SCIENCE CENTER, VALJEVO, SERBIA 9 TH -14 TH OCTOBER 2017 PREPARATIVE TASK Preparation of p-nitroacetanilide Preparation of vanillyl alcohol SUPPORTED BY Serbian Chemical Society
Determination of Reducing Sugar Content: Clinitest, Benedict s Solution and the Rebelein Titration
 Determination of Reducing Sugar Content: Clinitest, Benedict s Solution and the Rebelein Titration Chemical Concepts and Techniques: The most important sugars present in wine and fruit juice are the hexoses
Naming salts. Metal Acid Salt. Sodium hydroxide reacts with Hydrochloric acid to make Sodium chloride
 Naming salts A salt is any compound formed by the neutralisation of an acid by a base. The name of a salt has two parts. The first part comes from the metal, metal oxide or metal carbonate. The second
GCE. Chemistry. A2 Practical Support Document. Revised GCE
 GCE Revised GCE Chemistry A2 Practical Support Document For first teaching from September 2016 A2 Practical Support Document 1 Carrying out experiments to determine the rate of a reaction using a variety
Set 4 Marking Scheme: Acid Bases & Salts 2010
 Set 4 Marking Scheme: Acid Bases & Salts 00 ACID AND BASES PAPER : STRUCTURE (a) Neutralisation KOH + H SO 4 K SO 4 + H O Correct formulae of reactants and products Balanced equation i. H +, OH -, K +
IGCSE(A*-G) Edexcel - Chemistry
 Edexcel - Chemistry") IGCSE(A*-G) Edexcel - Chemistry Principles of Chemistry Atoms NOTES 1.8 Describe and explain experiments to investigate the small size of particles and their movement including: Dilution of coloured solutions
IGCSE(A*-G) Edexcel - Chemistry Principles of Chemistry Atoms NOTES 1.8 Describe and explain experiments to investigate the small size of particles and their movement including: Dilution of coloured solutions
Chem 2115 Experiment #7. Volumetric Analysis & Consumer Chemistry Standardization of an unknown solution, analysis of vinegar & antacid tablets
 Chem 2115 Experiment #7 Volumetric Analysis & Consumer Chemistry Standardization of an unknown solution, analysis of vinegar & antacid tablets OBJECTIVE: The goals of this experiment are to learn titration
The Synthesis and Analysis of Aspirin
 The Synthesis and Analysis of Aspirin Computer 22 Aspirin, the ubiquitous pain reliever, goes by the chemical name acetylsalicylic acid. One of the compounds used in the synthesis of aspirin is salicylic
The Synthesis of Gun Cotton and TATP
 CHEM 121L General Chemistry Laboratory Revision 1.1 The Synthesis of Gun Cotton and TATP Learn about the Synthesis of "Energetic" Materials. Learn about the Safe Handling of Caustic Substances. In this
THE CATHOLIC UNIVERSITY OF EASTERN AFRICA A. M. E. C. E. A
 THE CATHOLIC UNIVERSITY OF EASTERN AFRICA A. M. E. C. E. A MAIN EXAMINATION P.O. Box 62157 00200 Nairobi - KENYA Telephone: 891601-6 Fax: 254-20-891084 E-mail:academics@cuea.edu JANUARY APRIL 2014 TRIMESTER
1. Introduction. 2. Equipment. 3. Chemicals and Materials
 1. Introduction Nitrogen and protein determination in food and feed are described in numerous standard procedures [1-3]. Therein, the titration specifications vary between boric acid and back titration.
Examples of Strong Acids: Strong Acid Formula Common Source Hydrochloric Acid HCl Stomach Acid
 ACIDS AND BASES: PH AND BUFFERS PURPOSE: To determine the ph of common acids and bases using a ph meter, ph paper, and red cabbage indicator. To test the effect of adding an acid or base to a buffer solution.
Experiment 8 and 9 Weak Acids and Bases: Exploring the Nature of Buffers
 Experiment 8 and 9 Weak Acids and Bases: Exploring the Nature of Buffers Pre-Laboratory Assignments Reading: Textbook Chapter 16 Chapter 17:1-3 This Laboratory Handout Pre-Laboratory Assignments: Complete
Application Note No. 197/2015 Nitrogen and protein determination in dairy products Nitrogen determination in sodium nitrate
 Application Note No. 197/2015 Nitrogen and protein determination in dairy products Nitrogen determination in sodium nitrate KjelDigester K-449, KjelMaster K-375 with KjelSampler K-376: Accelerated Nitrogen
CH2MHILL GILROY/MORGAN HILL LABORATORY LABORATORY STANDARD OPERATING PROCEDURE NO TOTAL KJELDAHL NITROGEN - TKN SM 4500-N org.
 CH2MHILL GILROY/MORGAN HILL LABORATORY LABORATORY STANDARD OPERATING PROCEDURE NO. 709 TOTAL KJELDAHL NITROGEN - TKN SM 4500-N org. B I. SCOPE AND APPLICATIONS A. The kjeldahl method determines nitrogen
HYSICAL AND CHEMICAL PROPERTIES AND PHYSIC AND CHEMICAL CHANGES
 Experiment 4 Name: 15 P HYSICAL AND CHEMICAL PROPERTIES AND PHYSIC AND CHEMICAL CHANGES 13 Al e In this experiment, you will also observe physical and chemical properties and physical and chemical changes.
BUREAU OF INDIAN STANDARDS. Draft Indian Standard. SPECIFICATION FOR BASIC CHROMIUM SULPHATE (FOR TANNING) (First revision of IS 6301) ICS:
 (First revision of IS 6301) ICS:") For Comments only DOC: CHD 17 (1618)C BUREAU OF INDIAN STANDARDS Draft Indian Standard SPECIFICATION FOR BASIC CHROMIUM SULPHATE (FOR TANNING) (First revision of IS 6301) ICS: 59.140.10 (Not to be reproduced
For Comments only DOC: CHD 17 (1618)C BUREAU OF INDIAN STANDARDS Draft Indian Standard SPECIFICATION FOR BASIC CHROMIUM SULPHATE (FOR TANNING) (First revision of IS 6301) ICS: 59.140.10 (Not to be reproduced
Determination of an Equilibrium Constant
 Last updated 1/29/2014 - GES Learning Objectives Students will be able to: Determine the numerical value of an equilibrium constant from measured concentrations of all reaction species. Use an absorption
Advanced Unit 7: Chemistry Practical Examination (SET A) Candidates must have: Scientific calculator Ruler
 Candidates must have: Scientific calculator Ruler") Write your name here Surname Other names Pearson Edexcel International Advanced Level Centre Number Candidate Number Chemistry Advanced Unit 7: Chemistry Practical Examination (SET A) Monday 8 May 2017
Write your name here Surname Other names Pearson Edexcel International Advanced Level Centre Number Candidate Number Chemistry Advanced Unit 7: Chemistry Practical Examination (SET A) Monday 8 May 2017
Acid-Base Titration. M M V a
 Acid-Base Titration Pre-Lab Discussion In the chemistry laboratory, it is sometimes necessary to experimentally determine the concentration of an acid solution or a base solution. A procedure for making
Ascorbic Acid Titration of Vitamin C Tablets
 Ascorbic Acid Titration of Vitamin C Tablets Part A. Preparation of Vitamin C Tablet Solutions 1. Obtain two vitamin C tablets. Place a plastic weighing boat on the balance, and press zero to tare the
Recovery of Copper Renee Y. Becker Manatee Community College
 Recovery of Copper Renee Y. Becker Manatee Community College Introduction In this lab we are going to start with a sample of copper wire. We will then use a sequence of reactions to chemically transform
Chlorobenzene from Aniline via the Sandmeyer Reaction. August 21, By ParadoxChem126. Introduction
 Chlorobenzene from Aniline via the Sandmeyer Reaction August 21, 2014 By ParadoxChem126 Introduction Chlorobenzene is a useful chemical in organic syntheses. It dissolves a wide range of organic compounds,
Experimental Procedure. Lab 406
 Experimental Procedure Lab 406 Overview This experiment is to be complete in cooperation with other chemists/chemist groups in the laboratory. In PART A, a standardized solution of hydrochloric acid is
# 12 ph-titration of Strong Acids with Strong Bases
 # 12 ph-titration of Strong Acids with Strong Bases Purpose: A strong acid solution is titrated with a strong base solution. A titration curve is then used to determine the endpoint and find the concentration
Application Note No. 116 / 2013 Nitrogen determination in sodium nitrate
 Application Note No. 116 / 2013 Nitrogen determination in sodium nitrate KjelMaster K-375: Determination of nitrogen in sodium nitrate according the the Devarda method 1. Introduction An easy, quick and
SYNTHESIS OF 1-BROMOBUTANE Experimental procedure at macroscale (adapted from Williamson, Minard & Masters 1 )
") SYNTHESIS OF 1-BROMOBUTANE Experimental procedure at macroscale (adapted from Williamson, Minard & Masters 1 ) Introduction 1-bromobutane is a primary alkyl halide (primary alkyl) and therefore it is produced
SYNTHESIS OF 1-BROMOBUTANE Experimental procedure at macroscale (adapted from Williamson, Minard & Masters 1 ) Introduction 1-bromobutane is a primary alkyl halide (primary alkyl) and therefore it is produced
Aspirin Lab By Maya Parks Partner: Ben Seufert 6/5/15, 6/8/15
 Aspirin Lab By Maya Parks Partner: Ben Seufert 6/5/15, 6/8/15 Abstract: This lab was performed to synthesize acetyl salicylic acid or aspirin from a carboxylic acid and an alcohol. We had learned in class
Acids and Bases. How does ph affect biological solutions? Introduction. Prelab Preparation Review Section 2.3 on acids and bases in your textbook.
 Acids and Bases How does ph affect biological solutions? Learning Objectives To relate the ph scale to how acidic or basic a solution is. To explain how a buffer affects the ph of a solution. Process Objectives
Experiment#1 Beer s Law: Absorption Spectroscopy of Cobalt(II)
") : Absorption Spectroscopy of Cobalt(II) OBJECTIVES In successfully completing this lab you will: prepare a stock solution using a volumetric flask; use a UV/Visible spectrometer to measure an absorption
: Absorption Spectroscopy of Cobalt(II) OBJECTIVES In successfully completing this lab you will: prepare a stock solution using a volumetric flask; use a UV/Visible spectrometer to measure an absorption
Experiment 11: Dehydration of Cyclohexanol
 Experiment 11: Dehydration of yclohexanol INTRODUTION In this experiment, cyclohexanol is dehydrated by aqueous sulfuric acid to produce cyclohexene as the sole product [equation (1)], and no rearrangement
Aspirin Synthesis H 3 PO 4
 Aspirin Synthesis Experiment 10 Aspirin is the common name for the compound acetylsalicylic acid, widely used as a fever reducer and as a pain killer. Salicylic acid, whose name comes from Salix, the willow
Citric Acid Analysis L-6-1. MOISTURE (Karl Fischer)
") Citric Acid Analysis L-6-1 MOISTURE (Karl Fischer) PRINCIPLE SCOPE The sample is dissolved in a mixture of methanol and formamide (50:50 v/v) and then titrated with standardized Karl Fischer reagent. The
Citric Acid Analysis L-6-1 MOISTURE (Karl Fischer) PRINCIPLE SCOPE The sample is dissolved in a mixture of methanol and formamide (50:50 v/v) and then titrated with standardized Karl Fischer reagent. The
GETTING THE END POINT TO APPROXIMATE. Two hours
 Chem 1312 Handout Experiment ONE Laboratory Time Required Special Equipment and Supplies Objective Safety First Aid GETTING THE END POINT TO APPROXIMATE THE EQUIVALENCE POINT Two hours Balance Potassium
H 3 O + (aq) + P 2- (aq)
 + P 2- (aq)") PURPOSE: To standardize a solution of sodium hydroxide by titration with a primary standard, (KHC 8 H 4 O 4 ), potassium hydrogen phthalate (KHC 8 H 4 O 4 ) PRINCIPLES: Most shelf reagents, such as 0.10
PURPOSE: To standardize a solution of sodium hydroxide by titration with a primary standard, (KHC 8 H 4 O 4 ), potassium hydrogen phthalate (KHC 8 H 4 O 4 ) PRINCIPLES: Most shelf reagents, such as 0.10
Exercise 2-2. Titration of a Strong Acid EXERCISE OBJECTIVES
 Exercise 2-2 Titration of a Strong Acid EXERCISE OBJECTIVES To describe the effect of a ph variation on a chemical indicator; To titrate water containing a strong base solution with a strong acid solution;
3. Separation of a Mixture into Pure Substances
 3. Separation of a Mixture into Pure Substances Paper Chromatography of Metal Cations What you will accomplish in this experiment This third experiment provides opportunities for you to learn and practice:
Cl 2(g) + NaCl + H 2 O. light. 2Cl. Once formed, the chlorine radical can react with the heptane as shown below: + Cl
 + NaCl + H 2 O. light. 2Cl. Once formed, the chlorine radical can react with the heptane as shown below: + Cl") Experiment Free Radical Chlorination of Heptane In today s experiment, you will be chlorinating n-heptane with chlorine atoms (radicals) to form monochlorination products of that alkane. You will analyze
Experiment Free Radical Chlorination of Heptane In today s experiment, you will be chlorinating n-heptane with chlorine atoms (radicals) to form monochlorination products of that alkane. You will analyze
CALCIUM (EGTA-Titrimetric)
") CALCI.01-1 CALCIUM (EGTA-Titrimetric) PRINCIPLE SCOPE Organic matter in the sample is destroyed by ignition in the presence of sulfuric acid. After dissolution of the residue in dilute acid and following
CALCI.01-1 CALCIUM (EGTA-Titrimetric) PRINCIPLE SCOPE Organic matter in the sample is destroyed by ignition in the presence of sulfuric acid. After dissolution of the residue in dilute acid and following
Ascorbic Acid Titration of Vitamin C Tablets
 Ascorbic Acid Titration of Vitamin C Tablets Introduction This experiment illustrates how titration, the process of slowly adding one solution to another until the reaction between the two is complete,
Application Note No. 191/2015 TKN determination in water and waste water
 Application Note No. 191/2015 TKN determination in water and waste water KjelDigester K-449, KjelMaster K-375 with KjelSampler K-376: Colorimetric determination of TKN (Total Kjeldahl Nitrogen) in water
CH 112 Special Assignment #4 Chemistry to Dye for: Part C
 CH 112 Special Assignment #4 Chemistry to Dye for: Part C PRE-LAB ASSIGNMENT: Make sure that you read this handout and bring the essentials to lab with you. Review Light, energy and color (pp 17-18), Measuring
EXPERIMENT THREE THE CANNIZARO REACTION: THE DISPROPORTIONATION OF BENZALDEHYDE
 EXPERIMENT THREE THE CANNIZARO REACTION: THE DISPROPORTIONATION OF BENZALDEHYDE H C O HO C O H H C OH KOH 2x + DISCUSSION In planning the laboratory schedule, it should be observed that this experiment
Acids, Bases, Salts, and Buffers
 Acids, Bases, Salts, and Buffers Investigation questions Parts 1 and 2 What is ph and how is it related to the identity and concentration of the substance in a solution? What is a salt? Introduction I.
Physical and Chemical Properties of Matter Lab
 Physical and Chemical Properties of Matter Lab Purpose To introduce the student to physical and chemical properties of matter and their use for the identification and separation of compounds. Each student
INTRODUCTION TO MATTER: CLASSI F ICATION OF MATTER, PHYSICAL AND C He MICAL PROPERTIES, AND PHYSICAL AND CHEMICAL CHANGES
 Experiment 3 Name: INTRODUCTION TO MATTER: 9 4 CLASSI F ICATION OF MATTER, PHYSICAL AND C He MICAL e PROPERTIES, AND PHYSICAL AND CHEMICAL CHANGES In this experiment, you will encounter various classification
Chemistry *P41555A0120* P41555A. Unit: KCH0/4CH0 Paper: 2C. Edexcel Certificate Edexcel International GCSE. Monday 10 June 2013 Afternoon Time: 1 hour
 Write your name here Surname Other names Edexcel Certificate Edexcel International GCSE Chemistry Unit: KCH0/4CH0 Paper: 2C Centre Number Candidate Number Monday 10 June 2013 Afternoon Time: 1 hour You
ph AND WATER Comparable substance
 BACKGROUND ph AND WATER ph 15 The ph of a solution is a measure of its hydrogen ion (H + ) concentration. A solution with the same amount of H + as pure water has a ph value of 7 and is said to be neutral.
METHODS OF SAMPLING AND TEST FOR PAINTS, VARNISHES AND RELATED PRODUCTS
 FOR BIS USE ONLY DOC:CHD 20 (1805)C1 May 2011 BUREAU OF INDIAN STANDARDS Draft Indian Standard METHODS OF SAMPLING AND TEST FOR PAINTS, VARNISHES AND RELATED PRODUCTS PART 8 TESTS FOR PIGMENTS AND OTHER
IGCSE (9-1) Edexcel - Chemistry
 Edexcel - Chemistry") IGCSE (9-1) Edexcel - Chemistry Principles of Chemistry Element, Compounds and Mixtures NOTES 1.8: Understand how to classify a substance as an element, compound or mixture Classifications: S Class Element
IGCSE (9-1) Edexcel - Chemistry Principles of Chemistry Element, Compounds and Mixtures NOTES 1.8: Understand how to classify a substance as an element, compound or mixture Classifications: S Class Element