Chemical Kinetic Retention and Transport in Soils and Geological Media
|
|
|
- Mark Warner
- 6 years ago
- Views:
Transcription
1 Software Models for Chemical Kinetic Retention and Transport in Soils and Geological Media htpp:/ User s Manual Magdi Selim School of Plant, Environmental and Soil Science mselim@agctr.lsu.edu 2016
2 LIST OF MODELS BATCH KINETIC Simulations Models: Nonlinear Kinetic (NKM) Langmuir Kinetic (LKM) Multireaction Model (MRM) Second Order Two-Site (SOTS) Stir-Flow with MRM (STIRFLOW-MRM) Thin-Disk Flow with MRM (THINDISK-MRM) Competitive-MRM Fitting Models: Multireaction Model (MRM-FIT) Second Order Two-Site (SO-FIT) Competitive MRM (CMRM-FIT) TRANSPORT Simulations Models: Multireaction and Transport Model (MRTML) Second Order Two-Site (SOTSL) SOTS Mobile-Immobile (SOMIM) Competitive-MRTM (CMRM) MRTM Mobile Immobile (MRTM_MIM) Ion-Exchange Transport Model (ION-EXCH) Model for Mixed Media (MRTM-MIXED) Tracer Transport (TRACER) Fitting Models: Multireaction Model (MRTM-FIT) Second Order Two-Site (SOT-FIT) Second Order Mobile-Immobile (SOMIM-FIT) Multireaction-Immobile Model (MRTM-MIM-FIT) Competitive-Multireaction (CMRTM-FIT)
3 Overview Chem_Transport is a software package of several models that describe the transport and sorption of chemicals in soils and other porous media. These models are characterized by two main features; they are nonlinear and kinetic in nature. The models represent our recent advances made in the understanding of transport characteristics of chemicals in soils and geological media. The models are broad in nature and address various physical and chemical processes that influence the behavior of solutes in porous media. Chem_Transport models are applicable for variety of chemicals in field settings as well as controlled laboratory and greenhouse environments. The models represent transport conditions and batch type reactors under no-flow conditions where transport is ignored. For each class of models, first simulation type models where the user provides all physical and chemical parameters. This class of models are most suitable for classroom teaching and risk assessment. The second class of models is that where the user provides an experimentally measured data set and a selected model will provide best-fit (based on non-linear least-squares) description of measured results. Chem_Transport models are based on solutions of the advective-dispersive equation for the transport of chemicals in one-dimensional soils and geological media. The solutions are based on numerical approximations using finite difference (Crank-Nickolson) techniques. Physical Nonequilibrium Models Uniform and stratified soils Multiple Regions Multiple Porosities Fractured Media, mobile-immobile Kinetic Sorption Models Nonlinear and Langmuir Kinetics Desorption-Hysteresis Second-Order Kinetic Ion Exchange Multi-Site and Multireaction
4 Applications of Chem_Transport Users The models presented are applicable for chemicals including organics and inorganics, e.g., insecticides, herbicides, industrial chemicals, military explosives, and radionuclides. Other include macro nutrients; nitrogen, phosphorus and potassium, as well as micronutrients, e.g., boron, zinc, and copper. Others also include heavy metals such as arsenic, lead, cobalt, cadmium, trace elements and tracer. Teaching - Can be incorporated in classroom teaching for undergraduate and graduate students in chemical and civil engineering, hydrology, geology, soil physics and chemistry, environmental sciences and environmental engineering. Simulations based on various scenarios provide information on system parameters (sensitivity analysis) and risk assessment. Research - This software should be also useful to environmental scientists, engineers, and geologists whose desire is to describe laboratory or field observations under various constraints such as batch reactors, miscible displacements, and transport in saturated and unsaturated soils. This software should also be useful for federal and state agencies, researchers, consulting engineers, and decision makers in the management and restoration of contaminated sites. System Requirements The software runs on Windows platform and a recent version of Java is required to install and execute this software on personal computers. Input and Output Data Files An input file must be provided by the user. The input file specifies initial and boundary conditions associated with each model and can be provided in two ways: i. Manual entry by filling out the template provided. ii. As an external ASII file (,dat or txt). Samples of input data files in ASCII format for all models are give in INPUTFILES folder to be downloaded by the user. Samples of input files in a template format are included in this package. Model output is given in txt format and must be named and saved by the user. Graphics of simulations and experimental measurements are also generated which can be saved by the user. Graphics include breakthrough curves, timedependent sorption-desorption and sorption isotherms. Message to Users User s feedback on this software package is important to help improve the structure and provide a user friendly environment. 4

5 Types of Models In this software package, two classes of models are presented. Transport Models Sorption or Kinetic Batch Models Transport models are a set of models which account for the simultaneous transport and retention of chemicals in soils. Sorption or Kinetic batch models are a set of models which deal with the kinetic retention (adsorption-desorption) of chemicals in soils when water (mass) flow of water is negligible. This is often the case for sorption and release experiments where laboratory batch methods are used. 5

6 Kinetic and transport models are further classified into two types Simulation Models Fitting Models Simulation models are those models; subject to the appropriate initial and boundary conditions that provide calculations of chemical retention and transport, for a given set of model parameters; flux, equilibrium rate coefficient, forward and backward rates of reactions, etc. As such, these generic models can provide information on the role of each or combination of model parameters on the chemical behavior in soils. In this mode, it is recommended for teaching for senior undergraduate and graduate students in various disciplines. Fitting models are more complex than the simulation or generic models. Each model utilizes nonlinear least-square approximation procedure to find best estimates of model parameters that describe a set of experimental observations. As such, the user must identify a set of model parameter for which estimates are sought (inverse-modeling). For a given model, different model processes best describe the experimental data. To achieve this, several attempts of combination of model parameters are often sought. = 6

7 Sorption or Kinetic Batch Models Soils and other geochemical systems are quite complex, and various sorption reactions are likely to occur. In general, chemical retention processes with matrix surfaces have been quantified by scientists using a number of empirically-based approaches. One approach represents equilibrium-type reactions and the other of the kinetic type. In this software, emphasis is on kinetic type retention models. Kinetic models represent slow reactions where the amount of solute sorption or transformation is a function of contact time. Most commonly encountered is the first-order kinetic reversible reaction for describing timedependent adsorption/desorption in soils. Others include linear irreversible and nonlinear reversible kinetic models. Recently, combination of equilibrium and kinetic type (two-site) models, and consecutive and concurrent multireaction type models has been proposed. 7
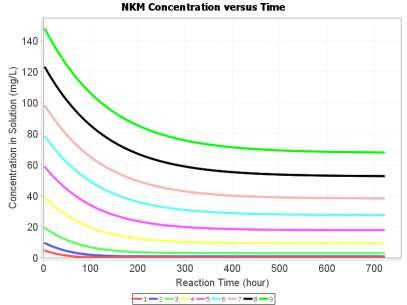
8 SIMULATION MODELS 1. Nonlinear Kinetic Model (NKM) Kinetic sorption which exhibit nonlinear or curve linear retention behavior is commonly observed between the amount sorbed S (mg/g soil) and solution concentration C (mg/ml) for several reactive chemicals such as trace elements and heavy metals. To describe such nonlinear behavior, the following fully reversible nonlinear kinetic reaction is used, S b k f C kbs t (1) where the parameters k f and k b represent the forward and backward rates of reactions (h -1 ) for the retention mechanism, respectively and b is a dimensionless parameter commonly less than unity. The magnitudes of the rate coefficients dictate the extent of kinetic behavior of retention of the solute from the soil solution. For small values of k f and k b, the rate of retention is slow and strong kinetic dependence is anticipated. The parameter b is a measure of the extent of the heterogeneity of sorption sites of the soil matrix where sorption sites have different affinities for heavy metal retention by matrix surfaces, where sorption by the highest energy sites takes place preferentially at the lowest solution concentrations. Moreover, for b=1, equation 1 reduced to a first order (linear) kinetic equation.. At large times (i.e, as t ), the rate of retention approaches zero, equation (1) yields, b k f S K f C where K f k b which is analogous from to the Freundlich equilibrium equation where K f is the solute partitioning coefficient (cm 3 /g). Therefore, one may regard the parameter K f as the ratio of the rate coefficients for sorption (forward reaction) to that for desorption or release (backward reaction). This model also accounts for irreversible sorption or a sink of the linear type, S t s k C s where S s is the amount irreversible sorbed (mg/g soil) and k s is the rate of irreversible retention. (2) (3) 8
. A sample of the input data file referred as NKM-IPUT.")
9 Input and Output Data Files An input file must be provided by the user for the selected model. The input model specifies initial and boundary conditions and can be provided in two different ways: a. Manual entry by filling out the template provided below. b. As an external ASII file (,dat or txt). A sample of the input data file referred as NKM-IPUT.DAT and is given in the INPUTFILES folder to be downloaded by the user. For a given initial concentration (Ci) and input concentration (Cs) at time t > 0, the model provides results of concentration, the amount sorbed versus time, and sorption isotherms. Model output is given in txt format and must be named and saved by the user. Graphics of simulations are also generated which can be saved by the user. Graphics include time-dependent sorption-desorption and sorption isotherms. Template for the NKM model 9
10 10
11 11
12 2. Langmuir Kinetic Model (LKM) Here we follow second-order formulation, where one assumed that the retention mechanisms are site-specific where the rate of reaction is a function of the solute concentration present in the soil solution phase (C) and the amount of available or unoccupied sites (μg/g soil), such that k k f C S (4) b where k f and k b are the associated rate coefficients (hr) and S the total amount of solute retained by the soil matrix. As a result, the rate of solute retention may be expressed as, S = k f C - kb S t or S k f ( ST S) C - kb S t (5) where S T (μg/g soil) represents the total amount of total sorption sites or sorption capacity (ug/ml). This model also accounts for irreversible sorption or a sink of the linear type, S t s k C s where S s is the amount irreversible sorbed (mg/g soil) and k s is the rate of irreversible retention. As the sites become occupied by the retained solute, the amount of vacant sites approaches zero ( 0 ) and the amount of solute retained by the soil approaches that of the total capacity of sites, i.e., S S T. Vacant specific sites are not strictly vacant. They are assumed occupied by hydrogen, hydroxyl or by other specifically sorbed species. As t, i.e. when the reaction achieves local equilibrium, the rate of retention becomes, S k f k C - k 0, or = = f b S C kb Upon further rearrangement, the second order formulation, at equilibrium, obeys the widely recognized Langmuir isotherm equation, S KC = S 1 KC T (8) (7) (6) 12

13 where the parameter K ( = k f / k b ) is now equivalent to ω of Eq. (7) and represents Langmuir equilibrium constant. Sorption/desorption studies showed that highly specific sorption mechanisms are responsible for solute retention at low concentrations. The general view was that metal ions have a high affinity for sorption sites of oxide minerals surfaces in soils. In addition, these specific sites react slowly with reactive chemicals such as heavy metals and are weakly reversible. Input and Output Data Files An input file must be provided by the user for the selected model. The input model specifies initial and boundary conditions and can be provided in two different ways: a. Manual entry by filling out the template provided below. b. As an external ASII file (,dat or txt). A sample of the input data file referred as LKM-IPUT.DAT and is given in the INPUTFILES folder to be downloaded by the user. For a given initial concentration (Ci) and input concentration (Cs) at time t > 0, the model provides results of concentration, the amount sorbed versus time, and sorption isotherms. Model output is given in txt format and must be named and saved by the user. Graphics of simulations are also generated which can be saved by the user. Graphics include time-dependent sorption-desorption and sorption isotherms. Template for the LKM model 13
14 14
15 15
16 A schematic representation of the multireaction model (MRM). Multireaction Model (MRM-BATCH) A schematic representation of the multireaction model is shown in Fig. 3. In this model we consider the solute to be present in the soil solution phase (C) and in five phases representing solute retained by the soil matrix as S e, S 1, S 2, S 3 and S irr. We further assume that S e, S 1 and S 2 are in direct contact with the solution phase and are governed by concurrent type reactions. Here we assume S e is the amount of solute that is sorbed reversibly and is in equilibrium with C at all times. Specifically, the multireaction assumes that the total amount sorbed S T or simply S as the total amount retained reversibly or reversibly by soil matrix surfaces, S S + S + S + S S e irr The governing equilibrium retention/release mechanism is the nonlinear Freundlich type as S e = K f C b where K f is the associated distribution coefficient (cm 3 kg -1 ) and b is a dimensionless Freundlich parameter (b < 1). Other equilibrium type retention mechanisms are given in Chapter 3. This includes linear (b=1), Langmuir, two-site Langmuir, and others. 16
17 The retention/release reactions associated with S 1, S 2, and S 3 are concurrent or consecutive type kinetic reactions. Specifically, the S 1 and S 2 phases were considered to be in direct contact with C and reversible rate coefficients of the (nonlinear) kinetic type govern their reactions, S1 n = k1 C - k 2 S1 t S 2 m = k3 C - ( k4 + k5 ) S 2 + k t S 3 = k5 S 2 - k6 S 3 t where k 1 and k 2 are the forward and backward rates coefficients (h -1 ), respectively and n is the reaction order associated with S 1. Similarly, k 3 and k 4 are the rate coefficients and m is the reaction order associated with S 2, and k 5 and k 6 are the reaction parameters associated with S 3. In the absence of the consecutive reaction between S 2 and S 3, that is if S 3 = 0 at all times (k 5 =k 6 =0), eq 6 S 3 (44) reduces to, S t 2 = k 3 C m - k 4 S 2 Thus eq. (7) for S 2 resembles that for S 1 except for the magnitude of the associated parameters k 3, k 4 and m. The sorbed phases (S e, S 1, S 2, S 3 ) may be regarded as the amounts sorbed on surfaces of soil particles and chemically bound to Al and Fe oxide surfaces or other types of surfaces, although it is not necessary to have a priori knowledge of the exact retention mechanisms for these reactions to be applicable. These phases may be characterized by their kinetic sorption and release behavior to the soil solution and thus are susceptible to leaching in the soil. In addition, the primary difference between these two phases not only lie in the difference in their kinetic behavior but also on the degree of nonlinearity as indicated by the parameters n and m. The sink/source term Q is commonly used to account for irreversible reactions such as precipitation/dissolution, mineralization, and immobilization, among others. We expressed the sink term as a first-order kinetic process; 17
18 where k s is the associated rate coefficient (h -1 ). The sink term Q was expressed in terms of a firstorder irreversible reaction for reductive sorption or precipitation or internal diffusion. Equation (13) is similar to that for diffusion-controlled precipitation reaction if one assumes that the equilibrium concentration for precipitation is negligible. Input and Output Data Files S Q= t An input file must be provided by the user for the selected model. The input model specifies initial and boundary conditions and can be provided in two different ways: a. Manual entry by filling out the template provided below. b. As an external ASII file (,dat or txt). = k s C A sample of the input data file referred as MRM-IPUT.DAT and is given in the INPUTFILES folder to be downloaded by the user. For a given initial concentration (Ci) and input concentration (Cs) at time t > 0, the model provides results of concentration, the amount sorbed versus time, and sorption isotherms. Model output is given in txt format and must be named and saved by the user. Graphics of simulations are also generated which can be saved by the user. Graphics include time-dependent sorption-desorption and sorption isotherms. 3 18

19 Template for the MRM model 19
20 20
21 Inflow Solution S 1 k 1 k2 Chemical in the soil solution k 3 k 4 S2 Outflow Solution Schematic diagram of a two-site model for kinetic adsorption-desorption of chemicals in soils. 4. Second-Order Two-Site Model (SOTS) In this model, it is assumed that a soil contains a maximum adsorption or total retention capacity or sites (S max ). Furthermore, the total sites can be partitioned into two types such that, =( S ) +( S Smax max 1 max 2 where (S max ) 1 and (S max ) 2 are the total amount of type 1 sites and type 2 sites, respectively. If F represents the fraction of type 1 sites to the total amount of sites or the adsorption capacity for an individual soil, we thus have ) Based on second order formulation, the retention reaction of each site is governed by ( Smax ) = F Smax and ( Smax ) 2=(1 - F ) S 1 max t S 1 = k ( ( ) 1 S C - for type 1 sites max1 S 1 k2 S1 and 21
22 t S 2 = k 3 ( S S 2 C - S 2 for type sites max 2 ) 4 2 where k 1 and k 2 (h -1 ) are forward and backward rate coefficients for type 1 sites, whereas k 3 and k 4 are rate coefficients for type 2 reaction sites, respectively. In addition, Θ is the soil water content (cm 3 cm -3 ), ρ is the soil bulk density (g cm -3 ), and t is time (h). As t, i.e., when both sites achieve local equilibrium, eq. (7) and (8) yield the following expressions. and S1 k1 k 1 1 C - k 2 S 1= 0, or = = 1 for type1 sites C k 2 S2 k3 k 3 2 C - k 4 S 2= 0, or = = 2 for type 2 sites C k Here ω 1 and ω 2 represent equilibrium constants for the retention reactions associated with type 1 and type 2 sites, respectively. The formulation of eq. (9) and (10) are analogous to expressions for homovalent ion-exchange equilibrium reactions. Further rearrangement yields the following expressions for the amounts retained by type 1 and 2 sites at t, ( S S 1 max 1 C =, ) 1+ 1 C 1 and ( S S 2 max 1 C = ) 1+ 2 C 2 Therefore, the total amount sorbed in the soil S (=S 1 +S 2 ), is S S max 1 C = 1+ 1 C 2 C F + ( 1- F 1+ 2 C ) Equation (12) is analogous to the two-site Langmuir formulation where the amount sorbed in each region is clearly expressed. Such Langmuir formulations are commonly used to obtain independent parameter estimates for S max and the affinity constants ω 1 and ω 2. 22
. A sample of the input data file referred as SOTS-IPUT.")
23 Input and Output Data Files An input file must be provided by the user for the selected model. The input model specifies initial and boundary conditions and can be provided in two different ways: a. Manual entry by filling out the template provided below. b. As an external ASII file (,dat or txt). A sample of the input data file referred as SOTS-IPUT.DAT and is given in the INPUTFILES folder to be downloaded by the user. For a given initial concentration (Ci) and input concentration (Cs) at time t > 0, the model provides results of concentration, the amount sorbed versus time, and sorption isotherms. Model output is given in txt format and must be named and saved by the user. Graphics of simulations are also generated which can be saved by the user. Graphics include time-dependent sorption-desorption and sorption isotherms. Template for the SOTS model 23
24 24
25 25
26 Stir-Flow Model (STIRFLOW-MRM) The reactivity and transport of a solute species inn the soil system under stir-flow conditions can be represented by, C q S = ( C C in out ) t t V T Where C is the solution concentration (mg/l), q is the rate of flow (ml/h), ρ soil bulk density (g/cm 3 ), θ volumetric water content (cm 3 /cm 3 ) and V T is the volume of the vessel (ml). Moreover, C in and C out are concentration and in the input and effluent, respectively. In this formulation, it is assumed that C is similar to the effluent concentration C out and that solute sorption is based on multi-reaction model formulation. As such we consider the solute to be present in the soil solution phase (C) and in five phases representing solute retained by the soil matrix as S e, S 1, S 2, S 3 and S irr. We further assume that S e, S 1 and S 2 are in direct contact with the solution phase and are governed by concurrent type reactions. Here we assume S e is the amount of solute that is sorbed reversibly and is in equilibrium with C at all times. Specifically, the multireaction assumes that the total amount sorbed S T or simply S as the total amount retained reversibly or reversibly by soil matrix surfaces, S = S e+ S 1+ S 2+ S 3 The governing equilibrium retention/release mechanism is the nonlinear Freundlich type as S e = K f C b where K f is the associated distribution coefficient (cm 3 kg -1 ) and b is a dimensionless Freundlich parameter (b < 1). Other equilibrium type retention mechanisms are given in Chapter 3. This includes linear (b=1), Langmuir, two-site Langmuir, and others. The retention/release reactions associated with S 1, S 2, and S 3 are concurrent or consecutive type kinetic reactions. Specifically, the S 1 and S 2 phases were considered to be in direct contact with C and reversible rate coefficients of the (nonlinear) kinetic type govern their reactions, 26
27 Stirred-flow reactor connected to a reservoir of a solute solution through a pump and the effluent is being collected by a fraction collector. S t 1 = k 1 C n - k 2 S 1 S t 2 = k 3 C m - ( k 4 + k 5 ) S 2 + k 6 S 3 S t 3 = k 5 S 2 - k 6 S 3 where k 1 and k 2 are the forward and backward rates coefficients (h -1 ), respectively and n is the reaction order associated with S 1. Similarly, k 3 and k 4 are the rate coefficients and m is the reaction order associated with S 2, and k 5 and k 6 are the reaction parameters associated with S 3. In the 27
28 absence of the consecutive reaction between S 2 and S 3, that is if S 3 = 0 at all times (k 5 =k 6 =0), eq (44) reduces to, S t 2 = k 3 C m - k 4 S 2 Thus eq. (7) for S 2 resembles that for S 1 except for the magnitude of the associated parameters k 3, k 4 and m. The sorbed phases (S e, S 1, S 2, S 3 ) may be regarded as the amounts sorbed on surfaces of soil particles and chemically bound to Al and Fe oxide surfaces or other types of surfaces, although it is not necessary to have a priori knowledge of the exact retention mechanisms for these reactions to be applicable. These phases may be characterized by their kinetic sorption and release behavior to the soil solution and thus are susceptible to leaching in the soil. In addition, the primary difference between these two phases not only lie in the difference in their kinetic behavior but also on the degree of nonlinearity as indicated by the parameters n and m. The sink/source term Q is commonly used to account for irreversible reactions such as precipitation/dissolution, mineralization, and immobilization, among others. We expressed the sink term as a first-order kinetic process; where k s is the associated rate coefficient (h -1 ). In this presentation, the notations k s and k irr are used interchangeably through this manual. The sink term Q was expressed in terms of a first-order irreversible reaction for reductive sorption or precipitation or internal diffusion. This equation is similar to that for diffusion-controlled precipitation reaction if one assumes that the equilibrium concentration for precipitation is negligible. S Q= t 3 = k s C Flow interruption is accounted for in this model where the flow rate q is set equal to zero. As a result, reactions between the soil matrix and solution continue and accounted for by the model where no flow is taking place. 28
. A sample of the input data file referred as STIRFLOW-MRM -IPUT.")
29 Input and Output Data Files An input file must be provided by the user for the selected model. The input model specifies initial and boundary conditions and can be provided in two different ways: a. Manual entry by filling out the template provided below. b. As an external ASII file (,dat or txt). A sample of the input data file referred as STIRFLOW-MRM -IPUT.DAT and is given in the INPUTFILES folder to be downloaded by the user. For a given initial concentration (Ci) and input concentration (Cs) at time t > 0, the model provides results of concentration, the amount sorbed versus time, and sorption isotherms. Model output is given in txt format and must be named and saved by the user. Graphics of simulations are also generated which can be saved by the user. Graphics include time-dependent sorption-desorption. Template for the STIRFLOW-MRM model 29
30 30
, q is the rate of flow (ml/h), ρ soil bulk density (g/cm 3 ), θ volumetric water content (cm 3 /cm 3 ), and d and A are the thickness and cross-sectional area of")
31 Thin-Disk Flow Model (THINDISK-MRM) The reactivity and transport of a solute species in the soil system under thin-disk flow conditions can be represented by, C q S = ( C C in out ) t t d A Where C is the solution concentration (mg/l), q is the rate of flow (ml/h), ρ soil bulk density (g/cm 3 ), θ volumetric water content (cm 3 /cm 3 ), and d and A are the thickness and cross-sectional area of the thin-disk, respectively. Moreover, C in and C out are concentration and in the input and effluent, respectively. In this formulation, it is assumed that C is similar to the effluent concentration C out and that solute sorption is based on multi-reaction model formulation. As such we consider the solute to be present in the soil solution phase (C) and in five phases representing solute retained by the soil matrix as S e, S 1, S 2, S 3 and S irr. We further assume that S e, S 1 and S 2 are in direct contact with the solution phase and are governed by concurrent type reactions. Here we assume S e is the amount of solute that is sorbed reversibly and is in equilibrium with C at all times. Specifically, the multireaction assumes that the total amount sorbed S T or simply S as the total amount retained reversibly or reversibly by soil matrix surfaces, Thin-disk flow method experimental setup. Background solute solution is pumped from the reservoir into the thin disk and the effluent is being collected by a fraction collector. 31
32 S = S e+ S 1+ S 2+ S 3 The governing equilibrium retention/release mechanism is the nonlinear Freundlich type as S e = K f C b where K f is the associated distribution coefficient (cm 3 kg -1 ) and b is a dimensionless Freundlich parameter (b < 1). Other equilibrium type retention mechanisms are given in Chapter 3. This includes linear (b=1), Langmuir, two-site Langmuir, and others. The retention/release reactions associated with S 1, S 2, and S 3 are concurrent or consecutive type kinetic reactions. Specifically, the S 1 and S 2 phases were considered to be in direct contact with C and reversible rate coefficients of the (nonlinear) kinetic type govern their reactions, S t 1 = k 1 C n - k 2 S 1 S t 2 = k 3 C m - ( k 4 + k 5 ) S 2 + k 6 S 3 S t 3 = k 5 S 2 - k 6 S 3 where k 1 and k 2 are the forward and backward rates coefficients (h -1 ), respectively and n is the reaction order associated with S 1. Similarly, k 3 and k 4 are the rate coefficients and m is the reaction order associated with S 2, and k 5 and k 6 are the reaction parameters associated with S 3. In the absence of the consecutive reaction between S 2 and S 3, that is if S 3 = 0 at all times (k 5 =k 6 =0), eq (44) reduces to, S t 2 = k 3 C m - k 4 S 2 32
33 Thus eq. (7) for S 2 resembles that for S 1 except for the magnitude of the associated parameters k 3, k 4 and m. The sorbed phases (S e, S 1, S 2, S 3 ) may be regarded as the amounts sorbed on surfaces of soil particles and chemically bound to Al and Fe oxide surfaces or other types of surfaces, although it is not necessary to have a priori knowledge of the exact retention mechanisms for these reactions to be applicable. These phases may be characterized by their kinetic sorption and release behavior to the soil solution and thus are susceptible to leaching in the soil. In addition, the primary difference between these two phases not only lie in the difference in their kinetic behavior but also on the degree of nonlinearity as indicated by the parameters n and m. The sink/source term Q is commonly used to account for irreversible reactions such as precipitation/dissolution, mineralization, and immobilization, among others. We expressed the sink term as a first-order kinetic process; where k s is the associated rate coefficient (h -1 ). In this presentation, the notations k s and k irr are used interchangeably through this manual. The sink term Q was expressed in terms of a first-order irreversible reaction for reductive sorption or precipitation or internal diffusion. This equation is similar to that for diffusion-controlled precipitation reaction if one assumes that the equilibrium concentration for precipitation is negligible. S Q= t 3 = k s C Input and Output Data Files An input file must be provided by the user for the selected model. The input model specifies initial and boundary conditions and can be provided in two different ways: a. Manual entry by filling out the template provided below. b. As an external ASII file (,dat or txt). A sample of the input data file referred as THINDISK-MRM -IPUT.DAT and is given in the INPUTFILES folder to be downloaded by the user. For a given initial concentration (Ci) and input concentration (Cs) at time t > 0, the model provides results of concentration, the amount sorbed 33

34 versus time, and sorption isotherms. Model output is given in txt format and must be named and saved by the user. Graphics of simulations are also generated which can be saved by the user. Graphics include time-dependent sorption-desorption. Template for the THINDISK-MRM model 34
35 35
36 Competitive MRM Model (C_MRM) The competitive model was developed to describe competitive equilibrium sorption for multicomponent systems where the sorption isotherms of single component follow the Freundlich equation. A general form of the competitive equation can be written as ni 1 l Si KiCi i, j C j j1 where the subscripts i and j denote metal component i and j, l is the total number of components, and i,j is a dimensionless competition coefficient for the adsorption of component i in the presence of component j. The parameters K i and n i are the Freundlich parameters representing a single component system i as described in eq. (14) above. By definition, i,j equals 1 when i = j. If there is no competition, i.e., i,j =0 for all j i, eq. (15) yields a single species Freundlich equation for component i identical to eq. (14). The Competitive MRM model presented here accounts for competitive Freundlich type retention along with MRM formulation discussed earlier such that, l ( S ) i Ke, ic e i i, jc j j1 n i 1 n i 1 ( S ) l 1 i k C C k ( S ) t 1, i i i, j j 2, i 1 i j1 n i 1 ( S ) l 2 i k C C ( k k ) ( S ) t ( S ) s t i k ( S ) i irr t s, i 3, i i i, j j 4, i s, i 2 i j1 ( S ) s k i irr, i Ci When competition is ignored, i.e., α i,j for all sorption. j i, eq. (21) to a single species nth- order kinetic 36
. A sample of the input data file referred as CMRM-IPUT.")
37 Input and Output Data Files An input file must be provided by the user for the selected model. The input model specifies initial and boundary conditions and can be provided in two different ways: a. Manual entry by filling out the template provided below. b. As an external ASII file (,dat or txt). A sample of the input data file referred as CMRM-IPUT.DAT and is given in the INPUTFILES folder to be downloaded by the user. For a given initial concentration (Ci) and input concentration (Cs) at time t > 0, the model provides results of concentration, the amount sorbed versus time, and sorption isotherms. Model output is given in txt format and must be named and saved by the user. Graphics of simulations are also generated which can be saved by the user. Graphics include time-dependent sorption-desorption. Template for the C-MRM model 37
38 38

39 Fitting Models for Batch Sorption Multireaction Fitting Model (MRM-FIT) This model is that of the multireaction model described earlier. However, the model is capable of inverse action; that is to describe a data set or a set of observations based on best estimates of model parameters. Specifically, experimental results are fitted to the multireaction model described above using Levenberg-Marquardt nonlinear least square optimization method (Press et al., 1992). Statistical criteria used for estimating the goodness-of-fit of the models to the data were the coefficients of determination r 2 and the root mean square error (RMSE). This fitting model is tailored to the adsorption-desorption kinetic batch method. 39
 than that using the one step reactor. As shown the suspension is mixed with an overhead stirrer or from below with a magnetic stirrer.")
40 Batch reactors are normally used describe the kinetics of chemical reaction in a suspension (some 1-2 liters in volume). The soil to solution ratio is much larger (5:100 or less) than that using the one step reactor. As shown the suspension is mixed with an overhead stirrer or from below with a magnetic stirrer. A ph electrode connected to maintain a constant ph during the duration of the reaction. To maintain conditions of oxidation and reduction, gas dispersion tubes of CO 2 and O 2 out of the suspension are maintained. A schematic showing a typical adsorption-desorption experiment of chemicals in soils using centrifuge tubes is shown here. In this method, solute adsorption as well desorption kinetics studies with soils and other matrices are carried out in centrifuge tubes. The volume of the centrifuge tubes vary from ml where a soil to solution of 3 g to 40 ml solution (or 4 g to 40 ml solution) is used. The solution contains the solute at the desired concentration dissolved in a background solution. For other matrices, such as plant material, 1 gm or less of matrix material to 30 or 40 ml solutions is used. The range of initial concentrations to be used varies dependent on the objectives of each study. Typical batch reactor configuration where a syringe sampler allows for removal of subsample of suspension over time. 40
41 The mixtures or slurries in the centrifuge tubes are then shaken continuously, and after each reaction time, the tubes are centrifuged. An aliquot (3-4 ml) is then sampled from the supernatant at the specified reaction time. The volume to be decanted can be as little as 0.2 ml if radionuclide s are used. These steps are repeated for each adsorption time. Generally, initial reaction times may vary from 2 to 4 hrs followed by daily sampling for 1-7 days, and weekly for 4-6 weeks or longer. To avoid excessive changes in the soil to solution ration, the number of samples should be limited to 3-4 if large aliquots are needed. In contrast as many as 12 or more, reaction times may be carried out if radionuclide s are used. Kinetic Batch Method for Adsorption & Desoprtion Shaking, Centrifuging, Sampling 10 or more Desorption steps 30 ml Solution Decant supernatant 0.01 M KNO 3 Sampling Every 1d - 3 d 3 g Soil Adsorption Steps 1, 2, 4, 7,14, 21, 30d Desorption Steps Soil residues A schematic of batch adsorption-desorption studies in centrifuge tubes. Desorption is carried out based on the method of successive dilutions and commences immediately after the last adsorption time step. Each desorption step is carried out by replacing as much of the supernatant with the background solution. The amount of decanted solution and that of the background solution added must be recorded for mass balance calculations. A desorption step often consists of few hour, days, or weekd of shaking for each step. Desorption is repeated for several steps as desired. The total desorption or release time depends on is number and time intervals between each desorption step. The decanted solution from each 41
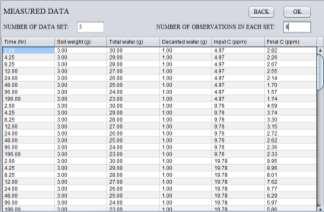
42 adsorption and desorption step are analyzed for the solute and the amount retained by the soil matrix is calculated. Input and Output Data Files An input file must be provided by the user for the selected model. The input model specifies initial and boundary conditions and can be provided in two different ways: a. Manual entry by filling out the template provided below. b. As an external ASII file (,dat or txt). A sample of the input data file referred as MRM FIT-INPUT.DAT and is given in the INPUTFILES folder to be downloaded by the user. For a given initial concentration (Ci) and input concentration (Cs) at time t > 0, the model provides results of concentration, and the amount sorbed versus time. Measured data are indicated by various symbols and continuous curves are model calculations. Model output is given in txt format and must be named and saved by the user. Graphics of simulations are also generated which can be saved by the user. Graphics include time-dependent sorption-desorption. The model carries out all mass calculations for a batch experiment and thus requires a complete accounting of the weights of the soil and solution (added as well as decanted) at each time step. For each input concentration (Co), the model requires the weight of the soil and the solution, the weight of decanted solution, and experimental measured final concentration (C f ) for each time step. Moreover, the number of time steps and the time of sorption and desorption must be given. The user must provide values for all model parameters. If a process is not to be considered, the associated rate coefficient(s) must be set equals to zero. Parameters that estimates are being sought must be identified (by choosing 1) and their initial estimates must be given. The model will carry out nonlinear-least approximation for the entire data set, that is all initial concentrations versus time and are thus represent overall parameter fit. A user may wish to test the capability of the model for only one input concentration versus time and thus compare individual versus overall fitting. The example given here is for atrazine adsorption by sugarcane mulch residue over a wide range of concentrations (Selim and Zhu, 2005). Measured and predicted results are shown for atrazine concentration and the amount sorbed versus time during sorption and desorption. Selim, H. M. and H. Zhu Atrazine sorption desorption hysteresis by sugarcane mulch residue. Journal of Environmental Quality 34:

43 Template for the MRM-FIT model Screen 2 43
44 44
45 SECOND-Order (SOFIT) Model This model is that of the multireaction transport (MRTML) model described earlier. However, the model is capable of inverse action; that is to describe a data set or a set of observations based on best estimates of model parameters. Specifically, experimental results are fitted to the multireaction model described above using Levenberg-Marquardt nonlinear least square optimization method (Press et al., 1992). Statistical criteria used for estimating the goodness-of-fit of the models to the data were the coefficients of determination r 2 and the root mean square error (RMSE). This fitting model is tailored to the adsorption-desorption kinetic batch method. The model carries out all mass calculations for soil column experiments and thus requires a complete accounting of the weights of the soil and solution (input and output or effluent) with time. Other necessary constrains include the length of the soil column, soil bulk density and the flux density. A constant or variable flux density can be specificed. If a retention process in the model to be ignored, the associated rate coefficient(s) must be set equals to zero. Parameters that estimates are being sought must be identified (by choosing 1) and their initial estimates must be given. The model will carry out nonlinear-least approximation for the entire data set, that is all initial concentrations versus time and are thus represent overall parameter fit. A user may wish to test the capability of the model for only one input concentration versus time and thus compare individual versus overall fitting. Input and Output Data Files An input file must be provided by the user for the selected model. The input model specifies initial and boundary conditions and can be provided in two different ways: a. Manual entry by filling out the template provided below. b. As an external ASII file (,dat or txt). A sample of the input data file referred as SO FIT-INPUT.DAT and is given in the INPUTFILES folder to be downloaded by the user. For a given initial concentration (Ci) and input concentration (Cs) at time t > 0, the model provides results of concentration, and the amount sorbed versus time. Measured data are indicated by various symbols and continuous curves are model calculations. Model output is given in txt format and must be named and saved by the user. Graphics of simulations are also generated which can be saved by the user. The model carries out all mass calculations for a batch experiment and thus requires a complete accounting of the weights of the soil and solution (added as well as decanted) at each 45
46 time step. For each input concentration (Co), the model requires the weight of the soil and the solution, the weight of decanted solution, and experimental measured final concentration (C f ) for each time step. Moreover, the number of time steps and the time of sorption and desorption must be given. The user must provide values for all model parameters. If a process is not to be considered, the associated rate coefficient(s) must be set equals to zero. Parameters that estimates are being sought must be identified (by choosing 1) and their initial estimates must be given. The model will carry out nonlinear-least approximation for the entire data set, that is all initial concentrations versus time and are thus represent overall parameter fit. A user may wish to test the capability of the model for only one input concentration versus time and thus compare individual versus overall fitting. The example shown is Copper (Cu) results from miscible displacement experiments for a McLaren soil (Selim and Ma 2001) The results are shown by the effluent results of concentration and the amount sorbed versus time shown in the plot below. Selim, H. M. and L. Ma Modeling nonlinear kinetic behavior of copper adsorptiondesorption in soil. Soil Sci. Soc. Am. Spec. Publ. 56:

47 Screen 4 47
48 48
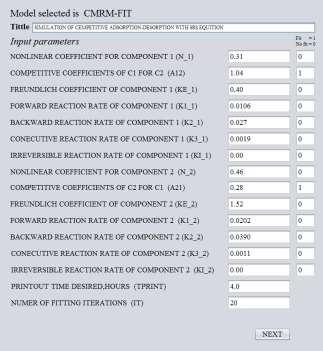
49 Competitive MRM Fitting Model (CMRM-FIT) The competitive model described earlier is used here. Specifically, the model deals only two competing ions based on the kinetic approach as outlined. The model is capable of inverse action; that is to describe a data set or a set of observations based on best estimates of model parameters. Specifically, experimental results are fitted to the multireaction model described above using Levenberg-Marquardt nonlinear least square optimization method (Press et al., 1992). Statistical criteria used for estimating the goodness-of-fit of the models to the data were the coefficients of determination r 2 and the root mean square error (RMSE). This fitting model is tailored to the adsorption-desorption kinetic batch method. Input and Output Data Files An input file must be provided by the user for the selected model. The input model specifies initial and boundary conditions and can be provided in two different ways: a. Manual entry by filling out the template provided below. b. As an external ASII file (,dat or txt). A sample of the input data file referred as CMRM FIT-INPUT.DAT and is given in the INPUTFILES folder to be downloaded by the user. For a given initial concentration (Ci) and input concentration (Cs) at time t > 0, the model provides results of concentration, and the amount sorbed versus time. Measured data are indicated by various symbols and continuous curves are model calculations. Model output is given in txt format and must be named and saved by the user. Graphics of simulations are also generated which can be saved by the user. Graphics include time-dependent sorption-desorption. The model carries out all mass calculations for a batch experiment and thus requires a complete accounting of the weights of the soil and solution (added as well as decanted) at each time step. For each input concentration (Co), the model requires the weight of the soil and the solution, the weight of decanted solution, and experimental measured final concentration (C f ) for each time step. Moreover, the number of time steps and the time of sorption and desorption must be given. The user must provide values for all model parameters. If a process is not to be considered, the associated rate coefficient(s) must be set equals to zero. Parameters that estimates are being sought must be identified (by choosing 1) and their initial estimates must be given. The model will carry out nonlinear-least approximation for the entire data set, that is all initial concentrations versus time and are thus represent overall parameter fit. A user may wish 49
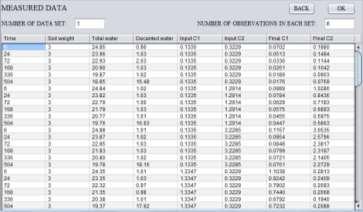
50 to test the capability of the model for only one input concentration versus time and thus compare individual versus overall fitting. The model deals with only two competitive ions simultaneously and carries out all mass calculations for a batch experiment and thus requires a complete accounting of the weights of the soil and solution (added as well as decanted) at each time step. For each input concentration (Co) for each ion, the model requires the weight of the soil and the solution, the weight of decanted solution, and experimental measured final concentration (C f ) for each time step. Moreover, the number of time steps and the time of sorption and desorption must be given. The user must provide values for all model parameters. If a process is not to be considered, the associated rate coefficient(s) must be set equals to zero. Parameters that estimates are being sought must be identified (by choosing 1) and their initial estimates must be given. The model will carry out nonlinear-least approximation for the entire data set, that is all initial concentrations versus time and are thus represent overall parameter fit. A user may wish to test the capability of the model for only one input concentration versus time and thus compare individual versus overall fitting. The example shown is for Arsenic sorption at different levels of phosphate from Zhang and Selim (2008) Zhang, H. and H. M. Selim Competitive sorption-desorption kinetics of arsenate and phosphate in soils. Soil Sci. 173:3-12. Template for the CMRM-FIT model 50
51 51
52 52
53 Transport Models Soil Aggregate Reactive chemicals Fluid flow Transport reactive chemicals Conceptualization of transport and reactivity of chemicals in soils. It is commonly accepted that there are two types of mechanisms which govern the transport of dissolved chemicals in soils or geological media. The first type is molecular diffusion (D o ) which is an active type and occurs regardless whether there water flow in the soil system. The second is mechanical dispersion which is passive one and is applicable only when there is water flow. Dispersion is a highly significant transport mechanism which is unique to porous media. A linear relationship between unique between longitudinal dispersion D L and the pore pore-water velocity ν, DL= D v o where D o is the molecular diffusion coefficient in water. The term λ is a characteristic property of the porous media known as the dispersivity (cm). Dispersivity values λ vary from a few centimeters for uniformly packed (disturbed) laboratory soil columns to several meters for fieldscale experiments. Large values of λ are also reported for well-aggregated oils. In practice, an empirical parameter D rather than D L is often introduced to simplify the flux equation. The above yields the following simplified solute flux expression in the z-direction as C J z = - D + qz C z 53

54 which incorporates the effects of mass flow or convection as well as diffusion and mechanical dispersion. Here J z is the solute flux (mg/ml.cm 2 ) and q z is darcy flux (cm/hr) the z-direction. Incorporation of flux eq. (19) into the conservation of mass or continuity equation yields the following generalized form for solute transport in soils in one-dimension, C S C q C z + = D - t t z z z The above equation is commonly known as the convection-dispersion equation (CDE) for solute transport in porous media, and is applicable for fully-saturated and partially saturated water contents and under transient and steady flow. For conditions where steady water flow is dominant, q and Ө are constants over space and time, i.e, for uniform Ө in the soil, we have the simplified form of the convection-dispersion equation for reactive chemicals as, where ν is the pore-water velocity (q z /Ө). 2 C S C C + = D - v 2 t t z z 54

55 Mulireaction Transport Model for Layered Soils (MRTML) In this model solute sorption reactions as expressed by the term ( S/ t) in the above convection-dispersion equation was represented here by the mutlireaction model described earlier. Here, the total amount sorbed S T or simply S as the total amount retained reversibly or reversibly by soil matrix surfaces, S S S S S e 1 2 The governing equilibrium retention/release mechanism is the nonlinear Freundlich type as S e = K where K f is the associated distribution coefficient (cm 3 kg -1 ) and b is a dimensionless Freundlich parameter (b < 1). Other equilibrium type retention mechanisms are given in Chapter 3. This includes linear (b=1), Langmuir, two-site Langmuir, and others. The retention/release reactions associated with S 1, S 2, and S 3 are concurrent or consecutive type kinetic reactions. Specifically, the S 1 and S 2 phases were considered to be in direct contact with C and reversible rate coefficients of the (nonlinear) kinetic type govern their reactions, f C b irr 55

56 S t 1 = k 1 C n - k 2 S 1 S t 2 = k 3 C m S t - ( k 3 4 = k + k 5 S 2 5 ) S - k k S 3 6 S 3 where k 1 and k 2 are the forward and backward rates coefficients (h -1 ), respectively and n is the reaction order associated with S 1. Similarly, k 3 and k 4 are the rate coefficients and m is the reaction order associated with S 2, and k 5 and k 6 are the reaction parameters associated with S 3. In the absence of the consecutive reaction between S 2 and S 3, that is if S 3 = 0 at all times (k 5 =k 6 =0), reduces to, S t 2 = k 3 C Thus the eq. for S 2 resembles that for S 1 except for the magnitude of the associated parameters k 3, k 4 and m. m - k 4 S 2 A schematic diagram of a two-layered soil. 56
57 The initial and boundary conditions used here is for a finite soil column length L (cm) are 0 C x C t init 0 S x S t init C vco t Tp ( D vc) x 0 tt x0 C x x L 0 t 0 p where C init is the initial solution concentration (mg L -1 ), S init is the initial amount of sorption (mg kg -1 ), C o is the input solute concentration (mg L -1 ), T p is the duration of applied solute pulses, L is the length of column (cm). In this model, we extend the solution to that for the general case of solute transport in multilayered systems. For the simplest case of a two-layered soil of length L is shown in the schematic Figure. The length of each layer is denoted by L 1 and L 2, respectively. To show heterogeneity, each soil layer has specific, but not necessarily the same water content, bulk density, and solute retention properties. Only vertical direction steady state water flow perpendicular to the soil layers is considered here. The convective-dispersive equation (CDE) governing solute transport in the ith layer is given by S i C i C i i i C i idi q where ( 0 x L i,i 1, 2 ) t t x x x (1) where (omitting the i): C = resident concentration of solute in soil solution (g cm -3 ), S = amount of solute adsorbed by the soil matrix (g g -1 ), = soil bulk density (g cm -3 ), = volumetric soil water content (cm 3 cm -3 ), D = solute dispersion coefficient (cm 2 d -1 ), q = Darcy soil-water flow velocity (cm d -1 ), Q = a sink or source for irreversible solute interaction (g cm -3 d -1 ), x = distance from the soil surface (cm), and t = time (d). 57
58 An important boundary condition needed in the analysis of multilayered soils is that at the interface between layers. It should be noted that both first-type and third-type boundary conditions are applicable at the interface. It has been shown that although the principle of solute mass conservation is satisfied, a discontinuity in concentration develops when a third-type interface condition is used. On the other hand, a first-type interface condition will result in a continuous concentration profile across the boundary interface at the expense of solute mass balance. To overcome the limitations of both first- and third-type conditions, a combination of first- and third-type condition was implemented. The first-type condition can be written as: C C, t 0 I II xl1 xl1 where x L and x L denote that x = L is approached from upper and lower layer respectively. Similarly, the third-type condition can be written as: C C qc D qc D, t 0 I II I I I II II II x x xl1 xl1 Incorporation of Equation (6) into Equation (7) yields C C D D, t 0 I II I I II II x x xl1 xl1 This above BC of Equation (4) was successfully tested. Input and Output Data Files An input file must be provided by the user for the selected model. The input model specifies initial and boundary conditions and can be provided in two different ways: a. Manual entry by filling out the template provided below. b. As an external ASII file (,dat or txt). A sample of the input data file referred as MRMTL FIT-INPUT.DAT and is given in the INPUTFILES folder to be downloaded by the user. Model output is given in txt format and must be named and saved by the user. Graphics of simulations are also generated which can be saved by the user. Graphics include time-dependent sorption-desorption. 58
59 The model carries out all mass calculations for a batch experiment and thus requires a complete accounting of the weights of the soil and solution (added as well as decanted) at each time step. For each input concentration (Co), the model requires the weight of the soil and the solution, the weight of decanted solution, and experimental measured final concentration (C f ) for each time step. Moreover, the number of time steps and the time of sorption and desorption must be given. The user must provide values for all model parameters. If a process is not to be considered, the associated rate coefficient(s) must be set equals to zero. Parameters that estimates are being sought must be identified (by choosing 1) and their initial estimates must be given. The model will carry out nonlinear-least approximation for the entire data set, that is all initial concentrations versus time and are thus represent overall parameter fit. A user may wish to test the capability of the model for only one input concentration versus time and thus compare individual versus overall fitting. The example shown demonstrates the influence of the nonlinearity of the Freundlich parameter on the shape of the breakthrough (BTC) curve. Transport results are shown by the effluent results of concentration versus pore volume (time) shown in the plot below. Six values (cases) were selected for this sensitivity analysis namely; 0.5, 0.75, 1.0, 1.25, 1.5 and 2. 59

60 Template for the MRTML model 60
61 61
62 Multireaction and Transport Fitting Model (MRTM-FIT) This model is that of the multireaction transport (MRTML) model described earlier. However, the model is capable of inverse action; that is to describe a data set or a set of observations based on best estimates of model parameters. Specifically, experimental results are fitted to the multireaction model described above using Levenberg-Marquardt nonlinear least square optimization method (Press et al., 1992). Statistical criteria used for estimating the goodness-offit of the models to the data were the coefficients of determination r 2 and the root mean square error (RMSE). The model carries out all mass calculations for soil column experiments and thus requires a complete accounting of the weights of the soil and solution (input and output or effluent) with time. Other necessary constrains include the length of the soil column, soil bulk density and the flux density. A constant or variable flux density can be specificed. If a retention process in the model to be ignored, the associated rate coefficient(s) must be set equals to zero. Parameters that estimates are being sought must be identified (by choosing 1) and their initial estimates must be given. The model will carry out nonlinear-least approximation for the entire data set, that is all initial concentrations versus time and are thus represent overall parameter fit. A user may wish to test the capability of the model for only one input concentration versus time and thus compare individual versus overall fitting. Input and Output Data Files An input file must be provided by the user for the selected model. The input model specifies initial and boundary conditions and can be provided in two different ways: a. Manual entry by filling out the template provided below. b. As an external ASII file (,dat or txt). A sample of the input data file referred as MRM FIT-INPUT.DAT and is given in the INPUTFILES folder to be downloaded by the user. For a given initial concentration (Ci) and input concentration (Cs) at time t > 0, the model provides results of concentration, and the amount sorbed versus time. Measured data are indicated by various symbols and continuous curves are model calculations. Model output is given in txt format and must be named and saved by the user. Graphics of simulations are also generated which can be saved by the user. The model carries out all mass calculations for a batch experiment and thus requires a complete accounting of the weights of the soil and solution (added as well as decanted) at each 62
63 time step. For each input concentration (Co), the model requires the weight of the soil and the solution, the weight of decanted solution, and experimental measured final concentration (C f ) for each time step. Moreover, the number of time steps and the time of sorption and desorption must be given. The user must provide values for all model parameters. If a process is not to be considered, the associated rate coefficient(s) must be set equals to zero. Parameters that estimates are being sought must be identified (by choosing 1) and their initial estimates must be given. The model will carry out nonlinear-least approximation for the entire data set, that is all initial concentrations versus time and are thus represent overall parameter fit. A user may wish to test the capability of the model for only one input concentration versus time and thus compare individual versus overall fitting. The example shown is sliver (Ag) results from miscible displacement experiments for a Winsor soil (not published; available in MS thesis, Liyun Zhang, LSU, 2014).. The transport results are shown by the effluent results of concentration versus pore volume (time) shown in the plot below. 63

64 Template for the MRTM-FIT model 64

65 Screen 2 65
66 Second-Order Two-Site Transport Model in Layered Soils (SOTSL) In this model, the sorption term of the convective-dispersive equation (CDE) is based on secondorder-two-site formulation. The solute transport equation used is that for multilayered soils where for the ith layer (see Figure 1) is given by Equation (1) S i C i C i i i C i idi q where ( 0 x L i,i 1, 2 ) t t x x x where (omitting the i): C = resident concentration of solute in soil solution (g cm -3 ), S = amount of solute adsorbed by the soil matrix (g g -1 ), = soil bulk density (g cm -3 ), = volumetric soil water content (cm 3 cm -3 ), D = solute dispersion coefficient (cm 2 d -1 ), q = Darcy soil-water flow velocity (cm d -1 ), Q = a sink or source for irreversible solute interaction (g cm -3 d -1 ), x = distance from the soil surface (cm), and t = time (d). The above equation is subject to the initial and boundary conditions as described under model MRTML. In this model solute sorption reactions as expressed by the term ( S/ t) in the above convection-dispersion equation was represented here by the second-order two site model where, In this model, it is assumed that a soil contains a maximum adsorption or total retention capacity or sites (S max ). Furthermore, the total sites can be partitioned into two types such that, =( S ) +( S Smax max 1 max 2 where (S max ) 1 and (S max ) 2 are the total amount of type 1 sites and type 2 sites, respectively. If F represents the fraction of type 1 sites to the total amount of sites or the adsorption capacity for an individual soil, we thus have ( Smax ) = F Smax and ( Smax ) 2=(1 - F ) ) S 1 max 66
67 Based on second order formulation, the retention reaction of each site is t S 1 = k ( ( ) 1 S C - for type 1 sites max1 S 1 k2 S1 and t S 2 = k 3 ( S S 2 C - S 2 for type sites max 2 ) 4 2 where k 1 and k 2 (h -1 ) are forward and backward rate coefficients for type 1 sites, whereas k 3 and k 4 are rate coefficients for type 2 reaction sites, respectively. In addition, Θ is the soil water content (cm 3 cm -3 ), ρ is the soil bulk density (g cm -3 ), and t is time (h). This model also accounts for irreversible sorption or a sink of the linear type, S t s k C where S s is the amount irreversible sorbed (mg/g soil) and k s is the rate of irreversible retention. s Input and Output Data Files An input file must be provided by the user for the selected model. The input model specifies initial and boundary conditions and can be provided in two different ways: a. Manual entry by filling out the template provided below. b. As an external ASII file (,dat or txt). A sample of the input data file referred as SOTSL-INPUT.DAT and is given in the INPUTFILES folder to be downloaded by the user. For a given initial concentration (Ci) and input concentration (Cs) at time t > 0, the model provides results of concentration, and the amount sorbed versus time. Model output is given in txt format and must be named and saved by the user. Graphics of simulations are also generated which can be saved by the user. The model carries out all mass calculations for a batch experiment and thus requires a complete accounting of the weights of the soil and solution (added as well as decanted) at each time step. For each input concentration (Co), the model requires the weight of the soil and the solution, the weight of decanted solution, and experimental measured final concentration (C f ) for each time step. Moreover, the number of time steps and the time of sorption and desorption must be given. The user must provide values 67
 and their initial estimates must be given.")
68 for all model parameters. If a process is not to be considered, the associated rate coefficient(s) must be set equals to zero. Parameters that estimates are being sought must be identified (by choosing 1) and their initial estimates must be given. The model will carry out nonlinear-least approximation for the entire data set, that is all initial concentrations versus time and are thus represent overall parameter fit. A user may wish to test the capability of the model for only one input concentration versus time and thus compare individual versus overall fitting. A sample of the input data file referred as SOTSL-INPUT.DAT and is given in the INPUTFILES folder to be downloaded by the user. Samples of input files in a template format are included in this package. Model output is given in txt format and must be named and saved by the user. Graphics of simulations and experimental measurements are also generated which can be saved by the user. Graphics include breakthrough curves, time-dependent sorption and desorption. The example shown demonstrates the influence of the sorption capacity or the total amount of available sites on the shape of the breakthrough (BTC) curve.. The transport results are shown by the effluent results of concentration versus pore volume (time) shown in the plot below. Six values (cases) were selected for this sensitivity analysis namely; 50, 100, 200, 400, 600, and 800 mg/kg. Template for the SOTSL model 68
69 69
70 Second-Order and Transport Fitting Model (SOT-FIT) This model is basically that of the second-order (SOTSL) model described earlier. However, the model is capable of inverse action; that is to describe a data set or a set of observations based on best estimates of model parameters. Specifically, experimental results are fitted to the second-order transport model described above using Levenberg-Marquardt nonlinear least square optimization method (Press et al., 1992). Statistical criteria used for estimating the goodness-of-fit of the models to the data were the coefficients of determination r 2 and the root mean square error (RMSE). This fitting model is tailored to the adsorption-desorption kinetic batch method. The model carries out all mass calculations for soil column experiments and thus requires a complete accounting of the weights of the soil and solution (input and output or effluent) with time. Other necessary constrains include the length of the soil column, soil bulk density and the flux density. A constant or variable flux density can be specified. If a retention process in the model to be ignored, the associated rate coefficient(s) must be set equals to zero. Parameters that estimates are being sought must be identified (by choosing 1) and their initial estimates must be given. The model will carry out nonlinear-least approximation for the entire data set, that is all initial concentrations versus time and are thus represent overall parameter fit. A user may wish to test the capability of the model for only one input concentration versus time and thus compare individual versus overall fitting. Input and Output Data Files An input file must be provided by the user for the selected model. The input model specifies initial and boundary conditions and can be provided in two different ways: a. Manual entry by filling out the template provided below. b. As an external ASII file (,dat or txt). A sample of the input data file referred as SOT-FIT -INPUT.DAT and is given in the INPUTFILES folder to be downloaded by the user. For a given initial concentration (Ci) and input concentration (Cs) at time t > 0, the model provides results of concentration, and the amount sorbed versus time. Measured data are indicated by various symbols and continuous curves are model calculations. Model output is given in txt format and must be named and saved by the user. Graphics of 70
71 simulations are also generated which can be saved by the user. Graphics include time-dependent sorption-desorption. The model carries out all mass calculations for a batch experiment and thus requires a complete accounting of the weights of the soil and solution (added as well as decanted) at each time step. For each input concentration (Co), the model requires the weight of the soil and the solution, the weight of decanted solution, and experimental measured final concentration (C f ) for each time step. Moreover, the number of time steps and the time of sorption and desorption must be given. The user must provide values for all model parameters. If a process is not to be considered, the associated rate coefficient(s) must be set equals to zero. Parameters that estimates are being sought must be identified (by choosing 1) and their initial estimates must be given. The model will carry out nonlinear-least approximation for the entire data set, that is all initial concentrations versus time and are thus represent overall parameter fit. A user may wish to test the capability of the model for only one input concentration versus time and thus compare individual versus overall fitting. The example shown represents atrazine results from miscible displacement experiments for a Sharkey soil published in the Soil Sci. Amer. Journal (2005, vol. 66, pp ). The transport results are shown by the effluent results of concentration versus pore volume (time) shown in the plot below. Ma, L. and H. M. Selim Predicting pesticide transport in mulch amended soils: A two compartment model. Soil Sci. Soc. Am. J. 69:

72 Template for the SOT-FIT model 72

73 Screen 2 73
74 Second-Order Mobile-Immobile Transport Model (SOMIM) The equations describing the movement for a reactive solute through a porous media having mobile and immobile water fractions are: m C t m S + f t m = m 2 m C D 2 x m - m C x m - (C m - C im )- Q m and: im C t im +(1- f S ) t im = (C This is a modified version of the convection-dispersion equation where D is the hydrodynamic dispersion coefficient in the mobile water region (cm 2 h -1 ), Θ m and Θ im are mobile and immobile water fractions (cm 3 cm -3 ), respectively. The terms C m and C im are the concentrations in the mobile and immobile water (μg cm -3 ), and v m is the average pore-water velocity in the mobile region (cm h - 1 ). Also ρ is soil bulk density (g cm -3 ), x is depth (cm) and t is time (h). It is also assumed that the immobile water (Θ im ) is located inside aggregate pores (inter-aggregate) where solute transfer occurs by diffusion only. The term α is a mass transfer coefficient (h -1 ) which governs the transfer of solutes between the mobile- and immobile-water phases in analogous manner to a diffusion process. In addition, it is assumed that the soil matrix is divided into two regions (or sites) where a fraction f is a dynamic or easily accessible region and the remaining fraction is a stagnant or less accessible region (see Figures 2). The dynamic region is located close to the mobile phase whereas the stagnant region is in contact with the immobile phase. Moreover, S m and S im are the amounts of solutes sorbed in the dynamic and stagnant regions (μg per gram soil), respectively. Also Q m and Q im are sink (or source) terms associated with the mobile and immobile water regions, respectively. Therefore, Q m and Q im represent rates of irreversible type reactions. These terms must be distinguished from S m and S im which represent reversible sorbed solutes in the dynamic and stagnant regions, respectively. m -C im )- Q im 74
. A sample of the input data file referred as SOTSL-INPUT.")
75 Input and Output Data Files An input file must be provided by the user for the selected model. The input model specifies initial and boundary conditions and can be provided in two different ways: a. Manual entry by filling out the template provided below. b. As an external ASII file (.6dat or txt). A sample of the input data file referred as SOTSL-INPUT.DAT and is given in the INPUTFILES folder to be downloaded by the user. For a given initial concentration (Ci) and input concentration (Cs) at time t > 0, the model provides results of concentration, and the amount sorbed versus time. Model output is given in txt format and must be named and saved by the user. Graphics of simulations are also generated which can be saved by the user. The example shown demonstrates the influence of the fraction of sites (F) on the shape of the breakthrough (BTC) curve. The effluent results of concentration versus pore volume (time) shown in the plot below. Six values (cases) were selected for this sensitivity analysis namely F values of 0, 0.2, 0.2, 0.3., 0.4, and 0.5. Template for the SOMIM model 75
76 76
77 Second-OrderMOBIL-IMMOBILE FIT (SOMIM-FIT) This model is basically that of the SOMIM-FIT (SOMIM) model described earlier. However, the model is capable of inverse action; that is to describe a data set or a set of observations based on best estimates of model parameters. Specifically, experimental results are fitted to the second-order transport model described above using Levenberg-Marquardt nonlinear least square optimization method (Press et al., 1992). Statistical criteria used for estimating the goodness-of-fit of the models to the data were the coefficients of determination r 2 and the root mean square error (RMSE). This fitting model is tailored to the adsorption-desorption kinetic batch method. Input and Output Data File An input file must be provided by the user for the selected model. The input model specifies initial and boundary conditions and can be provided in two different ways: a. Manual entry by filling out the template provided below. b. As an external ASII file (.dat or txt). A sample of the input data file referred as SOMIM-FIT-IPUT.DAT and is given in the INPUTFILES folder to be downloaded by the user. Samples of input files in a template format are included in this package. Model output is given in txt format and must be named and saved by the user. Graphics of simulations and experimental measurements are also generated which can be saved by the user. The model carries out all mass calculations for a batch experiment and thus requires a complete accounting of the weights of the soil and solution (added as well as decanted) at each time step. For each input concentration (Co), the model requires the weight of the soil and the solution, the weight of decanted solution, and experimental measured final concentration (C f ) for each time step. Moreover, the number of time steps and the time of sorption and desorption must be given. The user must provide values for all model parameters. If a process is not to be considered, the associated rate coefficient(s) must be set equals to zero. Parameters that estimates are being sought must be identified (by choosing 1) and their initial estimates must be given. The model will carry out nonlinear-least approximation for the entire data set, that is all initial concentrations versus time and are thus represent overall parameter fit. A user may wish to test the capability of the model for only one input concentration versus time and thus compare individual versus overall fitting. The example shown represent experimental and predicted atrazine results of two consecutive pulses from miscible displacement experiments for a Sharkey 77

78 soil (2 mm aggregate size) (Ma and Selim, 1997). The transport results are shown by the effluent concentration versus pore volume (time) shown in the plot below. Ma, L. and H. M. Selim Evaluation of nonequilibrium models for predicting atrazine transport in soils. Soil Sci. Soc. Am. J Template for the SOMIM-FIT model 78

79 Screen 2 79
80 Competitive Transport Model (CMRTM) Competitive sorption of interacting ions often results in complex breakthrough patterns during their transport in soils and geological media. Therefore, describing heavy metal transport requires retention models that account for their governing mechanisms. The one-dimensional reactive convective-dispersive transport equation is the most frequently used model of describing the transport of dissolved chemicals in soils (Selim, 1992) Ci Si Ci qci + = D - t t z z z where S i is the amount of adsorption (mg kg -1 ), C i is the dissolved concentration (mg L -1 ), i indicates i-th component in the system, D is the dispersion coefficient (cm 2 h -1 ), θ is the soil moisture content (cm 3 cm -3 ), ρ is the soil bulk density (g cm -3 ), z is distance (cm), and t is reaction time (h). Retention reactions of a solute by from the soil solution by the matrix of soils S and geological media is accounted for by the term ( t i ) and can be quantified based on several approaches. A number of transport models simulate heavy metal sorption based on the local equilibrium assumption (LEA). Here one assumes that the reaction of an individual solute species in the soil is sufficiently fast and that an apparent equilibrium may be observed in a time scale considerably shorter than that of the transport processes. The local equilibrium assumption is the basis for several commonly used models including ion-exchange, surface complexation, Freundlich, and Langmuir models. A discussion of the various models in the perspective of competitive sorption and transport is given in subsequent sections. In contrast to the LEA, for most heavy metals time-dependent retention in soils has been commonly observed as discussed in previous chapters. As a result, a number of formulations were introduced to describe their kinetic sorption behavior in soils. Examples of kinetic models include the first-order model, Freundlich kinetic model, irreversible and second-order models. The competitive model was developed to describe competitive equilibrium sorption for multicomponent systems where the sorption isotherms of single component follow the Freundlich equation. A general form of the competitive equation can be written as ni 1 l Si KiCi i, j C j j1 80
81 where the subscripts i and j denote metal component i and j, l is the total number of components, and i,j is a dimensionless competition coefficient for the adsorption of component i in the presence of component j. The parameters K i and n i are the Freundlich parameters representing a single component system i as described in eq. (14) above. By definition, i,j equals 1 when i = j. If there is no competition, i.e., i,j =0 for all j i, eq. (15) yields a single species Freundlich equation for component i identical to eq. (14). The Competitive MRM model presented here accounts for competitive Freundlich type retention along with MRM formulation discussed earlier such that, l ( S ) i Ke, ic e i i, jc j j1 n i 1 n i 1 ( S ) l 1 i k C C k ( S ) t 1, i i i, j j 2, i 1 i j1 n i 1 ( S ) l 2 i k C C ( k k ) ( S ) t ( S ) s t i k ( S ) i irr t s, i 3, i i i, j j 4, i s, i 2 i j1 ( S ) s k i irr, i Ci When competition is ignored, i.e., α i,j for all sorption. Input and Output Data File j i, eq. (21) to a single species nth- order kinetic An input file must be provided by the user for the selected model. The input model specifies initial and boundary conditions and can be provided in two different ways: a. Manual entry by filling out the template provided below. b. As an external ASII file (.dat or txt). A sample of the input data file referred as SOMIM-FIT-IPUT.DAT and is given in the INPUTFILES folder to be downloaded by the user. Model output is given in txt format and must be named and saved by the user. Graphics of simulations measurements are also generated which can be saved by the user. The user must provide values for all model parameters. If a process is not to be considered, the associated rate coefficient(s) must be set equals to zero. The 81
 shown in the plot below.")
82 transport results are shown by the effluent concentration versus pore volume (time) shown in the plot below. The transport of the two ions are shown by the effluent results of concentration versus pore volume (time) shown in the plot below. Template for the CMRTM model 82
83 83
84 Competitive Transport Fitting Model (CMRTM-FIT) The competitive transport model described earlier is used here. Specifically, the model deals the transport and reactivities of two competing solute species based on the kinetic approach as outlined above. The model is capable of inverse action; that is to describe a data set or a set of observations based on best estimates of model parameters. Specifically, experimental results are fitted to the multireaction model described above using Levenberg-Marquardt nonlinear least square optimization method (Press et al., 1992). Statistical criteria used for estimating the goodness-of-fit of the models to the data were the coefficients of determination r 2 and the root mean square error (RMSE). This fitting model is tailored to the adsorption-desorption kinetic batch method. Input Data File An input file must be provided by the user for the selected model. The input model specifies initial and boundary conditions and can be provided in two different ways: a. Manual entry by filling out the template provided below. b. As an external ASII file (,dat or txt). A sample of the input data file referred as CMRTM-FIT-IPUT.DAT and is given in the INPUTFILES folder to be downloaded by the user. Samples of input files in a template format are included in this package. Model output is given in txt format and must be named and saved by the user. Graphics of simulations and experimental measurements are also generated which can be saved by the user. The model deals with only two competitive ions simultaneously and carries out all mass calculations for a batch experiment and thus requires a complete accounting of the weights of the soil and solution (added as well as decanted) at each time step. For each input concentration (Co) for each ion, the model requires the weight of the soil and the solution, the weight of decanted solution, and experimental measured final concentration (C f ) for each time step. Moreover, the number of time steps and depth increments must be given. The user must provide values for all model parameters. If a process is not to be considered, the associated rate coefficient(s) must be set equals to zero. Parameters that estimates are being sought must be identified (by choosing 1) and their initial estimates must be given. The model will carry out nonlinear-least approximation for the entire data set, that is all initial concentrations versus time and are thus represent overall parameter fit. A user may wish to test the capability of the model for only one input concentration versus time and thus compare individual versus overall fitting. 84
85 The example shown here represents experimental and prediction of two consecutive pulses of arsenate and phosphate from miscible displacement experiments (Zhang and Selim, 2007). Here the transport of the two ions are shown by the effluent results of concentration versus pore volume (time) shown in the plot below. Zhang, H. and H. M. Selim. Modeling arsenate-phosphate retention and transport in soils: A multi-component approach. Soil Sci. Soc. Amer. J. 71:

86 Template for the CMRTM-FIT model Screen 2 86
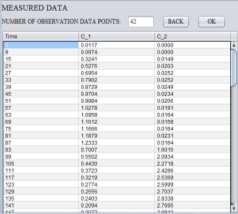
87 87
88 ION EXCHANGE TRANSPORT MODEL (ION EXCH) In this model, sorption of ions are accounted for by ion exchange only; i.e., ion exchange is regarded as the dominant sorption mechanism for ions during transport in soils. Here we account for a simple binary homovalent system where two competitive ions with similar valency are considerd. The ion exchange mechanism is based on Vanselow affinity or selectivity coefficients. The model provides concentrations for the two ions versus time and depth in the soil. The model assumes the soil to be either uniform (one layer) or having several layers, with different properties for each layer. The simplified Vanselow affinity equation, for the simple case of a binary homovalent ions, i.e., v i = v j = v, and assuming similar ion activities in the solution phase (γ i = γ j = 1), we have, si s j K = / 12 C i C (5) j where K ij represents the affinity of ion i over j or a separation factor for the affinity of ions on exchange sites. Rearrangement of eq. (5) yields the following isotherm relation for equivalent fraction of ion 1 as a function of c 1 as K K c 12 1 s 1 = 1 + ( 12-1) c1 and c 1 relative concentration (dimensionless) and C T (mmol c L -1 ) represents the total solution concentration, Ci ci = and CT = Ci (7) CT i The respective isotherm equation for ion 2 (i.e., s 2 versus c 2 ) can be easily deduced. Input Data File An input file must be provided by the user for the selected model. The input model specifies initial and boundary conditions and can be provided in two different ways: a. Manual entry by filling out the template provided below. b. As an external ASII file (,dat or txt). A sample of the input data file referred as ION-EXCHANGE-IPUT.DAT and is given in INPUTFILES folder to be downloaded by the user. In thhe example given here ion 1 is being replaced by a pulse of ion 2. The transport of the two ions are shown by the effluent results of concentration versus pore volume (time) shown in the plot below. 88 (6)

89 Template for the ION-EXCHANGE model 89
90 90
91 5. Solute Transport Model in Mixed Media (MRTM-MIXED) The transport model is similar to the MRTM described above except that the transport of a reactive solute is taking place in mixed soil systems. A mixed system consists of two or more porous media, where each medium has distinct physical and chemical properties. When two media are mixed and the resultant properties depend on the relative proportion of each medium in the mixed matrix as well as the properties of each medium. This model also accounts for flow interruption or stop flow. When stop flow takes place, diffusion becomes the dominant process during such time. The multireaction and transport model MRTM was assumed for the mixed media model. The model accounts for equilibrium and kinetic reactions of both the reversible and irreversible types. The model used in this analysis can be presented in the following formulations: z 2 S C C C = D v 2 t t z Se Ke C S t k Si t n k1( ) C n ( k2 k3) S ks 3 k k Here C is the concentration in solution (mg L -1 ), S e is the amount retained on equilibrium sites (mg kg -1 ), S k is the amount retained on kinetic type sites (mg kg -1 ), S i is the amount retained irreversibly (mg kg -1 ). Moreover, K e is a dimensionless equilibrium constant, k 1 and k 2 (h -1 ) are the forward and backward reaction rate associated with kinetic sites, respectively, k 3 (h -1 ) is the irreversible rate coefficient associate with the kinetic sites, n is the dimensionless reaction order, is the soil water content (cm 3 cm -3 ), is the soil bulk density (g cm -3 ), and t is the reaction time (h). At any time t, the total amount of a chemical retained on all sites is: ST Se Sk Si We now extend MRTM formulation to a mixed soil system where two or more geologic media or soil where each medium is having distinct physical, chemical, and microbiological properties 91
92 (see Figure 12). Such parameters include the soil water content (cm 3 cm -3 ), is the soil bulk density (g cm -3 ), soil-hydraulic conductivity, and soil-water and solute retention parameters. If one assumes that each medium competes concurrently for retention sites for a specific ion species present in the solution phase, S T can thus be expressed as; S f S f S f S f S T 1 T1 2 T 2 3 T 3... m T m Here S T 1, S T 1, S T 1, S T 1, and S Tm represent the sorption capacity for geologic medium 1, 2, 3, and n, respectively. For simplicity, we assume the mixed system is composed of n-medium and the dimensionless parameter f (omitting subscripts) represents the fraction of medium 1, 2, 3, etc., to that of the entire mixed medium (on mass per unit bulk volume basis). This parameter is necessary in order to account for the proportion of each geologic medium per unit bulk volume of the mixed soil system. Based on MRTM formulation, we can express S T for each respective medium such that for medium 1, we have S S S S T1 e1 k1 i1 And the respective S T for the m-th medium can expressed as ST m Sem Skm Sim Consequently, the amounts sorbed by the equilibrium sites of the much and the soils are m S f [ S ] e l e l l 1 Or more explicitly we have m l [ n] l Se fl [ Ke] l C l1 l Similarly, the amounts of solute adsorbed by the kinetic sites of both compartments are: m S f [ S ] k l k l l1 where [ S ] m k r l [ n] l fl [ k1] l C ([ k2] l [ k3] l ) [ Sk ] l t l1 l In addition, the corresponding irreversible reactions are: 92
93 S m irr t l1 f [ k ] [ S ] l 3 l k l The above formulation was incorporated into the convective-dispersive equation (CDE) was solved subject to the following initial and boundary (third type) conditions: C 0 t 0 0 x L S e S S 0 t 0 0 x L k irr C o C D C x 0 x C 0 D C x 0 x C 0 x L t 0 x t t t t p p where t p is the duration of applied atrazine pulse (hour), L is column length (cm), C o is atrazine concentration in applied pulse (g/ml). The CDE can be solved using numerically of the implicit-explicit finite difference approximation. Input and Output Data File An input file must be provided by the user for the selected model. The input model specifies initial and boundary conditions and can be provided in two different ways: a. Manual entry by filling out the template provided below. b. As an external ASII file (,dat or txt). A sample of the input data file referred as CMRTM-FIT-IPUT.DAT and is given in the INPUTFILES folder to be downloaded by the user. For a given initial concentration (Ci) and input concentration (Cs) at time t > 0, the model provides results of concentration, the amount sorbed versus time. Measured data are indicated by various symbols and continuous curves are model calculations. Model output is given in txt format and must be named and saved by the user. Graphics of simulations and experimental measurements are also generated which can be saved by the user. The model deals with only two competitive ions simultaneously and carries out all mass calculations for a batch experiment and thus requires a complete accounting of the weights of the soil and solution (added as well as decanted) at each time step. For each input concentration (Co) for each ion, the model requires the weight of the soil and the solution, the weight of decanted solution, and experimental measured final concentration (C f ) for each time step. Moreover, the number of time steps and depth increments must be given. The user must 93
94 provide values for all model parameters. If a process is not to be considered, the associated rate coefficient(s) must be set equals to zero. Parameters that estimates are being sought must be identified (by choosing 1) and their initial estimates must be given. The model will carry out nonlinear-least approximation for the entire data set, that is all initial concentrations versus time and are thus represent overall parameter fit. A user may wish to test the capability of the model for only one input concentration versus time and thus compare individual versus overall fitting. In the example presented here miscible displacement of a solute pulse in a mixed media made up of a mixture of two soils. Miscible displacement of a solute pulse in a mixed medium made up of a mixture of two soils is considered. Solute retention properties of soil A include irreversible, nonlinear kinetic, and nonlinear equilibrium reactions. Soil A was considered reactive and soil B wss considered as nonreactive. The effluenece of the fraction of soil (on a mass basis) is depicted by f where f values selected were f =0, 0.25, 0.5, 0.75, and 1. The BTC on the far right is for a fully reactive medium (f=1.0) whereas the one onthe right is a fully nonreactive matrix. 94

95 Template for the MRTM-MIXED model 95
96 96
97 Model for Tracer Transport (TRACER) This model is a special case for describing the transport of tracer solutes such as tritium, bromide, etc. Here a retardation factor is the only reaction mechanism. The transport is the mobile-immobile approach. The model also accounts for flow interruption or stop flow during such time diffusion becomes the dominant process. Reactive solutes based on the mobileimmobile approach assumes that the soil matrix is dynamic and stagnant soil regions in the soil as a continuum, and connected to one another. Moreover, the water content (θ) is divided into two fractions, a mobile fractions θ m and an immobile soil water fraction θ im. The immobile fraction may be considered, for transport purposes, to be stagnant and residing in the intra-aggregate domain, or within the micropores of the matrix. The general mobile-immobile formulation for the convective-dispersive transport of reactive solutes may be expressed as, m m 2 m m m C S m C m m C m im + f = D - - ( - ) 2 C C t t x x and: im im im C S m im + (1- f ) = ( C - C ) (4) t t Here the terms C m and C im are the concentrations in the mobile and immobile water (μg cm -3 ), and v m is the average pore-water velocity in the mobile region (cm h -1 ). Similarly, the terms S m and S im refer to the amount sorbed by the dynamic and stagnant regions, respectively, and f is the fraction of the dynamic sites. The term α is a mass transfer coefficient (h -1 ) which governs the transfer of solutes between the mobile- and immobile-water phases in analogous manner to a diffusion process. When equilibrium conditions are assumed and linear adsorption to govern the retention of a reactive solute, the transport equations become, m 2 m m m C C m C m im R = D - - ( - ) 2 C C t x x im im C m im R = ( C - C ) t where R m 1 K im d f and R 1 K (1 ) m d f im 97
98 where R m and R im as know as the retardation factors associated with the dynamic and stagnant regions, respectively. The term K d is the distribution coefficient describing linear sorption between solute in solution and that sorbed by matrix surfaces ( S K C). Initial and Boundary Conditions: The corresponding initial and boundary conditions associated with the second-order mobile-immobile model can be expressed as C m = C im = C i (t = 0, 0 < x < L) (47) S m = S im = S i (t = 0, 0 < x < L) (48) d m m m C vco vc D ( x 0, t t p) x m m m C 0 vc D ( x 0, t t p) x (49) (50) C x m 0 ( x L, t 0) These conditions are similar to those described earlier for the transport of a solute pulse (input) in a uniform soil having a finite length L where a steady water flux v was maintained constant. The soil column is considered as having uniform retention properties as well as having uniform ρ and θ. It is further assumed that equilibrium conditions exist between the solute present in the soil solution of the mobile water phase (i.e. interaggregate) and that present in the immobile (or intera-aggregate) phase. During flow interruption or stop flow, the convective-dispersive transport reduces to that of the diffusion equation. Input Data File An input file must be provided by the user for the selected model. The input model specifies initial and boundary conditions and can be provided in two different ways: a. Manual entry by filling out the template provided below. b. As an external ASII file (,dat or txt). A sample of the input data file referred as TRACER-INPUT.DAT and is given in the INPUTFILES folder to be downloaded by the user. Samples of input files in a template format are included in this package. Model output is given in txt format and must be named and saved by the user. Graphics of simulations are also generated which can be saved by the user. The example given 98 (51)

99 here is based on experimental data of Reedy et al. (1996) where a bromide pulse was introduced in a small column of fractured saprolite and subject to six flow interruptions. The purpose was to assess the extent of physical nonequilibrium in this material. Reedy, O.C., P.M. Jardine, G.V. Wilson, and H.M. Selim Quantifying the diffusive mass transfer of nonreactive solutes in columns of fractured saprolite using flow interruption. Soil Sci. Soc. Am. J. 60: Template for the TRACER model 99
Computational modelling of reactive transport in hydrogeological systems
 Water Resources Management III 239 Computational modelling of reactive transport in hydrogeological systems N. J. Kiani, M. K. Patel & C.-H. Lai School of Computing and Mathematical Sciences, University
1D Verification Examples
 1 Introduction 1D Verification Examples Software verification involves comparing the numerical solution with an analytical solution. The objective of this example is to compare the results from CTRAN/W
Removal of cationic surfactants from water using clinoptilolite zeolite
 2098 From Zeolites to Porous MOF Materials the 40 th Anniversary of International Zeolite Conference R. Xu, Z. Gao, J. Chen and W. Yan (Editors) 2007 Elsevier B.V. All rights reserved. Removal of cationic
RADIONUCLIDE DIFFUSION IN GEOLOGICAL MEDIA
 GEOPHYSICS RADIONUCLIDE DIFFUSION IN GEOLOGICAL MEDIA C. BUCUR 1, M. OLTEANU 1, M. PAVELESCU 2 1 Institute for Nuclear Research, Pitesti, Romania, crina.bucur@scn.ro 2 Academy of Scientists Bucharest,
RT3D Rate-Limited Sorption Reaction
 GMS TUTORIALS RT3D Rate-Limited Sorption Reaction This tutorial illustrates the steps involved in using GMS and RT3D to model sorption reactions under mass-transfer limited conditions. The flow model used
Pesticide sorption and diffusion in natural clay loam aggregates
 Pesticide sorption and diffusion in natural clay loam aggregates Wendy van Beinum, Sabine Beulke, Colin Brown Cranfield University, Silsoe Central Science Laboratory, York Funded by BBSRC Time-dependent
Competitive sorption and multiple-species subsurface transport of nitro-aromatic explosives: implications for their mobility at contaminated sites
 Groundwater Quality: Remediation and Protection (Proceedings of the GQ'98 Conference held at Tubingen, Germany, September 1998). 1AHS Publ. no. 250, f998. T7 z ' Competitive sorption and multiple-species
Shirley E. Clark, Ph.D., P.E., D. WRE Robert E. Pitt, Ph.D., P.E., BCEE, D. WRE
 Shirley E. Clark, Ph.D., P.E., D. WRE Robert E. Pitt, Ph.D., P.E., BCEE, D. WRE Current PA Guidance Many guidance documents apply expected pollutant removals based on literature. However, typically presented
THE ESTIMATION OF THE RADIONUCLIDE TRANSPORT PARAMETERS USING THE CDE MODEL
 Romanian Reports in Physics, Vol. 59, No. 4, P. 1193 104, 007 Dedicated to Prof. Dumitru Barbu Ion s 70th Anniversary THE ESTIMATION OF THE RADIONUCLIDE TRANSPORT PARAMETERS USING THE CDE MODEL C. BUCUR
Eckhard Worch. Adsorption. Technology in Water. Treatment. Fundamentals, Processes, and Modeling DE GRUYTER
 Eckhard Worch Adsorption Technology in Water Treatment Fundamentals, Processes, and Modeling DE GRUYTER Contents Preface xi 1 Introduction 1 1.1 Basic concepts and definitions 1 1.1.1 Adsorption as a surface
Boron Treatment Technology for CCR Wastewater, Ash Leachate, and Groundwater
 2017 World of Coal Ash (WOCA) Conference in Lexington, KY - May 9-11, 2017 http://www.flyash.info/ Boron Treatment Technology for CCR Wastewater, Ash Leachate, and Groundwater Allison Kreinberg 1, Bruce
Chapter 1. Introduction
 Introduction 1 Introduction Scope Numerous organic chemicals are introduced into the environment by natural (e.g. forest fires, volcanic activity, biological processes) and human activities (e.g. industrial
Code-to-Code Benchmarking of the PORFLOW and GoldSim Contaminant Transport Models using a Simple 1-D Domain
 Code-to-Code Benchmarking of the PORFLOW and GoldSim Contaminant Transport Models using a Simple 1-D Domain - 11191 Robert A. Hiergesell and Glenn A. Taylor Savannah River National Laboratory SRNS Bldg.
v. 8.0 GMS 8.0 Tutorial RT3D Double Monod Model Prerequisite Tutorials None Time minutes Required Components Grid MODFLOW RT3D
 v. 8.0 GMS 8.0 Tutorial Objectives Use GMS and RT3D to model the reaction between an electron donor and an electron acceptor, mediated by an actively growing microbial population that exists in both soil
RT3D Double Monod Model
 GMS 7.0 TUTORIALS RT3D Double Monod Model 1 Introduction This tutorial illustrates the steps involved in using GMS and RT3D to model the reaction between an electron donor and an electron acceptor, mediated
K.A. Terzi 1,2, I. Bountas 1,2 C.A. Aggelopoulos 1, C.D. Tsakiroglou 1
 K.A. Terzi 1,2, I. Bountas 1,2 C.A. Aggelopoulos 1, C.D. Tsakiroglou 1 1 Foundation for Research and Technology Hellas Institute of Chemical Engineering Sciences 2 Department of Chemical Engineering, Univ.
Batch Adsorption Test of Phenol on Soils
 Batch Adsorption Test of Phenol on Soils Mohd Raihan Taha Dept. of Civil & Structural Engineering, and Institute for Environment & Development (LESTARI) Universiti Kebangsaan Malaysia Contents Introduction
GMS 8.0 Tutorial MT3DMS Advanced Transport MT3DMS dispersion, sorption, and dual domain options
 v. 8.0 GMS 8.0 Tutorial MT3DMS dispersion, sorption, and dual domain options Objectives Learn about the dispersion, sorption, and dual domain options in MT3DMS Prerequisite Tutorials None Required Components
Department of Civil Engineering-I.I.T. Delhi CVL722 1st Semester HW Set2. Adsorption
 Department of Civil Engineering-I.I.T. Delhi CVL722 1st Semester 2016-17 HW Set2 Adsorption Q1: For the following information, determine Langmuir and Freundlich model constants? Also plot Q of these models
STUDIES ON THE SORPTION OF PHOSPHATE ON SOME SOILS OF INDIA SATURATED WITH DIFFERENT CATIONS
 I.J.S.N., VOL. 2(2) 211: 327-333 ISSN 2229 6441 STUDIES ON THE SORPTION OF PHOSPHATE ON SOME SOILS OF INDIA SATURATED WITH DIFFERENT CATIONS Bansal, O. P. Chemistry Department, D.S. College, Aligarh-221
BAE 820 Physical Principles of Environmental Systems
 BAE 820 Physical Principles of Environmental Systems Catalysis of environmental reactions Dr. Zifei Liu Catalysis and catalysts Catalysis is the increase in the rate of a chemical reaction due to the participation
Comparative Study of Transport and Diffusion Coefficient of Copper and Cadmium in Saturated Clay and Fined Grained Soil
 International Journal of Technical Innovation in Modern Engineering & Science (IJTIMES) Impact Factor: 5.22 (SJIF-217), e-issn: 2455-2585 Volume 4, Issue 7, July-218 Comparative Study of Transport and
Colloid and colloid-facilitated transport modeling using HPx
 Colloid and colloid-facilitated transport modeling using HPx D. Jacques 1, D. Zhou 2, J. Makselon 3, I. Engelhardt 2, and S. Thiele-Bruh 4 1 SCK-CEN, 2 TU Berlin, 3 Forschungszentrum Jülich GmbH, 4 University
The Geochemist s Workbench
 The Geochemist s Workbench GWB Essentials The Geochemist's Workbench 9.0 Essentials edition makes quick work of the tasks most commonly encountered in geochemical modeling. With a few mouse clicks, you
Chapter 7: Anion and molecular retention
 I. Anions and molecules of importance in soils Anions of major importance to agricultural soils and soil chemistry are: H 2 PO - 4, HPO 2-4, SO 2-4, HCO - 3, NO - 3, Cl -, F - and OH -. Also, micronutrients
RT3D Double Monod Model
 GMS TUTORIALS RT3D Double Monod Model This tutorial illustrates the steps involved in using GMS and RT3D to model the reaction between an electron donor and an electron acceptor, mediated by an actively
PREDICTION OF CADMIUM ACCUMULATION IN A HETEROGENEOUS SOIL USING A SCALED SORPTION MODEL
 ModelCARE 90: Calibration and Reliability in Groundwater Modelling (Proceedings of the conference held in The Hague, September 1990). IAHS Publ. no. 195, 1990. PREDICTION OF CADMIUM ACCUMULATION IN A HETEROGENEOUS
VISUAL SOLUTE TRANSPORT: A COMPUTER CODE FOR USE IN HYDROGEOLOGY CLASSES
 VISUAL SOLUTE TRANSPORT: A COMPUTER CODE FOR USE IN HYDROGEOLOGY CLASSES Kathryn W. Thorbjarnarson Department of Geological Sciences, San Diego State University, 5500 Campanile Drive, San Diego, California
Surface Complexation.
 Surface Complexation. Jean-François Gaillard, Notes for CE-367 OBJECTIVES To show how the presence of particles in natural and engineered systems controls the fate of many trace elements. The concepts
Application of Fe 2 O 3 nanoparticles in Heavy Metal Removal
 Application of Fe 2 O 3 nanoparticles in Heavy Metal Removal 5.1 Introduction Different contaminants are released to water bodies due to the rapid industrialization of human society, including heavy metal
Laboratory Investigation of Transport and Treatment of Chromium in Groundwater at Liwa district, Abu Dhabi
 Laboratory Investigation of Transport and Treatment of Chromium in Groundwater at Liwa district, Abu Dhabi Wali Al-Rahman 1, Munjed Maraqa 2 1 Department of Chemical and Petroleum Engineering, U.A.E. University,
6.6 Solute Transport During Variably Saturated Flow Inverse Methods
 6.6 Solute Transport During Variably Saturated Flow Inverse Methods JIÌÍ ŠIMæNEK AND MARTINUS TH. VAN GENUCHTEN, USDA-ARS, George E. Brown, Jr. Salinity Laboratory, Riverside, California DIEDERIK JACQUES,
Three-dimensional Modelling of Reactive Solutes Transport in Porous Media
 151 A publication of CHEMICAL ENGINEERING TRANSACTIONS VOL. 41, 214 Guest Editors: Simonetta Palmas, Michele Mascia, Annalisa Vacca Copyright 214, AIDIC Servizi S.r.l., ISBN 978-88-9568-32-7; ISSN 2283-9216
EXAMPLE PROBLEMS. 1. Example 1 - Column Infiltration
 EXAMPLE PROBLEMS The module UNSATCHEM is developed from the variably saturated solute transport model HYDRUS-1D [Šimůnek et al., 1997], and thus the water flow and solute transport parts of the model have
APPLICATION OF ADSORPTION PACKED-BED REACTOR MODEL FOR PHENOL REMOVAL
 Tenth International Water Technology Conference, IWTC10 2006, Alexandria, Egypt 131 APPLICATION OF ADSORPTION PACKED-BED REACTOR MODEL FOR PHENOL REMOVAL M. T. Sorour, F. Abdelrasoul and W.A. Ibrahim Sanitary
Chemical Hydrogeology
 Physical hydrogeology: study of movement and occurrence of groundwater Chemical hydrogeology: study of chemical constituents in groundwater Chemical Hydrogeology Relevant courses General geochemistry [Donahoe]
Chemical Reactions and Chemical Reactors
 Chemical Reactions and Chemical Reactors George W. Roberts North Carolina State University Department of Chemical and Biomolecular Engineering WILEY John Wiley & Sons, Inc. x Contents 1. Reactions and
Relevance of Intra-Particle Diffusion in Modelling Hydrocarbon Transport through Dual-Porosity Porous Media in the Absence and Presence of Particles
 Relevance of Intra-Particle Diffusion in Modelling Hydrocarbon Transport through Dual-Porosity Porous Media in the Absence and Presence of Particles Dr. Stephane Ngueleu, Prof. Peter Grathwohl, Prof. Olaf
IMO LATERITIC SOIL AS A SORBENT FOR HEAVY METALS
 IJRRAS 4 (1) July 21 IMO LATERITIC SOIL AS A SORBENT FOR HEAVY METALS Felix F. Udoeyo 1, Robert Brooks 2, Hilary Inyang 3 & Sunyoung Bae 4. 1 Assistant Professor, Temple University, Dept. of Civil and
Estimation of Flow Geometry, Swept Volume, and Surface Area from Tracer Tests
 Estimation of Flow Geometry, Swept Volume, and Surface Area from Tracer Tests Paul W. Reimus, Los Alamos National Laboratory G. Michael Shook, Chevron Energy Technology Company 28 th Oil Shale Symposium
NATURAL ZEOLITE AS A PERMEABLE REACTIVE BARRIER
 NATURAL ZEOLITE AS A PERMEABLE REACTIVE BARRIER PREDICTION OF LEAD CONCENTRATION PROFILE THROUGH ZEOLITE BARRIER N. Vukojević Medvidović, J. Perić, M. Trgo, M. Ugrina, I. Nuić University of Split, Faculty
A First Course on Kinetics and Reaction Engineering Unit 33. Axial Dispersion Model
 Unit 33. Axial Dispersion Model Overview In the plug flow reactor model, concentration only varies in the axial direction, and the sole causes of that variation are convection and reaction. Unit 33 describes
Numerical Solution of the Two-Dimensional Time-Dependent Transport Equation. Khaled Ismail Hamza 1 EXTENDED ABSTRACT
 Second International Conference on Saltwater Intrusion and Coastal Aquifers Monitoring, Modeling, and Management. Mérida, México, March 3-April 2 Numerical Solution of the Two-Dimensional Time-Dependent
Kinetics of Iron (II) Removal from Aqueous Solution Using Activated Dolomite
 Removal from Aqueous Solution Using Activated Dolomite") The Open Chemical Engineering Journal, 27, 1, 2329 23 Kinetics of Iron (II) Removal from Aqueous Solution Using Activated Dolomite G.M. Walker*, G. Connor and S.J. Allen School of Chemistry and Chemical
The Open Chemical Engineering Journal, 27, 1, 2329 23 Kinetics of Iron (II) Removal from Aqueous Solution Using Activated Dolomite G.M. Walker*, G. Connor and S.J. Allen School of Chemistry and Chemical
Modeling the Fate and Transport of Engineered Nanoparticles in Porous Media
 Modeling the Fate and Transport of Engineered Nanoparticles in Porous Media Nadim Copty Institute of Environmental Sciences Bogazici University Istanbul, Turkey NM2PorousMedia, Dubrovnik, Croatia, Sept.
CYDAR User Manual Two-phase flow module with chemical EOR
 CYDAR User Manual Two-phase flow module with chemical EOR 1 CYDAR - Two-phase flow module with chemical EOR CYDAR USER MANUAL TWO-PHASE FLOW MODULE WITH CHEMICAL EOR... 1 CYDAR - TWO-PHASE FLOW MODULE
Effect of Heat Treatment on Phosphate Sorption by Soils from Different Ecologies
 Effect of Heat Treatment on Phosphate Sorption by Soils from Different Ecologies 1* Aghedo, J.E., 2 Ukpebor, E. and 3 Oviasogie, P.O., 4 Omorogbe, S.O. 1Department of Chemistry, College of Education, Ekiadolor,
CO 2 storage capacity and injectivity analysis through the integrated reservoir modelling
 CO 2 storage capacity and injectivity analysis through the integrated reservoir modelling Dr. Liuqi Wang Geoscience Australia CO 2 Geological Storage and Technology Training School of CAGS Beijing, P.
v GMS 10.4 Tutorial RT3D Double-Monod Model Prerequisite Tutorials RT3D Instantaneous Aerobic Degradation Time minutes
 v. 10.4 GMS 10.4 Tutorial RT3D Double-Monod Model Objectives Use GMS and RT3D to model the reaction between an electron donor and an electron acceptor, mediated by an actively growing microbial population
ROLE OF PORE-SCALE HETEROGENEITY ON REACTIVE FLOWS IN POROUS MATERIALS: VALIDITY OF THE CONTINUUM REPRESENTATION OF REACTIVE TRANSPORT
 ROLE OF PORE-SCALE HETEROGENEITY ON REACTIVE FLOWS IN POROUS MATERIALS: VALIDITY OF THE CONTINUUM REPRESENTATION OF REACTIVE TRANSPORT PETER C. LICHTNER 1, QINJUN KANG 1 1 Los Alamos National Laboratory,
Physicochemical Processes
 Lecture 3 Physicochemical Processes Physicochemical Processes Air stripping Carbon adsorption Steam stripping Chemical oxidation Supercritical fluids Membrane processes 1 1. Air Stripping A mass transfer
Kinetics of Arsenate Adsorption-Desorption in Soils
 Kinetics of Arsenate Adsorption-Desorption in Soils HUA ZHANG AND H. M. SELIM* Department of Agronomy and Environmental Management, Sturgis Hall, Louisiana State University, Baton Rouge, Louisiana 70803
Department of Ocean Engineering, Indian Institute of Technology-Madras, Chennai , India. *Corresponding author.
 J. Earth Syst. Sci. (2018) 127:53 c Indian Academy of Sciences https://doi.org/10.1007/s12040-018-0950-3 Interaction of dissolution, sorption and biodegradation on transport of BTEX in a saturated groundwater
Summer Intern Project/Model at Stroud Water Research Center. Xiaojuan (Cathy) Yu
 Yu") Summer Intern Project/Model at Stroud Water Research Center Xiaojuan (Cathy) Yu If we knew what we were doing, it wouldn t be called Research. A. Einstein Outline Introducing OTIS Mathematical model in
Summer Intern Project/Model at Stroud Water Research Center Xiaojuan (Cathy) Yu If we knew what we were doing, it wouldn t be called Research. A. Einstein Outline Introducing OTIS Mathematical model in
Adsorption Processes. Ali Ahmadpour Chemical Eng. Dept. Ferdowsi University of Mashhad
 Adsorption Processes Ali Ahmadpour Chemical Eng. Dept. Ferdowsi University of Mashhad Contents Introduction Principles of adsorption Types of adsorption Definitions Brief history Adsorption isotherms Mechanism
Engineering Theory of Leaching
 Engineering Theory of Leaching An approach to non-ideal reactors and scale- up of pressure leaching systems Presented by Lynton Gormely, P.Eng., Ph.D. The Problem given lab scale batch results, predict
5. Collection and Analysis of. Rate Data
 5. Collection and nalysis of o Objectives Rate Data - Determine the reaction order and specific reaction rate from experimental data obtained from either batch or flow reactors - Describe how to analyze
MOF-76: From Luminescent Probe to Highly Efficient U VI Sorption Material
 MOF-76: From Luminescent Probe to Highly Efficient U VI Sorption Material Weiting Yang, a Zhi-Qiang Bai, b Wei-Qun Shi*, b Li-Yong Yuan, b Tao Tian, a Zhi-Fang Chai*, c Hao Wang, a and Zhong-Ming Sun*
Impact of bentonite colloids on radionuclide transport in fractured systems results from field experiments and modelling
 Ulrich Noseck, Judith Flügge, Thorsten Schäfer Impact of bentonite colloids on radionuclide transport in fractured systems results from field experiments and modelling Role of colloids in the Safety Case
Shirley E. Clark, Ph.D., P.E., D. WRE Penn State Harrisburg. Robert Pitt, Ph.D., P.E., BCEE, D. WRE University of Alabama
 Shirley E. Clark, Ph.D., P.E., D. WRE Penn State Harrisburg Robert Pitt, Ph.D., P.E., BCEE, D. WRE University of Alabama Site Stormwater Characteristics and Permit Limits Analytes on Permit 90 th percentile
Reactive-transport modelling of electrokinetic extraction of heavy metals from marine sediments
 EREM63 Reactive-transport modelling of electrokinetic extraction of heavy metals from marine sediments Matteo Masi a, *, Alessio Ceccarini b, Renato Iannelli a a University of Pisa, Department of Energy,
Sorptive treatment of explosives and heavy metals in water using biochar
 2013 US Biochar Conference U. Mass, Amherst, MA, USA October 14, 2013 Sorptive treatment of explosives and heavy metals in water using biochar Seok-Young Oh 1*, Yong-Deuk Seo 1, Hyun-Su Yoon 1, Myong-Keun
EVALUATION OF CRITICAL FRACTURE SKIN POROSITY FOR CONTAMINANT MIGRATION IN FRACTURED FORMATIONS
 ISSN (Online) : 2319-8753 ISSN (Print) : 2347-6710 International Journal of Innovative Research in Science, Engineering and Technology An ISO 3297: 2007 Certified Organization, Volume 2, Special Issue
PHOSPHATE ADSORPTION BY THE MIXED INORGANIC ION EXCHANGER BASED ON FE-MN HYDROUS OXIDES: EQUILIBRIUM AND FTIR STUDIES
 Proceedings of the 14 th International Conference on Environmental Science and Technology Rhodes, Greece, 35 September 2015 PHOSPHATE ADSORPTION BY THE MIXED INORGANIC ION EXCHANGER BASED ON FEMN HYDROUS
Temperature dependent multiphase flow and transport
 Temperature dependent multiphase flow and transport J.F. Sykes, A.G. Merry and J. Zhu Department of Civil Engineering, University of Waterloo, Waterloo, Ontario, Canada N2L 3G1 E-mail: sykesj@uwaterloo.ca
Lecture 16 Groundwater:
 Reading: Ch 6 Lecture 16 Groundwater: Today 1. Groundwater basics 2. inert tracers/dispersion 3. non-inert chemicals in the subsurface generic 4. non-inert chemicals in the subsurface inorganic ions Next
CHEMICAL EFFECTS OF GOETHITE COLLOID ON THE TRANSPORT OF URANIUM (VI) THROUGH A SATURATED QUARTZ-PACKED COLUMN
 THROUGH A SATURATED QUARTZ-PACKED COLUMN") IAEA-CN-78/8 CHEMICAL EFFECTS OF GOETHITE COLLOID ON THE TRANSPORT OF URANIUM (VI) THROUGH A SATURATED QUARTZ-PACKED COLUMN A.A. ZAKI, M.Y. KHALIL, M.E. NAGY, H.F. ALY Atomic Energy Authority, Hot Laboratory
IAEA-CN-78/8 CHEMICAL EFFECTS OF GOETHITE COLLOID ON THE TRANSPORT OF URANIUM (VI) THROUGH A SATURATED QUARTZ-PACKED COLUMN A.A. ZAKI, M.Y. KHALIL, M.E. NAGY, H.F. ALY Atomic Energy Authority, Hot Laboratory
Engineering and. Tapio Salmi Abo Akademi Abo-Turku, Finland. Jyri-Pekka Mikkola. Umea University, Umea, Sweden. Johan Warna.
 Chemical Reaction Engineering and Reactor Technology Tapio Salmi Abo Akademi Abo-Turku, Finland Jyri-Pekka Mikkola Umea University, Umea, Sweden Johan Warna Abo Akademi Abo-Turku, Finland CRC Press is
Laterite and modified laterite as efficient arsenic adsorbents
 Laterite and modified laterite as efficient arsenic adsorbents Yoann Glocheux Dr. Gavin Walker Pr. Stephen Allen ATWARM meeting 01/05/12, Cranfield University, Cranfield Plan Introduction Material presentation
CHEMICAL ENGINEEERING AND CHEMICAL PROCESS TECHNOLOGY Vol. III - Ideal Models Of Reactors - A. Burghardt
 IDEAL MODELS OF REACTORS A. Institute of Chemical Engineering, Polish Academy of Sciences, Poland Keywords: Thermodynamic state, conversion degree, extent of reaction, classification of chemical reactors,
Solute dispersion in a variably saturated sand
 WATER RESOURCES RESEARCH, VOL. 39, NO. 6, 1155, doi:10.1029/2002wr001649, 2003 Solute dispersion in a variably saturated sand Takeshi Sato Department of Civil Engineering, Gifu University, Yanagido, Gifu,
Treatment of Colloids in the Safety Case
 Treatment of Colloids in the Safety Case Clay Colloids in Aqueous Systems 3 4 February 2016, Berlin Dr Amy Shelton, Radioactive Waste Management (RWM) KBS-3 Concept Based on the multi- barrier principles
Carbon dioxide removal processes by alkanolamines in aqueous organic solvents Hamborg, Espen Steinseth
 University of Groningen Carbon dioxide removal processes by alkanolamines in aqueous organic solvents Hamborg, Espen Steinseth IMPORTANT NOTE: You are advised to consult the publisher's version (publisher's
ACTIVATED CARBON ADSORPTION TECHNOLOGIES
 PART 1 ACTIVATED CARBON ADSORPTION TECHNOLOGIES For drinking water treatment, activated carbon is primarily used in two ways: fixed bed reactors with granular activated carbon (GAC) and slurry application
Effective diffusion coefficients measurement in polysaccharide based hydrogels.
 Effective diffusion coefficients measurement in polysaccharide based hydrogels. Aim of the work To estimate effective diffusion coefficients of substrate diffusion from limited volume of solution into
Engineering. Green Chemical. S. Suresh and S. Sundaramoorthy. and Chemical Processes. An Introduction to Catalysis, Kinetics, CRC Press
 I i Green Chemical Engineering An Introduction to Catalysis, Kinetics, and Chemical Processes S. Suresh and S. Sundaramoorthy CRC Press Taylor & Francis Group Boca Raton London New York CRC Press is an
Thermal Analysis Contents - 1
 Thermal Analysis Contents - 1 TABLE OF CONTENTS 1 THERMAL ANALYSIS 1.1 Introduction... 1-1 1.2 Mathematical Model Description... 1-3 1.2.1 Conventions and Definitions... 1-3 1.2.2 Conduction... 1-4 1.2.2.1
Hydrogen adsorption by graphite intercalation compounds
 62 Chapter 4 Hydrogen adsorption by graphite intercalation compounds 4.1 Introduction Understanding the thermodynamics of H 2 adsorption in chemically modified carbons remains an important area of fundamental
MODELING AND SIMULATION OF THE PROCESS OF PRECIPITATION AND DISSOLUTION OF THE MINERALS CALCITE AND DOLOMITE
 MODELING AND SIMULATION OF THE PROCESS OF PRECIPITATION AND DISSOLUTION OF THE MINERALS CALCITE AND DOLOMITE B. ELY 1, A. L. DE BORTOLI 1,2 1 Federal University of Rio Grande do Sul, Graduate Program in
ADSORPTION PROPERTIES OF As, Pb AND Cd IN SOFT SOIL AND META SEDIMENTARY RESIDUAL SOIL
 Engineering Postgraduate Conference (EPC) 2008 ADSORPTION PROPERTIES OF As, Pb AND Cd IN SOFT SOIL AND META SEDIMENTARY RESIDUAL SOIL R. Rosli 1, A. T. A Karim 1, A. A. A. Latiff 1 and M. R. Taha 2 Faculty
PUBLICATIONS. Water Resources Research. Nickel migration and retention dynamics in natural soil columns RESEARCH ARTICLE 10.
 PUBLICATIONS Water Resources Research RESEARCH ARTICLE Key Points: Retention by sorption and precipitation is needed to quantify dynamic processes Preferential pathways alter retention and overall nickel
Comparison of Heat and Mass Transport at the Micro-Scale
 Comparison of Heat and Mass Transport at the Micro-Scale E. Holzbecher, S. Oehlmann Georg-August Univ. Göttingen *Goldschmidtstr. 3, 37077 Göttingen, GERMANY, eholzbe@gwdg.de Abstract: Phenomena of heat
On the Early Development of Dispersion in Flow through a Tube with Wall Reactions
 World Academy of Science, Engineering and Technology 9 7 On the Early Development of Dispersion in Flow through a Tube with Wall Reactions M. W. Lau, and C. O. Ng Abstract This is a study on numerical
Site Characterization & Hydrogeophysics
 Site Characterization & Hydrogeophysics (Source: Matthew Becker, California State University) Site Characterization Definition: quantitative description of the hydraulic, geologic, and chemical properties
Removal of Copper (II) from Aqueous Solutions using Chalk Powder
 from Aqueous Solutions using Chalk Powder") Est. 1984 ORIENTAL JOURNAL OF CHEMISTRY An International Open Free Access, Peer Reviewed Research Journal www.orientjchem.org ISSN: 0970-020 X CODEN: OJCHEG 2013, Vol. 29, No. (2): Pg. 713-717 Removal
Est. 1984 ORIENTAL JOURNAL OF CHEMISTRY An International Open Free Access, Peer Reviewed Research Journal www.orientjchem.org ISSN: 0970-020 X CODEN: OJCHEG 2013, Vol. 29, No. (2): Pg. 713-717 Removal
Procedure for the Determination of Permanganate Oxidizable Carbon
 Procedure for the Determination of Permanganate Oxidizable Carbon Overview: Steve Culman, Mark Freeman, Sieglinde Snapp Kellogg Biological Station, Michigan State University, Hickory Corners, MI, 49060
1. Water in Soils: Infiltration and Redistribution
 Contents 1 Water in Soils: Infiltration and Redistribution 1 1a Material Properties of Soil..................... 2 1b Soil Water Flow........................... 4 i Incorporating K - θ and ψ - θ Relations
Athena Visual Software, Inc. 1
 Athena Visual Studio Visual Kinetics Tutorial VisualKinetics is an integrated tool within the Athena Visual Studio software environment, which allows scientists and engineers to simulate the dynamic behavior
Nitrogen, ammonia, colorimetry, salicylate-hypochlorite, automated-segmented flow
 1. Application Nitrogen, ammonia, colorimetry, salicylate-hypochlorite, automated-segmented flow Parameters and Codes: Nitrogen, ammonia, dissolved, I-2522-90 (mg/l as N): 00608 Nitrogen, ammonia, total-in-bottom-material,
WM 00 Conference, February 27 March 2, 2000, Tucson, AZ DIFFUSION COEFFICIENTS OF CRITICAL RADIONUCLIDES FROM RADIOACTIVE WASTE IN GEOLOGICAL MEDIUM
 DIFFUSION COEFFICIENTS OF CRITICAL RADIONUCLIDES FROM RADIOACTIVE WASTE IN GEOLOGICAL MEDIUM ABSTRACT: C. Bucur, A.Popa, C. Arsene and M.Olteanu Institute for Nuclear Research, P.O. Box 78, 0300 Pitesti
Notes on reaction-diffusion cases with effectiveness factors greater than one! Richard K. Herz,
 Notes on reaction-diffusion cases with effectiveness factors greater than one! Richard K. Herz, rherz@ucsd.edu For isothermal n-th order reactions where n >= 0, the catalyst effectiveness factor value
Reaction and Diffusion in a Porous Catalyst Pellet. by Richard K. Herz
 Reaction and Diffusion in a Porous Catalyst Pellet by Richard K. Herz Solid catalysts are often called "heterogeneous catalysts" meaning that they are in a different phase from fluid reactants
Plant Nutrition and Transport. Chapter 29
 Plant Nutrition and Transport Chapter 29 Overview: Underground Plants The success of plants depends on their ability to gather and conserve resources from their environment. The transport of materials
SAFETY ASSESSMENT CODES FOR THE NEAR-SURFACE DISPOSAL OF LOW AND INTERMEDIATE-LEVEL RADIOACTIVE WASTE WITH THE COMPARTMENT MODEL: SAGE AND VR-KHNP
 SAFETY ASSESSMENT CODES FOR THE NEAR-SURFACE DISPOSAL OF LOW AND INTERMEDIATE-LEVEL RADIOACTIVE WASTE WITH THE COMPARTMENT MODEL: SAGE AND VR-KHNP J. B. Park, J. W. Park, C. L. Kim, M. J. Song Korea Hydro
Adsorption Equilibria. Ali Ahmadpour Chemical Eng. Dept. Ferdowsi University of Mashhad
 Adsorption Equilibria Ali Ahmadpour Chemical Eng. Dept. Ferdowsi University of Mashhad Contents Introduction Adsorption isotherm models Langmuir isotherm Volmer isotherm Fowler-Guggenheim isotherm Hill-deBoer
14MIB±*ft * * *» Volume II! Commission II. Kyoto Japan August 12-18, 1990
 14MIB±*ft * * *» Kyoto Japan August 12-18, 1990 Volume II! Commission II of Soil Science 14 e Congres International de la Science du Sol 14. Internationaler Bodenkundlicher Kongreß KINETICS OF SOIL CHEMICAL
Rhodamine WT as a reactive tracer: laboratory study and field consequences
 Tracers and Modelling in Hydrogeology (Proceedings of the TraM'2000 Conference held at Liege, Belgium, May 2000). IAHS Publ. no. 262, 2000. 201 Rhodamine WT as a reactive tracer: laboratory study and field
Adsorption-desorption Study of Heavy Metals on Sandy-loam Soil of Sapele Metropolis
 IOSR Journal of Environmental Science, Toxicology and Food Technology (IOSR-JESTFT) e-issn: 2319-242,p- ISSN: 2319-2399.Volume 11, Issue 8 Ver. I (August. 217), PP 17-27 www.iosrjournals.org Adsorption-desorption
Key words: tracer, reservoir, simulation, software
 RESERVOIR CHARACTERIZATION BY TRACER TESTING Serhat and Ender OKANDAN Petroleum Engineering Department, Middle East Technical University, AnkaraTURKEY Key words: tracer, reservoir, simulation, software