The Illumination of Structure using Light Scattering. Michael Caves Product Technical Specialist for Biophysical Characterisation
|
|
|
- Leslie Beasley
- 6 years ago
- Views:
Transcription


1 The Illumination of Structure using Light Scattering Michael Caves Product Technical Specialist for Biophysical Characterisation


2 Light Scattering Laser Scattered light Detector Scattered light intensity α size 6
3 Static Light Scattering (SLS) Mean Average count rate measured 125 Intensity (kcps) Mean Count Rate 120 Time All light scattering methods discussed measure this, in addition to the technique-specific parameters
4 Outline Theory Applications and specifications
5 Outline - Theory Dynamic Light Scattering SEC-LS Interaction Parameters
6 Outline - Theory Dynamic Light Scattering SEC-LS Interaction Parameters
7 Static Light Scattering (SLS) Mean Average count rate measured at multiple concentrations and used to calculate absolute molecular weight and/or A Intensity (kcps) Mean Count Rate 120 Time No resolution possible, average M w is generated
8 Dynamic Light Scattering (DLS) Fluctuation Frequency of count rate measured and used to calculate hydrodynamic size Resolution Possible 125 Intensity (kcps) 120 Time Small Particle = Fast Brownian motion = Fast Intensity Fluctuations Large Particle = Slow Brownian motion = Slow Intensity Fluctuations


9 DLS Measures Fluctuations in the Scattered Light Intensity Caused by Brownian Motion Small Particle = Fast Brownian motion = Fast Intensity Fluctuations Large Particle = Slow Brownian motion = Slow Intensity Fluctuations

10 Hydrodynamic Diameter Definition The diameter of a hard sphere that diffuses at the same speed as the particle or molecule being measured Depends not only on the size of the particle core, but also on any surface structure
11 DLS Measures Fluctuations in the Scattered Light Intensity Caused by Brownian Motion Laser Small Particles Large Particles Intensity Intensity Time Time
12 DLS Method Summary Intensity Fluctuations Detected Correlation Correlogram Correlogram analysis Size(s) and Polydispersity
13 1 0 Time Correlation Coefficient Time Time Time Intensity Intensity Correlation Coefficient (Auto)Correlation 0
14 1 0 Time Correlation Coefficient = 0 Time = 0 Time Time Intensity Intensity Correlation Coefficient (Auto)Correlation 0
15 1 0 Time Correlation Coefficient = 1 Time = 1 Time Time Intensity Intensity Correlation Coefficient (Auto)Correlation 0
16 1 0 Time Correlation Coefficient = 2 Time = 2 Time Time Intensity Intensity Correlation Coefficient (Auto)Correlation 0
17 1 0 Time Correlation Coefficient Time = 3 Time Time Intensity Intensity Correlation Coefficient (Auto)Correlation = 3 0
18 Time Time 1 0 Time Intensity Intensity Correlation Coefficient Time Correlation Coefficient (Auto)Correlation 0
19 The Correlogram Small Particles 1 Intensity Time 0 Time Large Particles Intensity Correlation Coefficient 0 correlate LOG 1 Correlation Coefficient Time 0 0 Time
20 The Correlogram Intercept gives a measure of S/N Exponential decay lifetime indicates hydrodynamic size Gradient indicates sample polydispersity Baseline quality used to assess contributions of Large particles
21 Obtaining Size from the Correlogram Particle size information is obtained by analysing the correlogram with various algorithms CUMULANTS (ISO13321) DISTRIBUTION Single exponential fit Multi-exponential fit Mean size (z-avg diam.) Estimate of the width of the distribution (PDI) Distribution of particle sizes (by intensity, volume or number)
22 Intensity, Volume and Number Distributions Consider a mixture of equal numbers of 5 and 50nm spheres Intensity (α d 6 ) Volume (α d 3 ) Number Relative proportion 1 1,000,000 Relative proportion 1 1,000 Relative proportion Diameter (nm) 5 50 Diameter (nm) 5 50 Diameter (nm) Intensity Distribution is calculated from the correlogram, Volume and Number are calculated from Intensity
23 Intensity, Volume and Number Distributions 150 µm Lysozyme (14600 Da) and 50 mm Arginine (174 Da) Relative proportion (%) Intensity Volume Number 0.67 nm 6 % 0.65 nm 93 % 0.64 nm 100 % Diameter (nm) 4.2 nm 94 % 3.7 nm 7 % 3.3 nm 0 %
24 DLS Summary Measures the Brownian motion of particles and uses to calculate hydrodynamic size Highly sensitive to large particles Simple cuvette based method Large range - < 1 nm > 1 µm
25 Outline - Theory Dynamic Light Scattering SEC-LS Interaction Parameters
26 Resolution DLS is a relatively low resolution technique Growth of trace amounts of aggregate, even dimer and trimer can be detected - but not necessarily resolved Greater resolution can be achieved through separation

27 Resolution - SEC Batch light scattering methods may struggle to fully resolve and characterise smaller oligomeric states Malvern s Viscotek SEC systems provide a separative solution to this problem


28 Resolution - SEC Separation based on the speed of flow through a porous column based on size rather than molecular weight Small Particle = Slow Flow Large Particle = Fast Flow Small Component Large Component Sample Solution
29 Traditional Concentration Detection Refractive Index and absorbance spectroscopy detectors Concentration detectors alone allow relative M W to be measured Retention volumes/times of sample components are compared with those of known standards
30 SEC Detection Traditionally, absorbance or refractive index detector used to analyse eluent as it flows off column Separate run of markers of known M w used to calculate Relative M w Biorad Vitamin B kda Equine Myoglobin 17 kda Chicken ovalbumin 44 kda Bovine Gam-Glob 158 kda Thyroglobulin 670 kda Sigma-Aldrich Cytochrome c 12.4 kda Carbonic anhydrase 29 kda BSA 66 kda Alc. Dehydrogenase 150 kda β-amylase 200 kda Blue Dextran 2000 kda
 13.2 14.2 16.0 16.")
31 Relative M w Parameter Hexamer Tetramer Dimer Monomer Peak RV (ml) RM W (kda)
32 Static Light Scattering (SLS) Mean Average count rate measured at multiple concentrations and used to calculate absolute molecular weight and/or A Intensity (kcps) Mean Count Rate 120 Time No resolution possible, average M w is generated
33 Relative Mw
34 SLS Molecular Weight Relationship of M w with scattered light intensity: KC R θ 1 M w P θ 2A 2 C 1/M w 25 C If C = 0 and scattering is isotropic: KC R 1 θ M w 56 C
35 SLS Molecular Weight Combination of concentration and light scattering detector gives absolute M w from a single run 1/M w
36 SLS Molecular Weight Relationship of M w with scattered light intensity: KC R θ 1 M w P θ 2A 2 C 1/M w 25 C If C = 0 and scattering is isotropic: KC R 1 θ M w 56 C
37 RALS Isotropic Scatterers For isotropic scatterers: 1/P θ = 0 KC R θ 1 M w P θ 2A 2 C No angular dependence Scattering can simply be measured at 90
")
 No")
38 Angular dissymmetry 1/P θ Different sized molecules scatter light in different directions with different intensity Small molecules of < ~ 30 nm diameter (< 1/20 of incident laser λ) scatter light evenly in all directions (isotropic scattering) Larger molecules scatter light in different directions with different intensities (anisotropic scattering) No interference
39 LALS Anisotropic Scatterers Light scattered at 0 cannot be directly measured KC R θ 1 M w P θ 2A 2 C Instead, we measure at 7 in order to minimise the effect of angular dependence
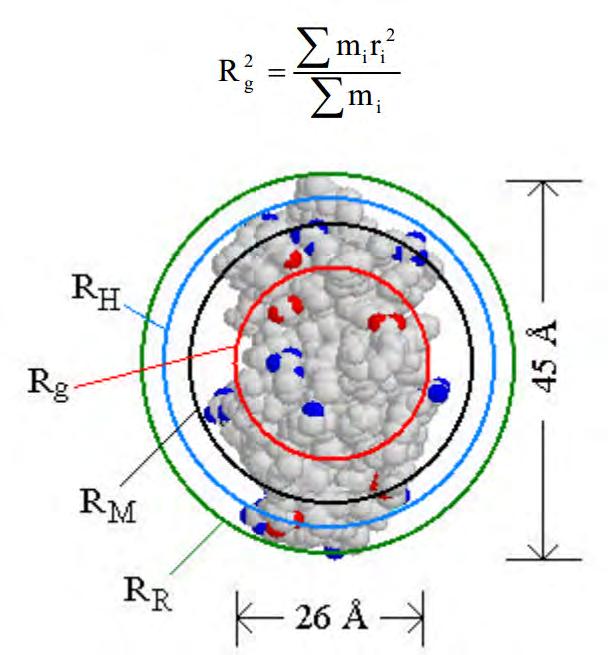
40 MALS 20 Anisotropic Scatterers Light scattered at 0 cannot be directly measured KC R θ 1 M w P θ 2A 2 C By plotting KC/R θ as a function of sin 2 (θ/2) we can extrapolate back to 0 Mw can be calculated from the KC/R θ at the intercept Rg can be calculated from the initial slope of the line


41 MALS 20 MALS-20 measures scattered light intensity over up to 20 angles and extrapolates back to zero in order to calculate molecular weight Allows accurate calculation of Radius of Gyration (R g ) for anisotropic scatterers R g gives useful information on the morphology of aggregates
42 Size?
43 SEC-LS summary High-Resolution purity, D H and M w analysis Using a SEC-MALS 20 detector allows accurate M w analysis of impure samples Conformation analysis (R g and Intrinsic Viscosity) Columnar interference can be a problem Separative Range: < 1 nm 100 nm
44 Outline - Theory Dynamic Light Scattering SEC-LS Zeta Potential

45 Zeta Potential (ZP) - Charge Zeta potential is the magnitude of charge at the slipping plane It is the zeta potential, not the surface charge, that determines inter-particle electrostatics Magnitude indicates the solution stability
46 Measuring Zeta Potential (ELS) Electrophoretic Light Scattering: Measurement of electrophoretic mobility based on light scattering Particles are not separated, since the direction of the electric field switches continuously during measurement Particles analysed, therefore, under their formulation conditions

47 Laser Doppler Electrophoresis Particle velocity V=0 F 1 Scattered light has same frequency as incident laser Particle velocity V>0 F 1 v Scattered light now has greater frequency than incident laser

48 Phase Analysis Light Scattering (PALS) F 1 F 2 A B A Interference produces modulated beam with frequency equal to difference between F 1 and F 2 Beat Frequency
49 Electrophoretic Light Scattering High zeta potential High electrophoretic mobility Large difference between scattered and ref. frequencies High Beat Frequency Beat frequency is then combined with a modulated reference frequency, produced by a piezoelectric crystal, in order to generate a phase plot
50 Phase Plot Phase Plot Shows the phase difference between the beat frequency and the modulator reference frequency over time Phase/Time = Frequency Phase (rad) Phase (rad) Frequency α Zeta Potential Time (s) Time (s)
51 Outline Theory Applications and specifications
52 Outline Applications and Specifications Batch (DLS) Separations (SLS) Stability Prediction (interaction parameters) Hardware
53 Outline Applications and Specifications Batch (DLS) Separations (SLS) Stability Prediction (interaction parameters) Hardware
54 Applications DLS is widely used for polymer analysis The sensitivity to larger particles makes it ideal for quality control The fundamentals of the measurement method makes the technique ideal for monitoring conformational changes
55 Pegylation Analysis Pegloticase has been reported to cause 92 % of patients to develop abs against it 10kDa PEG moiety may be cause of immunogenicity Attempts to conjugate Urc to smaller PEG moieties Zhang et al. (2012) PlosOne 7(6): e39659 PEG-Urc Conjugate Z-average Diameter (nm) PDI mpeg-rcu mpeg-rcu mpeg-rcu

56 Stability DLS extremely sensitive to protein aggregate formation Green = Freeze/thaw X 5 Blue = 4 C Red = 25 C To the right are the results of an IgG storage and stability study The aggregates formed upon freeze thaw, and also the larger aggregates formed at 25 C, exist only in trace amounts.
57 Polymer Conformation Mark Houwink relationship: D = km -α D = Diffusion Coefficient M = Molecular Weight α = Compactness k = constant for a particular polymer in a solvent Slope of plot of D/M gives compactness Since D α D H, slope of D H /M also gives compactness
58 Polymer Conformation α = 1 Rigid rod Polystyrene in Toluene α = Random Coil α = 0.3 Sphere α = 0.31 Polystyrene in toluene adopts a spherical conformation
59 Polymer Conformation Peltier Temperature control allows highly precise thermal profiling Allows analysis of temperature-dependent phase transitions
60 Polymer Conformation Phase Transition of Poly(Nisopropylacrylamide) at 32 C PNIPAM in DI Water Collapse of random coils into globules leads to increase in D H and RI Globule size is more uniform than coil size 10 C : PDI = C : PDI = 0.087
61 Polymer Conformation Increase in D H Polymer Dispersion (confidential) Decrease in Mean Count Rate Particles are swelling as the temperature increases

62 Polymer Conformation Used to study silica nanoparticles modified with polymer brush Brush growth measured upon addition to aqueous solution 450 nm particle early termination during production 120 nm particle polymers assume coiled conformation 200 nm particle polymers assume linear conformation Cheesman et al. (2013) Langmuir 29:
63 Protein Aggregation Amyloid formation of PGK in 190 mm NaCl, ph 2, monitored using SLS, DLS and CD Data suggested a 2-step model for protofibril formation: Step 1 - critical oligomer formation Step 2 - clustering of critical oligomers Aggregation is coupled with β- sheet formation Modler et al. (2003) JMB 325:
64 Antibody Binding Studies Size changes upon binding of IgG with GNP-protein A conjugate measured DLS allows binding to be followed over time after mixing of the two proteins (top) Alternatively, binding can be monitored as a function of component concentration (bottom) Quick, simple and inexpensive Jans et al. (2009) Anal Chem 81:
65 DLS Summary Quick analysis of size and purity (D H and PDI) DLS can be used to assess changes in polymer conformation High sensitivity means polymers can be assessed in solution or attached to other particles
66 Outline Applications and Specifications Batch (DLS) Separations (SLS) Stability Prediction (interaction parameters) Hardware
67 DLS Low Resolution Applications so far have involved analysis of change/detection SEC-separation necessary for high resolution analysis and quantification Range of detectors allows complete orthogonal analysis SLS can now be used to assess the molecular weights present in polydisperse samples
68 SEC Detection UV or Refractometer Concentration Relative M W RALS and LALS Absolute M W MALS 20 Absolute M W R g DLS D H Absolute M W Viscometer Intrinsic Viscosity
69 PMMA using Conventional Calibration Polystyrene standards used to build a calibration curve, used to calculate RM w of 95kDa Poly methyl methacrylate RM w = 88kDa The difference is due to the difference in structure between the PS and the PMMA
 the peak in this case R h must")
70 Poly (Methyl Methacrylate) (PMMA) Parameter Parameter Peak RV (ml) M w (kda) M n (kda) M w / M n R g (nm) 10.2 SEC-MALS gives absolute M W independent of column retention volume Additionally, Rg can be measured across (most of) the peak in this case R h must be relatively high
71 Uses of Relative M w R e fr a c tiv e In d e x ( mv) Retention Volume (ml) _19;37;32_AT_comb-ps_BPS_B108-1_01.vdt: Refrac tiv e Index Parameter Branched PS Linear PS Relative M W (kda) Absolute M W (kda)
72 Conformation We saw earlier how comparison of R h and M W can also be used to assess conformation and branching in batch mode DLS can also be used as an SEC detector Comparison of relative M W and absolute M W can also be used to assess conformation/branching Use of a Viscometry detector also gives conformation information
73 Intrinsic Viscosity Retention Volume (ml) Retention Volume (ml) Sample M w ή (dl/g) D H With Ca Without Ca
74 Conformation Intrinsic Viscosity (IV) α 1/Molecular Density (d) Knowledge of IV and M w also allows calculation of R h We have, therefore, 2 methods with which to calculate the hydrodynamic size DLS detector Viscometry and SLS detectors
75 Conformation R h, R g and IV Data File: _13;10;21_PROBE_3_01.vdt Method: p vcm Refractive Index Response (mv) Viscometer DP Response (mv) Low Angle Light Scattering Response (mv) R g = 19 nm (1 st point at which it can be measured here) R h = ~ 20 nm R h = 6 nm Log Radius of Gyration (Two Angle) Log Rh Retention Volume (ml)
76 IgG aggregation Parameter Aggregates Dimer Monomer Peak RV (ml) M w (kda) M n (kda) M w / M n R g (nm) Peak Wt % (RI)
77 IgG aggregation Aggregate Monomer
78 IgG aggregation Aggregates scatter anisotropically LALS or MALS must be used Parameter Aggregates Dimer Monomer Peak RV (ml) M w (kda) M n (kda) M w / M n R g (nm) Peak Wt % (RI)
79 Pepsin Degradation Products Parameter Aggregates Monomer Degraded protein Peak RV (ml) M w (kda) M n (kda) M w / M n R g (nm) Peak Wt % (RI)
 10.84 18.33 20.92 M w (kda) 4431 34.7 6.4 M n (kda) 3892 34.4 4.7 M w / M n 1.138 1.01 1.4 R g (nm) 69.9 - - Peak Wt % (RI) 0.8 56.9 42.")
80 Pepsin aggregation Pepsin aggregates scatter anisotropically LALS or MALS must be used Parameter Aggregates Monomer Degraded protein Peak RV (ml) M w (kda) M n (kda) M w / M n R g (nm) Peak Wt % (RI)
81 Bovine Serum Albumin Parameter Aggregates Trimer Dimer Monomer Peak RV (ml) M w (kda) M n (kda) M w / M n R g (nm) Peak Wt % (RI)
 379.72 206.7 135.3 66.8 M n (kda) 338.64 205.9 135.1 66.7 M w / M n 1.121 1.004 1.002 1.001 R g (nm) - - - - Peak Wt % (RI) 4 5.2 16.2 74.7")
82 Bovine Serum Albumin All components scatter isotropically RALS will give just as accurate a M W as LALS and MALS Parameter Aggregates Trimer Dimer Monomer Peak RV (ml) M w (kda) M n (kda) M w / M n R g (nm) Peak Wt % (RI)
 1601.0 681.5 M w / M n 1.617 1.007 R g (nm) - - Peak Wt % (RI) 16.")
83 Thyroglobulin Parameter Aggregates Monomer Peak RV (ml) M w (kda) M n (kda) M w / M n R g (nm) - - Peak Wt % (RI)
84 Natural Polymer Comparison Lots of parameters, giving complete orthogonal analysis of polymers But how can we compare between polymers? Parameter Pectin HPC Gum Arabic Peak RV (ml) M w (kda) M n (kda) M w / M n R g (nm) R h IV (dl/g)
85 Conformation plots R g vs. Log M W Pectin Dextran Pullulan HPC Gum Arabic The Gum Arabic plot is below those of the other polymers Due to Gum Arabic being more compact and dense
86 Mark-Houwink plots Log IV vs. Log M W Pectin HPC Dextran Pullulan Gum Arabic The Gum Arabic plot is below those of the other polymers Due to Gum Arabic being more compact and dense
87 PEGylated Protein Each detector responds to the sample differently 164,64 Ultra Violet Response (mv) 149,28 133,92 118,56 103,20 87,84 72,49 RI-Detector Viscosity Detector 57,13 41,77 26,41 11,05 Light Scattering UV-Detector 9,91 10,82 11,73 12,64 13,55 14,46 15,37 16,28 17,19 18,10 19,01 Retention Volume (ml)
88 Conjugation analysis The concentration of each component across the chromatogram can be solved They did not co-elute Protein concentration 1,8 e-4 1,6 e-4 1,4 e-4 1,2 e-4 Conc A 1,1 e-4 8,8 e-5 7,0 e-5 5,3 e-5 3,5 e-5 Conc. Protein Conc. PEG Protein- Aggregates PEG Protein- Monomer 2,1 e-4 1,9 e-4 1,7 e-4 1,5 e-4 1,3 e-4 Conc B 1,1 e-4 8,5 e-5 6,3 e-5 4,2 e-5 PEG concentraion 1,8 e-5 2,1 e-5 0,0 0,0 12,00 12,8 13,2 13,6 14,0 14,4 14,8 15,2 15,6 16,0 16,4 16,8 17,2 17,6 18,0 18,4 19,00 Volume (ml) Retention Volume
89 Conjugation analysis After further method development, the components coelute Protein concentration 5,5 e-4 5,0 e-4 4,4 e-4 3,9 e-4 Conc A 3,3 e-4 2,8 e-4 2,2 e-4 1,7 e-4 Conc. Protein Conc. PEG Protein- Aggregates with PEG Protein- Monomer with PEG 3,5 e-4 3,1 e-4 2,8 e-4 2,4 e-4 2,1 e-4 Conc B 1,7 e-4 1,4 e-4 1,0 e-4 PEG concentration 1,1 e-4 7,0 e-5 5,5 e-5 3,5 e-5 0,0 0,0 10,00 10,5 10,8 11,1 11,4 11,7 12,0 12,3 12,6 12,9 13,2 13,5 13,8 14,1 14,4 14,7 15,0 15,3 15,616,00 Retention Volume (ml) Retention volume
90 PEGylated Proteins Compositional Analysis Data File: 006A RXN SOLN (6.vdt) Method: PEG-Prot-0014.vcm Refractive Index Response (mv) 87,0 77,0 70,0 63,0 56,0 49,0 42,0 35,0 28,0 21,0 14,0 7,0 0,0 RI-Signal (sees Protein + PEG) UV-Signal (sees Protein only) 11,90 12,4 12,8 13,2 13,6 14,0 14,4 14,8 15,2 15,6 16,0 16,4 16,8 17,2 17,6 18,0 18,80 Retention Volume (ml) 145,0 132,0 121,0 110,0 99,0 88,0 77,0 66,0 55,0 44,0 33,0 22,0 11,0 0,0 Ultra Violet Response (mv)
91 PEGylated Proteins Compositional Analysis 2,2 e-4 2,0 e-4 1,8 e-4 2,2 e-4 2,0 e-4 1,8 e-4 RI-Signal 2,2 e-4 UV-Signal Conc. Protein 2,0 e-4 Conc. PEG Conc. Protein + PEG 1,8 e-4 Data File: 006A RXN SOLN (6.vdt) Method: PEG-Prot-0014.vcm PEG Protein Conc (Protein+PEG) 1,5 e-4 1,3 e-4 1,1 e-4 Conc Protein 1,5 e-4 1,3 e-4 1,1 e-4 Conc PEG 1,5 e-4 1,3 e-4 1,1 e-4 Protein + little PEG 8,8 e-5 8,8 e-5 8,8 e-5 6,6 e-5 6,6 e-5 6,6 e-5 4,4 e-5 4,4 e-5 4,4 e-5 2,2 e-5 2,2 e-5 2,2 e-5 0,0 0,0 0,0 11,9012,4 12,8 13,2 13,6 14,0 14,4 14,8 15,2 15,6 16,0 16,4 16,8 17,2 17,6 18,0 18,80 Retention Volume (ml)
92 PEGylated Proteins Compositional Analysis Data File: 006A RXN SOLN (6.vdt) Method: PEG-Prot-0014.vcm 2,2 e-4 2,0 e-4 Conc. Protein + PEG log MW 5,000 4,800 Conc (Protein+PEG) 1,8 e-4 1,5 e-4 1,3 e-4 1,1 e-4 20 kda protein:peg 1:1 3 kda Pure PEG 4,600 4,400 4,200 4,000 Log Molecular Weight 8,8 e-5 6,6 e-5 4,4 e-5 2,2 e-5 23 kda protein:peg 1:2 17kDa Pure Protein 3,800 3,600 3,400 3,200 0,0 3,000 11,90 12,4 12,8 13,2 13,6 14,0 14,4 14,8 15,2 15,6 16,0 16,4 16,8 17,2 17,6 18,0 18,80 Retention Volume (ml)
93 Polyethylene HT-GPC Polyethylene is one of the worlds most widely used polymers Wide range of applications, from pipe lining and wire coatings to shopping bags Properties highly dependent on M W, analysis of which is essential for QC Insoluble at room temperature must be analysed at C
 0.95 0.94")
94 Polyethylene HT-GPC LALS RALS Viscosity RI Param Run 1 Run 2 Run 3 Run 4 Run 5 Run 6 Run 7 M w (kda) M n (kda) M w / M n R h IV (dl/g)
95 Separations Summary High-Resolution purity, D H and M w analysis Using a SEC-MALS 20 detector allows accurate M w analysis of impure samples Conformation analysis (R g and Intrinsic Viscosity) Columnar interference can be a problem Separative Range: < 1 nm 100 nm
96 Outline Applications and Specifications Batch (DLS) Separations (SLS) Stability Prediction (interaction parameters) Hardware
97 Zeta Potential Isoelectric Point Determination 3 HEPES, Malvern ZSP, Unpublished NaCl, Malvern ZSP, Corbett and Jack (2011) - Colloids and Surfaces 376:31-41 Mobility (µmcm/vs) ph
98 SLS 2 nd Virial Coefficient (A 2 ) Derived from the slope of the Debye plot. Synapse Polymer Thermodynamic Interaction parameter Representative of the magnitude of particle-solvent interactions
99 SLS 2 nd Virial Coefficient (A 2 ) Small ab fragment (20.7 kda) Ribonuclease (14.9 kda) Lysozyme (14.6 kda) Ovalbumin (46.8 kda) BSA (71.4 kda) Polystyrene standard (95.6 kda)
100 DLS Dynamic Virial Coefficient (K D ) Also known as the DLS interaction parameter A measure of the dependence of the diffusion coefficient (Brownian Velocity) on the concentration. Thermodynamic component (dependent on A 2 ) Hydrodynamic component Diffusion Coefficient (µm/s) Diffusion Coefficient (µm/s) HSA ph 4 ph 7 K D = 0.75 ml/g Concentration (mg/ml) K D = 8.33 ml/g Concentration (mg/ml)
101 DLS/SLS Thermal Trends Monitor the Z-average diameter, or SLS count rate, whilst increasing temperature An accurate T agg can be calculated T agg is a stability predictor
102 Orthogonal Stability Prediction T agg gives a direct measure of biopharmaceutical stability at high temperatures Effect of formulation composition on biopharmaceutical stability can vary significantly with temperature For example, the effect of glycerol and NaCl on Uricase inactivation is heavily temp-dependent (Caves et al. (2013) Biochemistry 52: ) K D, A 2 and ZP allow assessment under ambient conditions, but only of interactions involving native protein
103 IgG Formulation Development
104 IgG Formulation Development Formulation K D (ml/g) A 2 (10-6 ml mol/g 2 ) ZP (mv) T agg ( C) KCl Tween KCl NaCl Tween Lactose Sucrose Mannitol > 90
105 How Does Arginine Inhibit Aggregation? SLS 1800 Mean Count Rate (kcps) Phos Phos + Arg Temperature ( C) 50 mm arginine increases the temperature of aggregation onset by 2.5 C
106 How Does Arginine Inhibit Aggregation? DLS phos 25.0 C 71.5 C 76.5 C 84.0 C phos + arg
107 How Does Arginine Stabilise Protein Leads to resistance to the initiation of aggregation (SLS) Alters the aggregation mechanism (DLS) Formulation (Native) Zeta Potential (mv) Phos 7.0 ± 0.1 Phos + Arg 4.6 ± 0.5 Arginine s aggregation-inhibition property is not due to it increasing surface charge of native protein (ELS)
108 Aggregate Prediction Summary A 2, K D, and ZP allow prediction of aggregation propensity at ambient temperatures T agg allows analysis of aggregation during denaturation Together, these parameters allow an orthogonal approach to aggregation prediction
109 Outline Applications and Specifications Batch (DLS) Separations (SLS) Stability Prediction (interaction parameters) Hardware
110 The Malvern Zetasizer Range µv Nano APS DLS instruments assess size (D H ) and purity (PDI) SLS-capable assess M w for pure samples Aggregation prediction Calculate K D, A 2, ZP and T Agg
111 Zetasizer µv 60mW 830nm laser 90 Detection Low volume (2µL) Peltier Temperature control Perfect for use as a Flow mode detector for both D h and M w measurements
 Peltier Temperature")
112 Zetasizer APS 60mW 830nm laser 90 Detection Automated Plate-Sampler Low Volume (20 µl) Peltier Temperature control
113 Zetasizer Nano 4mW or 10 mw 633nm He- Ne laser 173 (NIBS) or 13 Detection Peltier temperature control Flow mode capability ELS option

114 Zetasizer Nano DLS only (S) or ELS only (Z) DLS and ELS (ZS) ZSP (10 mw laser) designed with protein applications in mind Can measure ZP of protein at low conc. (< 1 mg/ml)

115 Zetasizer Nano Folded Capillary Cell for ELS (ZP) Capillary design maximises interelectrode distance This minimises the field strength produced by any given voltage Minimises stress on sample during measurement


116 The Malvern Zetasizer Range µv Nano APS Requires only 2µl sample Perfect for flow mode NIBS ELS option Flow mode capability Automated plate sampler Perfect sizescreening instrument
117 The Viscotek Range SEC systems and detectors (detectors compatible with other SEC systems) UV PDA detector Simultaneous Measurement from nm RI Detector Allows conc. analysis of non-absorbing molecules
118 The Viscotek Range Viscometer Calculate Intrinsic Viscosity for conformation analysis Zetasizer µv D H RALS and LALS Simple M w calculation SEC-MALS 20 Calculation of accurate M w for proteins of all sizes and R g

119 SEC-MALS 20 Circular vertical flow cell light always enters and exits the cell at 90 Minimises effects of flare and RI changes Maximises signal-to-noise

120 SEC-MALS 20 Lateral flow cell Detectors each measure different scattering volumes at incorrect angles SEC-MALS 20 flow cell Light always enters and leaves at a right angle
121 SEC-MALS 20 Features Feature Aggregates 20 Angles More angles than any other SEC system available. Low Angle Sensitivity Absolute M w Accurate R g Lowest angles have comparable sensitivity to higher ones - lower concentrations can be measured with greater accuracy. High res. Mw distribution M w calculated independently of retention volume Measurements of Rg using MALS Size value based on mass distribution Circular Vertical flow cell Minimal noise, especially at low angles (see point 2). 63 µl Flow Cell Smaller than other MALS flow cells Versatility Connect to any third-party system or use with a Viscotek system

122 The Viscotek Range Relative M w Absolute M w R g D H Intrinsic Viscosity All after separation perfect for high res. Analysis of impure samples
123 Summary Cuvette-based Size and Zeta Potential measurements without separation Separation - high-res analysis, including accurate M W and R g of impure samples
124 Thank You for Listening Questions? Michael Caves Product Technical Specialist for Biophysical Characterisation
125 Nanoparticle Tracking Analysis (NTA) Malvern s NanoSight range provides data on particle size distribution, concentration and aggregation, with much higher resolution than conventional light scattering The addition of fluorescence options further extends the capabilities of the instruments, allowing truly multi-parametric characterisation of nanoparticles. NanoSight instruments provide scientists with detailed data and knowledge of nanoparticle systems that was previously unavailable. 2
 Microvesicles purified from serum by ultracentrifugation, sizes 100-500nm. This field of view is approximately 120 x 100 microns.")
126 Particles are Visualised Directly, in Real Time Particles are too small to be imaged by the microscope The particles seen as light points moving under Brownian motion This is visualisation of scatter (not a resolved image) Microvesicles purified from serum by ultracentrifugation, sizes nm. This field of view is approximately 120 x 100 microns. Speed of particles varies directly with particle size 2

127 Principle of Measurement Nanoparticles move under Brownian motion due to the random movement of solvent molecules surrounding them. Small particle move faster than larger particles. Diffusion Coefficient can be calculated by tracking the movement of each particle and then through application of the Stokes-Einstein equation particle size is calculated. 3
 is the gathering of unique information")

128 Nanoparticle Tracking Analysis Nanoparticle Tracking Analysis (NTA) is the gathering of unique information and comes from assessment of individual particles, rather than averaging over a bulk sample. capture tracking analysis 4
129 Particle Sizing in action - Software Analysis Concentration (Number Count) The Nanoparticle Tracking Analysis software allows for captured video footage to be simultaneously tracked and analysed Size in nm nm nanoparticles being tracked and analysed by NanoSight NTA 2.3 5
130 NTA Detection Limits Lower Detection Limit related to: Material type Size Wavelength and power of illumination source Sensitivity of the camera nm Concentration Minimum concentration related to: Insufficient count for robust statistics (requiring longer analysis time) Approx 10 6 / ml Upper Detection Limit related to: Limited Brownian motion Viscosity of solvent Maximum concentration related to: Inability to resolve neighboring particles Tracks too short before crossing occurs nm Approx 10 9 / ml 6

131 True size distribution profile Mixture of 100nm and 200nm latex microspheres dispersed in water in 1:1 ratio Particle distribution displays a number count vs particle size. Concentration (Number Count) Size in nm 7

132 True size distribution profile nm Concentration (Number Count) 164 nm NTA accurately tracked 3 subpopulations Size in nm Size in nm of nanoparticles nm Size in nm Mix of 3 populations in a real sample 8


133 Particles Concentration Number Count Global concentration of all populations Concentration (Number Count) Concentration of a population selected by user Number count of particle in a determined volume : Size in nm 9

134 Resolving mixtures of different particle types through Scatter Intensity 100 PS 60nm Au 30nm Au In this mixture of 30 nm and 60 nm gold nanoparticles mixed with 100 nm polystyrene, the three particle types can be clearly seen in the 3D plot confirming indications of a tri-modal given in the normal particle size distribution plot. Despite their smaller size, the 60 nm Au can be seen to scatter more than the 100 nm PS. 10


135 Fluorescent Mode available NanoSight systems can be fitted with these lasers 405nm 488nm 532nm 635nm Laser diode capable of exciting fluorophores and quantum dots Choice of long pass or band pass filters allow suitably-labelled nanoparticles to be tracked in high backgrounds Applications in: Nanoparticle toxicity studies Nano-rheology Bio-diagnostics Phenotyping specific exosomes 11

 Sample viscosity was 1.")


136 Analysis of 100 nm Fluorescence standard particles suspended in FBS* 100 nm fluorescently labelled particles suspended in 100% FBS Sample maintained at a constant temperature (37 o C) Sample viscosity was 1.33 cp Size in nm No filter Modal particle size peaks: 103 nm Concentration: 9.5 x10 8 particles/ml Same sample, 565 nm Long pass optical filter This allows selective visualising of fluorescent/fluorescently labelled particles Excitation wavelength nm * Fetal Bovine Serum 12


137 Example : Purified Influenza Virus The ability to count viruses in liquid suspension is essential for those working in vaccine development. Particle aggregation and yield quality are factors which need to be understood when developing these viral vaccines. Current methodologies for counting such as plaque assay only count infectious particles which often represent a small component in attenuated vaccines i.e. perhaps only 1% of product is infective. 13

138 Application: Protein Aggregation at 50 C NanoSight technology has a unique application in the detection of early stage aggregation in protein therapeutics Protein monomer is too small to be individually resolved by this technique, but early stage aggregates are readily detected Protein monomer at high concentration causes high background noise in image, with the aggregate forming the resolvable particles Both size and number of aggregates can be calculated and studied, providing insight into product stability. 14 Data reproduced from Filipe, Hawe and Jiskoot (2010) Pharmaceutical Research, DOI: /s
139 Application: Drug Delivery liposomes used in drug delivery The ability to target drugs to a localised area in the body allows for lower concentrations to be used and provides optimal delivery concentration. Other delivery vehicles can be analysed including degradable polymeric nanoparticles, liposomes, micelles, dendrimers, solid lipid nanoparticles and metallic nanoparticles. 15
140 NTA is proven on for a wide range of nanoparticles Drug delivery Extracellular Vesicles (Exosomes and microvesicles) Nanoparticle Toxicology Protein Aggregates Virus and VLP samples Multi-walled Carbon nanotubes Cosmetics Foodstuffs Ink jet inks and pigment particles Nanobubbles Quantum dots Magnetic Nanoparticles Polymers and colloids Ceramics Fuel additives
141 NTA Summary Sub-visible particles Number or concentration Polydispersity Size Relative Light Intensity Fluorescence 17

142 Thank You for Listening Questions? Michael Caves Product Technical Specialist for Biophysical Characterisation
143 RI detector Standard differential refractive index detector Calibration performed using a narrow polymer standard (i.e. polystyrene) RI K dn i C i n0 dc K dn dc n C 0 instrument constant refractive index increment concentration (g/l) refractive index of solvent
144 UV-Vis Absorbance 144 Beer-Lambert Law used to calculate concentration from absorbance signal Extinction coefficient can be calculated by measuring the absorbance at different concentrations: A = εlc A = absorbance (abs.) ε = extinction coefficient l = cell path length c = concentration ε = da/dc Malvern s multi-channel detector allows detection of multiple wavelengths simultaneously

145 UV-Vis Absorbance 145 One of the most widely used analytical techniques Applications for Organic and Inorganic species Beer s Law (Concentration Detector) A = εlc ε = da/dc A = absorbance (abs.) ε = extinction coefficient l = cell path length c = concentration Conventional UV-Vis spectrophotometers contain single channel detectors

146 UV-Vis Absorption PDA Concentration Detector 146 Advantages over traditional UV-Vis detectors Multi-channel detector controlled by a microprocessor Detects multiple wavelengths simultaneously PDA can provide correlation between molecular weight and chemical composition when combined with Viscotek GPC instrumentation

147 3D spectrum from the UV PDA
Visualize and Measure Nanoparticle Size and Concentration
 NTA : Nanoparticle Tracking Analysis Visualize and Measure Nanoparticle Size and Concentration 30 Apr 2015 NanoSight product range LM 10 series NS300 series NS500 series Dec 13 34 www.nanosight.com NanoSight
Nanoparticle Tracking Analysis; Sizing, Counting and Visualizing of Nanoparticles. Dr Bob Carr, Founder and CTO NanoSight Ltd
 Nanoparticle Tracking Analysis; Sizing, Counting and Visualizing of Nanoparticles Dr Bob Carr, Founder and CTO NanoSight Ltd The Instrument Range See us at LM10 Series LM20 NS500 NanoSight s Technology
Zetasizer Nano ZSP: A Perfect Tool For Life Science Applications
 Zetasizer Nano ZSP: A Perfect Tool For Life Science Applications Dr Mike Kaszuba Technical Support Manager E-mail: michael.kaszuba@malvern.com Contents Zetasizer Nano ZSP Software Enhancements Protein
Benefit of light scattering technologies (RALS/LALS/MALS) and multidetection characterization in life science research?
 and multidetection characterization in life science research?") Benefit of light scattering technologies (RALS/LALS/MALS) and multidetection characterization in life science research? Bert Postma Business Support Separations and MicroCal Size Exclusion Chromatography
Benefit of light scattering technologies (RALS/LALS/MALS) and multidetection characterization in life science research? Bert Postma Business Support Separations and MicroCal Size Exclusion Chromatography
MEASURING PROTEIN AGGREGATION WITH THE VISCOTEK SEC-MALS 20
 MEASURING PROTEIN AGGREGATION WITH THE VISCOTEK SEC-MALS 20 Introduction Protein aggregation is recognised as a major issue in the biopharmaceutical industry. Proteins have a tendency to aggregate over
MALVERN ADVANCED GPC/SEC DETECTORS SETTING THE STANDARD MOLECULAR WEIGHT MOLECULAR SIZE MOLECULAR STRUCTURE
 MOLECULAR WEIGHT MOLECULAR SIZE MOLECULAR STRUCTURE MALVERN ADVANCED GPC/SEC DETECTORS SETTING THE STANDARD Setting the Standard WHAT CAN ADVANCED GPC/SEC DETECTION OFFER YOU? A modern research environment
Seeing the Nano-scale: Nanoparticle Tracking Analysis HVM MNT Expo 2006 Oxford. Jeremy Warren CEO, NanoSight Ltd
 Seeing the Nano-scale: Nanoparticle Tracking Analysis HVM MNT Expo Oxford Jeremy Warren CEO, NanoSight Ltd 1 NanoSight Particle Characterisation at Nano-scale: Electron Microscopy PCS (Photon Correlation
Advances in particle concentration measurements
 Advances in particle concentration measurements Dr Hanna Jankevics Jones Principal Applications Scientist Company Confidential Outline Advances in particle concentration from Malvern Panalytical Capture
Malvern Macromolecular Solutions. Innovative Solutions in Material Characterization
 Malvern Macromolecular Solutions Innovative Solutions in Material Characterization MALVERN HEADQUARTERS Malvern Instruments is a Spectris company. Innovative Solutions in Material Characterization Particle
Understanding the colloidal stability of protein therapeutics using dynamic light scattering
 Understanding the colloidal stability of protein therapeutics using dynamic light scattering A Malvern Instruments' Bioscience Development Initiative Executive summary The combination of dynamic light
Sample preparation and characterization around SAXS
 Sample preparation and characterization around SAXS Experimental verification and validation? Rob Meijers EMBL Hamburg Garbage in? The right stuff Molecular weight Oligomerization state Monodispersity
Zeta Potential Analysis using Z-NTA
 Zeta Potential Analysis using Z-NTA Summary Zeta Potential Nanoparticle Tracking Analysis (Z-NTA) adds measurements of electrostatic potential to simultaneous reporting of nanoparticle size, light scattering
CHARACTERISATION OF NANOPARTICLE SUSPENSIONS BY NTA. SIUPA Agnieszka, HOLE Patrick, WILSON Ian, SMITH Jonathan
 CHARACTERISATION OF NANOPARTICLE SUSPENSIONS BY NTA SIUPA Agnieszka, HOLE Patrick, WILSON Ian, SMITH Jonathan NanoSight Ltd, Wiltshire, United Kingdom, EU, agnieszka.siupa@nanosight.com Abstract NanoParticle
How DLS Works: Interference of Light
 Static light scattering vs. Dynamic light scattering Static light scattering measures time-average intensities (mean square fluctuations) molecular weight radius of gyration second virial coefficient Dynamic
Biophysical characterization of SMALPs and nanodiscs
 Biophysical characterization of SMALPs and nanodiscs Verna Frasca, Ph.D. Malvern Panalytical Verna.Frasca@Malvern.com Malvern Panalytical 2 SMALP April 11 2018 Malvern Panalytical Biosciences Group Solutions
Latest Developments in GPC Analysis of Adhesive and Sealant Polymers Mark Pothecary PhD Americas Product Manager Malvern Instruments
 Latest Developments in GPC Analysis of Adhesive and Sealant Polymers Mark Pothecary PhD Americas Product Manager Malvern Instruments Molecular weight The most fundamental molecular property that controls
Dr. Christoph Johann Wyatt Technology Europe GmbH Copyright Wyatt Technology Europe GmbH All Rights reserved 1
 Dr. Christoph Johann Wyatt Technology Europe GmbH 2010 Copyright Wyatt Technology Europe GmbH All Rights reserved 1 Introduction Overview The Nature of Scattered Light: Intensity of scattered light Angular
An Introductions to Advanced GPC Solutions
 An Introductions to Advanced GPC Solutions Alan Brookes Sales Manager GPC Instruments EMEAI 9 th April 2014 Agilent GPC/SEC Solutions 1 Introduction to Polymers Polymers are long chain molecules produced
Investigating the Relationship Between the Rheological Properties of Hyaluronic Acid and its Molecular Weight and Structure using Multidetector
 Investigating the Relationship Between the Rheological Properties of Hyaluronic Acid and its Molecular Weight and Structure using Multidetector SEC and SEC-MALS Presented by Bassem Sabagh, PhD Technical
DEVELOPING A BIOFORMULATION STABILITY PROFILE
 DEVELOPING A BIOFORMULATION STABILITY PROFILE Light Scattering and Micro-Capillary Viscometry A Malvern Instruments Bioscience Development Initiative Executive Summary: When used in combination, light
Introduction to Dynamic Light Scattering for Particle Size Determination
 www.horiba.com/us/particle Jeffrey Bodycomb, Ph.D. Introduction to Dynamic Light Scattering for Particle Size Determination 2016 HORIBA, Ltd. All rights reserved. 1 Sizing Techniques 0.001 0.01 0.1 1 10
Litesizer Sheet 1. [Home]
![Litesizer Sheet 1. [Home]](/thumbs/77/75555830.jpg "Litesizer Sheet 1. [Home]") Litesizer 500 15.01.15 Sheet 1 [Home] The Product: Litesizer 500 Measurement Modes Particle Size & Distribution Dynamic light scattering (DLS) Zeta Potential Electrophoretic light scattering (ELS) Molecular
Litesizer 500 15.01.15 Sheet 1 [Home] The Product: Litesizer 500 Measurement Modes Particle Size & Distribution Dynamic light scattering (DLS) Zeta Potential Electrophoretic light scattering (ELS) Molecular
Introduction to Nanoparticle Tracking Analysis (NTA) Measurement Principle of ZetaView
 Measurement Principle of ZetaView") Technical Note Nanoparticle Tracking Key words: Introduction to Nanoparticle Tracking Analysis (NTA) Measurement Principle of ZetaView Particle characterization, Nanoparticle Tracking Analysis (NTA), Brownian
Technical Note Nanoparticle Tracking Key words: Introduction to Nanoparticle Tracking Analysis (NTA) Measurement Principle of ZetaView Particle characterization, Nanoparticle Tracking Analysis (NTA), Brownian
The ultimate in desktop particle characterization
 Particle size Zeta potential Molecular weight ZS The ultimate in desktop particle characterization detailed specification from www.malvern.com/zetasizernano The Zetasizer Nano ZS brings you the practicality
Particle Characterization Laboratories, Inc.
 Analytical services Particle size analysis Dynamic Light Scattering Static Light Scattering Sedimentation Diffraction Zeta Potential Analysis Single Point Titration Isoelectric point determination Aqueous
Using High Speed/High Resolution Size Exclusion Chromatography Separation of Polymeric Materials with Light Scattering Detection
 Using High Speed/High Resolution Size Exclusion Chromatography Separation of Polymeric Materials with Light Scattering Detection Jennifer Gough 1, Michael Jones 1, Damian Morrison 1, and John Stenson 2
Static and dynamic light scattering. Cy Jeffries EMBL Hamburg
 Static and dynamic light scattering. Cy Jeffries EMBL Hamburg Introduction. The electromagnetic spectrum. visible 10-16 10-10 10-8 10-4 10-2 10 4 (l m) g-rays X-rays UV IR micro wave Long radio waves 400
The ultimate in desktop particle characterization
 Particle size Zeta potential Molecular weight ZS The ultimate in desktop particle characterization detailed specification from www.malvern.com/zetasizernano The Zetasizer Nano ZS brings you the practicality
Interaction of Gold Nanoparticle with Proteins
 Chapter 7 Interaction of Gold Nanoparticle with Proteins 7.1. Introduction The interfacing of nanoparticle with biomolecules such as protein is useful for applications ranging from nano-biotechnology (molecular
Kolligative Eigenschaften der Makromolekülen
 Kolligative Eigenschaften der Makromolekülen Kolligative Eigenschaften (colligere = sammeln) Gefrierpunkterniedrigung, Siedepunkterhöhung, Dampfdruckerniedrigung, Osmotischer Druck Kolligative Eigenschaften
Measuring Lysozyme Monomer at 0.1 mg/ml Concentration. Equipment used : Sample Preparation and Measurement :
 Application Report #001 Measuring Lysozyme Monomer at 0.1 mg/ml Concentration Equipment used : ALV-NIBS / HPPS High Sensitivity Version, Lysozyme (MERCK), 0.1 molar Sodium-Acetate buffer (ph 4.25), syringe
Use of SEC-MALS. (Size Exclusion Chromatography - Multi Angle. Light Scattering) for protein quality and characterization
 for protein quality and characterization") Use of SEC-MALS (Size Exclusion Chromatography - Multi Angle Light Scattering) for protein quality and characterization Methods for protein characterization Analytical SEC is a common method to characterize
Use of SEC-MALS (Size Exclusion Chromatography - Multi Angle Light Scattering) for protein quality and characterization Methods for protein characterization Analytical SEC is a common method to characterize
The power of multi-detector SEC in the analysis of antibodies
 The power of multi-detector SEC in the analysis of antibodies How OMNISEC can measure antibody absolute MW independent of size and structural changes MOLECULAR SIZE MOLECULAR STRUCTURE MOLECULAR WEIGHT
Advanced GPC. GPC On Tour, Barcelona, 28 th February The use of Advanced Detectors in GPC
 Advanced GPC GPC On Tour, Barcelona, 28 th February 2012 The use of Advanced Detectors in GPC 1 What does Conventional GPC give? Molecular weight averages Relative to the standards used Mw Weight Average
Particle Analysis at the Touch of a Button. Litesizer series
 Particle Analysis at the Touch of a Button Litesizer series Particle systems can be complex The size and stability of nanoparticles and microparticles are crucial to their function, as well as to their
Impurities In Biomolecules Institute for International Research. Monitoring & Predicting Biomolecular Aggregation Using Light Scattering
 Impurities In Biomolecules Institute for International Research Monitoring & Predicting Biomolecular Aggregation Using Light Scattering Kevin Mattison Malvern Instruments Ewa Folta-Stogniew Yale University
Meet Stunner: The one-shot protein concentration and sizing combo
 TECH NOTE Meet Stunner: The one-shot protein concentration and sizing combo Introduction What if you could get a better read on the quality of your biologics and use less sample at the same time? Stunner
How to use GPC/SEC for compositional analysis
 How to use GPC/SEC for compositional analysis Determining the relative concentration of two components in a polymer sample MOLECULAR SIZE MOLECULAR STRUCTURE MOLECULAR WEIGHT Introduction Over the last
Calibration and Normalization of MALS Detectors
 Page 1 of 9 Technical Note TN3000 Calibration and Normalization of MALS Detectors Summary This technical note describes the calibration and normalization procedures necessary to performing multi-angle
Scattering intensity fluctuations
 11 Size theory Introduction The aim of this chapter is to describe the basic size principles behind the Zetasizer Nano series. This will help in understanding the meaning of the results achieved. The chapter
Introduction to the calculators in the Zetasizer software
 Introduction to the calculators in the Zetasizer software PARTICLE SIZE ZETA POTENTIAL MOLECULAR WEIGHT MOLECULAR SIZE Introduction The calculators are a series of tools in the Zetasizer software that
Methods for charge and size characterization colloidal systems
 Methods for charge and size characterization colloidal systems Content General Basics Stabino Measurement basics Applications NANO-flex Measurement basics Applications Nanoparticles Bulkphase of gold gold
Amended Specifications as per the Pre Bid meeting held on in Chapter 4
 NIPER-G/PUR/GLOBAL/2018/06 Tender Specification for Nano Particle Size (DLS based), Zeta Potential, Molecular weight, Micro rheology measurement A proven complete system should have the measurement facility
ZETASIZER NANO Series PERFORMANCE, SIMPLICITY, VERSATILITY
 ZETASIZER NANO Series PERFORMANCE, SIMPLICITY, VERSATILITY Performance, Simplicity, Versatility ZETASIZER NANO SERIES Research Performance, Operational Simplicity, Application Versatility The Zetasizer
Setting the Standard for GPC. Complete Guide for GPC / SEC / GFC Instrumentation and Detection Technologies. The Right Instrument for Your Application
 TM Setting the Standard for GPC Complete Guide for GPC / SEC / GFC Instrumentation and Detection Technologies The Right Instrument for Your Application Viscotek is the global leader in Gel Permeation /
Analytical methods to characterize aggregates and subvisible particles
 Analytical methods to characterize aggregates and subvisible particles Andrea Hawe 9 th P4EU Meeting 30 th November 2015 * MPI * Martinsried 1 Background of company privately held, independent service
ZS90. The ultimate in desktop particle characterization. Particle size. Zeta potential. Molecular weight
 Particle size Zeta potential Molecular weight ZS90 The ultimate in desktop particle characterization detailed specifications from www.malvern.com/zetasizernano A routine analysis system for particle characterization
Measurements of protein electrophoretic mobility using the Zetasizer Nano ZSP
 Measurements of protein electrophoretic mobility using the Zetasizer Nano ZSP Introduction Zetasizer Nano is the market leader in dynamic and electrophoretic light scattering technology for measurements
Optimizing GPC Separations
 Optimizing GPC Separations Criteria for Solvent Selection True sample solubility (Polarity and Time dependant) Compatibility with columns Avoid non-size exclusion effects (eg adsorption by reverse phase
Light scattering Small and large particles
 Scattering by macromolecules E B Incident light Scattered Light particle Oscillating E field from light makes electronic cloud oscillate surrounding the particle Intensity: I E Accelerating charges means
Meet Our Uncle: 12 Stability Applications on One Platform
 Tech Note Meet Our Uncle: 12 Stability Applications on One Platform Uncle is an all-in-one stability platform that enables twelve different applications with one instrument. Fluorescence, static light
Particle Tracking on. Exosomes. ZetaView. Multiparameter NTA sizing, counting and zeta potential. C. Helmbrecht and H. Wachernig
 Particle Tracking on Exosomes ZetaView Multiparameter NTA sizing, counting and zeta potential C. Helmbrecht and H. Wachernig Visual inspection of video 20130429_0009_269Exo9h_Dil10000 Agglomerates Approx.
How Molecular Weight and Branching of Polymers Influences Laser Sintering Techniques
 How Molecular Weight and Branching of Polymers Influences Laser Sintering Techniques Dr. Bernd Tartsch Malvern Instruments GmbH Rigipsstr. 19, D-71083 Herrenberg Tel: +49-703-97 770, Fax: +49-703-97 854
Measuring NP Aggregation Propensities
 Project: Measuring NP Aggregation Propensities Measuring the NP stability against aggregation as a function of time and buffers with batch-mode DLS AUTHORED BY: DATE: Luigi Calzolai 22-09-2015 REVIEWED
Sepax SRT -C, Zenix -C SEC Phases
 Sepax SRT -C, Zenix -C SEC Phases Complimentary Phases to SRT for Derivatized Monoclonal Antibodies General Description Stationary Phase Structure SRT, Zenix, SRT-C and Zenix-C SEC phases developed based
Sample measurements to demonstrate Zetasizer specifications (Zetasizer Nano, Zetasizer APS, Zetasizer μv)
") Sample measurements to demonstrate Zetasizer specifications (Zetasizer Nano, Zetasizer APS, Zetasizer μv) Contents Size using Non-Invasive back-scatter (NIBS) optics Zetasizer Nano S/ZS...2 Minimum size
Sample measurements to demonstrate Zetasizer specifications (Zetasizer Nano, Zetasizer APS, Zetasizer μv) Contents Size using Non-Invasive back-scatter (NIBS) optics Zetasizer Nano S/ZS...2 Minimum size
Holographic Characterization of Protein Aggregates
 Holographic Characterization of Protein Aggregates Size, morphology and differentiation one particle at a time (and fast) D. G. Grier, C. Wang, X. Zhong, & M. D. Ward New York University D. B. Ruffner
PLUS. Zeta/Nano Particle Analyzer
 PLUS Zeta/Nano Particle Analyzer -100 m The NanoPlus Zeta-Potential & Particle Size Analyzer Features ELSZ-1000 series ZETA-POTENTIAL & PARTICLE SIZE ANALYZER of ink for inkjet printer (Yellow) Concentration
Advantages of Agilent AdvanceBio SEC Columns for Biopharmaceutical Analysis
 Advantages of Agilent AdvanceBio SEC Columns for Biopharmaceutical Analysis Comparing Columns from Different Vendors to Improve Data Quality Technical Overview Introduction Size exclusion chromatography
Field-Flow Fractionation of Macromolecules and Structures That Cannot be Characterized by Conventional GPC/SEC Techniques
 The Field-Flow Fractionation Platform Field-Flow Fractionation of Macromolecules and Structures That Cannot be Characterized by Conventional GPC/SEC Techniques Trevor Havard, Evelin Moldenhaur, Soheyl
NanoParticle Tracking Analysis The NANOSIGHT system.
 NanoParticle Tracking Analysis The NANOSIGHT system. Bob Carr and Andrew Malloy NanoSight Ltd, Salisbury, Wiltshire, SP4 6BU ABSTRACT A new technique for nanoparticle sizing that allows visualisation of
The Diffusion Barrier Technique, Practical Aspects and Data interpretation
 The Diffusion Barrier Technique, Practical Aspects and Data interpretation Introduction The diffusion barrier technique is a method for reliably measuring the electrophoretic mobility of proteins by minimising
Tips & Tricks GPC/SEC: From a Chromatogram to the Molar Mass Distribution
 Tips & Tricks GPC/SEC: From a Chromatogram to the Molar Mass Distribution Peter Kilz and Daniela Held, PSS Polymer Standards Service GmbH, Mainz, Germany. Molar masses cannot be measured directly by gel
Nanoparticle Analyzer
 Nanoparticle Analyzer Industry's Widest Range and Highest Precision Measurement Instrument for Nano-particle Characterization nano partica SZ-100 A highly advanced analyzer solves the mysteries of the
Sample characterization: Quality control and sample handling prior to data collection
 Sample characterization: Quality control and sample handling prior to data collection Marc JAMIN UMI 3265 UJF-EMBL-CNRS Unit of Virus Host Cell interactions Grenoble, France jamin@embl.fr Take home message
Polymer analysis by GPC-SEC. Technical Note. Introduction
 Polymer analysis by GPC-SEC Technical Note Introduction Gel Permeation Chromatography (GPC), also referred to as Size Exclusion Chromatography (SEC) is a mode of liquid chromatography in which the components
An introduction to particle size characterisation by DCS:
 An introduction to particle size characterisation by DCS: Do you know the real size of your nano particles? By Dr Hiran Vegad, Analytik Ltd Introduction Differential centrifugal sedimentation (DCS) is
Introduction to Dynamic Light Scattering with Applications. Onofrio Annunziata Department of Chemistry Texas Christian University Fort Worth, TX, USA
 Introduction to Dynamic Light Scattering with Applications Onofrio Annunziata Department of Chemistry Texas Christian University Fort Worth, TX, USA Outline Introduction to dynamic light scattering Particle
Clearing the Confusion: GPC, SEC, GFC What, When, Why, and How?
 Clearing the Confusion: GPC, SEC, GFC What, When, Why, and How? Jean Lane Applications Engineer LC Columns & Consumables Technical Support January 19, 2017 What we will cover What - Clarification of the
Particle Concentration Particle Size Zeta Potential
 ParticleMetrix ZetaView Nanoparticle Tracking Analyzer Particle Concentration Particle Size Zeta Potential Scattering & Fluorescence modes Particle Metrix. share our view ZetaView Nanoparticle Tracking
Sem /2007. Fisika Polimer Ariadne L. Juwono
 Chapter 8. Measurement of molecular weight and size 8.. End-group analysis 8.. Colligative property measurement 8.3. Osmometry 8.4. Gel-permeation chromatography 8.5. Ultracentrifugation 8.6. Light-scattering
LS Spectrometer. The DLS and SLS system for sophisticated research
 LS Spectrometer The DLS and SLS system for sophisticated research P r o f e s s i o n a l L i g h t S c a t t e r i n g S o l u t i o n s LS INSTRUMENTS THE GLOBAL LEADER IN ADVANCED LIGHT SCATTERING TECHNOLOGIES
Comparison of Polymer Separation by Size Exclusion Chromatography and Asymmetric Flow Field Flow Fractionation
 Comparison of Polymer Separation by Size Exclusion Chromatography and Asymmetric Flow Field Flow Fractionation Stepan Podzimek, 1 Christoph Johann 2 1 SYNPO / University of Pardubice, Czech Republic, stepan.podzimek@synpo.cz
The Better Way to Characterize Nanoparticles MANTA s ViewSizer 3000
 info@mantainc.com www.mantainc.com The Better Way to Characterize Nanoparticles MANTA s ViewSizer 3000 MANTA s Most Advanced Nanoparticle Tracking Analysis technology performs individual particle analysis
Review: ISO Colloidal systems Methods for zeta potential determination
 Review: ISO 13099 Colloidal systems Methods for zeta potential determination Mark Bumiller mark.bumiller@horiba.com www.horiba.com/particle New ISO Standards www.iso.org Outline ISO standards Zeta potential
Precision and accuracy of protein size determination using the ActiPix TDA200 Nano-Sizing System
 Precision and accuracy of protein size determination using the ActiPix TDA200 Nano-Sizing System Keywords: Hydrodynamic radius, diffusion coefficient, sizing, Taylor dispersion analysis, protein, antibodies,
Measuring nanoparticle properties: experiences from NPL Caterina Minelli
 Measuring nanoparticle properties: experiences from NPL Caterina Minelli Measurement of Particles Types of materials: Metal Examples: Silver Gold Palladium Platinum Semiconductor Examples: Quantum Dots
The solution for all of your
 The solution for all of your nanoparticle sizing and zeta potential needs. DelsaNano Series Blood Banking Capillary Electrophoresis Cell Analysis Centrifugation Genomics Lab Automation Lab Tools Particle
Part 8. Special Topic: Light Scattering
 Part 8. Special Topic: Light Scattering Light scattering occurs when polarizable particles in a sample are placed in the oscillating electric field of a beam of light. The varying field induces oscillating
Using the Zetasizer Nano to optimize formulation stability
 Using the Zetasizer Nano to optimize formulation stability PARTICLE SIZE ZETA POTENTIAL The top five ways you can use the Zetasizer Nano to help improve the stability of your formulation. Formulation development
Differentiation of polymer branching and composition using the Mark Houwink plot
 Differentiation of polymer branching and composition using the Mark Houwink plot MOLECULAR SIZE MOLECULAR STRUCTURE MOLECULAR WEIGHT Introduction The manipulation of polymer properties through changes
South pacific Journal of Technology and Science
 Zetasizer Technique Dr. Nagham Mahmood Aljamali Abstract: Assist. Professor in Organic Chemistry, Chemistry Department.,College of Education.,Kufa University.,IRAQ. In this review study., zetasizer technique
Supporting Information
 Block Copolymer Mimetic Self-Assembly of Inorganic Nanoparticles Yunyong Guo, Saman Harirchian-Saei, Celly M. S. Izumi and Matthew G. Moffitt* Department of Chemistry, University of Victoria, P.O. Box
Use of DLS/Raman to study the thermal unfolding process of lysozyme
 Use of DLS/Raman to study the thermal unfolding process of lysozyme A Malvern Instruments' Bioscience Development Initiative Executive summary The combination of dynamic light scattering (DLS) and Raman
GPC/SEC An essential tool for polymer analysis
 GPC/SEC An essential tool for polymer analysis Ben MacCreath, PhD Product Manager GPC/SEC Instrumentation 26 th March 2013 Introduction to Polymers Where are they found? Polyolefins Engineering Polymers
Protein Aggregate Assessment of Ligand Binding Assay (LBA) Reagents Using SEC-MALS
 Reagents Using SEC-MALS") Protein Aggregate Assessment of Ligand Binding Assay (LBA) Reagents Using SEC-MALS Justin Low, Mehraban Khosraviani, Sylvia (Kyung-Joo) Lee, and Jihong Yang, Genentech, Inc. Summary Ligand Binding Assays
Protein Aggregate Assessment of Ligand Binding Assay (LBA) Reagents Using SEC-MALS Justin Low, Mehraban Khosraviani, Sylvia (Kyung-Joo) Lee, and Jihong Yang, Genentech, Inc. Summary Ligand Binding Assays
Size and Zeta Potential of Colloidal Gold Particles
 Size and Zeta Potential of Colloidal Gold Particles Mark Bumiller mark.bumiller@horiba.com Colloid Definition Two phases: Dispersed phase (particles) Continuous phase (dispersion medium, solvent) May be
The ph-responsive behaviour of aqueous solutions of poly(acrylic acid) is dependent on molar mass
 is dependent on molar mass") Electronic Supplementary Material (ESI) for Soft Matter. This journal is The Royal Society of Chemistry 2016 The ph-responsive behaviour of aqueous solutions of poly(acrylic acid) is dependent on molar
Electronic Supplementary Material (ESI) for Soft Matter. This journal is The Royal Society of Chemistry 2016 The ph-responsive behaviour of aqueous solutions of poly(acrylic acid) is dependent on molar
Holographic Characterization of Agglomerates in CMP Slurries
 Holographic Characterization of Agglomerates in CMP Slurries Total Holographic Characterization (THC) Comparison of THC to other technologies Dynamic Light Scattering (DLS) Scanning Electron Microscopy
Tips & Tricks GPC/SEC: Protein Analysis with Size-Exclusion Chromatography
 Tips & Tricks GPC/SEC: Protein Analysis with Size-Exclusion Chromatography Daniela Held and Thorsten Hofe, PSS Polymer Standards Service GmbH, Mainz, Germany Gel permeation chromatography/size-exclusion
Page 1 of 5. Is it alright to estimate dñ/dc in SLS measurements?
 Page 1 of 5 Is it alright to estimate dñ/dc in SLS measurements? Due to the complexity of measuring the specific refractive index increment (dñ/dc), static light scattering molecular weight measurements
Using runt Disposable Cuvettes
 Tech Note Guide Table of Contents Ease of Use... 3 Sensitivity... 4 Resolution... 5 Accuracy... 6 Faster Sample Prep... 7 Measuring Molecular Weight... 8 Observing Protein Aggregation... 9 Characterize
Setting the Standard for Advanced GPC/SEC Systems
 Absolute molecular weight Molecular conformation Molecular size Solution viscosity Viscotek Setting the Standard for s ṙ ṙ Detailed specification sheets from Introducing the system - the leading solution
10 REASONS THAT THE ZETASIZER NANO IS CHOSEN FOR SCIENTIFIC SUCCESS
 10 REASONS THAT THE ZETASIZER NANO IS CHOSEN FOR SCIENTIFIC SUCCESS Abstract: New components and measurement techniques continue to be introduced for the Zetasizer Nano. New to the system are a Surface
Breakthrough in Nanoparticle Tracking Analysis (NTA)
") Breakthrough in Nanoparticle Tracking Analysis (NTA) April 2017 Rick Cooper, CEO rick.cooper@mantainc.com 858.449.5801 Outline Background Technology overview Validation results Product details Established
Breakthrough in Nanoparticle Tracking Analysis (NTA) April 2017 Rick Cooper, CEO rick.cooper@mantainc.com 858.449.5801 Outline Background Technology overview Validation results Product details Established
How to measure the zeta potential of individual Nanoparticles (NPs)? To anticipate the answer: With the
? To anticipate the answer: With the") Technical Note - Scanning NTA ZetaView How to measure the zeta potential of individual Nanoparticles (NPs)? Introduction To anticipate the answer: With the ZetaView. ZetaView tracks the particles individually
Technical Note - Scanning NTA ZetaView How to measure the zeta potential of individual Nanoparticles (NPs)? Introduction To anticipate the answer: With the ZetaView. ZetaView tracks the particles individually
IPR Temperature Response of Aqueous Solutions of a Series of Pyrene End- Labeled Poly(N-isopropylacrylamide)s Probed by Fluorescence
s Probed by Fluorescence") Temperature Response of Aqueous Solutions of a Series of Pyrene End- Labeled Poly(N-isopropylacrylamide)s Probed by Fluorescence M. Fowler, J. Duhamel, F. M. Winnik, X.-P. Qiu IPR Symposium, University
Temperature Response of Aqueous Solutions of a Series of Pyrene End- Labeled Poly(N-isopropylacrylamide)s Probed by Fluorescence M. Fowler, J. Duhamel, F. M. Winnik, X.-P. Qiu IPR Symposium, University
Particle Analysis at the Touch of a Button. Litesizer series
 Particle Analysis at the Touch of a Button Litesizer series Particle systems can be complex The size and stability of nanoparticles and microparticles are crucial to their function, as well as to their
Optimization of PLA/PLGA molecular weight and structure to suit final application requirements
 Optimization of PLA/PLGA molecular weight and structure to suit final application requirements MOLECULAR SIZE MOLECULAR STRUCTURE MOLECULAR WEIGHT Introduction The biodegradable and biocompatible polymers,
Quick guide to selecting columns and standards for Gel Permeation Chromatography and Size Exclusion Chromatography SELECTION GUIDE
 Quick guide to selecting columns and standards for Gel Permeation Chromatography and Size Exclusion Chromatography SELECTION GUIDE Introduction Gel permeation chromatography (GPC) and size exclusion chromatography