Crystal Structure and Luminescence Studies of Upconverting Nanoparticles
|
|
|
- Philip Ford
- 5 years ago
- Views:
Transcription


1 Master s Thesis Crystal Structure and Luminescence Studies of Upconverting Nanoparticles Gökhan Dumlupinar A thesis submitted in fulfillment of the requirements for the degree of Master of Science in the Biophotonics Group Department of Physics Lund University April 2015 Thesis Supervisors: Prof. Stefan andersson-engels and Dr. Haichun liu
2 Abstract Nanoparticles doped with lanthanide ions that are capable of upconverted radiation promise great potential as exogenous luminescent biomarkers in biomedical imaging. In this work, hexagonal structured core NaYF 4 :Yb 3+,Tm 3+ and core-shell NaYF 4 :Yb 3+,Tm 4 upconverting nanoparticles (UCNPs) with ranging from 43 nm to 66 nm in size are successfully synthesized by a modified solvothermal synthesis method. The work presented in this thesis aims at the crystal structure analysis of core NaYF 4 :Yb 3+,Tm 3+ and core-shell NaYF 4 :Yb 3+,Tm 4 UCNPs under varying thermal conditions. X-ray diffraction (XRD) and transmission electron microscopy (TEM) techniques were utilized to characterize size, phase and shape of UCNPs. Moreover, thermal stability of the crystal phase of UCNPs was investigated. Thus, UCNPs were exposed to a post heating treatment where the temperature was gradually increased from room temperature to 700 C. The XRD patterns of UCNPs at varying temperature levels show that UCNPs are thermally stable up to 300 C. Additionally, at the temperature level of 590 C core UCNPs began to undergo a phase transformation from hexagonal phase (β) to cubic phase (α). The low quantum yield (QY) of upconversion (UC) emissions in UCNPs is always considered as a challenging problem that hinders UCNPs utilization in bioimaging. Therefore, another aim of this work is pointed to figure out a successful way that improves QY of core UCNPs. Indeed, a significant increase in QY of near infrared (NIR) UC emission in core-shell UCNPs was accomplished under the excitation of 975 nm light. Simulations promise that it is feasible to increase QY up to 2.4% by millisecond pulse excitation with carefully selected pulse parameters. Furthermore, NIR UC signal gain, 8.7, is experimentally achieved by the pulsed excitation that had a 2 Hz repetition rate, a 20 ms pulse width, a 4% duty cycle with 0.12 Wcm 2 average power density.
3 ii Acknowledgements First of all, I would like to thank my supervisors, Prof. Stefan Andersson-Engels and Dr. Haichun Liu, for letting me be member of their esteemed research group. I cannot thank you enough for your encouragement that made me feel confident throughout this thesis work. Your patience and continuous support meant a lot to me. Dr. Diana Thomas and Dr. Sylvio Haas to whom I am deeply grateful not only for your precious help regarding XRD measurements of nanoparticles but also for your sincere friendship that was glorified by delicious pizzas, sweet cookies alongside a cup of strong coffee. This thesis wouldn t mean anything without your assistance. I would also like to thank everyone from Genovis AB, for letting me use their laboratories and instruments for the production of nanoparticles. Working in such a friendly environment full of extremely helpful professionals who share their experiences with no hesitation has been a privilege for me. Johan Thorén, my classmate, who never deprived me of his amazing coding skills for all kind of MATLAB problems is very much appreciated. Additionally, members of Biophotonics group, I want to thank all of you, for your friendship, and also for serious and at the same time funny discussions that we had at Wednesday meetings. Special thanks to all dear people in Radio Paradise, you cannot imagine how many nights you managed to keep me awake in front of a computer screen by means of your gorgeous playlists. Furthermore, I want to proclaim my special thanks to my teammates and my coaches from FC Helsingkrona. Your amazing talent that is capable of taking out a joyful part from even the most stressful moments will always be remembered. Finally, I would like to express my deepest gratitudes to my lovely family for their unconditional love and support.
4 iii Abbreviations Ar CW ESA ETU GS GSA IR Ln NH 4 F NaCl NaOH NC NIR OA ODE PDT RE QD QY TEM Tm 3+ TmCl 3 UC UCNP XRD YCl 3 Yb 3+ YbCl 3 argon continuous wave excited state absorption energy transfer up conversion ground state ground state absorption infrared lanthanide ammonium fluoride sodium chloride sodium hydroxide nanocrystal near infrared oleic acid octadecene photodynamic therapy rare earth quantum dot quantum yield transmission electron microscopy trivalent thulium ion thulium(iii) chloride upconversion upconverting nanoparticle x-ray diffraction yttrium(iii) chloride trivalent ytterbium ion ytterbium(iii) chloride
5 Contents Contents iv 1 Introduction 1 2 Upconversion Mechanism Upconversion processes Excited state absorption Energy transfer upconversion Cooperative upconversion Excitation Power Dependence of Upconversion Luminescence Intensity Low power regime High power regime Quantum Yield of Upconverting Nanoparticles Building Blocks of Upconverting Nanoparticles Activator Sensitizer Host crystal Synthesis Methods Thermal Decomposition Method Hydro(Solvo)thermal Method Coprecipitation Synthesis Protocol Synthesis of Core NaYF 4 :Yb 3+,Tm 3+ Upconverting Nanoparticles Synthesis of Core-Shell NaYF 4 :Yb 3+,Tm 4 Upconverting Nanoparticles Measurements and Results Crystal Structure Analysis of Core and Core-Shell Upconverting Nanoparticles Thermal Stability Analysis on The Crystal Phase of Core and Core-Shell Upconverting Nanoparticles Quantum Yield Enhancement in Core-Shell Upconverting Nanoparticles Conclusion and Final Remarks 31 Bibliography 33 iv
6 Paper I 37 v
7 Chapter 1 Introduction There have been many applications that exploit the advantages of upconverted radiation since the discovery of the UC mechanism in Upconverted radiation is a consequence of a process where less energetic radiation is converted to more energetic radiation. Thus far, remarkable spectroscopic outcomes of radiation conversion pioneered the development of miscellaneous optical devices, such as infrared (IR) quantum detectors, temperature sensors, solid-state lasers, solar cells. Since the synthesis of first nanoparticles that show UC radiation capability, utilization of UCNPs has started to become a hot topic in many different fields of medicine and biology, i.e., biosensing [1], bioimaging [2, 3], and photodynamic therapy (PDT) [4, 5]. Particularly in bioimaging, UCNPs, due to their attractive properties, are regarded as promising contrast agents and luminescent biomarkers compared to conventional quantum dots (QD) and organic fluorophores. UCNPs can be excited by near infrared (NIR) radiation. Since NIR radiation is within the limits of the tissue optical window, Stokes-shifted autofluorescence generated by the biomolecules in the tissue is weak. Due to low background light from luminescent biological tissue components, the signal to background ratio is enhanced yielding high sensitivity imaging of UCNPs. Additionally, as a direct consequence of NIR, high light penetration depth is achieved. Furthermore, a low power density ( 1 Wcm 2 ) NIR CW laser is sufficient to initiate UC processes of the nanoparticles in which no photo damages to tissues are expected in biological applications. Additionally, UCNPs are able to generate multi-color UC emission bands simultaneously making multi-labelling feasible inside a tissue. Despite many promising characteristics of UCNPs, there are still challenging constraints that have to be surmounted wisely. First of all, small sized particles, less than 50 nm, are essential for intercellular applications. However, the production of small sized particles with considerably high UC luminescence intensity is a formidable task. Due to the trade-off between the size and UC luminescence intensity, every reduction 1
8 Chapter 1 Introduction 2 in the size of UCNPs yields weaker luminescence intensity. Moreover, the resulting UC- NPs may have a hydrophobic nature due to the surfactant material used during the synthesis. Due to indispersibility in water, the biocompatibility of UCNPs is problematic. Furthermore, crystal properties of UCNPs, i.e., morphology, size and phase are significantly associated with the optical properties of the nanocrystal such as UC luminescence intensity, QY, and emission profile. Thus, a rational synthesis method which allows control over morphology, size and phase is required. Herein, an ideal UCNP is expected to have the following characteristics: monodispersed, uniform in shape and size, highly crystalline, phase pure, dispersible in water, and strong UC luminescence with multi-emission bands. Thus far, among many other synthesized UCNPs, β-nayf 4 is mainly used as host material providing high QY and UC efficiency [6],[7]. In addition, different chemical methods including thermal decomposition, hydro(solvo) thermal, and coprecipitation have been utilized for the synthesis of UCNPs. In this thesis work, a modified solvothermal synthesis method is utilized for the synthesis of core NaYF 4 :Yb 3+, Tm 3+ UCNPs and core-shell NaYF 4 :Yb 3+, Tm NaYF 4 UCNPs and will be outlined in Chapter 4. Additionally, analysis results regarding shape, size and phase of the resulting UCNPs will be presented in Chapter 5. Furthermore, thermal stability of the crystal phase in UCNPs is examined and the obtained results during a post heating treatment where temperature is increased up to 700 C will be evaluated in Chapter 5. As a last study of this thesis work, the feasibility of an enhancement on QY in core NaYF 4 :Yb 3+,Tm 3+ UCNPs is investigated by utilizing a pulse excitation source and the results are presented in Chapter 5.
9 Chapter 2 Upconversion Mechanism UC is a nonlinear optical process. Higher energy photon emission is achieved as a consequence of a stepwise excitation of light by a single ion via either the successive absorption of more than one lower energy photon or the energy transfers between ions. In 1966, the formulation of UC mechanism was submitted separately by Ovsyankin and Feofilov, and Auzel almost seven years after the inspired publication of Bloembergen [8],[9],[10],[11]. 2.1 Upconversion processes UC of radiation is achieved by different processes including excited state absorption (ESA), cooperative upconversion and energy transfer upconversion (ETU). The distinctive characteristics of each UC process will be reviewed in the following subsections by means of the formulations of Auzel [12] Excited state absorption A simplified three-level energy system is illustrated in Figure 2.1 to facilitate the understanding of an ESA process. First, the ion jumps up to one of its low-lying long-lived excited state (E1) via ground state absorption (GSA). The long-lived nature of this intermediate state reduces the spontaneous emission decay rate of E1 and provides ample time to accommodate at that state. Meanwhile, a second photon reaches and promotes that ion in E1 to the high-lying excited state (E2). Next, the UC luminescence is generated as the ion decays from E2 to ground state (GS). It is worth mentioning that not only the energy difference between GS and E1 but also between E2 and E1 is required to be nearly equal for an efficient stepwise excitation. This is a significant criterion that should be taken into account for a dopant ion selection that is mainly responsible for UC luminescence. 3
10 Chapter 2 Upconversion Mechanism 4 E2 ESA GSA E1 GS Figure 2.1: Schematic representation of a ESA process in a three-energy level system Energy transfer upconversion Similar to ESA, there is a sequential excitation of an ion in ETU. In Figure 2.2, the ETU process is demonstrated. Here two different types of ion are present. The ion that is responsible for the absorption of the excitation photons, acting as the donor ion in the subsequent non-radiative energy transfer, is called the sensitizer. The neighbouring ion that accepts the transferred energy, undergoes a stepwise excitation resulting in UC luminescence. This is called the activator. E2 A ET 2 ETU 2 E1 S E1 A ET 1 ETU 1 Sensitizer GS S Activator Figure 2.2: The schematic representation of ETU mechanism. Energy transfer (ET) is non-radiative and there is no intermediate photon generation. Herein, ET also occurs in a resonant way by means of equidistant energy level separation. GS A There are various types of energy transfer between two neighbouring ions, as demonstrated in Figure 2.3. In resonant radiative energy transfer, energy is transferred to the activator by the assistance of a photon originating from the spontaneous decay of the excited sensitizer. The probability of the radiative energy transfer between two neighbouring ions is expressed as follows [13] ρ SA (R) = σ A 4πR 2 ρ S (ν)ρ A (ν) dx, (2.1) τ S
11 Chapter 2 Upconversion Mechanism 5 where R represents the distance between two neighbouring ions, τ S defines lifetime of the excited state of the sensitizer, ρ A is the absorption cross section of activator, ρ B is the absorption cross section of sensitizer and the integral term defines the spectral overlap between the absorption spectrum of the activator and the emission spectrum of the sensitizer. In a resonant non-radiative energy transfer, no photon is involved for the energy transfer from one ion to another. between two neighbouring ions is written as [14] The possibility of a non-radiative energy transfer ρ SA = (R 0 /R) S τ S, (2.2) where R 0 is the critical distance between two neighbouring ions and S is the parameter that takes an integer number depending on the type of the electronic interaction between the transition dipoles of the neighbouring ions. ET ET ET ET Sensitizer Activator (a) Sensitizer Activator Sensitizer Activator Sensitizer Activator (b) (c) (d) Figure 2.3: A scheme that includes different energy transfer pathways between the neighbouring ions: (a) Resonant radiative transfer. (b) Resonant non-radiative transfer. (c) Non-radiative transfer by phonon assistance. Unlike the resonant energy transfers in Figure 2.3 (a) and (b), transfer of the energy may have non-resonance characteristic. Non-resonant energy transfer may occur between the neighbouring ions that have dissimilar energy level structure. In Figure 2.3 (c), it is clearly seen that there is energy mismatch between the excited states of the activator and the sensitizer. In such a case, phonons assist to overcome the mismatch energy in which energy transfer is subsequently completed. The number of phonons that involve in the energy transfer depends on the magnitude of the energy mismatch [15] Cooperative upconversion Cooperative upconversion comprises the two different energy transfer processes that are known as cooperative sensitization and cooperative luminescence. In Figure 2.4 the
12 Chapter 2 Upconversion Mechanism 6 schematic representations of these processes are shown. In cooperative sensitization, required energy for the excitation of the activator is provided by simultaneous energy transfers from two or more sensitizers. Thereby, the activator generates UC luminescence as a result of the temporal overlap of energy transfer. However, in the case of cooperative luminescence, two excited ions combine their energy and emit one photon. Thus, it is not regarded as a transfer, rather is an accumulation of energy at a time. E2 A ET ET E1 S E1 S E1 S E1 S ET ET GS S GS S GS A GS S GS S Sensitizer Sensitizer (a) Activator Sensitizer (b) Sensitizer Figure 2.4: The schematic representation of (a) cooperative sensitization, (b) cooperative luminescence. To sum up, ETU has the highest UC efficiency among all UC processes described above. The UC efficiency in ETU is two orders of magnitude higher than ESA and 4-5 orders of magnitude higher than cooperative UC processes [12]. ETU efficiency is even much higher than common nonlinear optical processes such as second harmonic generation and two-photon absorption [12]. 2.2 Excitation Power Dependence of Upconversion Luminescence Intensity The UC luminescence intensity is dependent on the excitation power density. The excitation power dependence of UC luminescence intensity can be understood by means of a model first presented by Pallnau et al [16]. The model is illustrated in Figure 2.5. The analysis of power dependence is based on a set of rate equations at high and low excitation power regimes. Rate equations describe here the optical processes for energy states of the activator including UC process, spontaneous emission and multi-phonon relaxation. By means of rate equations, the steady state population density of an energy state can be found. Since the population density of an energy state is associated with luminescence intensity, the excitation power dependence of UC luminescence is subsequently revealed.
13 Chapter 2 Upconversion Mechanism 7 Prior to the rate equation analysis is introduced, I would like to outline the assumptions made in this model: Cross-relaxations do not occur. No emission occurs due to the transitions from a high-lying excited to a low-lying excited state, e.g. E2 A -E1 A transition. The ground state population is not varying; negligible bleaching. Successive excitation of the activator is carried by solely ETU processes. The energy separations between the adjacent energy states of the activator are equal. Additionally, the same energy separation holds for the gap between the excited state and ground state of the sensitizer. Only the sensitizer absorbs the excitation photons. E3 A ETU 3 E2 A ET ETU 2 N s E1 S ET E1 A ET ETU 1 GS S Sensitizer GS A Activator Figure 2.5: The scheme of the model based on sensitizer-activator configuration is shown. The energy transfer is carried out sequentially. Thus, successive ETU processes take place in the activator. The steady-state population density of the excited state of the sensitizer (N S ) is given by N S = ρp, (2.3) where P, and ρ denote the exitation power and the excitation cross-section of the sensitizer ions, respectively. Equation 2.3 is the direct consequence of the assumption of a constant ground state population density. Let s assume an activator with i energy states. The steady state population densities of these states are denoted by N i. Moreover, the ETU rate from energy state i to energy state i+1 of the activator is expressed by W i. In addition, R i denotes the relaxation rate constant from energy state i to the ground state of the activator (GS A ). By means of these definitions, the following relation may be written: N 1 N S P (2.4)
14 Chapter 2 Upconversion Mechanism 8 The rate equation for the steady state population density of energy state i of the activator is written down as W i N i N S + R i N i = W i 1 N i 1 N S (2.5) Equation 2.5 yields the population density of energy state i in steady state as N i = W i 1N i 1 N S R i + W i N S (2.6) Herein, the rate equation analysis will be examined in two regimes of the excitation power: Low excitation power, high excitation power Low power regime As the excitation power is low, the depletion of i th energy state is dominated by the relaxation process instead of the ETU. Since R i W i N S, the ETU term in Equation 2.5 becomes negligible. Thereby, Equations 2.5 and 2.6 become respectively: W i 1 N i 1 N S = R i N i, (2.7) N i = W i 1N i 1 N S R i. (2.8) There is a linear dependence between the population density of the state i and the population density of the state i-1 multiplied by N S. The same relation holds for the population density of the state i-1 and the population density of the state i-2 multiplied by N S. Since the same relation could be applied to all excited states, the result can be written as follows N i (N S ) i P i (2.9) Equation 2.9 implies that if one plots a graph of the UC luminescence intensity in a double-logarithmic representation versus the excitation power, the slope of that graph would be i. UC luminescence profile. It additionally gives the number of ETU processes needed for a certain The relation in 2.9 is also interpreted as an outcome of a measurement for the number of photons involved for the stepwise excitation of the activator in UC process (In this case, it is ETU) High power regime As the excitation power is sufficiently high, the ETU becomes dominant over the relaxation process. This means W i N S R i. Hence, Equations 2.5 and 2.6 are written respectively as follow W i 1 N i 1 N S = W i N i N S (2.10) N i = W i 1 W i N i 1 (2.11)
15 Chapter 2 Upconversion Mechanism 9 and when N i N i 1 is combined with Equation 2.4, the result is written as N i (N S ) i P 1 (2.12) In Equation 2.12, it is clearly seen that population densities of all energy states of the activator have the same power dependence in the high power regime. The slope of the UC luminescence intensity versus the excitation power graph will be equal to one regardless of the number of ETU processes. It states that the nature of power dependence on UC luminescence intensity is linear as excitation power density is high. It is worth mentioning that similar rate equation analyses have been utilized in Paper I to figure out suitable pulse laser parameters to be able to enhance QY in core NaYF4:Yb 3+,Tm 3+ UCNPs. In general, sensitizer and activator have dissimilar energy level structure, in which the model explained above would be no longer used. For such a case, another rate equation model is presented [17]. 2.3 Quantum Yield of Upconverting Nanoparticles The ratio between the number of emitted photons (N em ) and the number of absorbed photons (N abs ) is known as the internal QY (η). This is mostly defined in percent. The parameter is characterized as η = N em N abs = k 0I em I ex (2.13) where k 0 is a scaling factor, I em (Wcm 2 ) is the intensity of emission and I ex (Wcm 2 ) is the intensity of excitation. As shown in the previous section, the intensity dependence of a two-photon UC emission based on the ETU has a quadratic nature at low excitation power densities, whereas it turns into a linear form at high excitation power densities. The saturation characteristic of UC luminescence with increasing excitation power density has been used to figure out QY of NIR UC emission of core NaYF 4 :Yb 3+,Tm 3+ UCNPs as part of this thesis work and the results are presented in Paper I. 2.4 Building Blocks of Upconverting Nanoparticles There are two main building blocks of a typical upconverting luminescent particle: Inorganic host crystal and dopant ions. Some inorganic host crystals, e.g. NaYF 4 crystal, may not display UC luminescence by itself in which may require doping to be luminescent. Thus, by the presence of a dopant ion, e.g. Tm 3+ in NaYF 4 :Tm 3+, the entire crystal may become luminescent. Although one type of dopant ion is generally sufficient to generate UC luminescence, two different types of ions are favourable for higher UC
16 Chapter 2 Upconversion Mechanism 10 luminescence. As previously mentioned ETU is the most efficient UC process where two different types of dopant ions as being sensitizer and activator are required. Recall that Yb 3+ (sensitizer)/tm 3+ (activator) co-doped NaYF 4 is UCNP that has been under the study at this thesis work. Trivalent Yb-Tm pair is selected due to their promising features as dopant ions which will be outlined in the following subsections Activator The distinctive role of an activator in the UC process has been explained previously. Simply, the activator is the ion that undergoes a series of sequential excitation and then reaches a high-lying excited state where UC luminescence is generated. An activator ion has to possess an energy level structure with multiple long-lived excited states. Equidistant energy separations between excited states of the activator ion are favourable in which ETU may take place efficiently. Some of the elements in the lanthanide group are regarded as good activators due to their exceptional energy level structure. [Xe]4f n 6s 2 represents electronic configuration of most of lanthanide atoms including holmium ( 67 Ho), erbium ( 68 Er), and thulium ( 69 Tm). In addition, all lanthanide atoms have very stable +3 oxidation state in which they may exist as trivalent ions [18]. As for emission profile, sharp and narrow emission bands corresponding to NIR and the visible region are obtained due to f-f transitions in lanthanides. The fact that f-f transitions have low probability to occur due to the Laporte rule turns out to be an advantage for UC. Low probability of f-f transitions imply that energy states have long lifetimes which favour UC. Therefore, Tm 3+, Er 3+ and Ho 3+ are among the most suitable activator ions owing to their ladder-like energy level structure that enables an efficient ETU process. As known, the multi-phonon relaxation is an undesired process which depopulates the excited state, thereby weakens the UC luminescence. The multi-phonon relaxation rate for 4f levels of RE ions can be described by an exponential relation with the energy gap [19] k NR = βe α E, (2.14) where α and β are constants. Equation 2.14 implies that the multi-phonon relaxation rate decreases exponentially with increasing energy separation between an excited state and either another low-lying excited state or ground state. Due to low E values of Ho 3+ ion, trivalent Er and Tm ions are among the most utilized ions as an activator in UCNPs Sensitizer As mentioned previously, UC of radiation could be realized by exploiting even one type of dopant ion. In a singly doped nanocrystal, dopant ions are responsible for all optical
17 Chapter 2 Upconversion Mechanism 11 processes including the absorption of pump photons, UC processes, and luminescence. Thus, the dopant ion is expected to function as both sensitizer and activator at a time. Nevertheless, promising activator ions, e.g. Tm 3+ and Er 3+, are infertile as being sensitizers due to their low absorption cross-section, particularly in NIR range. Low pump photon absorption disfavours weak UC luminescence in which high photon absorption is a significant criterion to be fulfilled by a dopant ion. In a singly doped nanocrystal, the low photon absorption problem would be surpassed by increasing the concentration of the dopant ion [18]. However, when the number of the dopant ions is increased, they get closer to each other which facilitates the non-radiative energy losses such as the cross-relaxation. Therefore, instead of a direct excitation of the activator ions via the pump photons, the sensitizer with relatively high absorption cross-section is utilized to excite the activator ion via energy transfer. Furthermore, in the presence of a sensitizer ion along the activator ion, the most efficient UC process, ETU, becomes feasible. Trivalent ytterbium (Yb 3+ ) ion is one of the most common sensitizer owing to its distinctive energy level structure and relatively high absorption cross-section in NIR region. As for energy level structure of Tm 3+, there is only one excitable 4f state ( 2 F 5/2 ), to which a transition from ground state ( 2 F 7/2 ) is accomplished by the absorption of NIR photons. In addition, the energy structure of Yb 3+ is well suited to the energy structure of the prevalent activators, e.g. Tm 3+ or Er 3+. Different trivalent lanthanide ions are capable of displaying specific emission bands ranging from the NIR to UV due to their unique energy level arrangement. Therefore, sensitizer-activator ion pair should be wisely selected with regard to the type of the application where they are utilized Host crystal As for UCNPs, the selection of a suitable host material has always been an important issue. Basically, two characteristics are required from a crystal material to be said ideal host crystal. Firstly, the lattice size of the host crystal should be in a close match with that of dopant ions. Secondly, low phonon energy of a host crystal is favourable. Low phonon energy nature decreases non-radiative losses during UC processes, which enables a radiative emission rate. Many different materials are utilized as host crystal including heavy halide based crystals, oxide based crystals, and fluoride based crystals [18, 20, 21]. On the other hand, hygroscopic nature of those heavy halides makes them impractical although they have low phonon energies less than 300 cm 1. Furthermore, oxide based crystals with high chemical stability mostly suffer from their high phonon energy that is generally larger than 500 cm 1. Nonetheless, the fluoride based crystal material
18 Chapter 2 Upconversion Mechanism 12 NaYF 4 with hexagonal crystal structure is yet considered as one of the most efficient host material owing to its chemical stability and its relatively low phonon energy [22].
19 Chapter 3 Synthesis Methods Various chemical methods including coprecipitation, thermal decomposition [23], hydro(solvo) thermal method [24], sol-gel processing [25], combustion synthesis [26] and flame synthesis [27] have been developed over the years in order to synthesize more efficient and high quality UCNPs. Among these methods, coprecipitation, thermal decomposition and hydro(solvo)thermal methods find wider use due to their remarkable advantages. In this thesis work, all UCNPs were synthesized by the solvothermal method. The steps of this method will be outlined in details in Chapter 4. In each synthesis method, experimental parameters, e.g. reaction time and temperature, may affect the crystal properties of UCNPs such as size, phase and shape. Moreover, different solvents, surfactants, and the fluorine sources are used during the synthesis method to vary the crystal properties. Optical properties of UCNPs are affected by the changes in the crystal structure properties [2, 6]. Thus, it is essential to have a precise control over the synthesis method in which the experimental parameters are required to be set wisely for high quality nanoparticles. 3.1 Thermal Decomposition Method Thermal decomposition of organic precursor(s) such as metal trifluoroacetate(s) (TFA) is one of the well-known approaches for the controlled synthesis of uniform, well-shaped and high quality crystalline nanoparticles. The basic idea behind this approach is based on the decomposition reaction of metal TFAs in a non-coordinating solvent, e.g. octadecene (ODE), with the assistance of a surfactant, e.g. oleic acid (OA), at certain elevated temperatures mostly between 250 C and 330 C. This approach was firstly applied to the synthesis of single crystalline monodispersed LaF 3 triangular nanoplates with solely the presence of one type of organic precursor by Zhang et al [28]. Subsequently, a slightly modified method was proposed, where different types of rare earth metal TFAs decomposed and yield cubic phase (α) 13
20 Chapter 3 Synthesis Methods 14 NaYF 4 nanoparticles co-doped with either Er 3+ -Yb 3+ ion pair or Tm 3+ -Yb 3+ ion pair [29]. Due to the pyrolysis of air sensitive-metal TFAs, various fluorinated and oxyfluorinated carbon species come out as intermediate products; these are known to be extremely toxic. Thus, the thermal decomposition method suffers from toxic by-products. Even though high quality, monodispersed nanoparticles are promised by this method, the resulting nanoparticles still have cubic phase structure. Ln doped β-nayf 4 UC- NPs have higher UC luminescence intensity compared to Ln doped α-nayf 4 UCNPs [30]. Therefore, Ln doped NaYF 4 UCNPs with cubic crystal phase are not favourable. Additionally, the thermal decomposition method has a disadvantage of requiring surface modification of the resulting nanoparticles. The usage of OA as a surfactant yields hydrophobic nanoparticles in which the surface modification for the nanoparticles is essential to make them hydrophilic, and so biocompatible. 3.2 Hydro(Solvo)thermal Method The hydro(solvo)thermal method has been frequently used to produce both α-phase and β-phase lanthanide doped NaYF 4 nanoparticles. As opposed to the thermal decomposition method, the synthesis of nanoparticles with controlled crystal size, shape and good dispersibility is performed at low reaction temperatures, e.g. below 230 C. The hydrothermal method is based on a set of chemical reactions where a mixture of rare earth precursors with a surfactant that reacts with certain metal and fluorine ions in an aqueous solution. Nevertheless, specialized reaction vessels, namely autoclaves, are required to carry out all these chemical reactions under a certain pressure and temperature that are above a critical point of the solvent over a long period of time. In many cases, water is utilized solely as a solvent but strong solvents including acetic acid and ethanol may replace the water in order to increase the reaction speed, and so the solubility. In the cases where a strong solvent is present, the method is generally renamed as solvothermal instead of hydrothermal. β- NaYF 4 :Yb 3+,Er 3+ UCNPs with good dispersibility and high UC luminescence were successfully synthesized in either hydrothermal conditions or solvothermal conditions [31]. The crystal size is controlled by varying the molar ratio between surfactant and Ln 3+ ion. In the solvothermal method, a shape modulator, e.g. CTAB, can diversify the shape of nanoparticles including rod, worm-like and spherical. On the other hand, it has a negligible effect on the shape of nanoparticles at hydrothermal conditions. In addition, a shape modulator is exploited alongside a strong solvent, e.g. ethanol, to gain more control over the shape of the nanoparticles [31]. Since highly crystalline, uniform in size β- NaYF 4 :Yb 3+,Er 3+ nanoparticles are produced either hydrothermally or solvothermally, no post-heating treatment for a phase
21 Chapter 3 Synthesis Methods 15 transformation is required. On the other hand, the hydro(solvo)thermal method suffers from drawbacks including autoclave necessity and long lasting chemical reactions which may last for days. 3.3 Coprecipitation Coprecipitation is one of the most common methods to synthesize crystals of uniform small-sized Ln 3+ doped UCNPs are synthesized. There is no need of complex chemical procedures and costly experimental tools [18]. In general, shape and size of UCNPs are controlled by the assistance of ligands and surfactants but the simultaneous control of both phase and size or shape is not feasible. Thus, the coprecipitation method is required to be coupled with post-annealing process. A size controlled synthesis of α-nayf 4 :Yb 3+,Er 3+ nanoparticles regardless of shape was performed via coprecipitation [32]. As an efficient chelator for rare earth ions is used, a stable metal-surfactant complex is formed. Thus, for UCNPs a distinct separation of nucleation and growth stages are provided, which is known as the very first requirement of crystal uniformity postulated by the LaMer Model [33]. Although the surfactant may play a size modulator role resulting in smaller sized UCNPs, weak UC luminescence intensity is still a problem due to α-phase nature of UCNPs. Therefore, a post-heating treatment at high temperature levels, e.g. between 400 C-600 C, is necessary in order to initiate a phase transition from cubic to hexagonal. As a result of that, the UC luminescence intensity gets 40 fold stronger [32]. However, at the end of the post-heating treatment, an increase in size of UCNPs is obtained, which makes them mostly impractical for intracellular applications. It is clearly seen that there is a trade-off between small size and hexagonal phase formation, and so between the biocompatibility and strong UC luminescence intensity.
22 Chapter 4 Synthesis Protocol In this chapter, the synthesis protocol based on the solvothermal method will be outlined in details. The synthesis of 1 mmol core NaYF 4 :Yb 3+,Tm 3+ UCNPs were performed as the molar ratio of the reagents set to YCl 3 :YbCl 3 :TmCl 3 =74.7:25:0.3. In this synthesis method, NaOH, OA-ODE and NH 4 F were used as sodium ion source, surfactant-solvent pair and fluoride source, respectively. The core NaYF 4 :Yb 3+,Tm 3+ UCNPs were synthesized by the following protocol that is a slightly modified version of the protocol proposed by Li et al [34]. 4.1 Synthesis of Core NaYF 4 :Yb 3+,Tm 3+ Upconverting Nanoparticles At room temperature, mmol (146.4 mg) YCl 3, 0.25 mmol (69.5 mg) YbCl 3 and mmol (0.83 mg) TmCl 3 were added to a 50 ml round bottom three-necked flask with 6 ml OA and 17 ml ODE. The entire mixture inside the flask was heated up to C during 60 minutes under vigorous stirring to form a homogeneous light yellow mixture. As the mixture was being heated, vacuum condition was provided via a vacuum pump. The mixture was maintained at C for another 60 minutes under vacuum condition to make sure that all reagents were completely dissolved in the solvent. It is worth mentioning here that vigorous stirring was being maintained throughout the entire synthesis unless otherwise stated. At the end of 60 minutes, the initial turbid mixture became transparent and light yellow in colour. Subsequently, the entire mixture was allowed to cool down naturally to room temperature under atmospheric pressure after the disconnection of the vacuum pump. Meanwhile, a mixture of 2.5 mmol (100 mg) NaOH and 4 mmol (149.1 mg) NH 4 F in 10 ml methanol was prepared at room temperature and subsequently 60 minutes ultrasonication was carried out for complete dispersion of NaOH and NH 4 F in methanol. 16
23 Chapter 4 Synthesis Protocol 17 The mixture of NaOH and NH 4 F in 10 ml methanol was added to the solution of RE chlorides (RECl 3, in our case RE=Y,Yb,Tm) in OA-ODE mixture inside the flask at room temperature to form inorganic NaYF 4 crystal nuclei. This mixture was maintained at room temperature for 30 minutes. Subsequently, the mixture was heated up to 110 C by a rate shown in Table 4.1 in order to evaporate all methanol. A constant temperature increase in a constant time interval favours the formation of high crystalline UCNPs. A fast methanol evaporation is not favourable in this step. It affects the crystal growth of UCNPs resulting in no nanocrystal formation. If methanol is not removed completely in this step, the turbid solution will not become translucent. The unsuccessful removal of methanol hinder the nucleation stage of UCNPs resulting in no crystal formation. The complete evaporation of methanol was achieved as seen as the turbid solution turned out to be completely translucent. Temperature Interval [ C] Time Elapsed [mins] 30= = = = = = = = Total Reaction Time 98 Table 4.1: Methanol evaporation rate For the solution, the temperature was stabilized at 110 C for another 30 minutes under argon (Ar) gas atmosphere. A condenser was connected to the flask for cooling in the next step. Subsequently, the solution was heated up to 298 C where nanocrystal growth of NaYF 4 :Yb 3+,Tm 3+ began. The reaction was maintained at 298 C for an optimized reaction time of 65 minutes. Finally, the solution was allowed to cool down to room temperature. For high quality UCNPs, a precise control of temperature is required for both the crystal nucleation stage and crystal growth stage. Throughout the synthesis, temperature fluctuations were controlled to remain within ±2 C. More temperature fluctuations affect both the crystal phase and the size of UCNPs. In order to remove possible undesired impurities e.g. sodium chloride (NaCl) crystals and OA residues inside the resulting mixture, a washing procedure was carried out at room temperature. The resulting mixture was mixed with 21 ml ethanol. After a few minutes under vigorous stirring, it was placed into the centrifuge for 10 minutes to complete the precipitation of UCNPs. Subsequently, the supernatant was discarded yielding solely the presence of UCNPs at the bottom of the test tube. Remaining UCNPs
24 Chapter 4 Synthesis Protocol 18 were mixed with 40 ml ethanol yet again and were precipitated via centrifugation in 10 minutes. Again, the supernatant was removed from the resulting solution and 1 ml hexane as a non-polar solvent was added to the test tube where only UCNPs were present. Eventually, the dispersion of NaYF 4 :Yb 3+,Tm 3+ UCNPs began as a consequence of hexane addition, thereby forming homogeneous light yellow colloidal solution. 4.2 Synthesis of Core-Shell NaYF 4 :Yb 3+,Tm 4 Upconverting Nanoparticles Core-shell NaYF 4 :Yb 3+,Tm NaYF 4 UCNPs having different shell thickness were synthesized by a seeded growth approach where undoped NaYF 4 crystals grow on the surface of the seed crystals, NaYF 4 :Yb 3+,Tm 3+ at high temperature. Undoped NaYF 4 shell thickness was controlled by changing the concentration of the YCl 3 reagent whilst keeping the molar ratio of reagent (YCl 3 ), fluoride source (NH 4 F) and sodium ion sources (NaOH) as 1:4:2.5. The same molar ratio had been used in the synthesis of core UCNPs by Qian and Zhang, and Wang et al [30, 35]. In addition, the YCl 3 concentration was adjusted to be 0.20 mmol, 0.40 mmol, 0.60 mmol and 0.80 mmol in order to form four core-shell UCNP samples that are sample A, B, C, and D with each different shell thickness. Herein, only the synthesis of core-shell NaYF 4 :Yb 3+,Tm 4 UCNPs of sample A with 0.20 mmol YCl 3 consumption is explained. Even though the same protocol holds for the synthesis of three other samples of core-shell UCNPs, a few steps of the synthesis protocol was adjusted for samples B, C, D. Firstly, the methanol evaporation rate was different in each synthesis. Secondly, the evaporation rate on the nucleation phase was not constant for every core-shell UCNPs. At room temperature 0.20 mmol (39.30 mg) YCl 3 was added to 50 ml round bottom three-necked flask with 6 ml OA and 17ml ODE at room temperature. The vacuum pump was connected to the system, the entire mixture was heated up to 150 C during 60 minutes under vigorous stirring. For another 60 minutes the mixture was maintained at 150 C for the formation of the clear light yellow solution to be observed. Subsequently, the mixture was left for cooling naturally after the vacuum pump was removed from the system. Previously synthesized core NaYF 4 :Yb 3+,Tm 3+ UCNPs dispersed in 0.2 ml hexane was added to the mixture at room temperature. The mixture temperature was increased to 115 C at a rate shown in Table 4.2. The mixture was maintained at 115 C for 30 minutes. Next, the mixture was yet again left for natural cooling to room temperature level under atmospheric pressure. Meanwhile, 0.80 mmol (29.9 mg) NH 4 F and 0.5 mmol (20.3 mg) NaOH mixture was dissolved in 3 ml methanol via 60 minutes sonication at room temperature. This
25 Chapter 4 Synthesis Protocol 19 Temperature Interval [ C] Time Elapsed [mins] 50= = = = = = Total Reaction Time 64 Table 4.2: Heat rate at the beginning of the crystal nucleation stage reactant mixture was subsequently added to the flask and was maintained at room temperature for 30 minutes. After Ar gas flow was given to the system, the mixture was heated up to 115 C at a rate shown in Table 4.3. The mixture was maintained at 115 C for 45 minutes. Temperature Interval [ C] Time Elapsed [mins] 50= = = = = = Total Reaction Time 50 Table 4.3: Methanol evoparation rate for NaYF 4 :Yb 3+,Tm 4 NCs. For the crystal growth stage, the mixture at 115 C temperature level was further heated up to 298 C, where the reaction time was set to 75 minutes. Subsequently, the resulting mixture was cooled down to room temperature level where the washing procedure was started. Similar to the washing procedure of core UCNPs, the same amount of ethanol was consumed. Although every single step of washing procedure of core UCNPs was applied to the core-shell washing procedure, the amount of hexane for the dispersion of NaYF 4 :Yb 3+,Tm 4 UCNPs was slightly changed from 0.4 ml to 1 ml. Finally, five different samples were obtained: One sample of core NaYF 4 :Yb 3+,Tm 3+ nanoparticles and four samples of core-shell NaYF 4 :Yb 3+,Tm 4 nanoparticles. Note that, the UCNP shell thicknesses are supposed to be different. Similarly, an unavoidable fluctuation in the reaction temperature throughout the synthesis of core-shell UCNPs was kept within a 2 C temperature margin.
26 Chapter 5 Measurements and Results Measurements and results regarding the analysis of crystal properties of UCNPs in the samples of core, core-shell A, core-shell B, core-shell C, and core-shell D will be presented in this section. In addition, the XRD patterns of UCNPs in samples A, B, C at elevated temperature levels, which indicate a good thermal stability of the crystal phase of UCNPs will be disclosed. Moreover, simulated QY and experimental UC emission signal gain of the NIR emission in UCNPs will be revealed at the end of this chapter. 5.1 Crystal Structure Analysis of Core and Core-Shell Upconverting Nanoparticles The analysis of crystal properties covers size, shape, and phase characterization of UC- NPs in every sample. The size, shape and phase of core NaYF 4 :Yb 3+,Tm 3+ UCNPs in and core-shell NaYF 4 :Yb 3+,Tm 4 UCNPs with different shell thicknesses are characterized by XRD and TEM techniques. XRD measurements at room temperature were performed on a Newport 4-circle diffractometer with kappa geometry, equipped with Titan CCD detector (λ= Å) [36]. Additionally, high-resolution TEM images were recorded via TEM instrument (JOEL 3000F) to characterize the shape and the size of UCNPs. For XRD measurements, the core NaYF 4 :Yb 3+,Tm 3+ UCNPs and the core-shell NaYF 4 :Yb 3+,Tm 4 UCNPs were dispersed in hexane. Subsequently, the core sample and core-shell samples A, B, C, D were prepared in 0.3 mm quartz-capillaries for size and crystal phase analysis. The X-ray radiation wavelength of the I711 beamline at the MAX II Laboratory was set to Å during XRD measurements of the core and core-shell A,B,C samples. However, the radiation wavelength was shifted to Å for the core-shell sample D. The data analysis of the resulting XRD patterns was carried out by the softwares, PM2K and MATLAB [37]. The broadening of the diffraction peaks in the XRD patterns 20
27 Chapter 5 Measurements and Results 21 Sample Name Core Mean Size [nm] Shell Mean Size [nm] Core 43.74±2.70 Core-Shell A 55.44± ±0.21 Core-Shell B 56.69± ±0.12 Core-Shell C 48.27± ±0.24 Core-Shell D 43.00± ±0.04 Table 5.1: Mean size of hexagonal structured core and core-shell UCNPs. Additionally, mean shell thickness of core-shell UCNPs in each sample is explicitly written. were analyzed to figure out the size of the corresponding UCNPs. Throughout the size analysis, the crystal shape of the core and the core-shell UCNPs were presumed to be hexagonal. In fact, this could be a good assumption since OA, the surfactant used in the synthesis, is decisive parameter on the shape of UCNPs. Not only the type but also the amount of the surfactant used in the synthesis can change the shape of the particles. Subsequently, it will be seen in TEM images that most of UCNPs are indeed hexagon in shape. Table 5.1 shows the mean size of UCNPs in the core sample and core-shell UC- NPs with different thickness in samples A, B, C and D. The relatively high standard deviations in size of UCNPs in samples A, B and C indicate that the monodispersity of core-shell UCNPs is not as high as expected. This is mainly due to the formation of undesired nanocrystals (NCs) through the core-shell synthesis, shown in Figures 5.4 (a) and 5.4 (b). These NCs are are identified as non-coated NaYF 4 that were expected to be shell around the core but instead became separate NCs. The mean size of these NCs are calculated as 1.72 ± 0.01 nm. However, the core sample has a more uniform size distribution. Since the core NCs in core-shell samples were provided solely from the very same core sample, it implies that the production quality of core NCs is better than that of core-shell NCs. Although the relatively high synthesis quality is achieved on the core NCs, small amount of NCs less than 1 nm in size are observed in the core sample in Figure 5.2 (a). These are possibly NaF residues that were not successfully removed during the synthesis washing process. The crystal phase of the UCNPs at room temperature were characterized by the XRD pattern. The XRD patterns of the core and the core-shell UCNPs are represented in Figure 5.1. The position of the diffraction peaks in the corresponding XRD patterns shown in Figure 5.1 indicates that UCNPs having hexagonal crystal phase are present. The distinctive diffraction peaks with relatively high intensity at 2θ angle of 19, 20, 27.5, 33.7 and with relatively low intensity at 2θ angle of 22, 29, 34.7, 38, 39, 40, and 40.4 are indexed to hexagonal structured UCNPs. In addition, the XRD pattern corresponding to sample B has one different diffraction peak at 2θ angle of 18 indexed to the NCs having cubic crystal phase with the other common
28 Chapter 5 Measurements and Results 22 peaks at 2θ angle of 29 and This diffraction peak is the characteristic peak that distinguishes α-nayf 4 NCs from β-ucnps. Thus, in sample B previously mentioned non-coated NaYF 4 NCs with the size of about 1.7 nm are identified to have cubic crystal phase. However, the non-coated NaYF 4 NCs in the other samples, i.e., A, C and D are considered to have hexagonal crystal phase due to the overlapping diffraction peak positions in XRD patterns. The formation of the UCNPs having hexagonal crystal phase is significantly important since it is previously stated that β-nayf 4 :Yb 3+,Tm 3+ UCNPs have higher UC luminescence intensity compared to that of α-nayf 4 :Yb 3+,Tm 3+ UC- NPs. Moreover, the intensity differences in the certain diffraction peaks of each XRD pattern may be seen in Figure 5.1. This implies that the number of detected/formed NCs are different in every sample. Since it is not feasible to use the exact same number of core NCs throughout the shell growth of core-shell UCNPs for every sample, intensity differences are expected. Figure 5.1: The XRD pattern of the non-coated UCNPs in sample core and the shellcoated UCNPs in samples A,B,C,D. The distinctive peak at 2θ angle of 18 implies that there is more than one crystal phase in sample B. The lattice parameters of UCNPs in each sample were calculated by the analysis of diffraction peaks in the XRD patterns, and are given in Table 5.2 on account of the phase characterization. Unintentionally formed, cubic structured, non-coated NaYF 4 NCs in sample B have surely different lattice parameter which is not presented in Table 5.2 instead given here as a= ± nm. A series of TEM images shown in Figures 5.2, 5.3, 5.4, 5.5 and 5.6 is obtained to characterize the shape and the size of UCNPs. According to the presented TEM images, UCNPs in all samples are almost uniform in hexagonal shape. In addition, previously discussed the non-coated undesired NCs with the size of about 1.7 nm are clearly seen in the TEM images. Although the uniformity in shape of UCNPs is as high as expected, a
![Chapter 5 Measurements and Results 23 Sample Name Core Lattice Parameters [nm] Shell Lattice Parameters [nm]](/docs-images/94/119512344/images/29-0.jpg "Core Core-Shell A Core-Shell B Core-Shell C Core-Shell D a=0.597568 ± 0.000002 c=0.350413 ± 0.000002 a=0.")


 (b) (c) 0.2 µm 20 nm 10 nm Figure 5.2: TEM images of NaYF 4 :Yb 3+,Tm 3+ nanoparticles in sample core.")
29 Chapter 5 Measurements and Results 23 Sample Name Core Lattice Parameters [nm] Shell Lattice Parameters [nm] Core Core-Shell A Core-Shell B Core-Shell C Core-Shell D a= ± c= ± a= ± a=0.602 ± c= ± c=0.354 ± a= ± a= ± c= ± c= ± a= ± a= ± c= ± c= ± a= ± a= ± c= ± c= ± Table 5.2: The lattice parameters of UCNPs. small amount of NCs having spherical shape is present. A closed up figure of a spherical NC is shown in Figure 5.3 (c). This could be due to either the unavoidable temperature fluctuations during the synthesis or the lack of precision of the amount of OA consumed in the synthesis. As for the size characterization of UCNPs, TEM images are utilized as a complementary method and the measured mean size of UCNPs are indeed in close agreement with the tabulated results based on PM2K data analysis. (a) (b) (c) 0.2 µm 20 nm 10 nm Figure 5.2: TEM images of NaYF 4 :Yb 3+,Tm 3+ nanoparticles in sample core. (a) (b) (c) 0.2 µm 20 nm 10 nm Figure 5.3: TEM images of NaYF 4 :Yb 3+,Tm 4 nanoparticles in sample core-shell A.
 (b)")


 (b) 2 µm 20 nm 10")

 (b) (c) 100 nm 20")

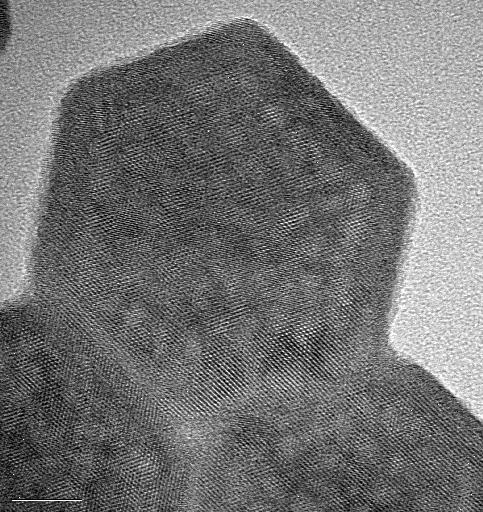
30 Chapter 5 Measurements and Results 24 (a) (b) (c) 0.2 μm 50 nm 20 nm Figure 5.4: TEM images of NaYF 4 :Yb 3+,Tm 4 nanoparticles in sample core-shell B. (a) (b) (c) 0.2 µm 20 nm 10 nm Figure 5.5: TEM images of NaYF 4 :Yb 3+,Tm 4 nanoparticles in sample core-shell C. (a) (b) (c) 100 nm 20 nm 10 nm Figure 5.6: TEM images of NaYF 4 :Yb 3+,Tm 4 nanoparticles in sample core-shell D.
31 Chapter 5 Measurements and Results Thermal Stability Analysis on The Crystal Phase of Core and Core-Shell Upconverting Nanoparticles Thermal stability investigation on the crystal phase of UCNPs at elevated temperature levels is carried out by a post-heating treatment based on an annealing process. UCNPs in core and core-shell A,B and C samples were heated gradually from room temperature to 700 C. As the annealing was carrying on, the XRD patterns of UCNPs at varying temperatures were obtained, presented in Figures 5.7, 5.8, 5.9 and The lowest temperature level for which an XRD pattern presented is 40 C for core sample and 60 C for samples A, B, C. With the exception of sample B, the very first XRD patterns for every other sample, marked in blue, are similar regardless of the intensity values. Similar to the previously presented XRD pattern of sample B at room temperature, the distinctive diffraction peak at 2θ=18 in the XRD pattern of sample B is yet observed at relatively low temperature, 60 C, as expected. This implies that there is indeed more than one different crystal phase in sample B, which are cubic and hexagonal phases. For every sample, the XRD patterns are kept in blue colour in the Figures 5.7, 5.8, 5.9 and 5.10 until the very first change appears on the crystal phase due to the temperature. Intensity [a.u] x Temperature [ C] θ Angle [ ] Figure 5.7: The XRD patterns of the core UCNPs in sample core at varying temperatures. There is no change in the crystal phase of the nanoparticles till 310 C. A phase transformation represented by the XRD patterns coloured in green takes place between the temperatures of 590 C and 600 C. The corresponding XRD patterns of β-ucnps in core sample shown in Figure 5.7 are thermally stable until the temperature reaches 310 C. New diffraction peaks indexed to the presence of relatively small sized α-nc residues, appear at 2θ angle of 18 and
32 Chapter 5 Measurements and Results and remain until temperature reads 460 C. At that level, the cubic crystal phase is exchanged with a new unknown crystal phase having a distinctive peak at 2θ angle of 15 represented by the XRD patterns in red colour. Thus, there are two different crystal phases, i.e., an unknown phase and an hexagonal phase at the temperatures between 460 C and 590 C. Remarkably, a phase transformation from the hexagonal phase to the cubic phase begins at 590 C and continues till 600 C, presented by the XRD patterns in green colour. The distinctive diffraction peaks indexed to the cubic crystal phase appear at 2θ angle of 18, 29 and 34. Subsequently, above 660 C the oxidation begins and deforms the core UCNPs. Thus, the unresolvable diffraction peaks emerge. On the other Intensity [a.u] x Temperature [ C] θ Angle [ ] Figure 5.8: The XRD patterns of the shell-coated UCNPs in sample A at varying temperatures. An unknown crystal phase with the corresponding diffraction peak at 2θ angle=15 appears at 480 C. hand, thermal stability of the shell-coated UCNPs in sample A shown in Figure 5.8 is higher than that of the core UCNPs. The very first change in the XRD pattern coloured in black is visible at 480 C with a diffraction peak at 2θ angle of 15 implying the presence of an unknown phase. Until 580 C, the unknown and the hexagonal phases are still observable. UCNPs do not undergo a phase transformation. The cubic crystal phase formation is not observed through the annealing. Above 600 C, the deformation of the particles starts. According to the XRD patterns shown in Figure 5.9, there are already two different crystal phases at room temperature. These are cubic and hexagonal phases. The majority of the β-ucnps are thermally stable up to 520 C where an additional unknown phase is observed with a distinctive peak at 2θ angle of 15. The temperatures between 590 C and 630 C, the XRD patterns with the diffraction peaks at 2θ angle of 18, 29 and 34, marked in green colour, imply that there is a phase transformation of UCNPs from the hexagonal crystal phase to the cubic crystal phase. Subsequently,
33 Chapter 5 Measurements and Results 27 7 x Intensity [a.u] Temperature [ C] θ Angle [ ] Figure 5.9: The XRD patterns of the shell-coated UCNPs in sample B at varying temperatures. The nanoparticles are thermally stable till 520 C. UCNPs undergo a phase transformation represented by the XRD patterns coloured in green. above 630 C the diffraction peaks in the XRD patterns coloured in magenta could not be indexed to any known NC. For β-ucnps in sample C, the thermal stability on the Intensity [a.u] x Temperature [ C] θ Angle [ ] Figure 5.10: The XRD patterns of the shell-coated UCNPs in sample C at varying temperatures. As from the temperature of 320 C, the crystal phase of UCNPs is no longer thermally stable. crystal phase is diminished around the temperature 320 C. The cubic crystal phase emerges having a diffraction peak at 2θ angle of 18 shown in the XRD patterns marked in black colour in Figure The disappearance of the additional cubic phase at 510 is followed by the formation of an unknown phase having a distinctive diffraction peak at 2θ=15. Subsequently, the inception point and the subsequent progress of the
34 Chapter 5 Measurements and Results 28 oxidation yielding a deformation over NCs are represented by the XRD pattern coloured in magenta above 610 C. 5.3 Quantum Yield Enhancement in Core-Shell Upconverting Nanoparticles The simulated and experimental results reveal a significant increase in the QY of NIR UC emission in core-shell NaYF 4 :Yb 3+,Tm 4 nanoparticles by exploiting millisecond pulsed excitation are presented in Paper I. The main results of that study will be outlined in this section. For the QY measurements, the excitation source is set to be a CW laser diode at 975 nm (Thorlabs L975P1W). It is driven by a benchtop laser diode current controller (Thorlabs LDC220C) with the stabilized temperature at 25 C. The very same laser was employed to generate pulsed light output by modulating the current controller utilizing a function generator (Philips PM5139). Figure 5.11: (a) Simulated power density dependence of the QY in the NIR UC emission under CW excitation. (b) The cumulative QYs under CW excitation and under the pulsed excitation in the first pulse period. The average power density is 1 Wcm 2 for both excitation approaches. (c) The cumulative QYs under CW excitation and under the pulsed excitation in multiple periods. The average power density is 0.1 Wcm 2 for all excitation approaches. For the simulations, the rate equation technique presented in Chapter 2 is used. This is described in detail in Paper I. Simulated cumulative QY pulsed at the average power density of 1 Wcm 2 is 2.4 % in the end of the first pulse for the pulsed excitation with 2 Hz repetition rate and a 4% duty cycle, represented in Figure 5.11 (b). The corresponding QY CW is 1.1% measured under CW excitation with the same power density, shown in Figure 5.11 (a). The pulsed excitation facilitates the late excitation photons to be utilized with higher energy conversion efficiency compared to the counterparts of the CW excitation. Therefore, the higher simulated cumulative QY is achieved
35 Chapter 5 Measurements and Results 29 for the pulsed excitation with sufficient pulse widths. The simulated cumulative QY varies with the pulse widths. Thus, the pulsed excitation repetition rate is studied for 2 Hz, 20 Hz, 50 Hz and 100 Hz. Clearly seen in Figure 5.11 (c), the simulated cumulative QY decreases with pulsed excitation with descending pulse width, i.e., higher repetition rate, which resulted in lower UC signal gain. In fact, at the point where the repetition rate is set to 100 Hz, the generated UC emission signal by CW excitation is slightly stronger than that generated by the pulsed excitation. Herein, simulated results that disclose an increase in the QY in UCNPs are supported by the experimental results. The UC emission signal gain at 800 nm under excitation of 975 nm light was measured. Note that the UC signal gain is defined as QY pulsed / QY CW in Paper I. The average power density of the pulsed excitation is adjusted to be 0.12 Wcm 2, whilst it has a fixed duty cycle of 4 % alongside with different pulse widths. It is seen in Figure 5.12 (a) that the signal gain is measured to be 1.1 for 0.8 ms pulse width. The signal gain is 8.7 as the pulse width is tuned to be 20 ms. Clearly, the signal gain is increasing with increasing pulse width. At the point where signal gain is slightly higher than 1, the pulse width is remarkably shorter than 10 ms that is the approximated lifetime of the intermediate state 3 F 4 of Tm 3+ and thus the time required to generate the NIR UC emission. Figure 5.12: (a) The NIR UC signal gain by the pulsed excitation with different pulse widths. (b) The average excitation power density dependence of the NIR UC signal gain by the pulsed excitation. The pulsed excitation was set to have a 20 ms pulse width and a 2 Hz repetition rate. Inset: The average excitation power density dependence of the NIR UC emission intensity under CW excitation and under the pulsed excitation. Moreover, the UC emission is dependent on applied excitation power density and this dependence is shown in Figure 5.12 (b). A square-wave excitation with a 20 ms pulse and 2 Hz repetition rate is applied at varying average excitation power densities.
36 Chapter 5 Measurements and Results 30 The UC signal gain of 8.7 is measured for lower power densities than 0.12 Wcm 2. However, at the maximum excitation power density, 4.65 Wcm 2, the UC signal gain declines to be less than 1. Although NIR UC emission gets more intense with higher power density of CW and pulsed excitations, the signal gain for the pulsed excitation would decrease. At the maximum level of excitation power density, the UC signal generated by CW is stronger than that of generated by the pulsed excitation. As a result of that, the UC signal gain is below 1 as the excitation power density is at maximum. The underlying reason is that UC emission intensity under pulsed excitation is not ascending in the same manner as that under CW excitation. The inset of Figure 5.12 (b) shows slopes of 1.3 and 1.9 for CW excitation and pulsed excitation, respectively. This clearly shows that the dependence of the emission intensity on the excitation power density differs for pulsed and CW excitations.
37 Chapter 6 Conclusion and Final Remarks In this work, core NaYF 4 :Yb 3+,Tm 3+ UCNPs and core-shell NaYF 4 :Yb 3+,Tm 4 UCNPs have been synthesized and characterized by different techniques, i.e. XRD, TEM and optical technique. Most of the synthesized UCNPs are in hexagonal shape and phase, ranging from 43 nm up to 66 nm in size at room temperature. Additionally, different shell covering the core particles have been successfully formed throughout the synthesis. In these synthesis steps, small amount of impurities with α- NCs in either rectangular or spherical shape and 1 nm in size were formed as observed in TEM images. The observed relatively high standard deviation in size is possibly due to temperature fluctuations during the synthesis. The temperature is one of the most significant experimental for UCNP synthesis. It controls the resulting crystal shape and size. Thus, a better temperature control with better instrumentation during the synthesis could be done for higher uniformity in particle size. The very same UCNPs have been exposed to a post-heating treatment where the temperature level has been increased to 700 C. This was done to figure out the thermal stability of UCNPs crystal phase. Core β-ucnps show no change on the crystal phase observed until 310 C. Subsequently, the phase transformation from hexagonal to cubic is achieved at 590 C. In a similar manner, thermal stability of shell-coated UCNPs begins to degrade above 300 C. Additionally, above 600 C, all UNCPs, whether core or shellcoated, are being deformed due to the high oxidation. Since the intensity of the UC emission signal is highly dependent on the crystal phase of UCNPs, it has a significant importance to know at what level of temperature phase transformation occurs. In addition, an enhancement of the NIR UC emission at around 800 nm in coreshell as compared to core is obtained under the excitation of 975 nm light. Experimental results therefore confirm a significant QY increase of the NIR UC emission using pulsed excitation with wisely selected pulse parameters at room temperature. Through the simulations, at 1 Wcm 2 of average excitation power density, the QY is increased to 2.4% from 1.1% as CW excitation is replaced by the pulsed excitation at a 2 Hz 31
38 Chapter 6 Conclusion and Final Remarks 32 repetition rate and a 4% duty cycle. Experimentally, the influence of pulse width on the UC signal gain at a constant power density is obtained. Longer pulse width results in higher signal gain. Thus, the UC signal gain increased from 1.1 to 8.7 by tuning the pulse width from 0.8 ms to 20 ms. It is worth mentioning that a 0.8 ms pulse width could be sufficient to accomplish a UC signal gain, despite the fact that it is a significantly shorter time than 10 ms, being the lifetime of the intermediate state 3 F 4 of Tm 3+. Yet, it has been confirmed that the UC signal gain is excitation power density dependent. The UC signal gain has a tendency to decline with increasing excitation power density. The UC signal gain for the pulsed excitation is 8.7 at power density set to 0.12 Wcm 2 and subsequently becomes less than 1 as the excitation power density is increased to 4.65 Wcm 2. Therefore, at maximum power density, the UC emission signal generated by pulsed excitation could become weaker than that generated by a corresponding CW excitation. UCNPs are considered as promising contrast agents in diffuse optical imaging with their favorable characteristics. However, they suffer from a low QY of the UC emission at low fluence rates. This limits the possibility to reach plausible imaging depths. An increase in QY of the NIR UC emission could lead to a better image quality with higher imaging depths, as shown in Paper I. In particular, the signal gain at low excitation power densities is significant and would reduce the thermal side effects of the tissue due to excitation light.
39 Bibliography [1] Leyu Wang, Ruoxue Yan, Ziyang Huo, Lun Wang, Jinghui Zeng, Jie Bao, Xun Wang, Qing Peng, and Yadong Li. Fluorescence resonant energy transfer biosensor based on upconversion-luminescent nanoparticles. Angewandte Chemie International Edition, 44(37): , ISSN doi: /anie [2] H. Xing, W. Bu, H. Qu, Z. Wang, J. Shi, Q. Ren, X. Zheng, M. Li, Y. Hua, S. Zhang, K. Zhao, L. Zhou, and W. Peng. A naybf 4: Tm 3+ nanoprobe for ct and nir-to-nir fluorescent bimodal imaging. Biomaterials, 33(21): , ISSN [3] Rufaihah A.J. Chatterjee, D.K. and Y. Zhang. Upconversion fluorescence imaging of cells and small animals using lanthanide doped nanocrystals. Biomaterials, 29: , [4] Y. Chatterjee, D.K. & Zhang. Upconverting nanoparticles as nanotransducers for photodynamic therapy in cancer cells. Nanomedicine, 3:73 82, [5] Guo H. Ho P. Mahendran R.and Zhang Y. Qian, H.S. Mesoporous silica coated up conversion fluorescent nanoparticles for photodynamic therapy. Small, 5: , [6] K.W. Krämer, D. Biner, G. Frei, H.U. Güdel, M.P. Hehlen, and S.R. Lüthi. Hexagonal sodium yttrium fluoride based green and blue emitting upconversion phosphors. Chemistry of Materials, 16(7): , ISSN [7] J.F. Suyver, A. Aebischer, D. Biner, P. Gerner, J. Grimm, S. Heer, K.W. Kramer, C. Reinhard, and H.U. Gudel. Novel materials doped with trivalent lanthanides and transition metal ions showing near-infrared to visible photon upconversion. Optical Materials, 27(6): , [8] N. Bloembergen. Solid state infrared quantum counters. Physical Review Letters, 2(3):84 85, ISSN
40 Bibliography 34 [9] V. V. Ovsyakin and P. P. Feofilov. Cooperative Sensitization of Luminescence in Crystals Activated with Rare Earth Ions. ZhETF Pisma Redaktsiiu, 4:471, December [10] F. Auzel. Compteur quantique par transfert d energie entre deux ions de terres rares dans un tungstate mixte et dans un verre. Comptes Rendus Hebdomadaires des Seances de L Academie des Sciences Serie B 262, pages 1016 &, [11] F. Auzel. Compteur quantique par transfert d energie de yb3+ and a tm3+ dans un tungstate mixte et dans un verre germanate. Comptes Rendus Hebdomadaires des Seances de L Academie des Sciences Serie B 263,, pages 819 &, [12] F. Auzel. Upconversion and anti-stokes processes with f and d lons in solids. Chemical Reviews, 104(1): , ISSN [13] F. Auzel. Multiphonon processes, cross-relaxation and upconversion in ion activated solids, exemplified by minilaser materials. In Radiationless Processes, B. DiBartolo, V. Goldberg. Eds;Plenum Publishing Co. New York, page 213, [14] D. L. Dexter. A theory of sensitized luminescence in solids. The Journal of Chemical Physics, 21(5): , doi: [15] R. Orbach. Optical properties of ions in solids. B. DiBartolo, Ed; Plenum Press, New York, page 445, [16] M. Pollnau, D. R. Gamelin, S. R. Lüthi, H. U. Güdel, and M. P. Hehlen. Power dependence of upconversion luminescence in lanthanide and transition-metal-ion systems. Phys. Rev. B, 61: , Feb doi: /PhysRevB [17] J. F. Suyver, A. Aebischer, S. García-Revilla, P. Gerner, and H. U. Güdel. Anomalous power dependence of sensitized upconversion luminescence. Phys. Rev. B, 71: , Mar doi: /PhysRevB [18] F Wang and XG Liu. Recent advances in the chemistry of lanthanide-doped upconversion nanocrystals. CHEMICAL SOCIETY REVIEWS, 38(4): , ISSN [19] M.F.H. Schuurmans and J.M.F. van Dijk. On radiative and non-radiative decay times in the weak coupling limit. Physica B & C, 123B+C(2): , [20] Zhang Y. Amalraj Appavoo I. Upconverting fluorescent nanoparticles for biological applications. In Emerging Nanotechnologies for Manufacturing, Waqar A, Mark JJ, editors. Boston, MA: William Andrew, pages , 2010.
41 Bibliography 35 [21] F. Zhang, J. Li, D. Zhao, J. Shan, and L. Xu. Shape, size, and phase-controlled rare-earth fluoride nanocrystals with optical up-conversion properties. Chemistry - A European Journal, 15(41): , ISSN [22] J.F. Suyver, J. Grimm, M.K. Van Veen, D. Biner, K.W. Krämer, and H.U. Güdel. Upconversion spectroscopy and properties of nayf4 doped with er3+, tm3+ and/or yb3+. Journal of Luminescence, 117(1):1 12, ISSN [23] Zewei Quan, Dongmei Yang, Chunxia Li, Deyan Kong, Piaoping Yang, Ziyong Cheng, and Jun Lin. Multicolor tuning of manganese-doped zns colloidal nanocrystals. Langmuir, 25(17): , doi: /la901056d. PMID: [24] Guangshun Yi, Baoquan Sun, Fengzhen Yang, Depu Chen, Yuxiang Zhou, and Jing Cheng. Synthesis and characterization of high efficiency nanocrystal up conversion phosphors: Ytterbium and erbium codoped lanthanum molybdate. Chemistry of Materials, 14(7): , doi: /cm [25] Amitava Patra, Christopher S. Friend, Rakesh Kapoor, and Paras N. Prasad. Upconversion in er3+:zro2 nanocrystals. The Journal of Physical Chemistry B, 106 (8): , doi: /jp013576z. [26] Fiorenzo Vetrone, John-Christopher Boyer, John A. Capobianco, Adolfo Speghini, and Marco Bettinelli. Significance of yb3+ concentration on the upconversion mechanisms in codoped y2o3:er3+,yb3+ nanocrystals. Journal of Applied Physics, 96(1): , doi: [27] Xiao Qin, Takeshi Yokomori, and Yiguang Ju. Flame synthesis and characterization of rare-earth (er3+, ho3+, and tm3+) doped upconversion nanophosphors. Applied Physics Letters, 90(7):073104, doi: [28] Y.-W. Zhang, X. Sun, R. Si, L.-P. You, and C. H. Yan. Single-crystalline and monodisperse laf3 triangular nanoplates from a single-source precursor. Journal of the American Chemical Society, 127(10): , ISSN [29] J.C. Boyer, L.A. Cuccia, J.A. Capobianco, and F. Vetrone. Synthesis of colloidal upconverting nayf4 nanocrystals doped with er3+, yb3+ and tm3+, yb3+ via thermal decomposition of lanthanide trifluoroacetate precursors. Journal of the American Chemical Society, 128(23): , ISSN [30] Hai-Sheng Qian and Yong Zhang. Synthesis of hexagonal-phase core-shell nayf4 nanocrystals with tunable upconversion fluorescence. Langmuir, 24(21): , doi: /la802343f.
42 Bibliography 36 [31] J. H. Zeng, J. Su, Z. H. Li, R.-X. Yan, and Y. D. Li. Synthesis and upconversion luminescence of hexagonal-phase nayf 4:yb, er3+ phosphors of controlled size and morphology. Advanced Materials, 17(17): , ISSN [32] G. Yi, H. Lu, D. Chen, S. Zhao, Y. Ge, W. Yang, and L. H. Guo. Synthesis, characterization, and biological application of size-controlled nanocrystalline nayf4:yb,er infrared-to-visible up-conversion phosphors. Nano Letters, 4(11): , ISSN [33] T. Sugimoto. Preparation of monodispersed colloidal particles. Advances in Colloid and Interface Science, 28(C):65 108, ISSN [34] Zhengquan Li and Yong Zhang. An efficient and user-friendly method for the synthesis of hexagonal-phase nayf 4 :yb, er/tm nanocrystals with controllable shape and upconversion fluorescence. Nanotechnology, 19(34):345606, [35] Y. Wang, K. Liu, W.J. Buma, H. Zhang, X. Liu, X. Kong, M.C.G. Aalders, K. Dohnalová, and T. Gregorkiewicz. Critical shell thickness of core/shell upconversion luminescence nanoplatform for fret application. Journal of Physical Chemistry Letters, 2(17): , ISSN [36] L. A. Svensson T. Ursby Å. Oskarsson J. Albertsson Y. Cerenius, K. Ståhl and A. Liljas. The crystallography beamline i711 at max ii,. J. Synchrotron Rad,, 7: , [37] T. Confente M. Leoni and Z. Kristallogr. P. Scardi. Pm2k: a flexible program implementing whole powder pattern modelling. (23): , 2006.
43 Paper I 37 o Paper I Diffuse tissue optical imaging of upconverting nanoparticles enabled by exploiting higher intrinsic quantum yield through use of millisecond single pulse excitation with high peak power. H. Liu, C. T. Xu, G. Dumlupinar, O. B. Jensen, P. E. Andersen, S. Andersson-Engels Nanoscale 5, , 2013.
44 Nanoscale PAPER View Article Online View Journal View Issue Published on 31 July Downloaded by Lund University on 20/02/ :44:24. Cite this: Nanoscale, 2013, 5, Received 17th April 2013 Accepted 22nd July 2013 DOI: /c3nr01917a 1 Introduction During the last decade, upconverting nanoparticles (UCNPs) have developed rapidly, 1 6 and show great promise as contrast agents in biological applications Despite tremendous improvements of UCNPs, their limited quantum yield (QY), especially at a low excitation light level, is still a major concern for most potential biological applications. 12 Two interesting and powerful techniques under development are deep tissue optical imaging 13 and photodynamic therapy (PDT), 14 both of which require high QY. The present low QY thus hinders the potential of these techniques to be unleashed due to prolonged data acquisition and treatment times, and shallow applicable depths. 12,15 Although low QY to some extent can be overcome by increasing the excitation light level, such improvements are fundamentally restricted for continuous wave (CW) excitation due to risks of tissue damage, regulated by the ANSI standards. 16 Instead, the opportunity to break through the low power density limit of upconversion (UC) emission while limiting thermal effects of the excitation light is proposed here by employing pulsed excitation. 12,17,18 In addition, we realize that a Department of Physics, Lund University, P.O. Box 118, S Lund, Sweden. haichun.liu@fysik.lth.se; Fax: ; Tel: b Department of Photonics Engineering, Technical University of Denmark, Frederiksborgvej 399, DK-4000 Roskilde, Denmark Electronic supplementary information (ESI) available. See DOI: /c3nr01917a Deep tissue optical imaging of upconverting nanoparticles enabled by exploiting higher intrinsic quantum yield through use of millisecond single pulse excitation with high peak power Haichun Liu,* a Can T. Xu, a Gökhan Dumlupinar, a Ole B. Jensen, b Peter E. Andersen b and Stefan Andersson-Engels a We have accomplished deep tissue optical imaging of upconverting nanoparticles at 800 nm, using millisecond single pulse excitation with high peak power. This is achieved by carefully choosing the pulse parameters, derived from time-resolved rate-equation analysis, which result in higher intrinsic quantum yield that is utilized by upconverting nanoparticles for generating this near infrared upconversion emission. The pulsed excitation approach thus promises previously unreachable imaging depths and shorter data acquisition times compared with continuous wave excitation, while simultaneously keeping the possible thermal side-effects of the excitation light moderate. These key results facilitate means to break through the general shallow depth limit of upconverting-nanoparticlebased fluorescence techniques, necessary for a range of biomedical applications, including diffuse optical imaging, photodynamic therapy and remote activation of biomolecules in deep tissues. the applicability of UCNPs could be further boosted by utilizing single-shot excitation schemes, i.e., short single pulse excitation with high peak power. Similar to multiphoton microscopy, pulsed excitation would provide high photon density during the pulse, while keeping the average power (i.e., the deposited energy responsible for the heating) moderate. Due to the nonlinear power density dependence of UC emission, pulsed excitation would be highly bene cial. However, two important differences exist between the UC emission and direct twophoton uorescence. Firstly, the QY is much higher for UCNPs at low photon density rates, which constitutes one main reason for the interest in them and removes the reliance of and restriction to focal volume excitation, thus broadening their eld of application. 19,20 Secondly, the excitation for UC emission relies on intermediate energy levels, 21 complicating the process. This has led to some less successful attempts to utilize pulsed excitation for UCNPs in the past. 22,23 It is thus necessary to carefully consider the excitation dynamics of UC emissions under pulsed excitation in order to utilize higher intrinsic QY of UCNPs. In this paper, through investigation of the excitation dynamics of UC emission, we prove through simulations and experiments that signi cant QY increase can be achieved by using pulsed excitation with wisely selected pulse characteristics, i.e., with sufficiently long pulse width and non-saturated energy transfer transitions. Our proposed scheme renders pulsed excitation an ideal excitation approach for UCNPs, especially for deeply located tissue volumes. In fact, the net QY Nanoscale, 2013, 5, This journal is ª The Royal Society of Chemistry 2013
45 Paper View Article Online Nanoscale increase enables us to implement single-shot imaging of UCNPs, shortening data acquisition time by orders of magnitude while simultaneously improving imaging depth as compared to CW excitation. These results have the potential to fundamentally broaden the applicability of UCNPs in deep tissue regions relying on diffuse light excitation, breaking the shallow-depth limitation in UCNP-based imaging. light was detected using a grating spectrometer (Ocean Optics QE65000) with a slit width of 50 mm. The rise pro le of the 800 nm emission was recorded by an oscilloscope (Tektronix TDS520A) coupled to the output of a photomultiplier tube (Hamamatsu R928), using excitation at 975 nm from a laser diode operating in the pulsed mode. All measurements were carried out at room temperature. Published on 31 July Downloaded by Lund University on 20/02/ :44:24. 2 Experimental 2.1 Synthesis of UCNPs Core shell NaYF 4 :Yb 3+,Tm 4 nanoparticles, synthesized through a recently reported protocol, 24 are used as a representative of UCNPs in this work. All the chemicals were purchased from Sigma-Aldrich and used without further puri cation. The core nanoparticles NaYF 4 :Yb 3+,Tm 3+ were rst synthesized using the protocol reported in ref. 25. In a typical synthesis, anhydrous powders of YCl 3 (0.75 mmol), YbCl 3 (0.25 mmol) and TmCl 3 (0.003 mmol) were dissolved in 6 ml oleic acid and 17 ml octadecene in a 250 ml ask at 160 C for 30 min. A er the clear solution cooled down to room temperature, 10 ml of a methanol solution containing 4 mmol NH 4 F and 2.5 mmol NaOH was added, and the mixture was stirred for 30 min at 50 C. The methanol was removed from the system by slowly heating it, and the resulting solution was heated to 300 C for 1.5 h under argon atmosphere. A er the mixture cooled to room temperature, the nanoparticles were precipitated with ethanol and washed with an ethanol water mixture several times, and then redispersed in hexane to form a nanoparticle suspension. The core shell nanoparticles were subsequently produced by slightly modifying the above procedure through incorporation of the prepared core nanoparticles as the seeds in the synthesis. 24 1mmolYCl 3 was solely used to provide rare-earth ions for the shielding layer. Other steps were kept the same as the synthesis of core nanoparticles. 2.2 Characterization and photoluminescence measurements on the UCNP suspension The as-prepared core shell UCNPs were dispersed in hexane and used as the sample. Transmission electron microscopy (TEM) images and the density of the UCNPs were measured on a JEOL 3000F microscope equipped with an X-ray energy dispersive spectroscopy (XEDS) facility. The molar concentrations of rare earth ions were measured on a PerkinElmer Optima 8300 inductively coupled plasma optical emission spectrometer (ICP- OES). The photoluminescence measurements were performed on a sensitive spectrometer setup. A CW laser diode at 975 nm (Thorlabs L975P1WJ) was employed as the excitation source driven by a benchtop laser diode current controller (Thorlabs LDC220C), with the temperature stabilized at 25 C. Pulsed laser light output was achieved by modulating the current controller using a function generator (Philips PM5139). The excitation power was measured using an Ophir Nova II laser power meter equipped with a photodiode sensor (Ophir PD300), while the spot size of the excitation beam was measured using a laser beam pro ler (DataRay Inc. WinCamD-UCD23). The emission 2.3 Diffuse optical imaging using UCNPs Diffuse optical imaging of UCNPs in a liquid tissue phantom was performed either in trans-illumination or in epi-illumination mode. A capillary tube with an inner diameter of 2 mm, lled with a UCNP suspension, was immersed within the tissue phantom to simulate the luminescent target. Excitation of the UCNPs was accomplished either by a Thorlabs L975P1WJ laser diode running in the CW mode, or by a broad area laser (Eagleyard Photonics, EYP-BAL CDL ) operating in the pulsed mode driven by a laser diode driver (LIMO LDD50). The excitation power was measured using an Ophir Nova II laser power meter equipped with a medium power thermal laser sensor [Ophir L40(150)A-SH-V2]. A charge-coupled device (CCD) camera (Andor ixon) was used to acquire uorescence images. 3 Results and discussion 3.1 Numerical simulations on the QY increase by the pulsed excitation The feasibility of increasing the QY of UCNPs using pulsed excitation is rst investigated through numerical simulations. The Yb 3+ /Tm 3+ codoped nanoparticles are used as a representative of UCNPs in this work. The UC dynamics of their major UC emission band, i.e., the NIR UC emission band at around 800 nm, is modeled using the following time-resolved rate equations based on its well veri ed UC pathway under excitation of 975 nm light, 21,29 as shown in Fig. 1, Fig. 1 Schematic energy level diagrams of Yb 3+ and Tm 3+ ions and the proposed UC mechanism following the excitation at 975 nm. The variables used in the text for the population densities of different levels are indicated within the parentheses. This journal is ª The Royal Society of Chemistry 2013 Nanoscale, 2013, 5,
46 Nanoscale View Article Online Paper dn Yb1 ¼ sr dt hn N Yb0 ðc 0 N 0 þ C 1 N 1 þ C 2 N 2 Þ N Yb1 N Yb1 ; s Yb1 (1a) dn 1 dt dn 0 1 dt ¼ C 0 N 0 N Yb1 b 0 1 N0 1 ; ¼ b 0 1 N0 1 C 1N 1 N Yb1 N 1 s 1 ; (1b) (1c) dn 0 2 dt ¼ C 1 N 1 N Yb1 b 0 2 N0 2 ; (1d) Published on 31 July Downloaded by Lund University on 20/02/ :44:24. dn 2 dt ¼ b 0 2 N0 2 C 2N 2 N Yb1 N 2 s 2 ; (1e) where s is the absorption cross-section of Yb 3+ ions; r is the excitation power density; h is Planck's constant; n is the frequency of the excitation light; C 0, C 1 and C 2 are the energy transfer upconversion (ETU) rates from excited Yb 3+ ions to the Tm 3+ ions in states 0, 1 and 2, respectively; s 1 and s 2 are the radiative lifetimes of Tm 3+ ions in states 1 and 2 (non-radiative de-excitation neglected for these levels), while s Yb1 is the lifetime of Yb 3+ ions in the 2 F 5/2 state; b1 0 and b2 0 represent the nonradiative decay rates for and 2 0 2, respectively. A power density dependent and temporally cumulative QY for the NIR UC emission in the time interval [0, t], h(r,t), is de ned as hðr; tþh ð t 0 ð t 0 N 2 ðtþ=s 2 dt ; (2) sn Yb0 r=hndt which can be calculated by numerically solving eqn (1a e). The QY in the steady state following CW excitation is given by h(r,n). In the modeling, we used parameter values which were measured or calculated for the UCNPs used in the experimental work. The ion concentrations were calculated based on the TEM, ICP-OES and XEDS measurements on the UCNPs (see the ESI for the calculation of ion concentrations), and the lifetimes s Yb1 and s 2 were measured experimentally. s, s 1, b1 0 and b2 0 were taken from the literature. The power density dependent steadystate QY of the used UCNPs has been measured and reported recently in our previous work. 30 The ETU rates were thus selected based on the principle of giving the best tting of the simulated power density dependency of steady-state QY with the measured results (see the ESI for the selection of the ETU rates). Table 1 summarizes the parameter values used in the simulations. Fig. 2a shows the simulated QY under steady-state conditions following CW excitation of different power densities. As seen, the QY increases with the excitation power density in a Fig. 2 (a) Simulated power density dependence of the QY of the NIR UC emission in the steady state under CW excitation. (b) The temporally cumulative QYs under CW excitation and under pulsed excitation in the first pulse period. The pulsed excitation had a duty cycle of 4% and a repetition rate of 2 Hz. Both the CW and pulsed excitation approaches provided an average power density of 1 W cm 2. (c) The temporally cumulative QYs under CW excitation and under pulsed excitation in multiple periods. The pulsed excitation had a fixed duty cycle of 4% and various repetition rates. All the excitation approaches provided the same average power density of 0.1 W cm 2. complex manner with a constant steady-state level (saturation level) at high power densities, which is consistent with experimental observations reported in the literature. 31,32 Fig. 2b presents the simulated time dependent QY under CW excitation and under pulsed excitation in the rst pulse period. The CW excitation has a constant power density of 1 W cm 2. The pulsed excitation, having a 2 Hz repetition rate and a 4% duty cycle, has power densities of 25 W cm 2 and 0 W cm 2 in the on and off states, respectively, thus resulting in the same average power density as that of CW excitation. As shown in Fig. 2b, under CW excitation, the UC emission has a constant QY CW except that at the very early stage when the energy levels start to be populated due to the effect of the excitation. This constant QY CW is associated with the steady state of the UC system, and is given by the QY at the power density of 1 W cm 2 in Fig. 2a. Under pulsed excitation, the QY pulsed is very small at the start of the laser pulse, and then increases with time. If the length of the pulse duration allows, the QY pulsed will surpass the QY CW, and asymptotically approach a maximum. This maximum is restricted to the steady-state QY at the power density of 25 W cm 2 in Fig. 2a. Clearly, the advantage of using pulsed excitation to replace the equivalent CW excitation is that the late excitation photons can be potentially used with higher energy conversion efficiency, while the disadvantage is that the Table 1 Summary of general parameter values used in the simulations s (cm 2 ) N 0 (cm 3 ) N Yb0 (cm 3 ) s Yb1 (ms) s 1 (ms) s 2 (ms) C 0 (cm 3 s 1 ) C 1 (cm 3 s 1 ) C 2 (cm 3 s 1 ) b1 0 (s 1 ) b2 0 (s 1 ) a b b 1.32 c 7.43 d 1.49 c e e e d d a From Jiang et al. 26 b Calculated (see the ESI for the calculation of ion concentrations). c From measurement (see Fig. S2 ). d From Ivanova et al. 27 e Estimated from Braud et al. 28 and Ivanova et al. 27 (see the ESI for the selection of the ETU rates) Nanoscale, 2013, 5, This journal is ª The Royal Society of Chemistry 2013

47 Paper View Article Online Nanoscale Published on 31 July Downloaded by Lund University on 20/02/ :44:24. early excitation photons in each pulse period are used with lower efficiency than those in the CW excitation. Through balancing the increased power density and decreased excitation duration under the same amount of energy, an overall UC signal gain (de ned as the ratio of the QY pulsed /QY CW ) can be expected. Cumulative QY in multiple periods under pulsed excitation was investigated in order to estimate the in uence of the pulse width on the signal gain, compared to the equivalent CW excitation. The average power density was kept at 0.1 W cm 2 in the simulations. The pulsed excitation used throughout this study had the same duty cycle of 4% unless otherwise speci ed, and its repetition rate was adjusted in order to achieve different pulse widths. As illustrated in Fig. 2c, a signi cant UC signal gain is obtained by using pulsed excitation when the repetition rate is well below 50 Hz. For example, the signal gain by the 2 Hz square wave in the time interval of [0, 500] ms is approximately 8. The signal gain decreases with the repetition rate, i.e., increases with pulse width as expected. When the repetition rate is even higher, e.g., up to 100 Hz, the signal generated by the pulsed excitation becomes slightly smaller than that generated by equivalent CW excitation. In addition, it should be noted that the signal gain decreases with the applied power density. When the average power density is increased to 1 W cm 2, the signal gain decreases to 2, as shown in Fig. S3. This can be ascribed to the gradual saturation property of UC emission, indicated in Fig. 2a. Although the parameter values were carefully calculated or modi ed in the simulations so that they gave the best tting between the measured and simulated steady-state QY power density dependency, the modeling is not an accurate description of the real UC system. Due to the lack of accuracy and precision data for such values, it is difficult to evaluate the uncertainty of the simulated results. However, the in uence of the variation of parameter values on the simulated signal gain was investigated, with the results for the change of ETU rates shown in Fig. S4. In each comparison, one ETU rate among others was adjusted across the two orders of magnitude around the value listed in Table 1, while two other ETU rates remained unchanged. All simulated results con rm that the UC emission enhancement effect can be achieved by using pulsed excitation with a considerably long pulse duration when the energy transfer transitions are not saturated by the applied power density, as long as the emission originates from a multi-stepwise photon upconversion process. The only difference exists in the extent of the signal gain. It is worth mentioning that the simulated signal gain has a strong dependence on the change of the ETU rate C 1 rather than C 0 and C 2, as shown in Fig. S4. This can be explained by the fact that the balancing power density of UCNPs is highly dependent on C Above this power density, the UCNPs would behave more linearly in emitting upconverted photons upon NIR excitation, 30 leading to decreased signal gain by using pulsed excitation. 3.2 Quantum yield increase by pulsed excitation in the UCNP suspension In order to experimentally validate the gain in the UC signal due to the pulsed excitation predicted by the simulations in Section 3.1, experiments were carried out on colloidal stable UCNPs. Fig. 3 The upconversion spectrum of core shell NaYF 4 :Yb 3+,Tm 4 nanoparticles under excitation of a CW 975 nm laser diode, measured at a power density of 125 W cm 2. The inset shows the TEM image of the prepared core shell UCNPs. Core shell NaYF 4 :Yb 3+,Tm 4 UCNPs were dispersed in hexane and used as the sample. The prepared UCNPs emit the major UC emission bands at around 800 nm under excitation of 975 nm light, as shown in Fig. 3, assigned to the transition 3 H 4 / 3 H 6 of Tm 3+ ions. 29 Other weaker UC emission bands at around 450 nm, 474 nm and 644 nm originate from the transitions of Tm 3+ ions: 1 D 2 / 3 F 4, 1 G 4 / 3 H 6 and 1 G 4 / 3 F 4, respectively. 29 The inset of Fig. 3 shows the TEM image of the prepared core shell UCNPs. The nanoparticles were spherical in shape with an average diameter of 42 nm. The core nanoparticles prior to coating had an average diameter of 32 nm (see Fig. S1 in the ESI ). The intensities of the NIR UC emission under CW excitation and pulsed excitation (square wave) were measured. The pulsed excitation had a xed duty cycle of 4% and different pulse widths. The average power density of the excitation light was kept at 0.12 W cm 2. As shown in Fig. 4a, a signal gain, monotonically increasing with pulse width, was obtained by using the pulsed excitation even with a pulse duration as short as 0.8 ms. When the pulse width reaches 20 ms, the gain is as high as 8.7. It is noteworthy to point out that the required pulse width for the UC signal gain in the present case (0.8 ms) is much shorter than the rise time of the UC emission (i.e., approximately 10 ms, as shown in the inset of Fig. 4a), dominated by the lifetime of the intermediate level 3 F 4 of Tm 3+ ions. This is different from previous predictions reported in the literature, 12,18 and makes the pulsed excitation approach even more exible to use due to a broader pulse width window for QY increase. The dependence of the gain in the UC signal on the applied power density was also investigated using a square-wave excitation with a 20 ms pulse width and 2 Hz repetition rate. Fig. 4b shows the UC signal gain by the pulsed excitation at various average excitation power densities, where a decreasing trend with increasing excitation power densities is clearly seen. At the minimum power density investigated (0.12 W cm 2 ), the This journal is ª The Royal Society of Chemistry 2013 Nanoscale, 2013, 5,
48 View Article Online Nanoscale Paper Published on 31 July Downloaded by Lund University on 20/02/ :44:24. Fig. 4 (a) The NIR UC signal gain by the pulsed excitation with different pulse widths. The data were measured with an average excitation power density of 0.12 W cm 2. Inset: the response of the NIR UC emission to a square-wave excitation with IRF denoting the instrument response function. (b) The dependence of the NIR UC signal gain by the pulsed excitation on the average power density. The pulsed excitation was set to have a 20 ms pulse width and 2 Hz repetition rate. Inset: the average power density dependence of the NIR UC emission intensity under CW and pulsed excitations. signal gain is approximately 8.7, while at the maximum power density (4.65 W cm 2 ), the UC signal generated by the pulsed excitation is slightly weaker than that generated by the CW excitation. The UC emission intensity dependence on the excitation power density under pulsed excitation exhibits a smaller slope than that under the CW excitation, as shown in the inset of Fig. 4b, which could explain the signal-gain trend above. The ampli cation effect of increasing the excitation power density here essentially originates from the non-linear power density dependence of the UC emission. Thus, a higher-order power density dependence would result in a larger UC signal gain. This is con rmed by the measurements on the blue (at 474 nm) and red (at 644 nm) UC emissions, both generated through a three-photon excitation process. They exhibit significantly larger signal gains than the NIR UC emission at any given average power density, as shown in Fig. 5. In view of this, we foresee that pulsed excitation can be employed to increase the applicability of recently implemented migration-mediated UC emissions from ions such as Eu 3+ and Tb 3+ in biological applications, due to their high-order multi-stepwise excitation nature via excited Tm 3+ ions. 33 At present, their applications in such areas are challenged due to their low QYs. It is worth mentioning that the usefulness of pulsed excitation for increasing the QY of UC emissions is not merely limited to Yb 3+ /Tm 3+ codoped UCNPs. Instead, it is a general scheme for enhancing UC emissions and would work in diverse UCNPs with different dopants if the characteristic of the pulsed excitation light is wisely tailored. In addition, as different UCNPs exhibit different optical characteristics, proper characterization Fig. 5 The dependency of the blue (at 474 nm) and red (at 644 nm) UC signal gains by the pulsed excitation on the average power density. The pulsed excitation was set to have a pulse width of 20 ms and a repetition rate of 2 Hz. will make it possible to accurately predict the performance of UCNPs in general under pulsed excitation. 3.3 Single-shot imaging of UCNPs When UCNPs are used as contrast agents in diffuse optical imaging, the imaging depth is usually shallow due to the very low QY of UC emissions at the low uence rates found in deep tissues. 12 The pulsed excitation constitutes an ideal approach for exciting deeply located UCNPs, since the UC emissions can be enhanced without consuming more excitation energy than an equivalent CW source, thus not increasing the thermal sideeffects of the excitation light. This would in turn lead to higher image quality and larger imaging depth. The merit of using pulsed excitation light to image deeply located UCNPs was subsequently tested in a liquid tissue phantom. The phantom, made of water, intralipid and ink, was characterized by photon time-of- ight spectroscopy (ptofs) 34 and determined to have reduced scattering coefficient ms 0 ¼ 10.1 cm 1 and absorption coefficient m a ¼ 0.52 cm 1 at 975 nm, hence mimicking skin tissue properties. Its thickness was 17 mm. A glass tube with an inner diameter of 2 mm, containing the colloidal core shell UCNPs (c ¼ 1 wt%), was inserted into the phantom as the luminescent inclusion to mimic a UCNP-labeled target, e.g., a tumor inside real tissue. CW excitation and pulsed excitation, having 20 ms pulse duration and 2 Hz repetition rate, at 975 nm were applied, respectively. The average power density impinging on the surface of the tissue phantom was 1.2 W cm 2 for both excitation approaches. The excitation source and the detector were positioned in a transillumination geometry. A more detailed description of the experimental setup is found in ref. 32. When buried at a depth of 10 mm from the source, the luminescent inclusion was barely detectable under CW excitation even with an exposure time of 10 s, as shown in Fig. 6a. However, by using pulsed excitation, the signal-to-background ratio was signi cantly increased by a factor of approximately 7 under the same detection conditions, as illustrated in Fig. 6b. An obvious implication is that the data acquisition time can be drastically reduced whilst maintaining the signal quality equivalent to CW excitation. Moreover, it is Nanoscale, 2013, 5, This journal is ª The Royal Society of Chemistry 2013
 CW and (b) pulsed excitation, detected in a transillumination geometry.")
49 Paper View Article Online Nanoscale Published on 31 July Downloaded by Lund University on 20/02/ :44:24. Fig. 6 The NIR UC emission images taken for a luminescent inclusion located at a depth of 10 mm under the (a) CW and (b) pulsed excitation, detected in a transillumination geometry. The average power density was 1.2 W cm 2, and the exposure time was 10 s for both excitation approaches. The NIR UC emission images taken for a luminescent inclusion located at a depth of 13 mm under the (c) CW and (d) 50 ms single pulse excitation, detected in an epi-illumination geometry. Both excitation sources provided the maximum permissible power density allowed by the ANSI standard for exposure to human skin. The exposure time was 10 s for the CW excitation and 1 s for the single pulse excitation. notable that the maximum imaging depth can be increased to 15 mm for pulsed excitation (data not shown). The QY of UC emission can be further optimized by using single pulse excitation, through which even higher power density can be achieved. For instance, the maximum permissible power density for exposure to human skin at 975 nm is 17.4 W cm 2 for a repetitive pulse excitation with a pulse width of 20 ms and a repetition rate of 2 Hz, while the number for a 50 ms single pulse is as high as 36.9 W cm 2, 16 referring to Section 8 in the ESI. Such a strong single pulse with a pulse width longer than the rise time of the UC emission enables the UCNPs to be used in a very efficient way in terms of energy conversion. This excitation approach would improve the imaging ability of using UCNPs without violating the ANSI standard, which is a fundamental limit for bio-imaging. The feasibility of single-shot imaging was experimentally investigated. A 50 ms single pulse providing an excitation power density of 36.9 W cm 2 was used. When the luminescent inclusion was placed at a depth of 13 mm into the phantom, it could be relatively well detected using the single pulse excitation with a detector integration time of 1 s, even using an epiillumination imaging setup described in ref. 17, as shown in Fig. 6d. Nevertheless, when the CW laser was used for excitation, also outputting the maximum permissible power density by the ANSI standard on the same illumination area, i.e., mw cm 2, referring to Section 8 in the ESI, the inclusion was not detectable at all even with a much longer integration time of 10 s, as shown in Fig. 6c. Obviously, the integration time for the single pulse excitation can be shortened to 50 ms still without loss in the UC signal quality, as long as the excitation source and the detector are synchronized. The results demonstrated here, although preliminary, show great potential of single-shot excitation in UCNP-guided deep tissue optical imaging. 4 Conclusions In conclusion, signi cant QY increase in UCNPs is achieved by using pulsed excitation. This is supported theoretically by the study of the UC dynamics based on time resolved rate equations. Such QY increase enables us to implement single-shot imaging of UCNPs in deep tissues. Pulsed excitation thus constitutes an ideal excitation approach for UCNPs, as the shallow imaging limit can be overcome and data acquisition time can be drastically shortened by applying this excitation scheme. The pulsed excitation approach will greatly increase the applicability of UCNPs not only in diffuse optical imaging but also in many other biomedical applications, such as photodynamic therapy and remote activation of biomolecules in deep tissues. 35,36 It is worth mentioning that metallic nanostructures are reported to be effective in enhancing UC emissions owing to their local eld enhancement effect by surface plasmonic coupling. 37 We envisage that the combination of the pulsed excitation approach and metallic nanostructures could become a major scheme of using UCNPs in the diffuse light regime, due to the synergistic effect in increasing the excitation power density. In addition, this study provides a general method for promoting the applications of nonlinear uorophores (including UCNPs and triplet triplet annihilation based upconverters 38 ) under low light conditions by increasing the excitation uence rate through a limited illumination area. Acknowledgements S. Fredriksson, F. Olsson, A. Gisselsson, and P. Kjellman are gratefully acknowledged for the help with the synthesis of the UCNPs and ICP-OES measurement. M. E. Messing and L. R. Wallenberg are acknowledged for the help with the TEM and XEDS measurements. B. Thomasson is acknowledged for the help in the single-shot imaging experiment. S. Johansson and A. Shaharin are acknowledged for the help with the ptofs measurements. We thank D. Kroon and D. Guenot for the assistance in the laser power measurement, and J. Axelsson and P. Svenmarker for their helpful discussions. This work was supported by a grant from the Swedish Research Council (grant no ) and a Linneaus grant to the Lund Laser Centre. References 1 X. Wang, J. Zhuang, Q. Peng and Y. D. Li, Nature, 2005, 437, H.-X. Mai, Y.-W. Zhang, R. Si, Z.-G. Yan, L.-D. Sun, L.-P. You and C.-H. Yan, J. Am. Chem. Soc., 2006, 128, J.-C. Boyer, L. A. Cuccia and J. A. Capobianco, Nano Lett., 2007, 7, E. M. Chan, C. Xu, A. W. Mao, G. Han, J. S. Owen, B. E. Cohen and D. J. Milliron, Nano Lett., 2010, 10, F. Wang, Y. Han, C. S. Lim, Y. Lu, J. Wang, J. Xu, H. Chen, C. Zhang, M. Hong and X. Liu, Nature, 2010, 463, F. Zhang, G. B. Braun, A. Pallaoro, Y. Zhang, Y. Shi, D. Cui, M. Moskovits, D. Zhao and G. D. Stucky, Nano Lett., 2012, 12, This journal is ª The Royal Society of Chemistry 2013 Nanoscale, 2013, 5,
Single-step synthesis and kinetic mechanism of monodisperse and hexagonal-phase NaYF 4 :Yb,Er upconversion nanophosphors
 Single-step synthesis and kinetic mechanism of monodisperse and hexagonal-phase NaYF 4 :Yb,Er upconversion nanophosphors Jingning Shan * and Yiguang Ju Department of Mechanical and Aerospace Engineering,
Nd 3+ -Sensitized Multicolor Upconversion Luminescence from A Sandwiched Core/Shell/Shell Nanostructure
 Electronic Supplementary Material (ESI) for Nanoscale. This journal is The Royal Society of Chemistry 2017 Supporting Information Nd 3+ -Sensitized Multicolor Upconversion Luminescence from A Sandwiched
Supplementary Figure 1: (a) Upconversion emission spectra of the NaYF 4 4 core shell shell nanoparticles as a function of Tm
 Upconversion emission spectra of the NaYF 4 4 core shell shell nanoparticles as a function of Tm") Supplementary Figure 1: (a) Upconversion emission spectra of the NaYF 4 @NaYbF 4 :Tm(x%) @NaYF 4 core shell shell nanoparticles as a function of Tm 3+ content in the inner shell layer. The spectra were
Supplementary Figure 1: (a) Upconversion emission spectra of the NaYF 4 @NaYbF 4 :Tm(x%) @NaYF 4 core shell shell nanoparticles as a function of Tm 3+ content in the inner shell layer. The spectra were
quantum dots, metallic nanoparticles, and lanthanide ions doped upconversion
 Chapter 1 Introduction 1.1 Background Nanostructured materials have significantly different characteristics from their bulk counterparts. 1 Inorganic nanoparticles such as semiconductor quantum dots, metallic
Debye Institute of Nanomaterials Science, Utrecht University, P.O. Box 80000, 3508TA Utrecht, The
 NaYF 4 :Er 3+,Yb 3+ /SiO 2 Core/Shell Upconverting Nanocrystals for Luminescence Thermometry up to 900 K Robin G. Geitenbeek a,*,p. Tim Prins a, Wiebke Albrecht b, Alfons van Blaaderen b, Bert M. Weckhuysen
Supporting Information. Synthesis and Upconversion Luminescence of BaY 2
 Supporting Information Synthesis and Upconversion Luminescence of BaY 2 F 8 :Yb 3+ /Er 3+ Nanobelts 5 Guofeng Wang, Qing Peng, and Yadong Li* Department of Chemistry and State Key Laboratory of New Ceramics
Electronic supplementary information. A longwave optical ph sensor based on red upconversion
 Electronic Supplementary Material (ESI) for RSC Advances. This journal is The Royal Society of Chemistry 2014 Electronic supplementary information A longwave optical ph sensor based on red upconversion
Supporting Information
 Supporting Information A Generic Method for Rational Scalable Synthesis of Monodisperse Metal Sulfide Nanocrystals Haitao Zhang, Byung-Ryool Hyun, Frank W. Wise, Richard D. Robinson * Department of Materials
Supporting Information
 Supporting Information Enabling Förster Resonance Energy Transfer from Large Nanocrystals through Energy Migration Renren Deng,,# Juan Wang,,# Runfeng Chen, Wei Huang,*,, and Xiaogang Liu*,, Փ Department
Engineering Homogeneous Doping in Single Nanoparticle to Enhance
 Supplementary Information Engineering Homogeneous Doping in Single Nanoparticle to Enhance Upconversion Efficiency Xiaomin Li, Rui Wang, Fan Zhang, * Dongyuan Zhao * Department of Chemistry and Laboratory
Electronic supplementary information
 Electronic supplementary information Surface plasmon resonance enhanced upconversion luminescence in aqueous media for TNT selective detection Nina Tu and Leyu Wang* State Key Laboratory of Chemical Resource
Supporting Information The Effect of Temperature and Gold Nanoparticle Interaction on the Lifetime and Luminescence of Upconverting Nanoparticles
 Supporting Information Synthesis and Characterization Supporting Information The Effect of Temperature and Gold Nanoparticle Interaction on the Lifetime and Luminescence of Upconverting Nanoparticles Ali
Energy Transfer Upconversion Processes
 1. Up-conversion Processes Energy Transfer Upconversion Processes Seth D. Melgaard NLO Final Project The usual fluorescence behavior follows Stokes law, where exciting photons are of higher energy than
CHAPTER 3. OPTICAL STUDIES ON SnS NANOPARTICLES
 42 CHAPTER 3 OPTICAL STUDIES ON SnS NANOPARTICLES 3.1 INTRODUCTION In recent years, considerable interest has been shown on semiconducting nanostructures owing to their enhanced optical and electrical
Anti-counterfeiting Patterns Encrypted with Multi-Mode. Luminescent Nanotaggants
 Electronic Supplementary Material (ESI) for Nanoscale. This journal is The Royal Society of Chemistry 2017 Electronic Supplementary Information Anti-counterfeiting Patterns Encrypted with Multi-Mode Luminescent
Room-temperature method for coating ZnS shell on semiconductor quantum dots
 Electronic Supplementary Material (ESI) for Journal of Materials Chemistry C. This journal is The Royal Society of Chemistry 2014 Electronic supplementary information Room-temperature method for coating
Supporting Information
 Supporting Information (α-naybf 4 :Tm 3+ )/CaF 2 Core/Shell Nanoparticles with fficient Near-Infrared to Near-Infrared Upconversion for High-Contrast Deep Tissue Bioimaging Guanying Chen, Jie Shen, Tymish
Hidden Role of Anion Exchange Reactions in Nucleation of Colloidal Nanocrystals
 Electronic Supplementary Material (ESI) for CrystEngComm. This journal is The Royal Society of Chemistry 2015 Hidden Role of Anion Exchange Reactions in Nucleation of Colloidal Nanocrystals Rekha Mahadevu,
CH676 Physical Chemistry: Principles and Applications. CH676 Physical Chemistry: Principles and Applications
 CH676 Physical Chemistry: Principles and Applications Crystal Structure and Chemistry Synthesis of Tetrahexahedral Platinum Nanocrystals with High-Index Facets and High Electro-Oxidation Activity Na Tian
Supporting Information for. Near infrared-to-blue photon upconversion by exploiting direct. S-T absorption of a molecular sensitizer
 Electronic Supplementary Material (ESI) for Journal of Materials Chemistry C. This journal is The Royal Society of Chemistry 2017 Supporting Information for Near infrared-to-blue photon upconversion by
Supporting Information
 Electronic Supplementary Material (ESI) for ChemComm. This journal is The Royal Society of Chemistry 2015 Supporting Information All inorganic cesium lead halide perovskite nanocrystals for photodetector
Supporting information
 Supporting information Lanthanide doped upconverting colloidal CaF 2 nanoparticles prepared by a single-step hydrothermal method: toward efficient materials with near infrared-to-near infrared upconversion
Supporting Information:
 Supporting Information: Columnar Self-assembly of Cu 2 S Hexagonal Nanoplates Induced by Tin (IV)-X Complex Inorganic Surface Ligand Xiaomin Li, Huaibin Shen, Jinzhong Niu, Sen Li, Yongguang Zhang, Hongzhe
* Author to whom correspondence should be addressed; Tel.: ; Fax:
 Nanomaterials 2014, 4, 55-68; doi:10.3390/nano4010055 Article OPEN ACCESS nanomaterials ISSN 2079-4991 www.mdpi.com/journal/nanomaterials Enhanced Upconversion Luminescence in Yb 3+ /Tm 3+ -Codoped Fluoride
Synthesis and Characterization of Iron-Oxide (Hematite) Nanocrystals. Z.H. Lee
 Nanocrystals. Z.H. Lee") ABSTRACT Synthesis and Characterization of Iron-Oxide (Hematite) Nanocrystals Z.H. Lee Engineering Science Programme, National University of Singapore Kent Ridge, Singapore 119260 Monodispersed iron oxide
ABSTRACT Synthesis and Characterization of Iron-Oxide (Hematite) Nanocrystals Z.H. Lee Engineering Science Programme, National University of Singapore Kent Ridge, Singapore 119260 Monodispersed iron oxide
Synthesis of 2 ) Structures by Small Molecule-Assisted Nucleation for Plasmon-Enhanced Photocatalytic Activity
 Structures by Small Molecule-Assisted Nucleation for Plasmon-Enhanced Photocatalytic Activity") Electronic Supplementary Material (ESI) for ChemComm. This journal is The Royal Society of Chemistry 2015 Electronic Supplementary Information Synthesis of Au@UiO-66(NH 2 ) Structures by Small Molecule-Assisted
Electronic Supplementary Material (ESI) for ChemComm. This journal is The Royal Society of Chemistry 2015 Electronic Supplementary Information Synthesis of Au@UiO-66(NH 2 ) Structures by Small Molecule-Assisted
Tetraethyl orthosilicate (TEOS, 99 %), resorcinol, formalin solution (37 wt. %),
, resorcinol, formalin solution (37 wt. %),") Supporting Information A Versatile Cooperative Template-Directed Coating Method to Construct Uniform Microporous Carbon Shell for Multifunctional Core-shell Nanocomposites Buyuan Guan, Xue Wang, Yu Xiao,
Supporting Information A Versatile Cooperative Template-Directed Coating Method to Construct Uniform Microporous Carbon Shell for Multifunctional Core-shell Nanocomposites Buyuan Guan, Xue Wang, Yu Xiao,
Supporting Information
 Supporting Information Dynamic Interaction between Methylammonium Lead Iodide and TiO 2 Nanocrystals Leads to Enhanced Photocatalytic H 2 Evolution from HI Splitting Xiaomei Wang,, Hong Wang,, Hefeng Zhang,,
Development of NIR Bioimaging Systems
 Journal of Physics: Conference Series 16 (28) 1223 doi:1.188/1742-6596/16/1/1223 Development of NIR Bioimaging Systems Kohei SOGA 1, Takashi TSUJI 1, Fumio TASHIRO 1, Joe CHIBA 1 Motoi OISHI 2, Keitaro
Near Infrared Light-driven Water Oxidation in a Molecule-based. Artificial Photosynthetic Device Using an Upconversion. Nanophotosensitizer
 Electronic Supplementary Material (ESI) for Chemical Communications. This journal is The Royal Society of Chemistry 2015 Near Infrared Light-driven Water Oxidation in a Molecule-based Artificial Photosynthetic
Supporting Information:
 Supporting Information: In Situ Synthesis of Magnetically Recyclable Graphene Supported Pd@Co Core-Shell Nanoparticles as Efficient Catalysts for Hydrolytic Dehydrogenation of Ammonia Borane Jun Wang,
Supplementary Materials
 Supplementary Materials Sample characterization The presence of Si-QDs is established by Transmission Electron Microscopy (TEM), by which the average QD diameter of d QD 2.2 ± 0.5 nm has been determined
Comparison of Two Strategies for the Synthesis of Upconverting Nanoparticles as Biological labels
 Journal of Physics: Conference Series Comparison of Two Strategies for the Synthesis of Upconverting Nanoparticles as Biological labels To cite this article: Sisi Cui et al 2011 J. Phys.: Conf. Ser. 277
SYNTHESIS OF CADMIUM SULFIDE NANOSTRUCTURES BY NOVEL PRECURSOR
 Nanomaterials: Applications and Properties (NAP-2011). Vol. 1, Part I 107 SYNTHESIS OF CADMIUM SULFIDE NANOSTRUCTURES BY NOVEL PRECURSOR M. Salavati Niasari 1,2* 1 Department of Inorganic Chemistry, Faculty
TECHNICAL INFORMATION. Quantum Dot
 Quantum Dot Quantum Dot is the nano meter sized semiconductor crystal with specific optical properties originates from the phenomenon which can be explained by the quantum chemistry and quantum mechanics.
Photonic structuring improves colour purity of rare-earth. nanophosphors
 Electronic Supplementary Material (ESI) for Materials Horizons. This journal is The Royal Society of Chemistry 2018 Supporting Information Photonic structuring improves colour purity of rare-earth nanophosphors
Synthesis of nano-sized anatase TiO 2 with reactive {001} facets using lamellar protonated titanate as precursor
 Supporting Information Synthesis of nano-sized anatase TiO 2 with reactive {001} facets using lamellar protonated titanate as precursor Liuan Gu, Jingyu Wang *, Hao Cheng, Yunchen Du and Xijiang Han* Department
Department of Chemistry of The College of Staten Island and The Graduate Center, The City University of
 Electronic Supplementary Material (ESI) for Journal of Materials Chemistry A. This journal is The Royal Society of Chemistry 2014 Fe 3 O 4 /Carbon quantum dots hybrid nanoflowers for highly active and
Supporting Information. CdS/mesoporous ZnS core/shell particles for efficient and stable photocatalytic hydrogen evolution under visible light
 Electronic Supplementary Material (ESI) for Energy & Environmental Science. This journal is The Royal Society of Chemistry 2014 Supporting Information CdS/mesoporous ZnS core/shell particles for efficient
Supplementary Information
 Supplementary Information Metal tips on pyramid-shaped PbSe/CdSe/CdS heterostructure nanocrystal photocatalysts: study of ripening and core/shell formation Whi Dong Kim, a Sooho Lee, a Chaewon Pak, a Ju
Near infrared driven photocatalysis by novel up converting TiO 4 :Yb 3+,Tm 3+ core/shell nano composites
 Near infrared driven photocatalysis by novel up converting TiO 2 @NaGdF 4 :Yb 3+,Tm 3+ core/shell nano composites Pr. Stéphane DANIELE Dr. Shashank MISHRA Ms Ying CHEN Ms Hana AYADI Dr. Gilles LEDOUX Dr.
SUPPLEMENTARY INFORMATION
 SUPPLEMENTARY INFORMATION DOI: 10.1038/NNANO.2012.63 Bright infrared quantum-dot light-emitting diodes through inter-dot spacing control Liangfeng Sun, Joshua J. Choi, David Stachnik, Adam C. Bartnik,
SUPPLEMENTARY INFORMATION
 SUPPLEMENTARY INFORMATION 1. Selection of the concentrations of PQDs and dye co-immobilized in the sol-gel Both donor (PQDs) and acceptor (dye) concentrations used in the doped sol-gel synthesis were optimized.
Division of Fuel Cells, Dalian National Laboratory for Clean Energy, Dalian Institute of Chemical Physics, Chinese
 Electronic Supplementary Material (ESI) for RSC Advances. This journal is The Royal Society of Chemistry 2016 Supporting information Tuned Depositing Ag clusters on ZrO 2 Nanocrystals from Silver Mirror
Supporting Information
 Supporting Information Sinmyung Yoon,, Kyunghwan Oh,, Fudong Liu,, Ji Hui Seo, Gabor A. Somorjai,, Jun Hee Lee,, * and Kwangjin An, * School of Energy and hemical Engineering, Ulsan National Institute
Supporting information
 Supporting information Manipulating the Concavity of Rhodium Nanocubes Enclosed with High-index Facets via Site-selective Etching Yumin Chen, Qing-Song Chen, Si-Yan Peng, Zhi-Qiao Wang, Gang Lu, and Guo-Cong
Supporting Information
 Electronic Supplementary Material (ESI) for Journal of Materials Chemistry C. This journal is The Royal Society of Chemistry 2015 Supporting Information Plasmonics-enhanced metal-organic frameworks nanofilms
Bright CuInS 2 /CdS Nanocrystal Phosphors for High-Gain Full-Spectrum Luminescent Solar Concentrators
 Electronic Supplementary Material (ESI) for ChemComm. This journal is The Royal Society of Chemistry 215 Knowles et al. March 8, 215 Supplementary Information Bright Nanocrystal Phosphors for High-Gain
International Journal of Scientific & Engineering Research, Volume 5, Issue 3, March-2014 ISSN
 156 Copper Nanoparticles: Green Synthesis Characterization Y.Suresh*1, S.Annapurna*2, G.Bhikshamaiah*3, A.K.Singh#4 Abstract Present work describes the synthesis nanoparticles using papaya extract as a
Supporting Information. Dai-Wen Pang,
 Supporting Information Ag Se Quantum Dots with Tunable Emission in the Second Near-Infrared Window Chun-Nan Zhu,, Peng Jiang,, Zhi-Ling Zhang,, Dong-Liang Zhu,, Zhi-Quan Tian, *,,, and Dai-Wen Pang, Key
Structure, morphology and catalytic properties of pure and alloyed Au-ZnO. hierarchical nanostructures
 Electronic Supplementary Material (ESI) for RSC Advances. This journal is The Royal Society of Chemistry 2015 Supporting information for Structure, morphology and catalytic properties of pure and alloyed
Supporting Information. Solution-Based Growth of Monodisperse Cube-Like BaTiO 3 Colloidal Nanocrystals
 Supporting Information Solution-Based Growth of Monodisperse Cube-Like BaTiO 3 Colloidal Nanocrystals Shiva Adireddy, Baobao Cao, Cuikun Lin, Weilie Zhou and Gabriel Caruntu* Chemistry Department and the
CHAPTER 3 RESULTS AND DISCUSSION
 CHAPTER 3 RESULTS AND DISCUSSION 3.1 CHAPTER OUTLINE This chapter presents the data obtained from the investigation of each of the following possible explanations: (1) Experimental artifacts. (2) Direct
Supporting Information for: Emulsion-assisted synthesis of monodisperse binary metal nanoparticles
 Supporting Information for: Emulsion-assisted synthesis of monodisperse binary metal nanoparticles Zhen Yin, Ding Ma* and Xinhe Bao* Synthesis of the PdCu nanoparticles: All synthesis was carried out under
CHAPTER 3. FABRICATION TECHNOLOGIES OF CdSe/ZnS / Au NANOPARTICLES AND NANODEVICES. 3.1 THE SYNTHESIS OF Citrate-Capped Au NANOPARTICLES
 CHAPTER 3 FABRICATION TECHNOLOGIES OF CdSe/ZnS / Au NANOPARTICLES AND NANODEVICES 3.1 THE SYNTHESIS OF Citrate-Capped Au NANOPARTICLES Au NPs with ~ 15 nm were prepared by citrate reduction of HAuCl 4
One pot synthesis and systematic study of photophysical, magnetic properties and
 Electronic Supplementary Material (ESI) for New Journal of Chemistry. This journal is The Royal Society of Chemistry and the Centre National de la Recherche Scientifique 2018 One pot synthesis and systematic
Intracellular Glutathione Detection using MnO 2 -Nanosheet-Modified Upconversion Nanoparticles
 Supporting Information Intracellular Glutathione Detection using MnO 2 -Nanosheet-Modified Upconversion Nanoparticles Renren Deng, Xiaoji Xie, Marc Vendrell, Young-Tae Chang,,, and Xiaogang Liu*,, Department
Electronic supplementary information
 Electronic Supplementary Material (ESI) for ChemComm. This journal is The Royal Society of Chemistry 2018 Electronic supplementary information Heterogeneous nucleation and growth of highly crystalline
Synthesis of Uniform Hollow Oxide Nanoparticles. through Nanoscale Acid Etching
 Supporting Information Synthesis of Uniform Hollow Oxide Nanoparticles through Nanoscale Acid Etching Kwangjin An, Soon Gu Kwon, Mihyun Park, Hyon Bin Na, Sung-Il Baik, Jung Ho Yu, Dokyoon Kim, Jae Sung
The CdS and CdMnS nanocrystals have been characterized using UV-visible spectroscopy, TEM, FTIR, Particle Size Measurement and Photoluminiscence.
 Synthesis of CdS and CdMns Nanocrystals in Organic phase Usha Raghavan HOD, Dept of Information Technology VPM s Polytechnic, Thane Maharashtra Email id: usharagha@gmail.com Abstract: The present work
Supporting Information
 Supporting Information Highly luminescent water-dispersible NIR-emitting wurtzite CuInS 2 /ZnS core/shell colloidal quantum dots Chenghui Xia, a,b Johannes D. Meeldijk, c Hans C. Gerritsen, b and Celso
Photodynamic Therapy, Optical Trapping and Photostimulated Emission Using Upconverting Nanoparticles
 Photodynamic Therapy, Optical Trapping and Photostimulated Emission Using Upconverting Nanoparticles John A. Capobianco Department of Chemistry Biochemistry, Centre for NanoScience Research, Concordia
Introduction to Sources: Radiative Processes and Population Inversion in Atoms, Molecules, and Semiconductors Atoms and Molecules
 OPTI 500 DEF, Spring 2012, Lecture 2 Introduction to Sources: Radiative Processes and Population Inversion in Atoms, Molecules, and Semiconductors Atoms and Molecules Energy Levels Every atom or molecule
Conference Paper Synthesis and Efficient Phase Transfer of CdSe Nanoparticles for Hybrid Solar Cell Applications
 Conference Papers in Energy, Article ID 194638, 3 pages http://dx.doi.org/10.1155/2013/194638 Conference Paper Synthesis and Efficient Phase Transfer of CdSe Nanoparticles for Hybrid Solar Cell Applications
Pt-Ni alloyed nanocrystals with controlled archtectures for enhanced. methanol oxidation
 Supplementary Information Pt-Ni alloyed nanocrystals with controlled archtectures for enhanced methanol oxidation Xiao-Jing Liu, Chun-Hua Cui, Ming Gong, Hui-Hui Li, Yun Xue, Feng-Jia Fan and Shu-Hong
Permeable Silica Shell through Surface-Protected Etching
 Permeable Silica Shell through Surface-Protected Etching Qiao Zhang, Tierui Zhang, Jianping Ge, Yadong Yin* University of California, Department of Chemistry, Riverside, California 92521 Experimental Chemicals:
Monodisperse magnetite nanoparticles with nearly ideal saturation magnetization
 Electronic Supplementary Material (ESI) for RSC Advances. This journal is The Royal Society of Chemistry 2016 Supporting Information for Monodisperse magnetite nanoparticles with nearly ideal saturation
High-Performance Semiconducting Polythiophenes for Organic Thin Film. Transistors by Beng S. Ong,* Yiliang Wu, Ping Liu and Sandra Gardner
 Supplementary Materials for: High-Performance Semiconducting Polythiophenes for Organic Thin Film Transistors by Beng S. Ong,* Yiliang Wu, Ping Liu and Sandra Gardner 1. Materials and Instruments. All
Synthesis of Colloidal Au-Cu 2 S Heterodimers via Chemically Triggered Phase Segregation of AuCu Nanoparticles
 SUPPORTING INFORMATION Synthesis of Colloidal Au-Cu 2 S Heterodimers via Chemically Triggered Phase Segregation of AuCu Nanoparticles Nathan E. Motl, James F. Bondi, and Raymond E. Schaak* Department of
A General Synthesis of Discrete Mesoporous Carbon Microspheres through a Confined Self- Assembly Process in Inverse Opals
 A General Synthesis of Discrete Mesoporous Carbon Microspheres through a Confined Self- Assembly Process in Inverse Opals Zhenkun Sun,, Yong Liu, Bin Li, Jing Wei, Minghong Wang, Qin Yue, Yonghui Deng,
Supporting Information
 Electronic Supplementary Material (ESI) for RSC Advances. This journal is The Royal Society of Chemistry 2014 Supporting Information Au nanoparticles supported on magnetically separable Fe 2 O 3 - graphene
Electronic Supplementary Information. Low-temperature Benchtop-synthesis of All-inorganic Perovskite Nanowires
 Electronic Supplementary Material (ESI) for Nanoscale. This journal is The Royal Society of Chemistry 2017 Electronic Supplementary Information Low-temperature Benchtop-synthesis of All-inorganic Perovskite
Because light behaves like a wave, we can describe it in one of two ways by its wavelength or by its frequency.
 Light We can use different terms to describe light: Color Wavelength Frequency Light is composed of electromagnetic waves that travel through some medium. The properties of the medium determine how light
Interaction mechanism for energy transfer from Ce to Tb ions in silica
 Interaction mechanism for energy transfer from Ce to Tb ions in silica HAA Seed Ahmed 1,2, W-S Chae 3, OM Ntwaeaborwa 1 and RE Kroon 1 1 Department of Physics, University of the Free State, South Africa
University of South Florida Development of a Smart Window for Green Buildings in Florida
 University of South Florida Development of a Smart Window for Green Buildings in Florida PI: Dr. Sarath Witanachchi Students: Marak Merlak, Ph.D Description: This proposal is aimed at developing a smart
Photonics applications II. Ion-doped ChGs
 Photonics applications II Ion-doped ChGs 1 ChG as a host for doping; pros and cons - Important - Condensed summary Low phonon energy; Enabling emission at longer wavelengths Reduced nonradiative multiphonon
Magnetically-driven selective synthesis of Au clusters on Fe 3 O 4 Nanoparticles
 Electronic Supplementary Material (ESI) for Chemical Communications Magnetically-driven selective synthesis of Au clusters on Fe 3 O 4 Nanoparticles Víctor Sebastian, M. Pilar Calatayud, Gerardo F. Goya
Supporting Information:
 Electronic Supplementary Material (ESI) for Nanoscale. This journal is The Royal Society of Chemistry 2017 Supporting Information: Single Component Mn-doped Perovskite-related CsPb 2 Cl x Br 5-x Nanoplatelets
Experiment 3. Condensation Reactions of Ketones and Aldehydes: The Aldol Condensation Reaction.
 Experiment 3. Condensation Reactions of Ketones and Aldehydes: The Aldol Condensation Reaction. References: Brown & Foote, Chapters 16, 19, 23 INTRODUCTION: This experiment continues the saga of carbon-carbon
Light Interaction with Small Structures
 Light Interaction with Small Structures Molecules Light scattering due to harmonically driven dipole oscillator Nanoparticles Insulators Rayleigh Scattering (blue sky) Semiconductors...Resonance absorption
Harnessing the Synergy Between Upconverting Nanoparticles and Lanthanide Complexes in a Multi-Wavelength Responsive Hybrid System.
 Electronic Supporting Information for: Harnessing the Synergy Between Upconverting Nanoparticles and Lanthanide Complexes in a Multi-Wavelength Responsive Hybrid System. Riccardo Marin, a Ilias Halimi,
Supporting Information
 Supporting Information Facile Synthesis of Ag@Pd Satellites-Fe 3 O 4 Core Nanocomposite as Efficient and Reusable Hydrogenation Catalysts Kun Jiang, a Han-Xuan Zhang, a Yao-Yue Yang a, Robert Mothes, b
The photoluminescent graphene oxide serves as an acceptor rather. than a donor in the fluorescence resonance energy transfer pair of
 Supplementary Material (ESI) for Chemical Communications This journal is (c) The Royal Society of Chemistry 20XX The photoluminescent graphene oxide serves as an acceptor rather than a donor in the fluorescence
Modify morphology of colloidal Ag 2 Se nanostructures by laser irradiation
 Supporting information for Modify morphology of colloidal Ag 2 Se nanostructures by laser irradiation Ling-Ling Zhao a, Zhi-Ming Gao a, Hui Liu a, Jing Yang a, Shi-Zhang Qiao a,b, Xi-Wen Du a a School
850 nm EMISSION IN Er:YLiF 4 UPCONVERSION LASERS
 LASERS AND PLASMA PHYSICS 850 nm EMISSION IN Er:YLiF 4 UPCONVERSION LASERS OCTAVIAN TOMA 1, SERBAN GEORGESCU 1 1 National Institute for Laser, Plasma and Radiation Physics, 409 Atomistilor Street, Magurele,
Supporting Information. A new reductive DL-mandelic acid loading approach for moisture-stable Mn 4+ doped fluorides
 Electronic Supplementary Material (ESI) for Chemical Communications. This journal is The Royal Society of Chemistry 2018 Supporting Information A new reductive DL-mandelic acid loading approach for moisture-stable
CHAPTER 7 SUMMARY OF THE PRESENT WORK AND SUGGESTIONS FOR FUTURE WORK
 161 CHAPTER 7 SUMMARY OF THE PRESENT WORK AND SUGGESTIONS FOR FUTURE WORK 7.1 SUMMARY OF THE PRESENT WORK Nonlinear optical materials are required in a wide range of important applications, such as optical
Supporting Information
 Electronic Supplementary Material (ESI) for Chemical Communications. This journal is The Royal Society of Chemistry 2016 Supporting Information Single-crystalline Pd square nanoplates enclosed by {100}
Nanoporous TiO 2 Nanoparticle Assemblies with Mesoscale Morphologies: Nano-Cabbage versus Sea-Anemone
 Electronic Supplementary Material (ESI) for Nanoscale. This journal is The Royal Society of Chemistry 2014 Supplemental Documents Nanoporous TiO 2 Nanoparticle Assemblies with Mesoscale Morphologies: Nano-Cabbage
Lanthanide-Doped Energy Cascade Nanoparticles: Full Spectrum Emission by Single Wavelength Excitation
 Supporting Information Lanthanide-Doped Energy Cascade Nanoparticles: Full Spectrum Emission by Single Wavelength Excitation Dengfeng Peng, Qiang Ju, Xian Chen, Ronghua Ma, Bing Chen, Gongxun Bai, Jianhua
Room Temperature Hydrogen Generation from Hydrous Hydrazine for Chemical Hydrogen Storage
 (Supporting Information) Room Temperature Hydrogen Generation from Hydrous Hydrazine for Chemical Hydrogen Storage Sanjay Kumar Singh, Xin-Bo Zhang, and Qiang Xu* National Institute of Advanced Industrial
Supporting Information
 Supporting Information High Performance Electrocatalyst: Pt-Cu Hollow Nanocrystals Xiaofei Yu, a Dingsheng, a Qing Peng a and Yadong Li* a a Department of Chemistry, Tsinghua University, Beijing, 100084
Optically Bi-functional Hetero-Structured Nanocrystals. Supporting Information
 Optically Bi-functional Hetero-Structured Nanocrystals Angshuman Nag, Akshay Kumar, P. Prem Kiran, Ұ S. Chakraborty, G. Ravindra Kumar and D.D. Sarma,,* Supporting Information Solid State and Structural
O 3. : Er nanoparticles prospective system for energy convertors
 IOP Conference Series: Materials Science and Engineering PAPER OPEN ACCESS Interband optical transitions in Gd 2 O 3 : Er nanoparticles prospective system for energy convertors To cite this article: A
Intensity / a.u. 2 theta / deg. MAPbI 3. 1:1 MaPbI 3-x. Cl x 3:1. Supplementary figures
 Intensity / a.u. Supplementary figures 110 MAPbI 3 1:1 MaPbI 3-x Cl x 3:1 220 330 0 10 15 20 25 30 35 40 45 2 theta / deg Supplementary Fig. 1 X-ray Diffraction (XRD) patterns of MAPbI3 and MAPbI 3-x Cl
Supporting Information. Graphene Oxide-Palladium Modified Ag-AgBr: A Novel Visible-Light- Responsive Photocatalyst for the Suzuki Coupling Reaction**
 Electronic Supplementary Material (ESI) for RSC Advances. This journal is The Royal Society of Chemistry 2014 Supporting Information Graphene Oxide-Palladium Modified Ag-AgBr: A Novel Visible-Light- Responsive
Novel fluorescent matrix embedded carbon quantum dots enrouting stable gold and silver hydrosols
 Novel fluorescent matrix embedded carbon quantum dots enrouting stable gold and silver hydrosols Shouvik Mitra a, Sourov Chandra b, Prasun Patra a, Panchanan Pramanik b *, Arunava Goswami a * a AERU, Biological
Supporting Information for. Metallonaphthalocyanines as Triplet Sensitizers for Near-Infrared. Photon Upconversion beyond 850 nm
 Electronic Supplementary Material (ESI) for Physical Chemistry Chemical Physics. This journal is the Owner Societies 2015 Supporting Information for Metallonaphthalocyanines as Triplet Sensitizers for
Supporting Information for. an Equatorial Diadduct: Evidence for an Electrophilic Carbanion
 Supporting Information for Controlled Synthesis of C 70 Equatorial Multiadducts with Mixed Addends from an Equatorial Diadduct: Evidence for an Electrophilic Carbanion Shu-Hui Li, Zong-Jun Li,* Wei-Wei
SUPPORTING INFORMATION
 SUPPORTING INFORMATION Photoswitching of Bis-Spiropyran Using Near-Infrared Excited Upconverting Nanoparticles Biao Fei Zhang, 1 Michel Frigoli, 2 Fabio Angiuli, 3 F. Vetrone, 4 John A. Capobianco 1 1