Direct Observations of Reaction Zone Structure in Propagating Detonations
|
|
|
- Hugh Webster
- 5 years ago
- Views:
Transcription
1 Direct Observations of Reaction Zone Structure in Propagating Detonations F. Pintgen, C.A. Eckett 1, J.M. Austin, J.E. Shepherd Graduate Aeronautical Laboratories, California Institute of Technology, Pasadena, California Abstract We report experimental observations of the reaction zone structure of self-sustaining, cellular detonations propagating near the Chapman-Jouguet state in hydrogenoxygen-argon/nitrogen mixtures. Two-dimensional cross sections perpendicular to the propagation direction were imaged using the technique of planar laser induced fluorescence (PLIF) and in some cases, compared to simultaneously acquired schlieren images. Images are obtained which clearly show the nature of the disturbances in an intermediate chemical species (OH) created by the variations in the strength of the leading shock front associated with the transverse wave instability of a propagating detonation. The images are compared to two-dimensional, unsteady simulations with a reduced model of the chemical reaction processes in the hydrogen-oxygenargon system. We interpret the experimental and numerical images using simple models of the detonation front structure based on the weak version of the flow near the triple point or intersection of three shock waves, two of which make up the shock front and the third corresponding to the wave propagating transversely to the front. Both the unsteady simulations and the triple point calculations are consistent with the creation of keystone-shaped regions of low reactivity behind the incident shock near the end of the oscillation cycle within the cell. Key words: detonation, transverse waves, laser-induced fluorescence, cellular structure, reaction zone Corresponding author. address: jeshep@galcit.caltech.edu (J.E. Shepherd). 1 Present address: United Technologies Research Center, 411 Silver Lane, East Hartford, CT Preprint submitted to Combustion and Flame 8 February 2003
2 Report Documentation Page Form Approved OMB No Public reporting burden for the collection of information is estimated to average 1 hour per response, including the time for reviewing instructions, searching existing data sources, gathering and maintaining the data needed, and completing and reviewing the collection of information. Send comments regarding this burden estimate or any other aspect of this collection of information, including suggestions for reducing this burden, to Washington Headquarters Services, Directorate for Information Operations and Reports, 1215 Jefferson Davis Highway, Suite 1204, Arlington VA Respondents should be aware that notwithstanding any other provision of law, no person shall be subject to a penalty for failing to comply with a collection of information if it does not display a currently valid OMB control number. 1. REPORT DATE 08 FEB REPORT TYPE 3. DATES COVERED to TITLE AND SUBTITLE Direct Observations of Reaction Zone Structure in Propagating Detonations 5a. CONTRACT NUMBER 5b. GRANT NUMBER 5c. PROGRAM ELEMENT NUMBER 6. AUTHOR(S) 5d. PROJECT NUMBER 5e. TASK NUMBER 5f. WORK UNIT NUMBER 7. PERFORMING ORGANIZATION NAME(S) AND ADDRESS(ES) California Institute of Technology (CalTech),Graduate Aeronautical Laboratories,Pasadena,CA, PERFORMING ORGANIZATION REPORT NUMBER 9. SPONSORING/MONITORING AGENCY NAME(S) AND ADDRESS(ES) 10. SPONSOR/MONITOR S ACRONYM(S) 12. DISTRIBUTION/AVAILABILITY STATEMENT Approved for public release; distribution unlimited 11. SPONSOR/MONITOR S REPORT NUMBER(S) 13. SUPPLEMENTARY NOTES Combustion and Flame, 133(3), 2003, U.S. Government or Federal Rights License 14. ABSTRACT We report experimental observations of the reaction zone structure of self-sustaining cellular detonations propagating near the Chapman-Jouguet state in hydrogen- oxygen-argon/nitrogen mixtures. Two-dimensional cross sections perpendicular to the propagation direction were imaged using the technique of planar laser induced?uorescence (PLIF) and in some cases, compared to simultaneously acquired schlie- ren images. Images are obtained which clearly show the nature of the disturbances in an intermediate chemical species (OH) created by the variations in the strength of the leading shock front associated with the transverse wave instability of a propagat- ing detonation. The images are compared to two-dimensional, unsteady simulations with a reduced model of the chemical reaction processes in the hydrogen-oxygen- argon system. We interpret the experimental and numerical images using simple models of the detonation front structure based on the weak" version of the?ow near the triple point or intersection of three shock waves, two of which make up the shock front and the third corresponding to the wave propagating transversely to the front. Both the unsteady simulations and the triple point calculations are consistent with the creation of keystone-shaped regions of low reactivity behind the incident shock near the end of the oscillation cycle within the cell". 15. SUBJECT TERMS 16. SECURITY CLASSIFICATION OF: 17. LIMITATION OF ABSTRACT a. REPORT unclassified b. ABSTRACT unclassified c. THIS PAGE unclassified Same as Report (SAR) 18. NUMBER OF PAGES 49 19a. NAME OF RESPONSIBLE PERSON
3 1 Introduction All gaseous detonation waves propagating near the Chapman-Jouguet velocity are intrinsically unstable. The instability results in a quasi-periodic oscillation in the strength of the leading shock wave that is associated with a set of weak shock waves propagating transversely to the main front. As a consequence, the reaction zone region is spatially nonuniform and unsteady. The threedimensional nature of the detonation front was discovered by White [1] with interferometry, Denisov and Troshin [2], and Shchelkin and Troshin [3] using soot foils and has since been studied experimentally by many researchers using many different techniques. The three-dimensional complexity of the front creates difficulties for flow visualization techniques that integrate through the flow field. To overcome this, many detonation structure experiments involving flow visualization were carried out in narrow channels: facilities in which at least one dimension is on the order of the detonation cell width. The structure of the triple point was studied in a narrow channel using schlieren techniques and soot foils by several researchers [4 8]. While these experiments contribute valuable evidence to the study of detonation, it must be remembered that the structure of a detonation wave is altered when it propagates in a narrow channel, as shown by Strehlow and Crooker [7]. Schlieren images of detonations in non-marginal cases have also been obtained by Takai et al. [9], among others. In the case of mixtures with regular structure, schlieren images show similar shock configurations to those observed in narrow channels, when the transverse waves were orthogonal with respect to the side walls and the optical path. In nitrogen-diluted mixtures, the schlieren images also show a more irregular cell structure as observed on soot foils. Direct experimental visualizations of chemical species in a detonation wave are more limited. Dormal et al. [10] combined OH emission spectroscopy with pressure traces and soot foils to measure the induction time through a cell. Andresen et al. [11] used the method of planar laser induced predissociated fluorescence (LIPF) in an effort to visualize a cross section of the OH concentration behind a detonation front in a hydrogen-oxygen-argon mixture. Although OH images were obtained, there was not sufficient spatial resolution to obtain any information other than the average spatial period of the oscillations in the OH emission at the detonation front. One major difficulty that this study identified was the substantial amount of natural fluorescence that occurs in detonations and the importance of reducing this in the final image in order to obtain high signal-to-noise ratios. Rayleigh scattering from a planar laser sheet was used by Anderson and Dabora [12] to image a cross section of the density field behind detonations propagating in hydrogen-oxygen-argon 2
4 mixtures. Shock front shapes and quasi-periodic spatial fluctuations in density were observed that correlated with previous numerical and experimental studies. These results confirmed the density variations inferred from previous experimental investigations and predicted by simulation. However, there was no insight provided into the chemical processes taking place in the reaction zone. More recently, LIPF was applied with greater success to fast deflagrations and detonations in hydrogen-air mixtures by Gerlach [13] and Eder [14]. Images of the chemical reaction front with sufficient spatial resolution and signal-to-noise ratio were achieved by using a tunable KrF laser with a pulse energy of 450 mj exciting the OH-radical at a wavelength of 248 nm. A set of filters transmits the fluorescence signal between wavelengths of 288 and 303 nm. In a facility with a diameter, D, of 66 mm, Eder examined a variety of fast combustion processes in hydrogen-air mixtures with an equivalence ratio between 0.4 and 2.4 at atmospheric pressure. For marginal detonations with λ/d 1.6 where λ is the detonation cell width, an irregular reaction front containing some unreacted regions was observed behind the leading shock wave. In detonations with λ/d 1, the reaction front looked rather smooth and it was difficult to observe evidence of the cellular structure. The application of LIPF and Rayleigh scattering appeared to be limited for studies of fully developed detonations given the relatively poor results in comparison to the success of LIF methods in elucidating the reaction zone structure of turbulent flames [15] and shock-induced combustion [16 18]. LIPF is a relatively low yield process and it was apparent that the signal-to-noise ratio was a significant issue for this application. Rayleigh scattering is an extremely low yield method and also very difficult to use in most detonation tubes because of the large numbers of particulates and soot buildup due to use with hydrocarbons or soot foil diagnostics. A more promising technique for investigating fully developed detonations is nonresonant LIF, pumping and detecting at different frequencies. By carefully choosing the parameters of the detonation and LIF system, we felt that it would be possible to overcome previous difficulties and image the details of the reaction zone structure. In the present study, we build on the extensive prior work on detonation structure and apply both classical techniques of soot foils and schlieren imaging alongside the newer method of Planar LIF or PLIF to visualize the OH concentration. We are concerned with cases of multi-headed waves that have an instability structure that is fully three-dimensional and perform experiments in a test section with a large (150 mm on a side) square cross section. In this paper, we report on experiments with mixtures of stoichiometric H 2 - O 2 diluted with either Ar or N 2. After describing our experimental setup, we give the experimental results, then describe numerical simulations, and compare our experiments to the simulations. We carry out a detailed analysis of 3
5 the triple point configuration and consider the implications of our study to the broader issues connected with the role of transverse waves in detonation propagation. 2 Experimental Setup The experiments were carried out using a 7.3 m long, 280 mm diameter detonation tube [19] attached with a cookie-cutter to the 150 mm square test section described in Kaneshige [20]. The facility is shown in Fig. 1a. Detonations are initiated with an exploding wire and a short section of acetylene-oxygen mixture injected immediately prior to the wire explosion. The acetylene-oxygen driver is injected through a distributed manifold surrounding the wire. The initiation system results in direct initiation with a highly repeatable operation and detonation velocities within 0.5% of the Chapman-Jouguet value. Detonation pressure and velocity is measured by a series of pressure transducers located along the length of the tube and in the test section. The flow may be visualized through windows located approximately 7.5 m from the initiation point. Stoichiometric mixtures of hydrogen and oxygen diluted with argon or nitrogen, initial pressure of 20 kpa, and nominal initial temperature of 25 C have been examined in the present study. Schlieren images, pressure histories, and soot foil records indicate the detonations are fully developed, self-sustaining waves within the test section. The detonation reaction zone has been visualized by exciting OH fluorescence at about 284 nm with a planar light sheet and imaging the emitted light with an intensified charged-coupled device camera. The development of the PLIF visualization method and the initial experimental results are described in detail by Pintgen [21]. Simultaneous observations with a laser schlieren system have also been used in some tests. The UV light for excitation of the OH molecules is produced by frequency doubling the output of an excimer-pumped dye laser. The excimer laser (Lambda Physik, Model Compex 102, XeCl filling) produces a 17 ns pulse of broadband light centered at 308 nm with a total energy of about 300 mj. The dye laser (Lambda Physik, Model Scanmate 2E) uses Coumarin 153 dye and a frequency doubler to produce narrowband UV light with a total energy of about 6.5 mj. The frequency of the dye laser was tuned to nm, which is located half-way between two OH transitions: a) A 2 Σ + X 2 Π(1,0) Q 2 (8) at nm; b) A 2 Σ + X 2 Π(1,0) Q 1 (9) at nm. The choice of the two transitions was based on computations with the LIFBASE program [22] and repeated experimental trials. The offset of the dye laser frequency calibration was determined by scanning in frequency while measuring the fluorescence yield from a hydrogen diffusion flame in air, comparing the results to simu- 4
6 lated scans with LIFBASE. The output of the frequency doubler was formed into a sheet by using a combination of cylindrical (focal length mm) and spherical lenses (focal length 1000 mm). The final usable height was about 80 mm, and the thickness of about 0.3 mm was determined by burns on thermopaper. The light sheet entered the test section through a quartz window at the end wall of the test section. The induced fluorescence emerged through a quartz window at 90 degrees to the light sheet (Fig. 1b) and was imaged on to a slow-scan pixel ICCD (Princeton Instruments ITE/ICCD-576) camera through a bandpass filter with a centerline of 313 nm and 10 nm FWHM. The detected radiation is expected to be primarily due to (1,1) transitions [23] near 315 nm. Detection in this spectral region minimizes problems such as fluorescence trapping and ensures that the images will not be contaminated by Mie scattering or stray reflections from the test section of the incident light sheet. An image was formed by a 105 mm f/4.5 Nikkor UV-transmitting lens on to the microchannel plate, which was gated with a 100 ns pulse of 800 V. The gate signal to the camera was synchronized with the laser firing pulse, and the laser firing was coordinated with the detonation front location by using a programmable delay generator triggered from a pressure transducer located upstream of the visualization section. The signal from the pressure transducer is processed through a latching edge-detection trigger circuit to eliminate false triggers from the capacitor discharge system used to initiate the detonation. Careful adjustment of the timing is essential to obtaining OH images since the excited state population quickly decays and the camera gate time must also be limited to maintain a high signal-to-noise ratio in the image. There are very high concentrations of OH behind a detonation front, and natural fluorescence is a significant source of noise. Due to the short life time of the excited state, the laser pulse must occur within the camera gate time in order to obtain an image of the laser induced fluorescence. In the present case, the operation of the pulse-forming circuit and thyratron switch in the excimer laser resulted in a delay of about 1200 ns between the trigger pulse and the light output. A jitter of up to 200 ns can occur in the function of the thyratron, requiring the timing to be tested and adjusted prior to each detonation experiment. The camera gate pulse was set to occur 40 ns prior to the assumed nominal laser function time. For simultaneous schlieren and PLIF images, the Q-switched, flash-lamp pumped ruby laser described by Akbar [19] was used to create a short (< 50 ns) light pulse at 693 nm. The light was formed into a collimated beam about 150 mm diameter, passed through the test section, and then imaged by a combination of mirrors and lenses onto high-speed instant (Polaroid 3000 ISO) film. The time between acquiring the schlieren and PLIF images is measured by photodiodes to be less than 600 ns. The ICCD camera is placed just outside the 5
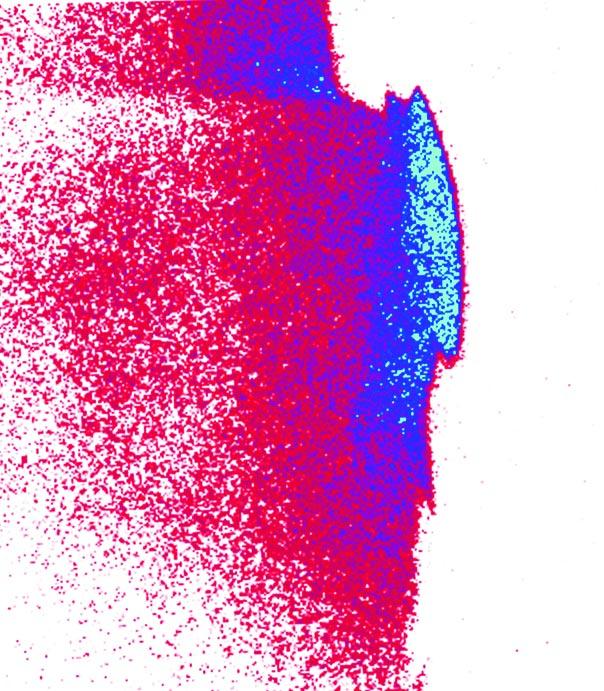
7 optical path of the schlieren system and, therefore, views the laser sheet not normally but at an angle of 12 (Fig. 1), causing the PLIF image to be slightly distorted. Images of a test pattern and postprocessing are used to correct this distortion and also to align the PLIF and schlieren image. 3 Experimental Results One OH image is obtained for each experiment. A selection of these images is shown in Figs. 2 4; the image is identified by the test number. The height of each image is approximately 80 mm and the detonation wave is traveling from left to right in all images. The detonation front instability exhibits seemingly random variations in the phasing of the transverse waves. For this reason, it is not possible to use repeated experiments to construct a coherent time sequence. It is also important to note that these images are qualitative rather than quantitative since we have not corrected for the effect of the laser beam nonuniformity or molecular effects such as quenching or time-dependence of the excited state population. The main value of the present results is in revealing the geometry of the OH fronts and enabling an interpretation in terms of gas dynamics and chemical reactions. A distinct OH concentration front is visible in all cases. Simulations of the reaction zone behind the shock front, discussed subsequently, indicate that the origin of the front is due to the sharp rise in the OH concentration at the end of the induction zone or region of radical chain reaction behind the main shock front. The fluorescence intensity decreases rapidly with increasing distance downstream (to the left in the images) from the front and there is significant radiation detected from only the first mm behind the front. This can probably be explained by the dependence of the PLIF signal intensity on the OH number density profile through the reaction zone. The OH number density rises sharply, reaches a maximum, and then decreases with increasing distance from the shock, as shown by a ZND calculated profile in Fig. 5. A temperature profile is also shown. Other parameters influence the spatial variation of the collected signal magnitude: the transition probability of absorbance and spontaneous emission, variations in the X 2 Π initial state population with the local thermodynamic state, and quenching of the excited A 2 Σ + state by water [24]. The absorption of the light sheet energy by OH can also gradually decrease the fluorescence intensity behind the shock. Due to the absence of large shadows and caustics, refraction of the incident light associated with the large refractive index variations near the absorption lines seems to have a minor influence on the PLIF signal. The efficiency of the collection optics will, of course, influence the overall PLIF signal intensity [25]. The geometry of the OH front is striking and some common features stand out. 6
8 A single and particularly pronounced feature with a keystone shape is seen in shot Similar features appear in other images. An important point to note while examining these images is that the light sheet may not have intersected the cellular structure orthogonally, as can be seen from soot foils taken at the test section end wall (Fig. 6). That is, although the light sheet is aligned perpendicularly to the test section walls, the detonation cellular structure may not be orthogonal to these walls, potentially resulting in some threedimensional effects in the images. In the facility used in these experiments, the detonation transitions from a tube with a round cross section to a square test section via a cookie-cutter. This change in geometry may influence the orientation of the cell structure. Fig. 7 shows schematically how such nonorthogonal intersections may result in features similar to those observed in some PLIF images. In Figs. 2 4, the shock location is not known but it can be inferred from the simulations and simultaneous schlieren and PLIF images to be just to the right of the OH emission front. We anticipate that the distance from the shock to the OH front will be a strong function of shock strength and the clearly visible sudden changes or jumps in the location of the front must be associated with the instability of the detonation wave. This is confirmed by the simultaneous schlieren and OH PLIF images shown in Fig. 8. Despite the masking effect of the three-dimensional nature of the transverse waves, it is clear that the changes in the OH concentration front location can be correlated directly with the density field changes visualized by the schlieren images. The variation in the OH concentration front location with shock velocity is confirmed by numerical simulations described subsequently. The mixtures chosen in these experiments were intended to investigate both regular (Ar-diluted mixtures) and more irregular (N 2 -diluted mixtures) cell structure to determine if there were corresponding differences in the chemical reaction zone structure and particularly, if differences could be seen in the mechanism by which combustion occurs. Previous work [26] has suggested that regular mixtures react by auto-ignition following shock compression, while the reaction zone of irregular mixtures is affected and possibly sustained by turbulence-producing shock wave interactions with other shock waves or shear layers. We hope to be able to investigate these issues by directly visualizing the reaction zone structure of mixtures of varying cellular regularity. A list of mixture parameters is given in Table 1. Sooted foils from a 280 mm diameter detonation tube were used to measure the cell width in these mixtures and illustrate the differences in cellular regularity of the mixtures chosen (Fig. 9). 7
9 4 Numerical Simulation Numerical simulations of two-dimensional detonations traveling in a 6.0 cm channel at the Chapman-Jouguet velocity in 2H 2 -O 2-7Ar mixtures at an initial pressure of 6.7 kpa have been carried out by Eckett [30]. These simulations used a reaction model and thermochemistry based on a detailed reaction mechanism. The chemical reactions were represented by an approximate fourdimensional manifold using the ILDM technique augmented with an induction time manifold for the initiation stage; details are provided in Eckett [30]. The numerical simulations used adaptive mesh refinement and an approximate Riemann solver (Roe-Glaister) to provide high resolution and accuracy. The ILDM reduced mechanism and the numerical solution technique were validated against several test cases and previously published results using the full detailed chemistry. Simulated schlieren and OH mass fraction images are shown in Fig. 10. A close-up of the OH mass fraction and the key features of the detonation front are shown in Fig. 11. Several features can be observed in the close-up of the OH mass fraction. First, there are the obvious OH fronts closely following curved portions (Mach stems) of the leading shock wave. Second, on the centerline between the two Mach stems, there is a keystone-like feature which is bounded by the lead shock, the shear layer, and the OH front behind the incident wave (the geometrical configuration is discussed in more detail in the following section). Third, the decrease in mass fraction along the downstream edge of slip lines can also be seen. There is a striking qualitative similarity between the overall appearance of the numerical simulation of the OH mass fraction and the experimental images presented in Fig. 3. Keystone features are present in Fig. 2 but since the reaction zone is much shorter, they are not as distinct as in the 85% argon case. The features in Fig. 4 are much more irregular and pronounced than in the argon-diluted cases. This is consistent with the well-known observations of the irregularity of the cellular structure in nitrogendiluted cases as compared to the regular structure with large amounts of argon dilution. It is important to note that the three-dimensional nature of the experimental studies, the nonuniformity of the light sheet, nonideal effects in the fluorescence process, and response of the camera will be important factors in determining the appearance of the OH front in the image. Given all of these issues, it is not surprising that the simulations do not exactly reproduce the observed shapes. Nevertheless, the results are similar and provide direct evidence of how the chemical reaction processes are affected by the detonation front instability. Understanding the keystone regions requires investigating in detail the struc- 8
10 ture of the reaction zones behind the leading and transverse shock wave systems that make up the detonation front. Detailed analysis of the simulations can be used to obtain the variation of the leading shock front pressure and velocity through the cell; the results are shown in Fig. 12. The pressure and shock velocity variation indicate that the leading shock front velocity is a maximum value of about 1.3 U CJ at the beginning of the cell (x = x o ), dropping sharply to about 0.93 U CJ by the middle of the cell (x x o = 0.5L) and remaining nearly constant at this value until the collision of the transverse waves causes a rapid increase in the shock front velocity at the end of the cell (x-x o = L). The observed range of leading shock velocities, 0.91 <U/U CJ < 1.3, is similar to that computed by Oran et al. [31] but smaller than has been experimentally observed by previous researchers [4,32,7] who studied marginal waves, for which the excursions in lead shock velocities are apparently much stronger. In addition, Gamezo et al. [33] calculate that the amplitude of oscillation of the leading shock velocity increases with increasing mixture activation energy. One key issue is the variation of the rate of reaction behind the shock front. A common approach to this issue is to use a quasi-steady estimate of the reaction zone structure based on the instantaneous value of the leading shock velocity. Shown in Fig. 13 is an estimate of the induction time (based on the location of the maximum energy release rate) for the simulations shown in Fig. 10. The quasi-steady approach ignores the time-dependence or unsteadiness of the shock front and the possible effect on the reaction zone structure. The role of unsteadiness in detonation initiation has been considered by Eckett et al. [34]. They show that the effect of a decaying wave is to increase the reaction zone thickness, and the amount of increase is a strong function of the rate of decay of the leading shock front. If the shock front decay time is less than a critical value, then Eckett et al. [34] find that the unsteadiness can actually quench the reaction and cause the energy release to become completely decoupled from the shock front. Previous experimental and numerical studies on detonations have suggested that this occurs in some mixtures, resulting in unreacted pockets behind the detonation front. 5 Unreacted Gas Pockets An unburnt gas pocket is defined here as a region of unreacted gas that becomes detached from the main detonation front after the collision of two triple points. It should not be confused with the unreacted gas in the induction zone behind the incident wave which results in the keystone features observed in the PLIF images. Unburnt pockets are speculated to persist to a distance on the order of a cell dimension downstream of the main front and to be resolvable at the scale of the cell width. 9
11 Islands of unreacted gas that become isolated downstream of the main detonation front were first discussed by Subbotin [8] in his schlieren study of the detonation structure of regular and irregular mixtures. In an irregular mixture, 2 CH 4-2O 2-0.2Air, he concluded from polar calculations based on the observed wave angles that the transverse wave configurations were usually unreactive and reported that unburnt islands of gas were formed. In these irregular methane mixtures, the unburnt islands were fragmented by the fine scale cellular structure. These detonations were reported to be self-sustaining. In a regular mixture, 2H 2 -O 2-3Ar, he reported reactive transverse waves and no pocket formation except when the initial pressure was lowered sufficiently for the detonation to become marginal. In these marginal cases, he concluded both reactive and unreactive transverse wave configurations were observed. He showed schematically how regular, triangular-shaped, unburnt gas islands could be formed by the collision of unreactive transverse waves. He noted that in these mixtures, the detonation was unstable and failing. Subbotin s conclusions about the reaction zone structure, while very interesting, are based on (often unpublished) schlieren images, and furthermore, result from experiments conducted in a very narrow (4.7 mm) channel which was also rather short (1.4 m long), making it difficult to determine the stability of the detonation. In 1982, Edwards made schlieren images in a 2H 2 -O 2-4.5%Ar mixture in a narrow (6.3 mm) channel and observed density gradients of irregular regions of gas on the order of one cell width downstream of the front [35]. An accompanying numerical simulation of a detonation near its initiation limit in this mixture shows a region of increased induction time left isolated after the collision of an unreactive triple point with an axis of symmetry. In more recent numerical simulations, Gamezo et al. [36] report that unburnt pockets are commonly observed and conclude mixtures with low activation energies (E a /RT vn =2.1) show unburnt pockets that are triangular in shape with indistinct boundaries while higher activation energy (E a /RT vn =7.4) mixtures have distinct, irregular pockets which survive further downstream. Gamezo et al. [33] believe the mechanism by which the pockets are consumed also varies with the activation energy of the mixture. Pockets in low activation energy mixtures appear to react by auto-ignition after shock compression, while pockets in irregular mixtures are supposed to be consumed by heat and mass exchange with neighboring hot gases through diffusion and turbulence. Sharpe [37] observes the collision of two transverse wave configurations in which the secondary triple point becomes detached from the front before collision. The triple point configuration that remains attached to the front is not strong enough to consume the unreacted gas upon collision, resulting in an unburnt pocket. Sharpe also shows that numerical resolution can play an 2 stoichiometric CH 4 -O 2 diluted with 6% air 10
12 important role in determining the structure of the triple point and the presence of unburnt regions with insufficient resolution resulting in an artificially accelerated reaction rate. All previous investigations of unreacted pockets, both experimental and numerical, have been carried out in the special case of essentially two-dimensional flows, commonly on marginal detonations. Unburnt pockets have been postulated to appear in cases where the transverse waves are weak and do not consume the reactants behind the incident wave during the triple point collision. Although from shock polar analysis as well as from the shape of the keystone region (see section below), we conclude that in the case of the 2H 2 - O 2 -Ar mixtures we studied, the transverse waves are weak (M T 1.2) and unreactive, and no such pockets were observed in the present experiments. The PLIF signal intensity decays with distance from the front, so that small differences in reactivity may be difficult to image more than 2-3 cm downstream of the reaction zone. However, if unreacted pockets exist, we would expect to see evidence of their formation close to the front. The PLIF image from shot 1417, shown in detail in Fig. 14, shows what appears to be a new Mach stem forming just after a triple point collision, and no unreacted region is visible. In the N 2 -diluted mixtures studied, some unusual features are observed (see, for example, Shot 1427); however, these do not have the structure previously associated with unburnt pockets. We attribute these features to the relative orientation of the light sheet to the planes of the detonation cells. The transition that the detonation must make from a round tube to the square test section may create this three-dimensional effect. A study with sooted foils located along the length of the test section recorded the transition in cellular structure from spinning to orthogonal, and found N 2 -diluted mixtures require a greater distance for the cellular structure to become orthogonal, resulting in more pronounced three-dimensional effects in these mixtures. Sharpe s observations about numerical resolution [37] may explain the absence of pockets in our numerical simulations. However, we can examine the potential for pocket formation in the simulations of Eckett [30] by computing the shock decay time through numerical differentiation of the data in Fig. 12b. This is compared to the computed critical decay rates, as defined by Eckett et al. [34], in Fig. 13. We would not expect any decoupling or pocket formation since the shock decay time is less than the critical shock decay time throughout the entire cell. Also, on this basis, subsequent computations of the reaction zone structure will use the quasi-steady approximation for simplicity. 11
13 6 Triple Point Analysis Triple point configurations through a detonation cell have been investigated experimentally, theoretically, and numerically by various researchers. Progress has been made towards determining the triple point structure at different locations through the cell for varying mixtures in varying geometries, giving a wide spectrum of results. Because of the difficulties associated with studying the full three-dimensional structure, most work has concentrated on marginal detonation waves where the detonation is propagating close to its limit, usually in a facility in which at least one transverse dimension is on the order of the detonation cell width, λ. Experiments have concentrated on single-spin detonation [4,38,39] or on detonation waves in a narrow channel [4 8]. Two general classes of triple point structure have been suggested: weak configurations that involve a single triple point with nonreactive waves, and strong configurations that involve a second triple point, generally with some portion of the transverse wave becoming reactive (Fig. 15). Many variations of these configurations have been reported. As discussed in Strehlow and Crooker [7], marginal detonations differ from ordinary detonations in several ways; in particular, the transverse wave spacing and strength are increased in comparison to ordinary detonations. For non-marginal (or ordinary) detonations in three dimensions, the triple point structure has been studied only indirectly, predominantly by soot foil tracks or with visualization techniques that integrate through the flow field. The strength and reactivity of transverse waves, at least in the vicinity of the triple point, may be calculated by polar analysis and zero-dimensional reaction zone models, as discussed in detail later in this section. From this type of analysis, we can order some sample mixtures in terms of their expected transverse wave strengths so as to have a loose classification of the mixtures studied in the present experiments. It should be noted that the calculations presented in Table 2 are all for a constant track angle (φ=33 ), and, as will be discussed later, that the transverse wave strength is a strong function of the track angle. However, in a study of the experimentally obtained track angle for different mixtures, Strehlow and Biller [40] found a marked variation in the track angles present on a single foil but no detectable relationship between track angle and initial pressure mixture or dilution. Their study contributed to our decision to keep the track angle constant in our calculations. In general, we calculate that Ar-diluted mixtures have weaker transverse waves than N 2 -diluted mixtures which are weaker in turn than mixtures with CO 2 dilution for the same percent diluent. Hydrocarbons have stronger transverse 12
14 waves than H 2, with transverse wave strength increasing with carbon content for methane, ethylene, and propane. Strehlow [41] made a soot foil study of cellular regularity for various mixtures, and we find that the calculated transverse wave strength, (P 3 -P 2 )/P 2, can be related to the cellular regularity. Strehlow observed very regular cellular structure in Ar-diluted mixtures. The cellular regularity of 2H 2 -O 2 mixtures increased with increasing Ar dilution, while there was no apparent effect up to 50% N 2 dilution. The addition of CO 2 was found not to improve the regularity. Ethylene-oxygen soot foils were reported to be considerably more complex than hydrogen-oxygen foils. The structural regularity of CH 4-2O 2 and C 3 H 8-5O 2 mixtures was classified as poor. Although the variation in the calculated transverse wave strength for these mixtures is small (the normalized pressure jump varies from 0.33 to 0.40), the variation in cellular regularity observed in soot foil tracks is noticeable. Comparing Strehlow s results with the calculations in Table 2, it can be seen that cellular regularity decreases with increasing transverse wave strength. The reactivity of the transverse waves can be ordered by τ T /τ I, the ratio of the constant volume induction time for a particle passing through the incident wave and then immediately through the transverse wave, τ T, normalized by the induction time behind the incident wave, τ I. This parameter has a range 0 τ T /τ I 1. Values close to 0 correspond to a very short induction time behind the transverse wave, so that the transverse wave may be called reactive. Values close to 1 correspond to a relatively long induction time, meaning the transverse wave has a negligible effect on the reaction. For all the mixtures shown here, τ T /τ I is about 0.5. Our calculations of the induction time behind the transverse wave, τ T, show a short induction time in the case of 2H 2 -O 2-3Ar and a longer time in CH 4-2O 2. This trend agrees with the observations of Subbotin [8], who classified the transverse waves in 2H 2 -O 2-3Ar mixtures as reactive and the transverse waves in CH 4-2O 2-0.2Air as unreactive. As can be seen from the table, the mixtures considered in this study have transverse waves with a Mach number of about 1.3 and strength, defined as the normalized pressure jump across the wave, (P 3 P 2 )/P 2, of about (Since for an oblique wave only the normal component of the flow is affected, the normalized pressure jump is a better measure of the strength of the transverse waves than the M T.) Strehlow and Biller [40] found wave strengths ranging from 0.22 to 1.2 were possible, so the transverse waves in the present experiments are at the lower end of this range. Shock and detonation polar calculations are carried out to analyze the triple point configurations observed in the PLIF images. This technique has been used previously by several researchers [42 44,8]. The shock polar is calculated using the oblique shock jump relations and assumes a perfect gas, with the ratio of specific heats taken to be that of the reactants, γ 1. The detonation polar [45] is a locus of solutions possible for an oblique detonation which is overdriven at shock angles greater than that corresponding to the CJ wave. A 13
15 two-gamma model is used to model the variation in thermodynamic properties between the reactants and products. The analysis assumes the flow is quasisteady in the frame of the triple point and the waves are straight in the vicinity of the triple point, see Fig. 16. This assumption is more valid for a nonreactive flow than reactive, and a probable effect of the chemistry will be to produce some wave curvature in the vicinity of the triple point. The incident shock Mach number at each location was estimated from the calculated centerline pressure profile discussed in the previous section (Fig. 12a) and the incident flow angle was taken to be 57 (corresponding to a track angle, φ, of33 ). This value is representative of track angles recorded on soot foils mounted on the side walls of the test section. Given the incident wave Mach number and the track angle, the triple point configuration can be solved by matching the pressure and flow deflection angle, θ, across the slip stream. The shock and detonation polars are therefore conveniently displayed on a pressure-deflection (P -θ) plot. An example of such a calculation together with the resulting triple point configuration for a stoichiometric H 2 -O 2 mixture with 70% Ar dilution at 6.67 kpa initial pressure is shown in Fig. 17. Note that as there is no intersection of the detonation and transverse wave polars, there is no solution possible which involves a reactive Mach stem, i.e. the existence of an induction zone, however small, is crucial for obtaining a solution. For this and all other mixtures considered in this study, a solution consisting of a single triple point which involved the detonation polar for the leading wave was not possible; thus, the Mach stem is always modeled as non-reactive. In a study of an artificially-produced reactive Mach stem from interferograms obtained by White and Caby [46], Strehlow [47] concludes that a non-reactive triple point balance is appropriate in the region of the primary triple point. A single non-reactive slip stream balance for the 2H 2 -O 2-7Ar mixture at 6.67 kpa is compared to numerical schlieren images (Fig. 18) and found to be in reasonable agreement (to within the resolution of the calculation) close to the triple point. As can be seen from the figure, the greatest discrepancy is in the transverse wave angle away from the triple point; the transverse wave is calculated to be almost perpendicular to the incident wave by the local nonreactive analysis. However, the transverse wave will interact with the reaction zone behind the incident wave, curving the wave towards the cell centerline as it moves into a region with higher speed of sound. An alternative explanation is the existence of a second triple point, unresolved by the numerical simulation. The single triple point calculation does not preclude the existence of a more complex Mach reflection since a second triple point calculation does not affect the initial triple point solution, but the angle of the downstream portion of the transverse wave is likely to be affected by such a secondary triple point. An attempt was made to use shock and detonation polars to calculate a triple point configuration involving secondary triple points. Following the procedure 14
16 commonly used to calculate double Mach reflections, the calculation was first made in the frame of the first triple point as discussed previously, then a transformation was made to the coordinate system of the second triple point where a similar second triple point calculation can be made. To perform this shift, the Law-Glass [48] model was used. This model assumes the second triple point moves with the velocity induced in the flow behind the incident wave (region 2, see Fig. 16) in the laboratory frame. For all mixtures considered in the study, the flow in region 3 becomes subsonic under this transformation and a double triple point configuration is not possible. However, the Law- Glass model was conceived for unreactive flow over a wedge and its use here is certainly speculative, so the existence of a secondary triple point remains an open question. Single triple point configurations were calculated for the mixtures in the experiments: stoichiometric H 2 -O 2 with 80% Ar, with 85% Ar, and with 60% N 2 dilution, all at 20 kpa initial pressure. The calculated values for stoichiometric H 2 -O 2 with 70% Ar at 6.67 kpa is also shown for comparison. Results for one location in the cell are shown in Table 3. The Mach stem velocity, M Mn, shown above does not correspond to the calculated centerline Mach stem velocity (Fig. 12b), which implies the Mach stem is curved. Except immediately at the apex of the cell, the centerline velocity of the Mach stem is lower than that predicted by the local triple point analysis, indicating the wave is weaker away from the triple point. The induction distance is therefore greatest at the centerline and the Mach stem shock may have more curvature than is apparent in the PLIF images of the OH contour. The transverse wave strength and shock angle are very sensitive to changes in the track angle. From sooted foils mounted on the side wall of the test section, we observe cell-to-cell variations in the track angle of around ±3 for each mixture. The cell-to-cell variation results in a range of transverse wave strengths. In order to make qualitative comparisons of the triple point configurations in different mixtures, the track angle was held constant for the analysis shown above. A study of the influence of track angle is presented in Table 4 where the minimum, maximum, and average track angles measured from the side wall soot foils are used in calculating the triple point configuration. As can be seen from the table, changes in track angle have a significant effect on the transverse wave structure. It can also be noted that since the incident wave velocity does not change a great deal through the second half of the cell (Fig. 12b), changes in the strength and shock angle of the transverse wave through the cell may be attributed to variations in the track angle. An increase in track angle through the second half of the cell is evident in soot foil tracks of some detonations, particularly those with orthogonal structure [41]. As the transverse wave strength increases with increasing track angle, this is consistent with the evolution of the transverse wave structure observed 15
17 by some authors [7,49]. In general, more detailed information on all of these quantities: incident and Mach wave strength, triple point track angle, and wave curvature at the triple point will be required before sharper bounds on the triple point configuration can be obtained. Experimentally, this has been difficult to do because of the three-dimensional nature of the cellular structure. Numerically, few computations have been carried out with the spatial resolution or sufficiently realistic reaction mechanism in order to confidently obtain these properties. Constant volume explosion calculations were made to obtain OH mole fraction contours in the region of the triple point. A detailed chemical mechanism [50], previously validated against shock tube ignition delay data [28], was used. The constant volume calculations were carried out for flow along several particle paths through the calculated triple point configuration (see Fig. 19). A contour is drawn linking the locations along each path at which the OH mole fraction reaches a specified value representative of the end of the induction zone. Distance along the path is calculated by multiplying the time by the post-shock velocity. Particle path 1 passes directly through the Mach stem. The flow along particle paths 2-10 passes through the incident wave and is partially reacted before passing through the transverse wave. The transverse wave was assumed to remain straight with constant Mach number. Particle path 11 passes through only the incident wave before the OH mole fraction reaches the defined value. The dependance of the location of the rise in OH mole fraction, and therefore of the induction distance, on the varying shock strength in different parts of the front, results in the discontinuous keystone structure we see in the PLIF images. Fig. 19a shows the calculated OH mole fraction contour for a transverse wave strength of in 2H 2 -O 2-17Ar, initial pressure 20 kpa. Other mixtures considered in experiments have similar profiles. Varying the track angle has the most significant effect on the OH contour. Fig. 19b shows a calculated OH mole fraction contour in the same mixture for a significantly increased track angle, φ =40, corresponding to a transverse wave strength of These calculations show quantitative agreement with the PLIF images, although the location of the shock structure must be estimated, and with numerical simulations. Results show the transverse waves do not significantly accelerate the reaction, and the shear layers separate reacted and unreacted gas and form the keystones. 16
18 6.1 The role of transverse waves A key scientific question is: What is the role of the transverse waves in detonation propagation? Two extreme points of view are: (1) The transverse waves are simply manifestations of instability and do not play an essential role in the propagation mechanism. The main portion of the reaction is due to the leading shock waves and only a small fraction of the reactants pass through the transverse wave. (2) Transverse waves are essential to detonation propagation. The transverse waves and interactions of transverse waves provide high-temperature regions ( hot spots ) that serve as reaction centers. A substantial amount of the chemical reaction takes place behind the transverse waves or is associated with reaction centers. We have examined only one fuel-oxidizer combination and two diluents in the present study. For those mixtures, we observe behavior that is closer to the first point of view: the transverse waves play a nonessential role in detonation propagation. Mixtures with very different thermodynamic and kinetic parameters need to be examined to determine if the second type of behavior is possible. On the basis of experiments in porous wall tubes, Radulescu and Lee [51] have proposed that mixtures with high activation energies, associated with certain hydrocarbon fuels without inert gas dilution, are more representative of the second class of behavior. Further studies are in progress [52] in our laboratory to examine a wider range of mixtures and determine the chemical structure of the detonation front for those cases. The present study was restricted to mixtures with modest activation energy (see Table 1) but included mixtures with a range of cellular regularity. The highly argon-diluted mixtures are well known to have excellent regularity while the nitrogen-diluted mixtures are classified [53] as having fair regularity (see Fig. 9). It is important to note that our OH PLIF visualizations of these two mixtures do not show a dramatic difference in the structure of the front that would indicate a qualitative difference in the role of the transverse waves. We do see a more irregular structure of the OH front in the nitrogendiluted cases than in the argon-diluted cases, but we do not see any indication of pockets or inclusions of unburnt material behind the leading shock front. We conclude that the irregularity is simply due to the spontaneous generation and decay of triple points along the front, and the transverse waves play a similar role for both diluents. From our simple considerations about triple point structure, we find a modest decrease in the reaction time behind the transverse wave structures that are consistent with our present observations. The reaction time for the fluid 17
19 elements closest to the triple point will decrease about a factor of two due to the increase in temperature across the transverse wave. While this affects the details of the keystone shape, it does not seem appropriate to refer to the transverse waves as reactive in this case. However, it is clear that the possibility of reactive transverse waves has been demonstrated by computations and experiments in marginal propagation situations. Further studies are needed with other mixtures to determine if reactive transverse waves have a role in ordinary (near CJ) detonations. 7 Conclusions Experimental observations have been made of the reaction zone structure in propagating detonations. H 2 -O 2 -diluent mixtures representative of regular and irregular cell structures were studied. PLIF images reveal distinctive keystone features associated with the triple points. Differences in cellular structure regularity are seen in the different mixtures, with N 2 -diluted mixtures sometimes exhibiting features that may be attributed to three-dimensional effects. The local structure of the triple point is analysed by an unreactive shock polar calculation, revealing that keystone features are due to a discontinuity in reactivity across the shear layer. From this analysis and from the images themselves, we conclude that transverse waves have little influence on the reaction in the case of the Ar-diluted mixtures. Previous numerical work has suggested that in the case of mixtures with lowamplitude transverse waves, pockets of unreacted gas may be formed if the transverse waves do not consume the unreacted gas behind the incident wave during triple point collision. A region of unreacted gas becomes isolated from the front and may persist a cell length downstream. In all images obtained, no detached pockets of gas are seen within the field of view of the measurement. Our study has examined a limited range of mixtures and initial conditions. Other triple point configurations, reactive transverse waves, and unreacted pockets may be possible for different mixtures with a wider range of chemical and thermodynamic properties. Experiments are in progress to examine these situations. 8 Acknowledgements The development of the detonation facility and imaging experiments has occupied several generations of students and technicians who have worked in the 18
20 Explosion Dynamics Laboratory at Caltech over the last decade. We thank R. Akbar, M. J. Kaneshige, E. Schultz, and P. Svitek for their invaluable contributions. The simulations were carried out with J. J. Quirk s Amrita computational system. Portions of this work were supported by the ONR and the DOE. References [1] D.R. White, Turbulent structure of gaseous detonation, Phys. Fluids 4 (4) (1961) [2] Y.N. Denisov, Y.K. Troshin, Pulsating and spinning detonation of gaseous mixtures in tubes, Dokl. Akad. Nauk. 125 (1959) [3] K.I. Shchelkin, Y.K. Troshin, Gasdynamics of Combustion, 1964, English Translation NASA-TT-F-23. [4] B.B. Voitsekhovskii, V.V. Mitrofanov, M.Ye. Topchian, Struktura fronta detonastii i gaza, Akad. Nauk., SSSR, Novosibirsk Translation: The structure of a detonation front in gases Rep. FTD-MT , Foreign Technology Division, Wright-Patterson A.F.B., Ohio, (1966). [5] T. Nagaishi, K. Yoneda, T. Hikita, On the structure of detonation waves in gases, Combust. Flame 16 (1) (1971) [6] D.H. Edwards, G. Hooper, R.J. Meddins, Instabilities in the reaction zones of detonation waves, Astronaut. Acta 17 (4-5) (1972) [7] R.A. Strehlow, A.J. Crooker, The structure of marginal detonation waves, Acta Astronaut. 1 (3-4) (1974) [8] V.A. Subbotin, 2 kinds of transverse wave structures in multifront detonation, Combust. Explo. Shock 11 (1) (1975) [9] R. Takai, K. Yoneda, T. Hikita, Study of detonation wave structure, Fifthteenth Symposium (International) on Combustion, The Combustion Institute, Pittsburgh, 1974, pp [10] M. Dormal, J.C. Libouton, P.J. Van Tiggelen, Evolution of induction time in detonation cells, Acta Astronaut. 6 (7-8) (1979) [11] P. Andresen, W. Reckers, H.G. Wagner, E.K. Dabora, H. Voges, The structure of gaseous detonations as revealed by laser-induced fluorescence of the OHradical, Z. Phys. Chem. Neue Folge 175 (1992) [12] T.J. Anderson, E.K. Dabora, Measurements of normal detonation wave structure using Rayleigh scattering, Twentyfourth Symposium (International) on Combustion, The Combustion Institute, Pittsburgh, 1992, pp
21 [13] C. Gerlach, Laseroptische unersuchung der wechselwirkung von turbulenz und reaktionskinetik in turbulent reagierenden strömungen, Diplomarbeit, Technische Universität München, Munich, Germany (December 1996). [14] A. Eder, Brennerverhalten schnallnaher und überschall-schneller wasserstoffluft flammen, Ph.D. thesis, Technische Universität München, Munich, Germany (January 2001). [15] A. C. Eckbreth, Laser Diagnostics for Combustion Temperature and Species, Abacus Press, Cambridge, MA, [16] K. Toshimitsu, A. Matsuo, M.R. Kamel, C.I. Morris, R.K. Hanson, Numerical simulations and planar laser-induced fluorescence imaging results of hypersonic reactive flows, J. Propul. Power 16 (1) (2000) [17] C.I. Morris, M.R. Kamel, R.K. Hanson, Shock-induced combustion in highspeed wedge flows, Twentyseventh Symposium (International) on Combustion, The Combustion Institute, Pittsburgh, 1998, pp [18] B.K. McMillan, M. Lee, P.H. Paul, R.K. Hanson, Planar laser-induced fluorescence of shock-induced ignition, Twentythird Symposium (International) on Combustion, The Combustion Institute, Pittsburgh, 1990, pp [19] R. Akbar, Mach reflection of gaseous detonations, Ph.D. thesis, Rensselaer Polytechnic Institute, Troy, New York (August 1997). [20] M.J. Kaneshige, Gaseous detonation initiation and stabilization by hypervelocity projectiles, Ph.D. thesis, California Institute of Technology, Pasadena, California (January 1999). [21] F. Pintgen, Laser-optical visualization of detonation structures, Diplomarbeit, Lehrstuhl für Thermodynamik: Technische Universität München / Graduate Aeronautical Laboratories: California Institute of Technology, Munich, Germany (December 2000). [22] J. Luque, D.R. Crosley, LIFBASE Database and Spectral Simulation Program (Version 1.5), Tech. Rep. MP , SRI International, (1999). [23] M. Dyer, D.R. Crosley, Two-dimensional imaging of OH laser-induced fluorescence in a flame, Opt. Lett. 7 (8) (1982) [24] P.H. Paul, A model for temperature-dependent collisional quenching of OH A 2 Σ +, J. Quant. Spectros. Ra. 51 (1994) [25] J.M. Seitzman, R.K. Hanson, Comparison of excitation techniques for quantitative fluorescence imaging of reacting flows, AIAA J. 31 (3) (1993) [26] J.H.S. Lee, Dynamic structure of gaseous detonation, in: Fluid Mechanics and its Applications V. 5 Dynamic structure of detonation in gaseous and dispersed media, Kluwer Academic Publishers, Netherlands, 1991, p
22 [27] W.C. Reynolds, The element potential for chemical equilibrium analysis: implementation in the interactive program STANJAN, Tech. Rep. A-3991, Dept. of Mechanical Engineering, Stanford University, Stanford, CA (January 1986). [28] E. Schultz, J.E. Shepherd, Validation of detailed reaction mechanisms for detonation simulation, Tech. Rep. FM99-5, Graduate Aeronautical Laboratories: California Institute of Technology (2000). [29] A.A. Konnov, Detailed reaction mechanism for small hydrocarbon combustion. release 4.0, akonnov. [30] C.A. Eckett, Numerical and analytical studies of the dynamics of gaseous detonations, Ph.D. thesis, California Institute of Technology, Pasadena, California (September 2000). [31] E.S. Oran, J.W. Weber, Jr., E.I. Stefaniw, M.H. Lefebvre, J.D. Anderson, Jr., A numerical study of a two-dimensional H 2 O 2 Ar detonation using a detailed chemical reaction model, Combust. Flame 113 (1998) [32] E.A. Lundstrom, A.K. Oppenheim, On the influence of non-steadiness on the thickness of the detonation wave, Proc. Roy. Soc. A 310 (1969) [33] V.N. Gamezo, D. Desbordes, Formation and evolution of two-dimensional cellular detonations, Combust. Flame 116 (1-2) (1999) [34] C.A. Eckett, J.J. Quirk, J.E. Shepherd, The role of unsteadiness in direct initiation of gaseous detonation, J. Fluid Mech. 421 (2000) [35] E.S. Oran, T. Young, J. Boris, J. Picone, D.H. Edwards, A study of detonation structure: The formation of unreacted gas pockets, Nineteenth Symposium (International) on Combustion, The Combustion Institute, Pittsburgh, 1982, pp [36] V.N. Gamezo, D. Desbordes, E.S. Oran, Two-dimensional reactive flow dynamics in cellular detonation waves, Shock Waves 9 (1999) [37] G.J. Sharpe, Transverse waves in numerical simulations of cellular detonations, J. Fluid Mech. 447 (2001) [38] G.L. Schott, Observations of the structure of spinning detonation, Phys. Fluids 8 (5) (1965) [39] Z. Huang, M.H. Lefebvre, P.J. Van Tiggelen, Experiments on spinning detonations with detailed analysis of the shock structure, Shock Waves 10 (2) (2000) [40] R.A. Strehlow, J.R. Biller, On the strength of transverse waves in gaseous detonations, Combust. Flame 13 (6) (1969) [41] R.A. Strehlow, The nature of transverse waves in detonations, Astronaut. Acta 14 (5) (1969)
23 [42] A.K. Oppenheim, J.J. Smolen, L.J. Zajac, Vector polar method for the analysis of wave intersections, Combust. Flame 12 (1) (1968) [43] P.A. Urtiew, Reflections of wave intersections in marginal detonations., Astronaut. Acta 15 (1970) [44] H.O. Barthel, Reaction zone-shock front coupling in detonations, Phys. Fluids 15 (1) (1972) [45] J. E. Shepherd, Detonation waves and propulsion, In: Combustion in High- Speed flows, Kluwer Academic Publishers, 1994, pp [46] D.R. White, K.H. Caby, Structure of gaseous detonation. II Generation of laminar detonation, Phys. Fluids 6 (5) (1963) [47] R.A. Strehlow, Reactive gas mach stems, Phys. Fluids 7 (6) (1964) [48] C.K. Law, I.I. Glass, Diffraction of strong shock waves by a sharp compressive corner, C.A.S.I. Transactions 4 (1) (1971) [49] M.H. Lefebvre, E.S. Oran, Analysis of the shock structures in a regular detonation, Shock Waves 4 (5) (1995) [50] J. Warnatz, V. Karbach, C2 mechanism for methane-air combustion, [51] M.I. Radulescu, J.H.S. Lee, The Failure Mechanism of Gaseous Detonations: Experiments in Porous Wall Tubes, Combust. Flame 131 (1-2) (2002) [52] F. Pintgen, J.M. Austin, J.E. Shepherd, Detonation Front Structure: Variety and Characterization. In: Advances in Confined Detonations, Ed. by G.D. Roy, S.M. Frolov, R.J. Santoro, S.A. Tsyganov, Torus Press, Moscow, 2002, pp [53] J.C. Libouton, A. Jacques, P.J. Van Tiggelen, Cinétique, structure et entretien des ondes de détonation, Actes du Colloque International Berthelot-Vieille- Mallard-Le Chatelier 2 (1981) , Bordeaux. 22
24 Table Captions Table 1: Mixture parameters for the mixtures considered in this study, calculated with STANJAN [27]. P 1 is the initial pressure. γ 1 is the ratio of specific heats of the reactants that was used in calculating the shock polars with the perfect gas assumption. The induction zone length, σ, is defined by the point of maximum heat release; E a /RT vn is the non-dimensional activation energy, calculated as in [28]. Both these parameters are calculated using a detailed chemical mechanism [29]. a :cell widths measured in test section. Table 2: Mixture parameters and transverse wave strengths for some sample mixtures, calculated in the vicinity of a primary triple point. All calculations are for mixtures at 20 kpa. The incident wave Mach number is kept constant at M CJ. The transverse wave strength is not a strong function of initial pressure until the detonation becomes marginal. Activation energy and induction time calculations use the detailed chemical mechanism of Konnov [29], previously validated against shock tube ignition delay data [28]. Table 3: Triple point configuration at x x o = 0.7L, (U/U CJ =0.94), with φ =33. Table 4: Triple point configuration with varying track angle for 2H 2 -O 2-12Ar at 20 kpa initial pressure. Triple point values are the minimum, maximum and average value observed on a soot foil for this mixture. The incident wave Mach number is kept constant at M CJ. 23
25 Table 1 Composition P 1 γ 1 U CJ T vn P vn ρ vn σ E a /RT vn λ (kpa) (m/s) (K) (MPa) (kg/m 3 ) (mm) (mm) 2H 2 -O 2-7Ar ±8 2H 2 -O 2-12Ar ±5 2H 2 -O 2-17Ar ±11 2H 2 -O 2-20Ar ±19 2H 2 -O 2-4.5N ±13 2H 2 -O 2-5.6N ±13 a 24
26 Table 2 Mixture C pvn c 1 M T (P 3 P 2 )/P 2 E a /RT vn τ T τ T /τ I kj/kg-k m/s µs 2H 2 -O H 2 -O 2-3Ar H 2 -O 2-12Ar H 2 -O 2-3N H 2 -O 2 -CO CH 4-2O C 2 H 4-3O C 3 H 8-5O
27 Table 3 2H 2 -O 2-70% Ar 80% Ar 85% Ar 60% N 2 65% N 2 M In θ (P 3 -P 2 )/P M T β θ β M Mn
28 Table 4 φ θ 2 (P 3 -P 2 )/P 2 β 3 θ 3 β 4 M T
29 Figure Captions Figure 1: a) Schematic of the detonation tube with attached cookie-cutter and test section. b) Schematic of the experimental set up for simultaneous use of schlieren and PLIF techniques. In experiments where only PLIF images were acquired, the camera is placed exactly perpendicular to the light sheet. The flow transitions from the round tube to the square test section with optical access. In experiments without flow visualization, soot foils can be mounted both on the square end wall of the test section and on the side wall. Figure 2: Images of OH fluorescence behind detonation fronts in stoichiometric hydrogen oxygen mixture diluted with 80% argon, initial pressure 20 kpa. Figure 3: Images of OH fluorescence behind detonation fronts in stoichiometric hydrogen oxygen mixture diluted with 85% argon, initial pressure 20 kpa. Figure 4: Images of OH fluorescence behind detonation fronts in stoichiometric hydrogen oxygen mixture diluted with 60% (shot 1426) or 65% (shots 1427 and 1428) nitrogen, initial pressure 20 kpa. Figure 5: OH number density and temperature ZND profiles for a CJ detonation in 2H 2 -O 2-17Ar at 20 kpa initial pressure. The solid line corresponds to OH number density, the dashed line to the temperature profile. Figure 6: Two soot foils (150x150 mm) obtained from the end wall of the test section in separate shots, both are 2H 2 -O 2-12Ar at 20 kpa. Note that the transverse wave families are not necessarily orthogonal to each other or to the test section walls. Figure 7: Schematic illustration of possible three-dimensional effects due to non-orthogonal intersection of the transverse wave systems and the laser light sheet. Figure 8: Simultaneous schlieren and OH fluorescence images behind detonation fronts in stoichiometric hydrogen oxygen mixture diluted with 85% argon (shots 1432 and 1433) and 87% argon (shot 1434), initial pressure 20 kpa. (a) Overlay of PLIF and schlieren images (b) schlieren (c) PLIF. Figure 9: Soot foils obtained in a 280 mm diameter detonation tube for 2H 2 - O 2-12Ar (a) and 2H 2 -O 2-4.5N 2 (b), both at 20 kpa initial pressure. Flow is top to bottom. The scale shown corresponds to 50 mm. The Ar-diluted mixture 28
30 is an example of regular cell structure, while the N 2 -diluted mixture has more irregular cell structure. Figure 10: Results of two-dimensional numerical simulation of Chapman-Jouguet detonation in a 60 mm wide channel: a) Numerical schlieren b) OH mass fraction distribution. The mixture is stoichiometric hydrogen oxygen diluted with 70% argon, initial pressure 6.67 kpa. Figure 11: (a) Close-up of OH mass fraction contours shown in Fig. 10. (b) Close up of schlieren image of density field. (c) Schematic of detonation front features. Figure 12: (a) Pressure behind the leading shock wave along the centerline of a detonation cell from the simulations of Fig. 10. These results were obtained by interrogation of the pressure field in the fully developed regime (see Fig in Eckett [30]). (b) The Mach number of the leading shock front along the centerline of the detonation cells for the simulations of Fig. 10. Velocities were obtained by differentiation of the smoothed wave trajectories obtained by interrogating the solution field in the fully developed regime (see Fig in Eckett [30].) Figure 13: Time scales in detonation cell for simulations of Fig. 10. The shock decay times were obtained by numerical differentiation of smooth data shown in Fig. 12b. The induction times are calculated from ZND simulations based on the instantaneous values of the leading shock velocity. The critical decay time concept is discussed in Eckett et al. [34]. Figure 14: Detail from shot 1417, 2H 2 -O 2-17Ar at 20 kpa, showing a new Mach stem formed after a triple point collision. No unreacted pockets are evident. Figure 15: Cartoon to illustrate the nomenclature associated with the triple point. Two triple points are shown: a primary triple point at the intersection of the Mach stem and incident wave, and a secondary triple point downstream of the main front. The flow downstream of the second triple point is shown here as unreactive, but some authors describe a reaction zone closely coupled to the portion of the transverse wave downstream of the second triple point, the so-called strong triple point configuration. A weak configuration generally omits the second triple point. Figure 16: Wave angles for shock polar calculation. Figure 17: Shock and detonation polar calculations for stoichiometric hydrogen oxygen mixture diluted with 70% argon, initial pressure 6.67 kpa, x x o = 29
31 0.91L, φ=33. Figure 18: Triple point polar calculation from Fig. 17 superimposed on numerical schlieren for x x o = 0.91L, in stoichiometric hydrogen oxygen diluted with 70% argon, initial pressure 6.67 kpa. Figure 19: Prediction of the keystone region shape for stoichiometric hydrogen oxygen with 85% argon dilution for φ = 33 (a) and φ = 40 (b). These predictions are based on the idealized model of the triple point configuration discussed in the text and estimates of the OH mole fraction using simple zero and one-dimensional reaction zone models. The transverse wave was assumed to remain straight with constant Mach number. The edge of the reaction zone is defined as the location of the contour χ OH = The choice of OH contour χ OH =0.005 is arbitrary, but as the OH rise is exponential, the features remain qualitatively the same irrespective of which value is chosen. 30
 Fig. 1. one column images F. Pintgen, C.A. Eckett, J.M. Austin and J.E. Shepherd 31")
32 high voltage electrodes instrument ports cookie cutter test section window support (a) parallel light beam for schlieren technique test section flow direction cylindrical lens dye laser beam spherical lens light sheet quartz window filter schlieren image ICCD camera for PLIF image (b) Fig. 1. one column images F. Pintgen, C.A. Eckett, J.M. Austin and J.E. Shepherd 31


33 Shot 1411 Shot 1415 Shot 1416 Fig. 2. two column image F. Pintgen, C.A. Eckett, J.M. Austin and J.E. Shepherd 32


34 Shot 1419 Shot 1420 Shot 1417 Fig. 3. two column image F. Pintgen, C.A. Eckett, J.M. Austin and J.E. Shepherd 33


35 Shot 1426 Shot 1427 Shot 1428 Fig. 4. two column image F. Pintgen, C.A. Eckett, J.M. Austin and J.E. Shepherd 34
36 n OH (mol/m 3 ) Temperature (K) Distance from shock front (cm) Fig. 5. one column image F. Pintgen, C.A. Eckett, J.M. Austin and J.E. Shepherd 35


37 Fig. 6. two column image F. Pintgen, C.A. Eckett, J.M. Austin and J.E. Shepherd 36
38 transverse waves side view (PLIF image) side view (PLIF image) flow direction flow direction light sheet Fig. 7. one column image F. Pintgen, C.A. Eckett, J.M. Austin and J.E. Shepherd 37

 (b)")


39 Shot 1432 Shot 1433 Shot 1434 (a) (b) (c) Fig. 8. two column images F. Pintgen, C.A. Eckett, J.M. Austin and J.E. Shepherd 38


40 (a) (b) Fig. 9. two column image F. Pintgen, C.A. Eckett, J.M. Austin and J.E. Shepherd 39


41 (a) (b) Fig. 10. two column image F. Pintgen, C.A. Eckett, J.M. Austin and J.E. Shepherd 40
")

42 shear layers triple point tracks transverse waves induction zone λ (a) (b) (c) Fig. 11. two column image F. Pintgen, C.A. Eckett, J.M. Austin and J.E. Shepherd 41
43 P/P M S (X-X 0 )/L (a) P/P M S (X-X 0 )/L (b) Fig. 12. one column images F. Pintgen, C.A. Eckett, J.M. Austin and J.E. Shepherd 42
44 Shock decay time Critical decay time Induction time t (µs) U S /U CJ Fig. 13. one column image F. Pintgen, C.A. Eckett, J.M. Austin and J.E. Shepherd 43

45 Fig. 14. one column image F. Pintgen, C.A. Eckett, J.M. Austin and J.E. Shepherd 44
Detonation Front Structure: Variety and Characterization
 Detonation Front Structure: Variety and Characterization F. Pintgen, J.M. Austin, and J.E. Shepherd Graduate Aeronautical Laboratories, California Institute of Technology Pasadena, California 91125 Abstract
Application of a Laser Induced Fluorescence Model to the Numerical Simulation of Detonation Waves in Hydrogen-Oxygen-Diluent Mixtures
 Supplemental material for paper published in the International J of Hydrogen Energy, Vol. 30, 6044-6060, 2014. http://dx.doi.org/10.1016/j.ijhydene.2014.01.182 Application of a Laser Induced Fluorescence
The role of diffusion at shear layers in irregular detonations
 The role of diffusion at shear layers in irregular detonations Marco Arienti 1 Joseph E. Shepherd 2 1 United Technologies Research Center, 411 Silver Lane, East Hartford, CT 06108 2 California Institute
Detonation initiation by hypervelocity projectiles
 Detonation initiation 1 Detonation initiation by hypervelocity projectiles J. Bélanger, M.Kaneshige,J.E.Shepherd California Institute of Technology Pasadena, CA 91125 USA Abstract: We report experimental
Modulation Instability of Spatially-Incoherent Light Beams and Pattern Formation in Incoherent Wave Systems
 Modulation Instability of Spatially-Incoherent Light Beams and Pattern Formation in Incoherent Wave Systems Detlef Kip, (1,2) Marin Soljacic, (1,3) Mordechai Segev, (1,4) Evgenia Eugenieva, (5) and Demetrios
Report Documentation Page
 Report Documentation Page Form Approved OMB No. 0704-0188 Public reporting burden for the collection of information is estimated to average 1 hour per response, including the time for reviewing instructions,
Shock Wave Boundary Layer Interaction from Reflecting Detonations
 Shock Wave Boundary Layer Interaction from Reflecting Detonations J. Damazo 1, J. Ziegler 1, J. Karnesky 2, and J. E. Shepherd 1 1 Introduction The present work is concerned with the differences in how
Thermo-Kinetic Model of Burning for Polymeric Materials
 Thermo-Kinetic Model of Burning for Polymeric Materials Stanislav I. Stoliarov a, Sean Crowley b, Richard Lyon b a University of Maryland, Fire Protection Engineering, College Park, MD 20742 b FAA W. J.
The evolution and cellular structure of a detonation subsequent to a head-on interaction with a shock wave
 Combustion and Flame 151 (2007) 573 580 www.elsevier.com/locate/combustflame The evolution and cellular structure of a detonation subsequent to a head-on interaction with a shock wave Barbara B. Botros
Dynamics of Droplet-Droplet and Droplet-Film Collision. C. K. Law Princeton University
 Dynamics of Droplet-Droplet and Droplet-Film Collision C. K. Law Princeton University The physical phenomena of droplet-droplet and droplet-film collision in the head-on orientation were studied experimentally
APPLICATION OF SPONTANEOUS RAMAN SCATTERING TO THE FLOWFIELD IN A SCRAMJET COMBUSTOR T. Sander and T. Sattelmayer Lehrstuhl für Thermodynamik,
 APPLICATION OF SPONTANEOUS RAMAN SCATTERING TO THE FLOWFIELD IN A SCRAMJET COMBUSTOR T. Sander and T. Sattelmayer Lehrstuhl für Thermodynamik, TU-München, D-85747, Garching, Germany Introduction The weight
HIGH-POWER SOLID-STATE LASER: LETHALITY TESTING AND MODELING
 HIGH-POWER SOLID-STATE LASER: LETHALITY TESTING AND MODELING R. P. Abbott, C. D. Boley, S. N. Fochs, L. A. Nattrass, J. M. Parker, A. M. Rubenchik, J. A. Smith, and R. M. Yamamoto* University of California
SENSORS FOR MEASURING THE VOLUME SCATTERING FUNCTION OF OCEANIC WATERS
 SENSORS FOR MEASURING THE VOLUME SCATTERING FUNCTION OF OCEANIC WATERS Robert A. Maffione Hydro-Optics, Biology, and Instrumentation Laboratories 55 Penny Lane, Suite 104 Watsonville, CA 95076 Phone: (408)
Cellular structure of detonation wave in hydrogen-methane-air mixtures
 Open Access Journal Journal of Power Technologies 91 (3) (2011) 130 135 journal homepage:papers.itc.pw.edu.pl Cellular structure of detonation wave in hydrogen-methane-air mixtures Rafał Porowski, Andrzej
REGENERATION OF SPENT ADSORBENTS USING ADVANCED OXIDATION (PREPRINT)
") AL/EQ-TP-1993-0307 REGENERATION OF SPENT ADSORBENTS USING ADVANCED OXIDATION (PREPRINT) John T. Mourand, John C. Crittenden, David W. Hand, David L. Perram, Sawang Notthakun Department of Chemical Engineering
AL/EQ-TP-1993-0307 REGENERATION OF SPENT ADSORBENTS USING ADVANCED OXIDATION (PREPRINT) John T. Mourand, John C. Crittenden, David W. Hand, David L. Perram, Sawang Notthakun Department of Chemical Engineering
Report Documentation Page
 Report Documentation Page Form Approved OMB No. 0704-0188 Public reporting burden for the collection of information is estimated to average 1 hour per response, including the time for reviewing instructions,
Unidirectional Propagation of Gas Detonations in Channels with Sawtooth Walls
 Naval Research Laboratory Washington, DC 20375-5320 NRL/MR/6404--10-9255 Unidirectional Propagation of Gas Detonations in Channels with Sawtooth Walls Vadim N. Gamezo Elaine S. Oran Center for Reactive
Mass Transport by Second Mode Internal Solitary Waves
 DISTRIBUTION STATEMENT A. Approved for public release; distribution is unlimited. Mass Transport by Second Mode Internal Solitary Waves Alan Brandt, PI Johns Hopkins Univ. Applied Physics Laboratory Laurel,
Closed-form and Numerical Reverberation and Propagation: Inclusion of Convergence Effects
 DISTRIBUTION STATEMENT A. Approved for public release; distribution is unlimited. Closed-form and Numerical Reverberation and Propagation: Inclusion of Convergence Effects Chris Harrison Centre for Marine
Detonation Diffraction in Gases
 Detonation Diffraction in Gases F. Pintgen 1 J.E. Shepherd California Institute of Technology, Pasadena, California 91125, USA Abstract We have experimentally investigated detonation diffraction out of
Estimation of Vertical Distributions of Water Vapor from Spaceborne Observations of Scattered Sunlight
 Estimation of Vertical Distributions of Water Vapor from Spaceborne Observations of Scattered Sunlight Dale P. Winebrenner Applied Physics Laboratory, Box 355640 University of Washington Seattle, WA 98195
Mine Burial Studies with a Large Oscillating Water-Sediment Tunnel (LOWST)
") Mine Burial Studies with a Large Oscillating Water-Sediment Tunnel (LOWST) Marcelo H. Garcia Department of Civil and Environmental Engineering University of Illinois at Urbana-Champaign 205 North Mathews
Mine Burial Studies with a Large Oscillating Water-Sediment Tunnel (LOWST) Marcelo H. Garcia Department of Civil and Environmental Engineering University of Illinois at Urbana-Champaign 205 North Mathews
Ocean Acoustics Turbulence Study
 Ocean Acoustics Turbulence Study PI John Oeschger Coastal Systems Station 6703 West Highway 98 Panama City, FL 32407 phone: (850) 230-7054 fax: (850) 234-4886 email: OeschgerJW@ncsc.navy.mil CO-PI Louis
DSMC Calculation of Vortex Shedding behind a Flat Plate with a New Intermolecular Collision Scheme
 DSMC Calculation of Vortex Shedding behind a Flat Plate with a New Intermolecular Collision Scheme M. Usami and K. Mizuguchi Dept. of Mechanical Eng., Mie University, 1515 Kamihama-cho, Tsu 514-8507, Japan
7. PERFORMING ORGANIZATION NAME(S) AND ADDRESS(ES) 8. PERFORMING ORGANIZATION REPORT NUMBER
 AND ADDRESS(ES) 8. PERFORMING ORGANIZATION REPORT NUMBER") REPORT DOCUMENTATION PAGE Form Approved OMB No. 0704-0188 The public reporting burden for this collection of information is estimated to average 1 hour per response, including the time for reviewing instructions,
REPORT DOCUMENTATION PAGE Form Approved OMB No. 0704-0188 The public reporting burden for this collection of information is estimated to average 1 hour per response, including the time for reviewing instructions,
Density Field Measurement by Digital Laser Speckle Photography
 Density Field Measurement by Digital Laser Speckle Photography by M. Kawahashi and H. Hirahara Saitama University Department of Mechanical Engineering Shimo-Okubo 255, Urawa, Saitama, 338-8570, Japan ABSTRACT
INFRARED SPECTRAL MEASUREMENTS OF SHUTTLE ENGINE FIRINGS
 INFRARED SPECTRAL MEASUREMENTS OF SHUTTLE ENGINE FIRINGS AMOS 2005 TECHNICAL CONFERENCE WORKSHOP 5 September, 2005 Maui, Hawaii M. Venner AFRL, Edwards AFB, CA M. Braunstein, L. Bernstein Spectral Sciences,
Effect of Filter Choice on OH* Chemiluminescence Kinetics at Low and Elevated Pressures
 7 th US National Technical Meeting of the Combustion Institute Hosted by the Georgia Institute of Technology, Atlanta, GA March 20-23, 2011 Effect of Filter Choice on OH* Chemiluminescence Kinetics at
Erik L. Swanberg 1 and Steven G. Hoffert 2. Veridian Systems 1, Autometric 2. Sponsored by Defense Threat Reduction Agency
 USING ATMOSPHERIC 137 CS MEASUREMENTS AND HYSPLIT TO CONFIRM CHERNOBYL AS A SOURCE OF 137 CS IN EUROPE Erik L. Swanberg 1 and Steven G. Hoffert 2 Veridian Systems 1, Autometric 2 Sponsored by Defense Threat
ELECTRON BEAM AND PULSED CORONA PROCESSING OF VOLATILE ORGANIC COMPOUNDS AND NITROGEN OXIDES
 ELECTRON BEAM AND PULSED CORONA PROCESSING OF VOLATILE ORGANIC COMPOUNDS AND NITROGEN OXIDES B. M. Penetrante, M. C. Hsiao, J. N. Bardsley, B. T. Merritt, G. E. Vogtlin and P. H. Wallman Lawrence Livermore
EFFECTS OF LOCAL METEOROLOGICAL VARIABILITY ON SURFACE AND SUBSURFACE SEISMIC-ACOUSTIC SIGNALS
 EFFECTS OF LOCAL METEOROLOGICAL VARIABILITY ON SURFACE AND SUBSURFACE SEISMIC-ACOUSTIC SIGNALS Jason R. McKenna and Mihan H. McKenna U.S. Army Engineer Research & Development Center, Vicksburg, MS 39180
Determining the Stratification of Exchange Flows in Sea Straits
 Determining the Stratification of Exchange Flows in Sea Straits Lawrence J. Pratt Physical Oceanography Department, MS #21 Woods Hole Oceanographic Institution, Woods Hole, MA 02543 phone: (508) 289-2540
SW06 Shallow Water Acoustics Experiment Data Analysis
 DISTRIBUTION STATEMENT A: Approved for public release; distribution is unlimited. SW06 Shallow Water Acoustics Experiment Data Analysis James F. Lynch MS #12, Woods Hole Oceanographic Institution Woods
Scattering of Internal Gravity Waves at Finite Topography
 Scattering of Internal Gravity Waves at Finite Topography Peter Muller University of Hawaii Department of Oceanography 1000 Pope Road, MSB 429 Honolulu, HI 96822 phone: (808)956-8081 fax: (808)956-9164
Coupled Ocean-Atmosphere Modeling of the Coastal Zone
 Coupled Ocean-Atmosphere Modeling of the Coastal Zone Eric D. Skyllingstad College of Oceanic and Atmospheric Sciences, Oregon State University 14 Ocean Admin. Bldg., Corvallis, OR 97331 Phone: (541) 737-5697
Near limit behavior of the detonation velocity
 Near limit behavior of the detonation velocity John H.S. Lee 1, Anne Jesuthasan 1 and Hoi Dick Ng 2 1 McGill University Department of Mechanical Engineering Montreal, QC, Canada 2 Concordia University
Nonlinear Internal Waves: Test of the Inverted Echo Sounder
 Nonlinear Internal Waves: Test of the Inverted Echo Sounder David M. Farmer Graduate School of Oceanography (educational) University of Rhode Island Narragansett, RI 02882 Phone: (401) 874-6222 fax (401)
Modeling the Impact of Extreme Events on Margin Sedimentation
 Modeling the Impact of Extreme Events on Margin Sedimentation Jasim Imran Department of Civil and Environmental Engineering, University of South Carolina, 3 Main Street, Columbia, SC 2928. phone: (83)
Answers to questions on exam in laser-based combustion diagnostics on March 10, 2006
 Answers to questions on exam in laser-based combustion diagnostics on March 10, 2006 1. Examples of advantages and disadvantages with laser-based combustion diagnostic techniques: + Nonintrusive + High
Super-Parameterization of Boundary Layer Roll Vortices in Tropical Cyclone Models
 DISTRIBUTION STATEMENT A. Approved for public release; distribution is unlimited. Super-Parameterization of Boundary Layer Roll Vortices in Tropical Cyclone Models PI Isaac Ginis Graduate School of Oceanography
Modeling of Coastal Ocean Flow Fields
 Modeling of Coastal Ocean Flow Fields John S. Allen College of Oceanic and Atmospheric Sciences Oregon State University 104 Ocean Admin Building Corvallis, OR 97331-5503 phone: (541) 737-2928 fax: (541)
EVALUATION OF HYDROGEN, PROPANE AND METHANE-AIR DETONATIONS INSTABILITY AND DETONABILITY
 EVALUATION OF HYDROGEN, PROPANE AND METHANE-AIR DETONATIONS INSTABILITY AND DETONABILITY Borzou, B. 1 and Radulescu, M.I. 2 1 Mechanical Engineering Department, University of Ottawa, 161 Louis Pasteur,
Analysis Comparison between CFD and FEA of an Idealized Concept V- Hull Floor Configuration in Two Dimensions. Dr. Bijan Khatib-Shahidi & Rob E.
 Concept V- Hull Floor Configuration in Two Dimensions Dr. Bijan Khatib-Shahidi & Rob E. Smith 10 November 2010 : Dist A. Approved for public release Report Documentation Page Form Approved OMB No. 0704-0188
Polarization-Dependent Measurements of Light Scattering in Sea Ice
 Polarization-Dependent Measurements of Light Scattering in Sea Ice Arlon. J. Hunt Environmental Energy Technologies Division, Lawrence Berkeley National Laboratory 1 Cyclotron Rd., Berkeley, CA 94720 phone:
Improvements in Modeling Radiant Emission from the Interaction Between Spacecraft Emanations and the Residual Atmosphere in LEO
 Improvements in Modeling Radiant Emission from the Interaction Between Spacecraft Emanations and the Residual Atmosphere in LEO William L. Dimpfl Space Science Applications Laboratory The Aerospace Corporation
Final Report for AOARD grant FA Measurement of the third-order nonlinear susceptibility of graphene and its derivatives
 Final Report for AOARD grant FA2386-12-1-4095 Measurement of the third-order nonlinear susceptibility of graphene and its derivatives Principal investigator: A/Prof. Tang Dingyuan Division of Microelectronics
Super-Parameterization of Boundary Layer Roll Vortices in Tropical Cyclone Models
 DISTRIBUTION STATEMENT A. Approved for public release; distribution is unlimited. Super-Parameterization of Boundary Layer Roll Vortices in Tropical Cyclone Models PI Isaac Ginis Graduate School of Oceanography
Award # N LONG TERM GOALS
 Non-Invasive Characterization Of Small-Scale Patterns Of Benthic Biogenic Structure By Ultrasound: Infaunal Dynamics And Sediment Structure, And Effect Of Sediment Disturbance Donald G. Webb Graduate School
Hurricane Wave Topography and Directional Wave Spectra in Near Real-Time
 Hurricane Wave Topography and Directional Wave Spectra in Near Real-Time Edward J. Walsh NASA/Goddard Space Flight Center, Code 972 Wallops Flight Facility, Wallops Island, VA 23337 phone: (303) 497-6357
Detonation Front Structure and the Competition for Radicals
 Detonation Front Structure and the Competition for Radicals Z. Liang, S. Browne, R. Deiterding, and J. E. Shepherd California Institute of Technology, Pasadena, CA 9112 USA Abstract We examine the role
Reverse Ion Acceleration by Laser-Matter Interaction
 Reverse Ion Acceleration by Laser-Matter Interaction Peter Messmer*, Peter H. Stoltz, Chet Nieter Tech-X Corporation, Boulder, CO 80303 Jean-Luc Cambier AFRL/PRSA, Edwards AFB, CA 93524 * messmer@txcorp.com
Triple Point Collision and Origin of Unburned Gas Pockets in Irregular Detonations
 Triple Point Collision and Origin of Unburned Gas Pockets in Irregular Detonations Yasser Mahmoudi 1*, Kiumars Mazaheri 1 Department of Engineering, University of Cambridge, CB 1PZ Cambridge, United Kingdom
Direct Numerical Simulation of Aeolian Tones
 THE 5 TH ASIAN COMPUTAITIONAL FLUID DYNAMICS BUSAN, KOREA, OCTOBER 27-30, 2003 Direct Numerical Simulation of Aeolian Tones Osamu Inoue 1 1. Institute of Fluid Science, Tohoku University,2-1-1 Katahira,
System Reliability Simulation and Optimization by Component Reliability Allocation
 System Reliability Simulation and Optimization by Component Reliability Allocation Zissimos P. Mourelatos Professor and Head Mechanical Engineering Department Oakland University Rochester MI 48309 Report
Visualization of high-speed gas jets and their airblast sprays of cross-injected liquid
 Short communications Experiments in Fluids 27 (1999) 102 106 Springer-Verlag 1999 Visualization of high-speed gas jets and their airblast sprays of cross-injected liquid K. D. Kihm, T. K. Kim, S. Y. Son
An analytical model for direct initiation of gaseous detonations
 Issw21 An analytical model for direct initiation of gaseous detonations C.A. Eckett, J.J. Quirk, J.E. Shepherd Graduate Aeronautical Laboratories, California Institute of Technology, Pasadena CA 91125,
FRACTAL CONCEPTS AND THE ANALYSIS OF ATMOSPHERIC PROCESSES
 1 FRACTAL CONCEPTS AND THE ANALYSIS OF ATMOSPHERIC PROCESSES Robert L. Street Environmental Fluid Mechanics Laboratory Department of Civil Engineering Stanford University Stanford, CA 94305-4020 650-723-4969;
REPORT DOCUMENTATION PAGE
 REPORT DOCUMENTATION PAGE Form Approved OMB No. 0704-0188 Public reporting burden for this collection of information is estimated to average 1 hour per response, including the time for reviewing instructions,
Advanced Numerical Methods for NWP Models
 Advanced Numerical Methods for NWP Models Melinda S. Peng Naval Research Laboratory Monterey, CA 93943-552 Phone: (831) 656-474 fax: (831) 656-4769 e-mail: melinda.peng@nrlmry.navy.mil Award #: N148WX2194
Shallow Water Fluctuations and Communications
 Shallow Water Fluctuations and Communications H.C. Song Marine Physical Laboratory Scripps Institution of oceanography La Jolla, CA 92093-0238 phone: (858) 534-0954 fax: (858) 534-7641 email: hcsong@mpl.ucsd.edu
Use of Wijsman's Theorem for the Ratio of Maximal Invariant Densities in Signal Detection Applications
 Use of Wijsman's Theorem for the Ratio of Maximal Invariant Densities in Signal Detection Applications Joseph R. Gabriel Naval Undersea Warfare Center Newport, Rl 02841 Steven M. Kay University of Rhode
Detection of Submerged Sound Sources
 Detection of Submerged Sound Sources Barry J. Uscinski Department of Applied Mathematics and Theoretical Physics, Centre for Mathematical Sciences, University of Cambridge, Wilberforce Rd., Cambridge,
Development and Application of Acoustic Metamaterials with Locally Resonant Microstructures
 Development and Application of Acoustic Metamaterials with Locally Resonant Microstructures AFOSR grant #FA9550-10-1-0061 Program manager: Dr. Les Lee PI: C.T. Sun Purdue University West Lafayette, Indiana
Generation and Propagation of Internal Solitary Waves on the Continental Shelf and Slope
 Generation and Propagation of Internal Solitary Waves on the Continental Shelf and Slope Roger H.J. Grimshaw Department of Mathematical Sciences Loughborough University Loughborough, LE11 3TU, UK phone:
The Navy Precision Optical Interferometer for SSA applications: an update
 The Navy Precision Optical Interferometer for SSA applications: an update Sergio R. Restaino, Naval Research Laboratory, Remote Sensing Division J.R. Andrews, J.T. Armstrong, E. Baines, J.C. Clark and
DISTRIBUTION STATEMENT A. Approved for public release; distribution is unlimited.
 DISTRIBUTION STATEMENT A. Approved for public release; distribution is unlimited. The Probabilistic Nature of Extended-Range Predictions of Tropical Cyclone Activity and Tracks as a Factor in Forecasts
DETONATION HAZARD CLASSIFICATION BASED ON THE CRITICAL ORIFICE PLATE DIAMETER FOR DETONATION PROPAGATION
 DETONATION HAZARD CLASSIFICATION BASED ON THE CRITICAL ORIFICE PLATE DIAMETER FOR DETONATION PROPAGATION by Mitchell Cross A thesis submitted to the Department of Mechanical and Materials Engineering In
Wavelet Spectral Finite Elements for Wave Propagation in Composite Plates
 Wavelet Spectral Finite Elements for Wave Propagation in Composite Plates Award no: AOARD-0904022 Submitted to Dr Kumar JATA Program Manager, Thermal Sciences Directorate of Aerospace, Chemistry and Materials
INTERACTION AND REMOTE SENSING OF SURFACE WAVES AND TURBULENCE
 INTERACTION AND REMOTE SENSING OF SURFACE WAVES AND TURBULENCE W. Kendall Melville Scripps Institution of Oceanography University of California, San Diego La Jolla, CA 9293-23 phone: (69) 534-478, fax:
Detonation Cell Width Measurements for H 2 N 2 O N 2 O 2 CH 4 NH 3 Mixtures
 Detonation Cell Width Measurements for H 2 N 2 O N 2 O 2 CH 4 NH 3 Mixtures U. Pfahl, E. Schultz and J. E. Shepherd Graduate Aeronautical Laboratories California Institute of Technology Pasadena, CA 925
Swash Zone Dynamics: Modeling and Data Analysis
 Swash Zone Dynamics: Modeling and Data Analysis Donald N. Slinn Department of Civil and Coastal Engineering University of Florida Gainesville, FL 32611-6590 phone: (352) 392-1436 x 1431 fax: (352) 392-3466
DETONATION DIFFRACTION THROUGH AN ABRUPT AREA EXPANSION. Thesis by. Eric Schultz. In Partial Fulfillment of the Requirements.
 DETONATION DIFFRACTION THROUGH AN ABRUPT AREA EXPANSION Thesis by Eric Schultz In Partial Fulfillment of the Requirements for the Degree of Doctor of Philosophy California Institute of Technology Pasadena,
Marginal Sea - Open Ocean Exchange
 Marginal Sea - Open Ocean Exchange Michael A. Spall Mail Stop 21 Department of Physical Oceanography Woods Hole Oceanographic Institution Woods Hole, MA 02543-1541 phone: (508) 289-3342 fax: (508) 457-2181
Initiation of stabilized detonations by projectiles
 Initiation of stabilized detonations by projectiles P. Hung and J. E. Shepherd, Graduate Aeronautical Laboratory, California Institute of Technology, Pasadena, CA 91125 USA Abstract. A high-speed projectile
Lecture 8 Laminar Diffusion Flames: Diffusion Flamelet Theory
 Lecture 8 Laminar Diffusion Flames: Diffusion Flamelet Theory 8.-1 Systems, where fuel and oxidizer enter separately into the combustion chamber. Mixing takes place by convection and diffusion. Only where
Rogue Wave Statistics and Dynamics Using Large-Scale Direct Simulations
 Rogue Wave Statistics and Dynamics Using Large-Scale Direct Simulations Dick K.P. Yue Center for Ocean Engineering Department of Mechanical Engineering Massachusetts Institute of Technology Cambridge,
REPORT DOCUMENTATION PAGE. Theoretical Study on Nano-Catalyst Burn Rate. Yoshiyuki Kawazoe (Tohoku Univ) N/A AOARD UNIT APO AP
 N/A AOARD UNIT APO AP") REPORT DOCUMENTATION PAGE Form Approved OMB No. 0704-0188 The public reporting burden for this collection of information is estimated to average 1 hour per response, including the time for reviewing instructions,
REPORT DOCUMENTATION PAGE Form Approved OMB No. 0704-0188 The public reporting burden for this collection of information is estimated to average 1 hour per response, including the time for reviewing instructions,
Experimental and Theoretical Studies of Ice-Albedo Feedback Processes in the Arctic Basin
 LONG TERM GOALS Experimental and Theoretical Studies of Ice-Albedo Feedback Processes in the Arctic Basin D.K. Perovich J.A. Richter-Menge W.B. Tucker III M. Sturm U. S. Army Cold Regions Research and
Z-scan Measurement of Upconversion in Er:YAG
 Proceedings of the 13 th Annual Directed Energy Symposium (Bethesda, MD) Dec. 2010 Z-scan Measurement of Upconversion in Er:YAG Jeffrey O. White, Thomas A. Mercier, Jr., John E. McElhenny Army Research
Detonation in Gases. J.E. Shepherd. Aeronautics and Mechanical Engineering California Institute of Technology, Pasadena, California 91125, USA
 Detonation in Gases J.E. Shepherd Aeronautics and Mechanical Engineering California Institute of Technology, Pasadena, California 9115, USA Abstract We review recent progress in gaseous detonation experiment,
Vortex Rossby Waves and Hurricane Evolution in the Presence of Convection and Potential Vorticity and Hurricane Motion
 LONG-TERM GOALS/OBJECTIVES Vortex Rossby Waves and Hurricane Evolution in the Presence of Convection and Potential Vorticity and Hurricane Motion Michael T. Montgomery Department of Atmospheric Science
Thermoacoustic Instabilities Research
 Chapter 3 Thermoacoustic Instabilities Research In this chapter, relevant literature survey of thermoacoustic instabilities research is included. An introduction to the phenomena of thermoacoustic instability
Analysis of South China Sea Shelf and Basin Acoustic Transmission Data
 DISTRIBUTION STATEMENT A: Approved for public release; distribution is unlimited. Analysis of South China Sea Shelf and Basin Acoustic Transmission Data Ching-Sang Chiu Department of Oceanography Naval
Near-Surface Cusp Confinement of Micro-Scale Plasma, Richard Wirz
 Motivation Motivation / Objectives Ring cusp discharges provide highly efficient plasma thrusters Development of an efficient microdischarge (~ cm) large delta-v missions using small spacecraft formation
Testing Turbulence Closure Models Against Oceanic Turbulence Measurements
 Testing Turbulence Closure Models Against Oceanic Turbulence Measurements J. H. Trowbridge Woods Hole Oceanographic Institution Woods Hole, MA 02543 phone: 508-289-2296 fax: 508-457-2194 e-mail: jtrowbridge@whoi.edu
LISA: THE LASER INTERFEROMETER SPACE ANTENNA
 LISA: THE LASER INTERFEROMETER SPACE ANTENNA Masimo Tinto Jet Propulsion Laboratory, California Institute of Technology Abstract The Laser Interferometer Space Antenna (LISA) is a deep-space mission, jointly
Lecture 7 Detonation Waves
 Lecture 7 etonation Waves p strong detonation weak detonation weak deflagration strong deflagration / 0 v =/ University of Illinois at Urbana- Champaign eflagrations produce heat Thermal di usivity th
Long-Range Underwater Sound Propagation: Environmental Variability, Signal Stability and Signal Coherence
 DISTRIBUTION STATEMENT A. Approved for public release; distribution is unlimited. Long-Range Underwater Sound Propagation: Environmental Variability, Signal Stability and Signal Coherence Michael G. Brown
Coastal Mixing and Optics
 Coastal Mixing and Optics W. Scott Pegau College of Oceanic and Atmospheric Sciences Ocean. Admin. Bldg. 104 Oregon State University Corvallis, OR 97331-5503 Phone: (541) 737-5229 fax: (541) 737-2064 email:
Contract No. N C0123
 Particle Size Distribution and Optical Volume Scattering Function in the Mid and Upper Water Column of Optically Deep Coastal Regions: Transport from the Bottom Boundary Layer Y. C. Agrawal Sequoia Scientific,
An Examination of 3D Environmental Variability on Broadband Acoustic Propagation Near the Mid-Atlantic Bight
 An Examination of 3D Environmental Variability on Broadband Acoustic Propagation Near the Mid-Atlantic Bight Kevin B. Smith Code PH/Sk, Department of Physics Naval Postgraduate School Monterey, CA 93943
Experimental and Theoretical Studies of Ice-Albedo Feedback Processes in the Arctic Basin
 LONG TERM GOALS Experimental and Theoretical Studies of Ice-Albedo Feedback Processes in the Arctic Basin D.K. Perovich J.A. Richter-Menge W.B. Tucker III M. Sturm U. S. Army Cold Regions Research and
Detailed and Simplified Chemical Reaction Mechanisms for Detonation Simulation
 Paper 05F- - Presented at the Fall 2005 Western States Section of the Combustion Institute, Stanford University, Oct. 17-1, 2005 Detailed and Simplified Chemical Reaction Mechanisms for Detonation Simulation
Analysis of Infrared Measurements of Microbreaking and Whitecaps
 Analysis of Infrared Measurements of Microbreaking and Whitecaps Andrew T. Jessup Applied Physics Laboratory, University of Washington 1013 NE 40th St. Seattle, WA 98105-6698 phone (206) 685-2609 fax (206)
REPORT DOCUMENTATION PAGE
 REPORT DOCUMENTATION PAGE Form Approved OMB No. 0704-0188 Public reporting burden for this collection of information is estimated to average 1 hour per response, including the time for reviewing instructions,
INFRARED SPECTROSCOPY OF HYDROGEN CYANIDE IN SOLID PARAHYDROGEN (BRIEFING CHARTS)
") AFRL-MN-EG-TP-2006-7403 INFRARED SPECTROSCOPY OF HYDROGEN CYANIDE IN SOLID PARAHYDROGEN (BRIEFING CHARTS) C. Michael Lindsay, National Research Council, Post Doctoral Research Associate Mario E. Fajardo
AFRL-MN-EG-TP-2006-7403 INFRARED SPECTROSCOPY OF HYDROGEN CYANIDE IN SOLID PARAHYDROGEN (BRIEFING CHARTS) C. Michael Lindsay, National Research Council, Post Doctoral Research Associate Mario E. Fajardo
Estimation of Vertical Distributions of Water Vapor and Aerosols from Spaceborne Observations of Scattered Sunlight
 Estimation of Vertical Distributions of Water Vapor and Aerosols from Spaceborne Observations of Scattered Sunlight Dale P. Winebrenner Polar Science Center/Applied Physics Laboratory University of Washington
Space- and Time-Resolved Interferometry of Plasma-Filled Rod-Pinch Diodes
 Space- and Time-Resolved Interferometry of Plasma-Filled Rod-Pinch Diodes David M. Ponce, David Phipps, David D. Hinshelwood, and B. V. Weber Plasma Physics Division, Naval Research Laboratory Washington,
High-Fidelity Computational Simulation of Nonlinear Fluid- Structure Interaction Problems
 Aerodynamic Issues of Unmanned Air Vehicles Fluid-Structure Interaction High-Fidelity Computational Simulation of Nonlinear Fluid- Structure Interaction Problems Raymond E. Gordnier Computational Sciences