Dynamic Microfiltration- Critical Flux and Macromolecular Transmission
|
|
|
- Silvia Gabriella Barton
- 5 years ago
- Views:
Transcription
1 Dynamic Microfiltration- Critical Flux and Macromolecular Transmission Søren Prip Beier Ph.D. Thesis 2008
2 Dynamic Microfiltration Critical Flux and Macromolecular Transmission Søren Prip Beier Ph.D. Thesis 2008
3 Copyright : Søren Prip Beier 2008 Address: Department of Chemical and Biochemical Engineering Søltofts Plads, Building 229 Technical University of Denmark DK-2800 Kgs. Lyngby Denmark Telephone: Fax: kt@kt.dtu.dk Internet: Print: J&R Frydenberg A/S København ISBN:
4
5
6
7
8
9 = = = = μ = = σ ( )
10

11
12
13 = Δ μ
14 = = α =
15 Δ = η = + +

16 μ
17 ( ) + μ = μ + μ μ μ Δ Δπ = η π =
18 π = π = >
19 = δ = = + = = = δ =
20 = =
21 = ν ν = = = ( ) = = ( )
22
23
24 μ
25 γ γ μ

26 μ μ
27

28 ( ) ( ) + +
29
30
31
32
33
34
35 ω = ν ω ν ( ) =

36
37

38
39 ν ( γ = ) γ = ( γ )

40
41
42 ω ν ( γ = ω ν ) ( γ ) =

43

44
45 = ( )

46


47
48 = ( ρ ω )
49 μ
50 = ( γ )
51 ν ( γ = ν )
52 ( γ ) = ( ) =
53
54
55
56
57 μ
58 μ
59 = = + = + +
60
61 μ
62 = + ( ξ ) + ( τ ) ξ ξ ξτ τ
63 μ μ μ μ

64
65 α () = α = () = = ( + α ) = = β β β = χ + Δ χ β
66

67
68 = π μ = μ
69 μ ω ω π ( π μ ) = ( π μ ) = ω
70 = φ π μ φ φ = + ( ) = ν δ = = φ π μ φ π μ ν δ μ
71 δ ( ) = ν δ δ = = = ν ν = = < < < = ν = ω = ν ν = ν < < ν <
72 ( ) ( ) = = = = ν μ π φ ν ν ν μ π φ ν μ π φ ν δ ν δ ν μ π φ ( ) = ρ ρ π ρ ρ μ = = = = π π ρ

73
74 = θ + θ + θ = ( ) θ + θ ) θ ( ) θ = φ θ + ν = ( ) + ( ) = φ θ ν θ θ θ θ
75 μ
76 = ρ γ = η = γ
77 φ φ = γ φ φ φ = γ φ φ φ ξξ φ φ φ = γ φ φ ξ
78 φ = γ φ ( + ) = γ φ μ = δ δ
79 δ μ μ μμ δ μ = = = δ δ μ
80 = = = δ δ φ μ π π ( ) φ = = = = φ ( ) = π = π = =
81
82 γ φ γ
83 γ φ = + α γ φ α
84 θ
85
86
87
88
89
90
91
92
93
94
95
96
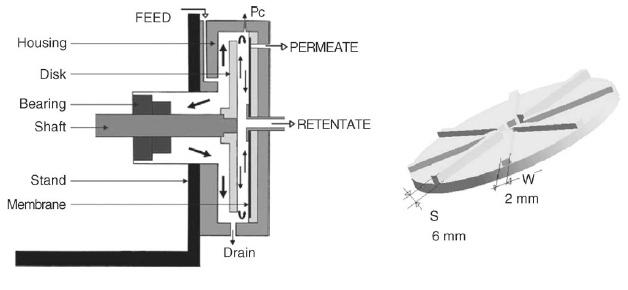
97 Journal of Membrane Science 281 (2006) Dynamic microfiltration with a vibrating hollow fiber membrane module: Filtration of yeast suspensions Søren Prip Beier, Maria Guerra, Arvid Garde, Gunnar Jonsson CAPEC, Department of Chemical Engineering, Technical University of Denmark, DK-2800 Kgs. Lyngby, Denmark Received 9 December 2005; received in revised form 28 March 2006; accepted 31 March 2006 Available online 18 April 2006 Abstract A novel dynamic microfiltration system consisting of a vibrating hollow fiber membrane module is presented. The vibrations induce the shear rate at the membrane surface which makes it possible to filtrate at low feed cross-flow velocity and thus at a low transmembrane pressure. Results from test filtrations of bakers yeast suspensions are presented and the critical flux concept is used to evaluate the filtration data. The critical flux at the maximum degree of vibration is improved 325% compared to the critical flux at the minimum degree of vibration. An equation to calculate the membrane surface shear rate from the vibration frequency and amplitude is presented. The correlation between the critical flux and average surface shear rate is J p,crit = 8.22( γ s) It is further shown that when operating below the critical flux in a 4.5 h test filtration the permeability is kept constant. Above the critical flux, the transmembrane pressure increases resulting in a decrease in membrane permeability Elsevier B.V. All rights reserved. Keywords: Vibrating dynamic microfiltration; Shear-enhanced filtration; Critical flux; Surface shear rate; Hollow fibers 1. Introduction In microfiltration of colloids and macromolecules, the flux often drops to a level much below the level of the clean water flux due to severe membrane fouling. The fouling layer can be reduced by increasing the shear rate at the membrane surface so that deposition of colloids and macromolecules is reduced or avoided. Enhancing the surface shear rate can be done in different ways. One possibility is to let the feed stream pass along the surface at high cross-flow velocity which results in a high surface shear rate. By doing this, the permeate also has to pass along the membrane in the same direction and at the same velocity as the feed stream on the other side of the membrane. This is necessary to keep the transmembrane pressure (TMP) low, because a high TMP results in a faster and more compact fouling layer [1]. Guerra et al. [2] have shown that above a TMP value of around Pa (0.3 bar) the flux decreased as the TMP was increased in the microfiltration of skim milk. This emphasizes the importance of keeping the TMP low. The high cross-flow velocity technique is used by Alfa-Laval to remove Corresponding author. Tel.: ; fax: address: gj@kt.dtu.dk (G. Jonsson). bacterial spores from skim milk [3], but one problem with this method is that the overall pumping costs become very high. High membrane shear rate can also be achieved by creating a relative motion between the membrane and the feed stream. This can be done by vibrations or rotations of the membrane, which makes it possible to decouple high feed cross-flow velocity and high surface shear rate. Thus, filtrations can be carried out at low feed cross-flow velocity (and thus low TMP) and with a high surface shear rate. Pall Corporation has developed a vibrating membrane filter (VMF) based on this technique. The membrane stack is vibrated by a torsion bar, and such a system is installed at Tuborg Brewery in Fredericia (Denmark) to remove surplus yeast from beer. Postlethwaite et al. [4] have tested a commercial Pall VMF system for the removal of proteins from a feed of high biomass loading, and Jaffrin et al. [5] have worked with a similar system called the vibrating shearenhanced processing (VSEP) system for filtration of bakers yeast suspensions. Another way of decoupling high feed flow velocity and high surface shear rate is to let an object rotate at high speed close to the membrane surface. The rotations then induce high surface shear rate. Bouzerar et al. [6] have concentrated industrial effluents on a rotating disk system, and Jaffrin et al. [5] have filtrated bakers yeast suspensions also with a rotating disk system /$ see front matter 2006 Elsevier B.V. All rights reserved. doi: /j.memsci
98 282 S.P. Beier et al. / Journal of Membrane Science 281 (2006) High frequency back flushing [7] is another way to avoid severe membrane fouling. Here, the shear at the membrane surface itself is not so high but due to the destabilization of the fouling layer a steady-state concentration profile is never reached. A similar phenomenon might be observed for the vibrating membrane systems. In general dynamic microfiltration systems seem efficient in the recovery of macromolecules from fermentation broths [6]. In this work, a novel dynamic microfiltration system is presented. The membrane, which consists of hollow fibers placed parallel in a module, is vibrated up and down at variable frequency and amplitude, which creates the shear rate at the membrane surface. Thus, it is possible to filtrate at very low feed cross-flow velocity and with a very low TMP. Results from test filtrations of bakers yeast suspensions are presented, and the critical flux concept formulated by Field et al. [1] is used to evaluate the results. The results are compared to results from filtration tests conducted with a similar system described by Genkin et al. [8]. The test fluid is selected because it is reproducible and has been extensively reported in the literature. The average shear rate on the membrane surface is calculated, and it is investigated how the critical flux varies with the average membrane surface shear rate. The permeability of the membrane below and above the critical flux is also evaluated and discussed in a long-term operation condition. 2. Theory 2.1. Calculation of surface shear rate The membrane module consists of hollow fibers placed parallel vertically in a plastic cylinder. The feed stream is led to the vibrating module on the outside of the membrane fibers. The shear rate at the surfaces of the fibers is defined as the derivative of the velocity component along the membrane surface with respect to the length perpendicular to the membrane surface: γ s = dv z (1) dy The coordinate system is orientated so that the z-axis is in the same direction as the feed flow along the fibers and the y-axis is perpendicular to the membrane surface with y = 0 at the surface. The x-axis is a tangent to the surface perpendicular to the z- and y-axis. Very close to the surface, the surface is almost plane and therefore it makes sense to use Cartesian coordinates, which will simplify the equations. The velocity component in the z- direction therefore corresponds to the velocity at an oscillating plate, which is given by Bird et al. [9]: v z (y, t) = v 0 e ( ) ω (ω/2ν)y cos ωt 2ν y (2) The angular frequency ω (equals 2 π f) is proportional to the vibration frequency, and the velocity amplitude v 0 (equals amp ω) is the product of the vibration amplitude and the angular frequency. Using this equation for the velocity in the direction along the fibers at a given time and distance from the fiber one has Fig. 1. Fluid velocities at different distances from the membrane surface at low frequency (10 Hz) and small amplitude (0.2 mm) calculated by using Eq. (2). to assume, that the velocity in the z-direction is zero at infinite y-distance from the fibers according to the boundary conditions given by Bird et al. [9]. This implies that the motion of one fiber does not influence the velocity of the fluid surrounding the neighboring fiber. At first this could seem unrealistic since the distance between the fibers is in the range of 1 mm, but by looking at the velocity profile calculated using Eq. (2) (in Fig. 1) one can see that at a distance of just 0.5 mm from the surface, the velocity is decreased to a level where it is a good approximation to state, that the motion of the fibers does not influence the flow pattern of the neighboring fiber. This tendency will be even more pronounced at higher vibration frequencies and amplitudes. With the velocity component in the z-direction, the shear rate can be found as the derivative of the velocity with respect to the distance y as stated in Eq. (1): γ = dv z ω dy = v 0 2ν e (ω/2ν)y [ sin ( ωt ω 2ν y ) ( )] ω cos ωt 2ν y The shear rate at the membrane surface is found by setting y =0: ω γ s = v 0 [sin(ωt) cos(ωt)] (4) 2ν This is the expression for the shear rate at the membrane surface as a function of time (t), angular frequency (ω =2 π f) and velocity amplitude (v 0 = amp ω). A time mean average of the numerical value of the oscillating shear rate is used as a value for the surface shear rate for a given combination of vibration frequency and amplitude: 1000 i=0 γ s = γ s(t = i/1000) (5) 1000 In this equation, the numerical value of the shear rate (from Eq. (4)) at times from t = 0 to 1 s at intervals of 1/1000 s are summarized and divided by 1000 to get a time mean average of the shear rate. (3)
99 S.P. Beier et al. / Journal of Membrane Science 281 (2006) Critical flux concept The critical flux concept was used to evaluate the filtration performance. The critical flux hypothesis for microfiltration is that on start-up there exists a flux below which a decline of flux with time does not occur; above it fouling is observed. This flux is the critical flux and its value depends on the hydrodynamics and probably other variables [1]. This critical flux concept implies that it is possible to maintain a constant flux and constant TMP as long as the constant flux is kept below the critical flux because no severe membrane fouling at this stage occurs. The critical flux is determined experimentally at different levels of vibration frequency and amplitude as described in Section Material and methods 3.1. Experimental apparatus A sketch of the experimental apparatus is shown in Fig. 2. The membrane module with a total membrane area of 256 cm 2 is composed of 12 cm long hollow fibers, fixed in parallel between a steel plate in the bottom of the module and a permeate gap in the top. The fibers are closed in the bottom ends with silicon glue and are open in the top into the permeate gap. To prevent breakage caused by the vibrations a flexible sealing consisting of silicone tubes where placed as a transition between the fiber ends and the steel plate in the bottom and the entrance into the permeate gap in the top. The hollow fibers supplied by X-Flow were made of polyethersulfone (PES) with the skin layer on the outer surface and a nominal pore size of 0.45 m. The steel plate in the bottom and the permeate gap were fixed to a hollow steel rod, which was extended through the top of the cylindrical acrylic module vessel to connect with a rotation head fixed to an electro motor. Rotation of the rotation head hereby induced perpendicular movement of the membrane module, which was kept in contact with the rotation head by a strong spring. Three different rotation heads were used which corresponded to three levels of vibration amplitudes; 0.2, 0.7 and mm (the peak-to-peak amplitude is twice as big). By changing the rotation speed of the rotation head, the frequency of the vibrations could be adjusted between 0 and 30 Hz. A cavity for positioning the steel rod was placed in the bottom of the module vessel to direct the vibrations of the module in the vertical direction. The upper ends of the fibers were open into a permeate gap connected through the hollow rod to a progressing cavity pump (Seepex M120-0, Seeberger, Germany). This permeate pump sucked permeate through the hollow fibers via the permeate gap and the hollow rod to the beaker placed on the electronic scale. Transmembrane pressure was measured as the differences between permeate and module headspace pressure using a pressure transducer (RS , RS-components, USA) linked to the PC. With this pressure transducer it was possible to detect variation in the transmembrane pressure in the order of a few 10 5 mpa (mbars). Mass flow of permeate was measured and collected on a scale (Mettler PJ3000, Switzerland) connected to the PC. Feed solution was circulated from the feed tank via a gear pump (Micropump F5734, USA) to the intake at the bottom of the module vessel and then returned to the feed tank from the top of the module vessel Yeast suspensions Bakers yeast suspensions were used as filtration fluids. The motive for choosing this media is the widespread use of bak- Fig. 2. Schematic drawing of the experimental apparatus.
 Critical flux (L/(m 2 h)) Flux improvement (%) Y1 5 0.2 16 0 22 Y2 30 0.2 36 125 330 Y3 5 1.175 29 81 132 Y4 30 1.175 68 325 1936 Y5 5 0.7 29 81 78 Y6 30 0.7 50 213 1154 Y7 17.5 0.2 42 163 147 Y8 17.")
100 284 S.P. Beier et al. / Journal of Membrane Science 281 (2006) Table 1 Critical fluxes obtained for different amplitudes and frequencies Experiment number Freq. (Hz) Amp. (mm) Critical flux (L/(m 2 h)) Flux improvement (%) Y Y Y Y Y Y Y Y Y Y Y Experiment Y9 is repeated in experiment Y10 and Y11. Corresponding avg. surface shear rate in the last column. Time mean avg. surface shear rate (1/s) using Eq. (5) ers yeast in the biotechnology industry, its easy availability and the large amount of studies done with the microfiltration of this media. Yeast cell suspensions with dry weight 5 g/l were prepared by using commercially available wet cake bakers yeast (Malteserkors Gær, Danisco, Denmark) suspended in 1 mm phosphate buffer and 1 g/l of bacteriological peptone. The average dry weight content of the wet yeast is 27% with small variations (±1%) Experimental procedure The vibration frequency and amplitude determines the average surface shear rate. These two parameters were investigated at three levels each. The experimental plan consisted of 11 filtrations with different combinations of amplitude (three levels) and frequencies (three levels) in random order according to Table 1. Between each filtration the clean water flux was 100% recovered by cleaning the membrane with a base solution of 1% (Divos 124 from Scan Diversey) and a 0.1% solution of hydrogen peroxide. In order to find the critical flux the permeate flux was controlled in steps according to a computer program. The step height is approximately 4 L/(h m 2 ) and the step length is 3 min. The flux is increased two steps for 3 min and then reduced one step for 3 min, which is sketched in Fig. 3. The step height and step length is easily changed in the software program code. This procedure was repeated throughout the filtration. The transmembrane pressure and permeate flux was logged every 0.5 s. The critical flux (J p,crit ) was identified as the maximum permeate flux where P/t was less than mpa/step (2 mbar/step) and TMP was recovered when returning to the last tested permeate flux (one step back). This procedure is similar to a procedure, described by Espinasse et al. [10], to determine critical fluxes in ultrafiltration except that Espinasse keeps the pressure constant and measures the corresponding flux. A 4.5 h test filtration was also conducted to test the long-term performance of the system when operating below the critical flux. The test filtration was conducted with another membrane module consisting of 54 hollow fibers with a total membrane area of 488 cm 2. The fibers were made of PES with a minimum and maximum pore size of 0.36 and 0.5 m. The frequency and amplitude was set to 25 Hz and 0.7 mm, and the feed cross-flow velocity was adjusted to 0.91 cm/s. In all experiments, the fluid level in the feed tank was kept constant by continually filling up with water. 4. Results and discussion As described earlier, 11 filtrations were carried out at different degrees of vibration frequency and amplitude. In each experiment, the flux was increased stepwise as sketched in Fig. 3. In Fig. 4, the flux and TMP as a function of time is shown for experiment Y4 at 30 Hz and mm amplitude. It was not possible to go beyond 30 Hz and mm amplitude because Fig. 3. Sketch of the computer controlled flux as a function of time. Fig. 4. The stepwise flux increase and corresponding TMP as a function of time for experiment Y4. Frequency=30Hz and amplitude=1.175mm. Yeast concentration = 5 g/l.
 and TMP is recovered when returning to the last tested permeate flux (one step back).")
101 S.P. Beier et al. / Journal of Membrane Science 281 (2006) of the mechanical limitations of the system. Increased degree of vibration would have broken the apparatus. The critical flux is identified as the maximum permeate flux where P/t is less than mpa/step (2 mbar/step) and TMP is recovered when returning to the last tested permeate flux (one step back). For experiment Y4, the critical flux is 68 L/(m 2 h). As seen in Fig. 4, the TMP is very low. The step height used in these experiments is approximately 4 L/(m 2 h), which of course yield an uncertainty in the determined critical fluxes. The critical flux will never be estimated too high, but there is a possibility of under predicting the critical flux by 4 L/(m 2 h). These uncertainties can be reduced by lowering the step height in future experiments. The kinematic viscosity used to calculate the shear rate is set to 10 6 m 2 /s, which equals the kinematic viscosity of pure water at 25 C. The calculated average surface shear rate Eq. (5) for each filtration is shown in Table 1 together with the measured critical flux values. In Fig. 5, the critical fluxes are depicted as a function of the average surface shear rate in a log log graph. The effect of the shear rate is clearly seen as the critical flux is increased 325% when going from the minimum frequency and amplitude to the maximum (see Table 1). Each point in Fig. 5 is associated with an error bar of +4 L/(m 2 h) to indicate the possibility of under predicting the critical fluxes (these error bars are hardly seen at the larger values because of the logarithmic scale). In comparison data from filtrations of 5 g/l bakers yeast suspensions done with a similar system [8] is show as well. A power function is chosen to describe the critical flux as a function of the average surface shear rate. This is done because such a function describes most of the variation in the measured critical fluxes. The r 2 -value is around 0.88 which means, that the expression J p,crit = 8.22( γ s ) 0.26 (6) explains 88% of the variation in the measured critical fluxes. It has to be noted, that the parameters 8.22 and 0.26 are associated with uncertainties because of the used step height as discussed earlier, and that the standard deviation of the correlation is 5.2 L/(m 2 h). The standard deviation is calculated as the square root of the mean square error based on the 11 measured critical fluxes [11]. This relatively high standard deviation is due to the earlier mentioned uncertainties in determining the critical flux because of the relatively high step height, and because of the relatively few data points. Another explanation for some of the uncertainties is that even though the membrane module is directed in the vertical direction by the cavity in the bottom of the module cylinder, small movements of the fibers in the y-direction perpendicular to the fiber direction was observed. These small oscillations in the y-direction are neglected in the calculation of the surface shear rate as they would complicate the derivation of the equation for the velocity field in the z-direction Eq. (2). The oscillation in the y-direction might influence the value of the surface shear rate and thus the parameters in Eq. (6) and the standard deviation. Other researchers have reported similar correlations as Eq. (6) between flux and surface shear rate for other dynamic filtration systems [4,5,12,13,14], although these systems are operated in fundamentally different ways. In those systems, the pressure is kept constant and the corresponding flux is measured. Their operation pressures are typically one order of magnitude higher and the surface shear rate is typically two orders of magnitude higher than for this apparatus. In Fig. 5 results from similar experiments with another vibration hollow fiber module [8] is show as well. These results are in the same order of magnitude as our results. At low shear rate values the critical fluxes are a bit smaller which could be due to the fact that the pore size of the hollow fiber membranes is only 0.2 m. At the larger values of the shear rate Genkin et al. [8] have measured critical fluxes of all most the same values as our results. The fact that Genkin et al. [8] operates at much smaller frequencies (0 10 Hz) and a much larger peak-to-peak amplitude (40 mm) shows that the shear rate (combination of frequency and amplitude) rater than the individual terms determines the critical flux according to Eqs. (4) and (5). In Figs. 6 and 7, the critical fluxes are depicted versus the frequency and amplitude, respectively. The general trend is that both increasing frequency and amplitude increases the critical flux. This is also expected as these variables both increase the surface shear rate as seen in Eq. (4), but Figs. 6 and 7 also shows the earlier mentioned uncertainties Fig. 5. Log log plot of the critical flux as a function of the time mean average surface shear rate. Error bars of +4 L/(m 2 h) are associated with each point. Data from reference [8] is show as well. Fig. 6. Critical flux as a function of the amplitude for the three levels of vibration frequency.
.")
 the shear rate increases more than when the amplitude is increased by a factor of 6 (1.175 mm/0.2 mm 6).")
102 286 S.P. Beier et al. / Journal of Membrane Science 281 (2006) Fig. 7. Critical flux as a function of the frequency for the three levels of vibration amplitude. in critical fluxes. This is seen as the 17.5 Hz curve in Fig. 6 and the 0.2 mm curve in Fig. 7 seems not to fit well with Eq. (6). The shear rate is proportional to the frequency raised to the power of 3/2 and to the amplitude raised to the power of 1(γ s f 3/2 amp), which is seen in Eq. (4). This means that by increasing the frequency by a factor of 6 (30 Hz/5 Hz = 6) the shear rate increases more than when the amplitude is increased by a factor of 6 (1.175 mm/0.2 mm 6). Thus, the critical flux should increase more when the frequency is raised by a factor of 6, than when the amplitude is increased by a factor of 6. That actually seems to be the case as the average distance between the 5 Hz curve and 30 Hz curve in Fig. 6 seems to be larger than the average distance between the 0.2 mm curve and the mm curve in Fig. 7 (also when the earlier discussed uncertainties are taken into account). The effect of the enhanced shear rate is visualized in Fig. 8. After ended filtration, the module is clearly heavily fouled at the low degree of vibration whereas the module seems to be kept free of fouling when the filtration have been carried out at a high degree of vibration. A 4.5 h test filtration was conducted in order to show that the system is capable of operating with a constant flux and TMP below the critical flux. The flux and TMP data vs. time is show in Fig. 9. The test filtration was conducted with another membrane module consisting of 54 hollow PES fibers and a total membrane area of 488 cm 2. The frequency and amplitude was adjusted to 25 Hz and 0.7 mm, and the filtration fluid yeast concentration was 4 g/l dry weight. The feed cross-flow velocity in the module was adjusted to 0.91 cm/s. Initially, the critical flux at these conditions was measured to 15 L/(m 2 h) according to the earlier described method. This relatively small value (compared to the earlier presented data) shows that this module has Fig. 8. Photography of the membrane module after filtration. On the left with a vibration of 30 Hz and mm amplitude and on the right with a vibration of5hz and 0.2 mm amplitude.
103 S.P. Beier et al. / Journal of Membrane Science 281 (2006) Nomenclature Fig. 9. TMP and Flux vs. time in a long-term test filtration of a bakers yeast suspension (4g/L dry weight). Frequency=25Hz and amplitude=0.7mm. Module feed cross-flow velocity = 0.91 cm/s. The critical flux (15 L/(m 2 h)) is marked with an arrow. a smaller permeability than the module used to collect the data in Table 1. In Fig. 9, it is seen that when the flux is kept below the critical flux it is possible to filtrate for a long time (here 4.5 h) with a very low cross-flow velocity (0.91 cm/s) and with a very low constant transmembrane pressure ( mpa ( 30 mbar)). The constant values of flux and TMP result in a constant membrane permeability. After 4.5 h, the flux was raised above the critical flux to 25 L/(m 2 h) and the TMP started to continually increase, resulting in a continually permeability decrease. After 5 h, the flux was further raised to 45 L/(m 2 h) resulting in both a continually flux decrease and a TMP increase. 5. Conclusion A novel dynamic microfiltration system has been presented. Filtration tests of bakers yeast suspensions showed that it is possible to filtrate with a very low transmembrane pressure. An equation for calculating the membrane surface shear rate is presented which makes it possible to calculate the average surface shear rate at the different degrees of vibration frequency and amplitude at which the critical fluxes are measured. When filtration at maximum vibration frequency and amplitude the critical flux is improved 325% compared to the critical flux measured at minimum frequency and amplitude. From the corresponding values of the critical fluxes and average surface shear rates it is suggested that the critical flux increases as a power function with respect to the average membrane surface shear rate. This type of function is able to explain 88% of the variation in the measured critical fluxes. It is also shown that the system is capable of operating for a long time below the critical flux with a very low and constant TMP and at a very low module feed cross-flow velocity. To summarize the work, it is advantageous to operate at enhanced surface shear rate to get the highest possible critical flux, which is achieved at high vibration frequency and amplitude. By operating below the critical flux, the fouling problems are strongly reduced. At this stage, the permeability of the membrane is kept constant whereas the permeability continually decreases when the flux raised above the critical flux. amp vibration amplitude (mm) f vibration frequency (Hz) = (1/s) J p,crit critical flux of permeate (L/(m 2 h)) t time (s) v j velocity component in one of the directions j = x, y, z (m/s) v 0 amplitude of velocity (v 0 = amp ω) (m/s) x, y, z directions/distances in a Cartesian coordinate system (m) Greek letters γ shear rate (1/s) γ s membrane surface shear rate (1/s) γ s time mean average surface shear rate (1/s) ν kinematic viscosity (m 2 /s) ω angular frequency (ω =2 π f) (1/s) References [1] R.W. Field, D. Wu, J.A. Howell, B.B. Gupta, Critical flux concept for microfiltration fouling, J. Membr. Sci. 100 (1995) [2] A. Guerra, G. Jonsson, A. Rasmussen, E.W. Nielsen, D. Edelsten, Low cross-flow velocity microfiltration of skim milk for removal of bacterial spores, Int. Dairy J. 7 (1997) [3] S. Holm, R. Malmberg, K. Svensson, Method and plant producing milk with low bacterial content, World Patent WO 86/01687, [4] J. Postlethwaite, S.R. Lamping, G.C. Leach, M.F. Hurwitz, G.J. Lye, Flux and transmission characteristics of a vibration microfiltration system operated at high biomass loading, J. Membr. Sci. 228 (2004) [5] M.Y. Jaffrin, L. Ding, O. Akoum, A. Brou, A hydrodynamic comparison between rotating disk and vibratory dynamic filtration systems, J. Membr. Sci. 242 (2004) [6] R. Bouzerar, P. Paullier, M.Y. Jaffrin, Concentration of mineral suspensions and industrial effluents using a rotating disk dynamic filtration module, Desalination 158 (2003) [7] G. Jonsson, I.G. Wenten, Control of concentration polarization, fouling and protein transmission of microfiltration processes within the agrobased industry, in: Proceedings of the ASEAN-EC Workshop on Membrane Technology in Agro-Based Industry, Kuala-Lumpur, Malaysia, July 26 29, 1994, pp [8] G. Genkin, T.D. Waite, T.G. Fane, S. Chang, The effect of axial vibrations on the filtration performance of submerged hollow fibre membranes, vol. 1, Extended abstracts of ICOM 2005, Seoul, pp [9] R.B. Bird, W.E. Stewart, E.N. Lightfoot, Transport Phenomena, second ed., John Wiley & Sons Inc., 2002, pp [10] B. Espinasse, P. Bacchin, P. Aimar, On an experimental method to measure critical flux in ultrafiltration, Desalination 146 (2002) [11] J.D. Petruccelli, B. Nandram, M. Chen, Applied Statistics for Engineers and Scientists, Prentice-Hall Inc., [12] O.A. Akoum, M.Y. Jaffrin, L. Ding, P. Paullier, C. Vanhoutte, An hydrodynamic investigation of microfiltration and ultrafiltration in a vibrating membrane module, J. Membr. Sci. 197 (2002) [13] O.A. Akoum, L.H. Ding, M.Y. Jaffrin, Microfiltration and ultrafiltration of UHT skim milk with a vibration membrane module, Sep. Purif. Technol. 28 (2002) [14] O.A. Akoum, L. Ding, R. Chotard-Ghodsnia, M.Y. Jaffrin, G. Gésan- Guiziou, Casein micelles separation from skimmed milk using a VSEP dynamic filtration module, Desalination 144 (2002)
104 Separation and Purification Technology 53 (2007) Separation of enzymes and yeast cells with a vibrating hollow fiber membrane module Søren Prip Beier, Gunnar Jonsson CAPEC, Department of Chemical Engineering, Technical University of Denmark, DK-2800 Kgs. Lyngby, Denmark Received 6 April 2006; received in revised form 28 June 2006; accepted 29 June 2006 Abstract In this work it is shown that the vibrating microfiltration hollow fiber membrane module is able to separate macromolecules (the enzyme Fungamyl produced by Novozymes A/S) from bakers yeast suspensions at a very low transmembrane pressure, at a very low cross-flow velocity and with a high enzyme transmission. The critical flux is determined at different degrees of module vibration. The critical flux increases as the vibration frequency and amplitude is increased. The correlations between the critical flux and the average membrane surface shear rate are found. For a pure 1% Fungamyl solution the correlation is J crit = 2.10( γ s) 0.38, and for a 1% Fungamyl solution with 5 g/l suspended bakers yeast the correlation is J crit = 1.79( γ s) These correlations are compared to the correlation J crit = 8.22( γ s) 0.26 from filtrations of 19 g/l bakers yeast suspensions from an earlier study with the same apparatus. The powers to which the shear rate is raised are all around the same value (around 1/3) and describe the degree of dependency between the critical flux and the average surface shear rate. The term multiplied to the shear rate depends on the feed fluid composition. Below the critical flux high enzyme transmission is observed whereas above the critical flux the transmission decreases dramatically as the fouling resistance increases Elsevier B.V. All rights reserved. Keywords: Shear-enhanced filtration; Critical flux; Surface shear rate; Enzyme transmission; Vibrating microfiltration 1. Introduction Severe membrane fouling often decreases the flux dramatically compared to the clean water flux in membrane separation of macromolecules from cellular suspensions. In microfiltration of protein solutions the membrane fouling mostly consists of: (i) a monolayer of macromolecules adsorbed to the pore walls and to the membrane surface and (ii) deposition of macromolecules and other feed stream components on the adsorbed monolayer. Denaturated and aggregated macromolecules may also stick to the membrane and act as sites for further fouling buildup [1]. The buildup of such a fouling layer may lead to the formation of a protein gel-layer on the membrane surface which turns the membrane into an ultrafiltration membrane with a much lower permeability [2]. High frequency back flushing [3] is a way to avoid severe membrane fouling. The destabilization of the fouling layer causes a steady state concentration profile never to be reached which makes the method useful in reducing mem- Corresponding author. Tel.: ; fax: address: gj@kt.dtu.dk (G. Jonsson). brane fouling. Another way to reduce the extent to which the fouling layer is established is to increasing the shear rate on the membrane surface. In conventional cross-flow microfiltration this is done by passing the feed fluid and the permeate along the membrane at both sides at a high cross-flow velocity. In this way the shear rate at the membrane surface is high and the transmembrane pressure (TMP) is kept low and uniform. The disadvantage of this procedure is the high pumping costs due to the high pressure drops at both sides of the membrane. The idea in dynamic microfiltration is to decouple the connection between high cross-flow velocity and high surface shear rate. By creating a relative motion between the membrane and the feed fluid the surface shear rate can be enhanced, and the cross-flow velocity can be kept low. The low cross-flow velocity keeps the TMP at a low level, which is important in order to avoid a fast establishing and compact fouling layer. Guerra et al. [4] have shown that above a certain TMP the flux decreases due to the formation of a fouling layer in microfiltration of skim milk. This emphasized the importance of maintaining a low TMP. Different dynamic microfiltration systems, some efficient in the recovery of macromolecules from fermentation broths, have been reported in the literature. The rotation disk system /$ see front matter 2006 Elsevier B.V. All rights reserved. doi: /j.seppur
105 112 S.P. Beier, G. Jonsson / Separation and Purification Technology 53 (2007) Nomenclature a constant amp vibration amplitude (mm) f vibration frequency (Hz) = (s 1 ) J permeate flux (l/m 2 h) J crit critical flux of permeate (l/m 2 h) n constant P pressure, P = TMP (mbar) R f fouling resistance (m 1 ) R m membrane resistance (m 1 ) t time (s) TMP transmembrane pressure (mbar) v z velocity in the z-direction (m/s) v 0 amplitude of velocity (v 0 = amp ω) (m/s) x, y, z directions/distances in a Cartesian coordinate system (m) Greek symbols γ s membrane surface shear rate (s 1 ) γ s average surface shear rate (s 1 ) η dynamic viscosity (Pa s) ν kinematic viscosity (m 2 /s) ω angular frequency (ω =2πf) (s 1 ) consists of a disk rotating close to the membrane surface. The rotations create the necessary surface shear rate in order to reduce fouling problems [5,6]. Vibrations of the membrane can also induce the necessary surface shear rate in order to operate at a low cross-flow velocity. Vibrating membrane systems have been described and tested by different authors [6 10]. The vibrating hollow fiber membrane module is a novel dynamic microfiltration system described by Beier et al. [11]. The vertical oscillating motion of the membrane module induces the necessary surface shear rate, making it possible to filtrate at a very low cross-flow velocity, with a very low TMP and with a high enzyme transmission. In this work the vibrating hollow fiber membrane module is tested in separation of a commercially available enzyme (Fungamyl from Novozymes A/S) from bakers yeast suspensions. A similar system is tested and described by Genkin et al. [12]. It has earlier been shown [11] that the system is efficient in the filtration of bakers yeast suspensions in a long term operational mode, but in this study also transmission of enzymes through the membrane is investigated. The purpose of this work is to show that the system is also capable of handling content of macromolecules in the feed stream and still be able to operate at a low TMP and with a high enzyme transmission. The filtration results are evaluated by using the critical flux concept formulated by Field et al. [13]. It is investigated how the critical flux depends on the average surface shear rate and the feed stream composition. The resistance to mass transport through the membrane caused by membrane fouling and the enzyme transmission is also evaluated and discussed. 2. Theory 2.1. Calculation of surface shear rate The membrane module consists of hollow fibers placed parallel vertically in a plastic cylinder. The feed stream is led to the vibrating module on the outside of the membrane fibers. The vibration frequency and amplitude can be varied independently. The shear rate at the surfaces of the fibers is defined as the derivative of the velocity component along the membrane surface with respect to the length perpendicular to the membrane surface: γ s = dv z (1) dy The coordinate system is orientated so that the z-axis is orientated in the same direction as the flow along the fibers and the y-axis is orientated perpendicular to the membrane surface with y = 0 at the surface. The x-axis is a tangent to the surface perpendicular to the z- and y-axis. Very close to the surface the membrane is almost plane which makes the use of Cartesian coordinates acceptable. This simplifies the calculations and equations. The velocity component in the z-direction for laminar flow is found by solving the Navier Stokes equation of motion, and the surface shear rate is calculated according to Eq. (1). This has been done by Beier et al. [11] and the equation for the periodic oscillating surface shear rate is given below: ω γ s = v 0 [sin(ωt) cos(ωt)] (2) 2ν The angular frequency is denoted ω (ω =2πf), and the vibration frequency is denoted f. The velocity amplitude is denoted v 0 (v 0 = amp ω), and the amplitude is denoted amp. A time mean average of the numerical value of the oscillating shear rate is used as a value for the surface shear rate [11]: 1000 i=0 γ s = γ s(t = i/1000) (3) 1000 In this equation the numerical value of the shear rate (from Eq. (2)) at times from t = 0 to 1 s at intervals of 1/1000 s are summarized and divided by 1000 to get a time mean average of the shear rate Calculation of fouling resistance The total resistance towards mass transport through the membrane can be divided into sub-resistances. One sub-resistance is the membrane resistance (R m ) and all other contributions to the total resistance can be gathered as the fouling resistance (R f ). The membrane resistance is determined from water flux experiments whereas the fouling resistance can be calculated from flux and TMP data according to the following equation [14]: J = P η(r m + R f ) (4)

106 S.P. Beier, G. Jonsson / Separation and Purification Technology 53 (2007) Critical flux concept The critical flux concept is used to evaluate the filtration performance. The critical flux hypothesis for microfiltration is that on start-up there exists a flux below which a decline of flux with time does not occur; above it fouling is observed. This flux is the critical flux and its value depends on the hydrodynamics and probably other variables [13]. The critical flux concept implies that it is possible to maintain a constant flux and constant TMP as long as the constant flux is kept below the critical flux because no severe membrane fouling at this stage occurs. The critical flux is determined experimentally at different levels of vibration frequency and amplitude. 3. Materials and methods 3.1. Experimental apparatus The experimental apparatus have been described in details earlier [11]. A sketch of the experimental apparatus is shown in Fig. 1. The membrane module with a total membrane area of 488 cm 2 is composed of 54 hollow fibers with a length of 12.5 cm and a diameter of 2.3 mm fixed in parallel between a steel plate in the bottom of the module and a permeate gap in the top. An earlier study of the system was done with another membrane module with an area of only 256 cm 2 [11]. The fibers are closed in the bottom ends with silicone glue and are open in the top into the permeate gap. To prevent breakage caused by the vibrations a flexible sealing consisting of silicone tubes where placed as a transition between the fiber ends and the steel plate in the bottom and the entrance into the permeate gap in the top. The hollow fibers supplied by X-flow are made of polyethersulfone (PES) with the skin layer on the outer surface and a minimum and maximum pore size of 0.36 and 0.5 m, respectively. The clean water permeability of these membrane fibers at 25 C were measured to 2150 l/m 2 h bar. A scanning electron microscopy (SEM) picture of the membrane surface and of a cross-sectional cut is seen in Fig. 2. On the right side the compact skin layer on the outside is visually easily distinguished from the much more open support structure inside the fiber. The steel plate in the bottom and the permeate gap are fixed to a hollow steel rod, which was extended through the top of the cylindrical acrylic module vessel to connect with a rotation head fixed to an electro motor. Rotations of the rotation head hereby induced perpendicular movement of the membrane module, which was kept in contact with the rotation head by a strong spring. Three different rotation heads were used which corresponds to three levels of vibration amplitudes: 0.2, 0.7 and mm (the peak to peak amplitude is twice as big). By changing the rotation speed of the rotation head, the frequency of the vibrations was adjusted between 5 and 25 Hz. A cavity for positioning the steel rod was placed in the bottom of the module vessel to direct the vibrations of the module in the vertical direction. The upper ends of the fibers were open into a permeate gap connected through the hollow rod to a progressive Fig. 1. Schematic drawing of the experimental apparatus.
.")
107 114 S.P. Beier, G. Jonsson / Separation and Purification Technology 53 (2007) Fig. 2. SEM pictures of the PES hollow fiber membrane with the skin layer outside. On the left a close-up of the surface is seen. On the right a cross-sectional cut is seen. cavity pump (Seepex M120-0, Seeberger, Germany). This permeate pump sucked permeate through the hollow fibers via the permeate gap and the hollow rod to the beaker placed on the electronic scale. Transmembrane pressure (TMP) was measured as the difference between permeate and module headspace pressure using a pressure transducer (RS , RS-components, USA) linked to the PC. With this pressure transducer it was possible to detect variation in the transmembrane pressure in the order of a few mbar. Mass flow of permeate was measured and collected on a scale (Mettler PJ3000, Switzerland) connected to the PC before it manually was returned to the thermostatic feed tank. Feed solution was circulated from the feed tank via a gear pump (Micropump F5734, USA) to the intake at the bottom of the module vessel and then returned to the feed tank from the top of the module vessel Feed fluids Two types of feed fluids were used as filtration fluids. The first type of filtration fluid consisted of a pure aqueous solution of the enzyme Fungamyl (produced by Novozymes A/S). The -amylase Fungamyl is for example used in the baking industry as an oxidation agent. The enzyme concentration was in most cases 1%, but experiments with 0.5% and 2% solutions were also carried out. The second type of filtration fluid consisted of both Fungamyl and suspended wet cake bakers yeast (Malteserkors Gær, Danisco, Denmark). The average dry weight content of the wet yeast is 27% with small variations (±1%). Most experiments were done with 5 g/l of wet bakers yeast. Experiments with 2.5 and 10 g/l of wet bakers yeast were also carried out. Table 1 gives an overview of the different feed fluids Experimental procedure For feed fluids containing 1% Fungamyl with and without suspended yeast (5 g/l) the critical flux was determined at different levels of vibration frequency and amplitude. The frequency and amplitude were adjusted between 5 and 25 Hz and 0.2, 0.7 and mm, respectively. Because of mechanical limitations it was not possible to raise the frequency further. For these experiments the Fungamyl concentration in the bulk solution and in the permeate was determined by UV spectroscopy of small samples. This was done in order to determine the Fungamyl transmission, which was calculated as the ratio between the concentration in the permeate and in the bulk. Additional filtrations at a fixed frequency of 25 Hz and an amplitude of 0.7 mm were also carried out with enzyme concentrations of 0.5% and 2% and with yeast contents of 2.5 and 10 g/l. In all these filtrations a very low feed cross-flow velocity of 0.91 cm/s was used. The last filtration was done with a cross-flow velocity of 1.83 cm/s ( 100% increase) for a 1% enzymes and 5 g/l yeast feed fluid at 25 Hz and 0.7 mm amplitude. In Table 1 an overview of the different filtrations is given. As described in details elsewhere [11] the flux was stepwise increased (two steps forward and one step backward) by a progressive pump controlled by a PC. The duration of each step (step length) was in these experiments adjusted to 4 min, and the step height was adjusted to 3 l/m 2 h which of course gives raise to uncertainties in the measured critical fluxes in that order of magnitude. The critical flux (J crit ) is identified as the maximum permeate flux where P/t is less than 2 mbar/step (2 mbar over 4 min) and TMP is recovered when returning to the last tested permeate flux (one step back). This method is similar to Table 1 Overview of the experimental work Feed composition Varied parameters Fixed parameters Transmission measured 1% Fungamyl + Frequency [5, 15, 25] Hz; amplitude [0.2, 0.7, 1.175] mm Cross-flow velocity 1% Fungamyl + 5 g/l yeast + 1% Fungamyl + yeast Yeast content [2.5, 5, 10] g/l Fungamyl + 5 g/l yeast Fungamyl concentration [0.5, 1, 2]% Frequency 25 Hz; amplitude 0.7 mm 1% Fungamyl + 5 g/l yeast Cross-flow velocity [0.91, 1.83] cm/s
![S.P. Beier, G. Jonsson / Separation and Purification Technology 53 (2007) 111 118 115 the method used to determine the critical flux in ultrafiltration described by Espinasse et al. [15].](/docs-images/93/112484511/images/108-0.jpg "Some of the filtrations were continued until a maximum flux was reached. This was done in order to investigate the fouling resistance and enzyme transmission above the critical flux.")
108 S.P. Beier, G. Jonsson / Separation and Purification Technology 53 (2007) the method used to determine the critical flux in ultrafiltration described by Espinasse et al. [15]. Some of the filtrations were continued until a maximum flux was reached. This was done in order to investigate the fouling resistance and enzyme transmission above the critical flux. Between each filtration the clean water flux was 100% recovered by cleaning the membrane system with a 0.5% solution of P3-ultrasil Results and discussion In the first experimental run 1% solutions of Fungamyl were filtrated with and without suspended bakers yeast (5 g/l) at different levels of vibration frequency and amplitude. In Fig. 3 data for one of the filtrations is shown. The stepwise increased flux as well as the very low level of the TMP is seen. The critical flux (J crit ) is identified as the maximum permeate flux where P/t is less than 2 mbar/step and TMP is recovered when returning to the last tested permeate flux (one step back). For the filtration shown in Fig. 3 the critical flux is 16 l/m 2 h, and it is seen that the filtration was continued way above the critical flux in order to investigate the system in this condition. In an earlier study of the vibrating hollow fiber membrane module [11] filtrations of bakers yeast suspensions (yeast dry weigh of 5 g/l corresponding to wet cake bakers yeast content of 19 g/l) were filtrated at the same levels of amplitude and at frequencies between 5 and 30 Hz. Results from that study together with the critical flux results from this study are depicted in a log log plot in Fig. 4. The intention of using a log log coordinate system is to show that the experimental data suits an expression of the following kind: J crit = a( γ s ) n (5) Similar correlations between flux and surface shear rate for other dynamic microfiltration systems have been reported in the literature [6 10]. As seen in Fig. 4 the three series of filtrations fits a power function (as Eq. (5)) well. The standard deviation, calculated as the square root of the mean square error [16], for the yeast suspension experiments is 5.2 l/m 2 h whereas the standard Fig. 3. Flux and TMP vs. time. Filtration of 1% Fungamyl solution with suspended yeast 5 g/l. Vibration frequency = 25 Hz. Vibration amplitude = 0.7 mm. Fig. 4. Critical flux vs. average surface shear rate for: (i) 19 g/l yeast suspensions [11], (ii) 1% Fungamyl solutions and (iii) 1% Fungamyl solutions with 5g/l yeast. deviation for the pure Fungamyl experiments and the Fungamyl and yeast experiments is 2.5 and 1.0 l/m 2 h, respectively. The smaller standard deviation for the Fungamyl containing experiments is properly due to smaller step height (3 l/m 2 h) compared to the step height of 4 l/m 2 h [11] used in the pure yeast experiments. Power functions of the kind in Eq. (5) are able to explain most of the variation in the measured critical fluxes compared to other kind of functions. It is further seen that the constant n in Eq. (5) is nearly the same (around 1/3) for the three filtration series, which indicates that the constant n is independent of the feed composition and only describes the average surface shear rate dependency on the critical flux. The factor of 1/3 is actually the same as theoretically derived by Belfort et al. [17] for cross-flow microfiltration, where the feed is composed of non-adhesive spherical particles which form a cake layer on the membrane surface. The reason that our nvalue is close to the theoretical value from Belfort et al. [17] might be, that the theoretical value is derived from laminar flow theory. This is consistent with the low flow velocity in the module cylinder. The transport mechanism described by Belfort et al. is Brownian diffusion where the cake layer dominates the total resistance towards mass transport. It should be noted that the Brownian diffusion correlation derived by Belfort et al., underpredicts the actual fluxes by an order of magnitude or more, and therefore the correlations derived by Belfort et al. will not be used further in this study. The constant a in Eq. (5) is different in the three filtration series. This constant depends on the feed fluid composition. It is seen that macromolecular content and suspended yeast in the feed decrease the critical flux. The fact that the highest critical fluxes are measured for the feed without macromolecules but with high yeast content indicates that the macromolecular content influences the critical flux to a larger extent than the yeast content. It is generally accepted that macromolecular content has severe impact on microfiltration performance [1,2,17]. This was further investigated by evaluating the fouling resistance towards


109 116 S.P. Beier, G. Jonsson / Separation and Purification Technology 53 (2007) Fig. 5. Fouling resistance vs. flux for constant Fungamyl concentration (1%) and varying yeast content. Vibration frequency = 25 Hz. Vibration amplitude = 0.7 mm. mass transport through the membrane as a function of the stepwise increased flux. In Figs. 5 and 6 the fouling resistances (calculated according to Eq. (4)) are depicted as functions of the stepwise increased flux. In all cases the fouling resistance at low fluxes is almost constant and at a low level showing that at this stage the critical flux is not exceeded. The difference in fouling resistance seen in Figs. 5 and 6 at these low values is properly due to uncertainties in the very small values of the measured TMP. In the initial stage the membrane fouling is probably only composed of a monolayer of adsorbed Fungamyl molecules on the membrane surface and on the pore walls. Such a strong bounded adsorbed monolayer, which is very often seen in microfiltration of macromolecules, only results in a very small decrease in permeability and thus a small increase of resistance [1,17]. When the fouling resistance starts to increase the critical flux has been exceeded. In Fig. 5 it is seen that the varying yeast content (four times increase; from 2.5 to 10 g/l) does not influence the fouling resistance curves as much at the varying Fungamyl content (also four times increase; from 0.5% to 2%) depicted in Fig. 6. This might indicate that the Fungamyl content influences the critical flux more than the yeast cell content. This could be due to the fact that the yeast cells are not able to enter the membrane pores because of the size, whereas the macromolecules can enter the membrane and adsorb to the pore walls as well as the membrane surface. Furthermore the larger particles on the surface occupy a larger volume in the region of high shear rate than the smaller macromolecules. Thus, the larger particles on the surface are exposed to a larger lift force away from the membrane surface, which hinder them more in staying close to the surface than the macromolecules. Therefore, high yeast content does not influence the critical flux and fouling resistance as much as high macromolecular content. All filtrations were done with a very low cross-flow velocity of 0.91 cm/s. In the derivation of Eq. (2) [11] it was assumed that the surface shear rate was only influenced by the module vibrations and not by the cross-flow velocity. This assumption was investigated in two similar filtrations with different cross-flow velocities. In both cases the feed fluid consisted of 1% Fungamyl and 5 g/l suspended yeast at 25 Hz and 0.7 mm amplitude. At the two different cross-flow velocities (0.91 and 1.83 cm/s) a critical flux of 16 l/m 2 h was measured in both cases. This shows that the cross-flow velocity (at these low values) does not influence the value of the critical flux meaning that the assumption in the derivation of Eq. (2) is acceptable. For some of the filtrations the transmission of Fungamyl through the membrane was measured during the filtration (see Table 1) by UV spectroscopy of small samples of bulk and permeate solutions. For these experiments the procedure of increasing the flux stepwise was continued above the critical flux until a maximum flux was reached and a bit further. This was done in order to investigate the fouling resistance and transmission of enzymes through the membrane at these conditions. In Figs. 7 and 8 results from these experiments are shown. In Figs. 7 and 8 the fouling resistance and enzyme transmission are depicted versus the stepwise increased flux, which in these experiments was increased until a certain maximum flux was reached and a bit further. Only every second flux step is shown. A maximum flux was reached in all cases, and even though the pump setting was still increased after the maximum flux was reached, the flux dropped. This is the reason that the Fig. 6. Fouling resistance vs. flux for constant yeast content (5 g/l) and varying Fungamyl concentration. Vibration frequency=25hz. Vibration amplitude = 0.7 mm. Fig. 7. Fouling resistance R f and Fungamyl transmission vs. flux. The constant membrane resistance R m is show as well. Filtration of 1% Fungamyl solution with 5 g/l suspended yeast at two different levels of surface shear rate.
110 S.P. Beier, G. Jonsson / Separation and Purification Technology 53 (2007) Fig. 8. Fouling resistance R f and Fungamyl transmission vs. flux. The constant membrane resistance R m is shown as well. Filtration of 1% Fungamyl solution with and without 5 g/l suspended yeast at a surface shear rate of 684 s 1. curves go back. In Fig. 7 the Fungamyl transmission and the fouling resistance are depicted as functions of the flux for two filtrations with 1% Fungamyl and 5 g/l suspended yeast at two different levels of surface shear rate. The membrane resistance, which has been determined to m 1 from water flux experiments and Eq. (4) (with R f = 0), is shown as well. In Fig. 8 the fouling resistance and the Fungamyl transmission are depicted as functions of the flux for filtrations of 1% Fungamyl solutions with and without suspended yeast at a fixed level of surface shear rate (684 s 1 ). In all filtrations the fouling resistance is initially very low and constant showing that the critical flux is not exceeded. High Fungamyl transmission (>90%) is observed at this stage. In both Figs. 7 and 8 it is seen, that above the critical flux the fouling resistance initially increases very slowly and when approaching the maximum flux the increase is very severe. The point at which the fouling resistance increases strongly is very dependent on the surface shear rate (which can be seen as the large distance between the R f -curves in Fig. 7) and less dependent on the presence of yeast cells (which can be seen as the smaller distance between the R f -curves in Fig. 8). An explanation could be that when the surface shear rate is high the yeast cells on the surface is exposed to a large lift force away from the surface because of the velocity gradient, preventing them from contributing to the buildup of membrane fouling. Therefore, the presence of yeast cells does not have a large impact on when and how fast the fouling resistance increases and therefore does not influence the maximum flux much. The lift force on the macromolecules is much lower because of the much lower molecule volume compared to the yeast cell volume. Increasing surface shear rate increases the lift force away from the surface, which is seen in Fig. 7 where the fouling resistance at the largest shear rate increases severely much later than at the lower shear rate. So from Figs. 7 and 8 it is seen that the maximum flux is much more dependent on the surface shear rate than on the presence of yeast cells. An initial high transmission was generally observed in all filtrations. At the stage of high transmission a low fouling resistance was observed. This shows that below the critical flux the fouling resistance is kept low and a high enzyme transmission is achieved. Actually high enzyme transmission is observed above the critical flux and in some cases almost until the maximum flux is reached. In all cases the Fungamyl transmission decreases dramatically when the fouling resistance increases. An explanation to this phenomenon could be that when the fouling resistance increases a Fungamyl gel-layer is established on the surface. This layer, which eventually turns the membrane into an ultrafiltration membrane, is impermeable of Fungamyl resulting in a large decrease in transmission. The established fouling layer actually in some cases decreased the flux as the TMP (pump setting) was increased, which make the fouling resistance and transmission curves go back (seen in Figs. 7 and 8). Similar behavior is described by Guerra et al. [4] in microfiltration of skim milk. A mechanism for the buildup of a gel-layer is proposed by Jonsson et al. [2] for microfiltration of BSA solutions. At a certain point the local shear rate at the pore entrances reaches a level resulting in denaturation of the BSA molecules. This leads to aggregation of the macromolecule content and the formation of a gel-layer on the membrane surface. This gel-layer turns the membrane into an ultrafiltration membrane with much larger resistance towards mass transport and very low enzyme transmission. This means that at a certain flux denaturation of Fungamyl and gel-layer buildup is unavoidable due to the high shear rate at the pore entrances. Thus, at every level of surface shear rate a maximum flux exists. The flux at which the fouling layer is established is increased by increasing the average surface shear rate because the increased lift force away from the surface delay the denaturated macromolecules in establishing a fouling layer. The membrane fouling is delayed by increased average surface shear rate but not avoided. 5. Conclusion In this work it has been shown that the vibrating hollow fiber membrane module is able to operate at a very low cross-flow velocity, with a very low TMP and with a high enzyme transmission in the separation of the enzyme Fungamyl from bakers yeast suspensions. The critical flux was determined for different series of filtrations at different degrees of module vibration. The critical flux increased as the vibration frequency and amplitude was increased. For all series of filtrations the correlation between the critical flux and the average surface shear rate showed to be a power function. The power to which the shear rate is raised, describes to which degree the critical flux depends on the average surface shear rate. This power is independent of the feed fluid composition, whereas the constant term multiplied to the shear rate describes the dependency on the feed fluid composition. By evaluating the fouling resistance towards mass transport through the membrane, the content of macromolecules rather than the yeast content in feed fluid seems to determine how fast and to which degree the membrane fibers are fouled. Below the critical flux the fouling resistance is low and high enzyme transmission is observed. Above the critical flux the fouling resistance initially increased slowly but when approaching the maximum flux the increase was very severe resulting in a large decrease of the enzyme transmission. The point, at which the Fungamyl
111 118 S.P. Beier, G. Jonsson / Separation and Purification Technology 53 (2007) transmission decreases, is very dependent on the average surface shear rate and less dependent on the presence of yeast cells. To summarize the work, it is advantageous to operate at enhanced surface shear rate to get the highest possible critical flux when macromolecules are to be separated from cellular material. By operating below the critical flux with a very low feed cross-flow velocity and with a very low TMP the fouling problems are strongly reduced and high enzyme transmission is achieved. References [1] A.D. Marshall, P.A. Munro, G. Trägårdh, The effect of protein fouling in microfiltration and ultrafiltration on the permeate flux, protein retention and selectivity: a literature review, Desalination 91 (1993) [2] G. Jonsson, P. Johansen, W. Li, Influence of membrane fouling on ultrafiltration and microfiltration processes, in: Proceedings of the Processes of the CEE-Brazil Workshop on Membrane Separation Processes, Rio de Janeiro, Brazil, May 3 8, 1992, pp [3] G. Jonsson, I.G. Wenten, Control of concentration polarization, fouling and protein transmission of microfiltration processes within the agro-based industry, in: Proceedings of the ASEAN-EC Workshop on Membrane Technology in Agro-Based Industry, Kuala-Lumpur, Malaysia, July 26 29, 1994, pp [4] A. Guerra, G. Jonsson, A. Rasmussen, E.W. Nielsen, D. Edelsten, Low cross-flow velocity microfiltration of skim milk for removal of bacterial spores, Int. Dairy J. 7 (1997) [5] R. Bouzerar, P. Paullier, M.Y. Jaffrin, Concentration of mineral suspensions and industrial effluents using a rotating disk dynamic filtration module, Desalination 158 (2003) [6] M.Y. Jaffrin, L. Ding, O. Akoum, A. Brou, A hydrodynamic comparison between rotating disk and vibratory dynamic filtration systems, J. Membr. Sci. 242 (2004) [7] O.A. Akoum, M.Y. Jaffrin, L. Ding, P. Paullier, C. Vanhoutte, An hydrodynamic investigation of microfiltration and ultrafiltration in a vibrating membrane module, J. Membr. Sci. 197 (2002) [8] O.A. Akoum, L.H. Ding, M.Y. Jaffrin, Microfiltration and ultrafiltration of UHT skim milk with a vibration membrane module, Sep. Purif. Technol. 28 (2002) [9] O.A. Akoum, L. Ding, R. Chotard-Ghodsnia, M.Y. Jaffrin, G. Gésan- Guiziou, Casein micelles separation from skimmed milk using a VSEP dynamic filtration module, Desalination 144 (2002) [10] J. Postlethwaite, S.R. Lamping, G.C. Leach, M.F. Hurwitz, G.J. Lye, Flux and transmission characteristics of a vibration microfiltration system operated at high biomass loading, J. Membr. Sci. 228 (2004) [11] S.P. Beier, M. Guerra, A. Garde, G. Jonsson, Dynamic microfiltration with a vibrating hollow fiber membrane module: filtration of yeast suspensions, J. Membr. Sci. 281 (2006) [12] G. Genkin, T.D. Waite, T.G. Fane, S. Chang, The effect of axial vibrations on the filtration performance of submerged hollow fibre membranes, in: Proceedings of the Extended Abstracts of ICOM 2005, vol. 1, Seoul, 2005, pp [13] R.W. Field, D. Wu, J.A. Howell, B.B. Gupta, Critical flux concept for microfiltration fouling, J. Membr. Sci. 100 (1995) [14] M. Mulder, Basic Principles of Membrane Technology, 2nd ed., Kluwer Academic Publishers, [15] B. Espinasse, P. Bacchin, P. Aimar, On an experimental method to measure critical flux in ultrafiltration, Desalination 146 (2002) [16] J.D. Petruccelli, B. Nandram, M. Chen, Applied Statistics for Engineers and Scientists, Prentice-Hall Inc., [17] G. Belfort, R.H. Davis, A.L. Zydney, Review: the behavior of suspensions and macromolecular solutions in crossflow microfiltration, J. Membr. Sci. 96 (1994) 1 58.
112 Langmuir 2007, 23, Adsorption of Amylase Enzyme on Ultrafiltration Membranes Søren Prip Beier, Ann Dorrit Enevoldsen, Georgios M. Kontogeorgis, Ernst B. Hansen, and Gunnar Jonsson*, CAPEC, Department of Chemical Engineering, Technical UniVersity of Denmark, DK-2800 Kgs. Lyngby, Denmark, IVC-SEP, Department of Chemical Engineering, Technical UniVersity of Denmark, DK-2800 Kgs. Lyngby, Denmark, and RecoVery DeVelopment, NoVozymes A/S, SmørmoseVej 9, 3AM, DK-2880 BagsVærd, Denmark ReceiVed May 29, In Final Form: June 26, 2007 A method to measure the static adsorption on membrane surfaces has been developed and described. The static adsorption of amylase-f has been measured on two different ultrafiltration membranes, both with a cutoff value of 10 kda (a PES membrane and the ETNA10PP membrane, which is a surface-modified PVDF membrane). The adsorption follows the Langmuir adsorption theory. Thus, the static adsorption consists of monolayer coverage and is expressed both as a permeability drop and an adsorption resistance. From the adsorption isotherms, the maximum static permeability drops and the maximum static adsorption resistances are determined. The maximum static permeability drop for the hydrophobic PES membrane is 75%, and the maximum static adsorption resistance is m 2 h bar/l. The maximum static permeability drop for the hydrophilic surface-modified PVDF membrane (ETNA10PP) is 23%, and the maximum static adsorption resistance is m 2 h bar/l. The difference in maximum static adsorption, by a factor of around 3, affects the performance during the filtration of a 5 g/l amylase-f solution at 2 bar. The two membranes behave very similarly during filtration with almost equal fluxes and retentions even though the initial water permeability of the PES membrane is around 3 times larger than the initial water permeability of the ETNA10PP membrane. This is mainly attributed to the larger maximum static adsorption of the PES membrane. The permeability drop during filtration exceeds the maximum static permeability drop, indicating that the buildup layer on the membranes during filtration exceeds monolayer coverage, which is also seen by the increase in fouling resistance during filtration. The accumulated layer on the membrane surface can be described as a continually increasing cake-layer thickness, which is independent of the membrane type. At higher concentrations of enzyme, concentration polarization effects cannot be neglected. Therefore, stagnant film theory and the osmotic pressure model can describe the relationship between flux and bulk concentration. 1. Introduction During ultrafiltration (UF) and microfiltration (MF) of macromolecular solutions, a severe flux decline is often observed after a short period of time. The decline is caused by concentration polarization and fouling on the membrane surface. In the literature, it is generally accepted that macromolecular content such as proteins, enzymes, and so forth in the feed solution highly contributes to the buildup of membrane fouling and thus has a great impact on the flux decline. 1,2 Ultrafiltration membranes are mainly fouled by macromolecules on the membrane surface, whereas microfiltration membranes are also fouled inside the porous structure. In general, membrane fouling consists of the following: (i) A monolayer of macromolecules is adsorbed to the membrane surface (both UF and MF membranes) and to the pore walls inside the membrane (MF membranes). (ii) Macromolecules and other feed stream components are deposited on the adsorbed monolayer. Denaturated and aggregated macromolecules may also stick to the membrane and act as sites for further fouling buildup. 1 * Corresponding author. gj@kt.dtu.dk. Tel: (+45) Fax: (+45) CAPEC, Department of Chemical Engineering, Technical University of Denmark. IVC-SEP, Department of Chemical Engineering, Technical University of Denmark. Novozymes A/S. (1) Marshall, A. D.; Munro, P. A.; Trägårdh, G. Desalination 1993, 91, (2) Belfort, G.; Davis, R. H.; Zydney, A. L. J. Membr. Sci. 1994, 96, The adsorbed monolayer is often tightly bounded to the membrane and cannot be removed by rinsing with water but requires chemical cleaning to be removed. Therefore, such a monolayer is often referred to as being an irreversible adsorbed monolayer (chemical adsorption). The further deposition of macromolecules on the monolayer is often more loosely attached, which in some cases makes it possible to remove by cleaning with water. This layer is therefore referred to as being a reversible fouling layer (physical adsorption). 3 Different investigations of the adsorption of proteins and biomolecules on different surfaces have been published. The adsorption of proteins on membrane surfaces can be studied by various methods. The amount of protein adsorbed on membranes can be determined, for example, by streaming potential measurements, 4 radioactive measurements of isotopically labeled proteins, 5 contact angle determinations, 6 SEM pictures of the membrane surface, 7 or simply soaking the membrane in a protein solution and following the development of concentration. 1,2,8-10 In general, the adsorption in the above cases can be described by a Langmuir isotherm regardless of whether it is measured under static or dynamic conditions. (3) Shaw, D. J. Introduction to Colloid and Surface Chemistry, 4 th ed.; Butterworth-Heinemann: Boston, (4) Kontturi, K.; Vuoristo, M. Desalination 1996, 104, (5) Wei, J.; Helm, G. S.; Corner-Walker, N.; Hou, X. Desalination 2006, 192, (6) Bayramoǧlu, G.; Yalçin, E.; Arica, M. Y. Biochem. Eng. J. 2005, 26, (7) Li, X.; Zhang, Y.; Fu, X. Sep. Purif. Technol. 2004, 37, (8) Cattoli, F.; Boi, C.; Sorci, M.; Sarti, G. C. J. Membr. Sci. 2006, 273,2-11. (9) Cattoli, F.; Sarti, G. C. Desalination 2002, 149, (10) Khokhlova, T. D.; Mchedlishvili, B. V. Colloid J. 1996, 58, /la701524x CCC: $ American Chemical Society Published on Web 08/04/2007
113 9342 Langmuir, Vol. 23, No. 18, 2007 Beier et al. The adsorption of proteins can be a slow process especially if the experiment is carried out under static conditions. Bayramoǧlu and co-workers have measured the adsorption of five different proteins on surface-modified track membranes. 6 The amount of adsorbed protein changes with time. Lysozyme, cytochrome, and γ-globulin adsorb to the membrane surface, and after approximately 2 days, the maximum adsorption level is reached. γ-globulin has the highest adsorption level, followed by cytochrome and lysozyme. BSA and ferritin do not adsorb to the membrane surface at all. 6 However, adsorption is not always a slow process. Li and co-workers have measured the static adsorption of glutamicum onto a polysulphone ultrafiltration membrane at different ionic strengths and ph values. 7 In their work, the maximum adsorption is reached after just 1hinall cases. Furthermore, they found a large influence of ionic strength and ph on adsorption. Generally, the highest amount of protein is adsorbed at a ph equal to the proteins isoelectric point (pi), where the electrostatic repulsions between membrane-protein and protein-protein are at a minimum. If the protein has a net surface charge, then the amount of adsorbed protein depends on the charge of the membrane surface. Bayramoǧlu and co-workers and Li and co-workers 6,7 both found that proteins with opposite surface charge compared to that of the membrane had the strongest adsorption. The influence of hydrophilicity on surface adsorption was studied by Wei and co-workers. 5 They have shown that membranes made of hydrophobic materials such as polysulphone and polyethersulphone caused severe fouling during the filtration of BSA compared to UF membranes (ETNA01PP and ETNA10PP) made of more hydrophilic surfaces (e.g., surfacemodified poly(vinylidene fluoride)). However, there are other considerations to take into account when choosing the proper membrane for a filtration process. When comparing a 10 kda polysulphone membrane with a ETNA10PP membrane, the water permeability of the ETNA10PP membrane is easily restored just by rinsing with water after filtration with BSA. In contrast, the polysulphone membrane requires chemical cleaning before water permeability is restored. However, the filtration rate is higher using the polysulphone membrane than using the ETNA10PP membrane, probably because of the higher initial water permeability. 5 The retention (selectivity), lifetime, and cleaning needs are also important parameters to consider when choosing a membrane for a specific filtration purpose. Thom et al. investigated how protein adsorption on membrane surfaces influences the biocompatibility of these surfaces. They also found that the amount of protein adsorption decreased with increasing hydrophilicity. However, the state of the adsorbed protein seemed to depend on the amphiphilic character of the surface, showing the lowest degree of protein denaturation when there was a large difference between the advancing and receding contact angles. 11 The scope of this work is to investigate the adsorption of macromolecules (an amylase enzyme, 55 kda) on two different UF membranes under static and pressure-forced conditions. One of the objectives is to show whether chemical (static) adsorption can be described by the well-known Langmuir adsorption theory. A method to measure the static adsorption is described. The relative adsorption is measured both as a membrane permeability drop based on the permeabilities before and after static adsorption and as an adsorption resistance. The effect of static adsorption is also investigated during the filtration (pressure-forced condition) of the amylase solution. (11) Thom, V. H.; Altankov, G.; Groth, Th.; Jankova, K.; Jonsson, G.; Ulbricht, M. Langmuir 2000, 16, Theory The adsorption of various components on different surfaces can be described by the Gibbs adsorption isotherm. The Gibbs adsorption isotherm is given below: Γ i )- C i dγ (1) RT dc i The adsorption of species i is denoted by Γ i and is typically given in dimensions of mol/area. The concentration of species i in solution, from which the molecules are adsorbed, is denoted C i. Equation 1 shows that, in order to determine the adsorption, knowledge of the surface tension γ as a function of concentration C i is required. R is the gas constant, and T is the absolute temperature. The Gibbs equation has several applications: The surface concentration can be determined from the relationship between the surface tension and the concentration. The area occupied by each adsorbed molecule can be estimated. The molecular weight of the adsorbed macromolecules (proteins, enzymes, etc.) can be estimated, under the assumption that they form ideal films at low surface pressure. The surface tension and adsorption phenomenon are linked, and at constant temperature, the adsorption can in many cases also be described by the Langmuir adsorption isotherm: Γ i ) Γ i,max kc i 1 + kc i (2) The maximum adsorption of component i is denoted Γ i,max, and k is the adsorption equilibrium constant, which is related to the Gibbs adsorption energy. The Langmuir equation is often used in a linear form: C i Γ i ) C i Γ i,max + 1 kγ i,max (3) Maximum adsorption corresponds to the surface being covered by a monolayer. In many cases, the adsorption of large molecules on solid surfaces follows Langmuir theory. The Langmuir adsorption equation is based on the following assumptions: The surface is homogeneous. Adsorption cannot occur beyond monolayer coverage. All adsorption sites are equivalent. There are no interactions between the adsorbed molecules and the molecules in the solution and no interactions between the solvent and the surface. According to the last assumption, the Langmuir adsorption equation is only valid for dilute solutions. Although the last assumption can, in some contexts, seem unrealistic, the equation is still quite useful. The theory also assumes that the adsorption rate is proportional to the concentration in solution and the fraction of the free non-covered area of the adsorbent. Furthermore, the desorption rate is assumed to be proportional to the fraction of surface covered by adsorbed molecules. At equilibrium, the adsorption and desorption rates are equal. By plotting the adsorption and the concentration (eq 3), Γ i,max can be determined. This value corresponds to the concentration at which the whole surface is covered by a monolayer of adsorbed molecules. Adsorption is affected by many different parameters. The salt concentration in the solution can influence the geometric structure of the macromolecules, which in turn can influence the adsorption. Increased ionic strength decreases the thickness of the diffuse double layer around the macromolecule, and the electrostatic
114 Amylase Enzyme Adsorption on Membranes Langmuir, Vol. 23, No. 18, interactions between the proteins thus decrease. If the membrane and protein have opposite surface charge, then a higher ionic strength will, in general, decrease the adsorption due to weaker electrostatic interactions. A higher adsorption can, however, be achieved by increasing the ionic strength in the solution if the membrane and protein have the same surface charge because the repelling forces are reduced. 6,7 The ph of the solution can also influence the adsorption because the charge of a macromolecule is highly dependent on the ph value. Equally charged molecules repeal each other, thus adsorption is assumed to be highest when the molecules have a low charge (close to the isoelectric point) or are uncharged. The hydrophilic/hydrophobic nature of the surface also influences the adsorption. Hydrophobic surfaces tend to attract hydrophobic molecules more than hydrophilic molecules, and hydrophilic surfaces tend to attract hydrophilic molecules more than hydrophobic molecules. This is also the case for membrane surfaces. The membrane material and structure have an effect on the degree of adsorption and fouling, but the membrane material is not always crucial; its influence also depends on the filtration system. If cake buildup at the membrane surface is observed, then the filtration process will mostly depend on the cake properties. 1 The morphology and structure of the membrane also have an effect on fouling. Membranes with straight-through pores are more sensitive to fouling than isotropic membranes, where the membranes make up a network structure in which the fluid can pass the blocked pores. 12,13 The chain length also influences the adsorption of, for example, hydrocarbons because of their hydrophobic nature. The temperature is also important because the surface tension depends on the temperature. 3 Thus, the adsorption is affected by many parameters, which affects the maximum adsorption. In some cases, it is reached in a few hours, whereas in other cases, it takes several days before the maximum adsorption is reached. In the evaluation of the adsorption, the permeabilities (l p)of the membranes are determined. The permeability can be calculated according to Darcy s law from flux and pressure data. 14 The volumetric flux through the membrane is denoted J v, and ΔP is the applied hydrostatic pressure across the membrane. In further analysis, the permeabilities can be interpreted as different subresistances. Thus, eq 4 can be rewritten into the following resistance-in-series model: 15 J v ) 1 1 ΔP ) R tot ( R m + R a + R f ) ΔP (5) The total resistance toward transport through the membrane (R tot) can be divided into different subresistances such as the membrane resistance (R m), the adsorption resistance (R a), and the fouling Table 1. Membrane Data name producer cutoff value material water permeability ETNA10PP Alfa Laval 10 kda PVDF (surface-modified 63 ( 6 L/(m 2 h bar) poly(vinylidene fluoride)) PES Pall 10 kda PES (polyethersulfone) 207 ( 18 L/(m 2 h bar) J V ) l p ΔP (4) resistance (R f). The membrane resistance is a membrane constant, whereas the adsorption resistance is a term that is used in the evaluation of the static adsorption. The fouling resistance is used in the evaluation of the pressure-forced adsorption. The fouling resistance can in some cases be thought of as a continuous growing cake on the membrane surface, similar to conventional filtration theory. In that case, the first layer of the cake corresponds to the adsorbed monolayer, and thus the adsorption resistance and the fouling resistance can be looked upon as one term. The resistance of such a cake is dependent on the specific cake resistance, which is a constant, and the thickness of the cake, which is a function of the mass of permeate, that passes the membrane. 15 In this case, the continually increasing cake layer (or fouling resistance) can be expressed as follows: The fouling constant (R) depends on the specific cake resistance, the bulk concentration, and the concentration of solutes in the cake layer. 15 The mass of permeate is denoted m p. The fouling resistance is inserted into the resistance-in-series filtration model: 1 J v ) ( R m + R a +Rm p ) ΔP (7) This model can be rewritten as 15 Thus, if the fouling on the membrane surface forms or can be described as a continually growing cake, one should get a straight line when plotting 1/J v versus m p because R m, R a, ΔP, and R are all constants. At high macromolecular concentrations, the osmotic pressure difference across the membrane also has to be taken into account. 16 Because of concentration polarization on the feed side of the membrane, the concentration at the membrane surface will be larger than in the bulk solution. The enhanced concentration results in a lower solvent chemical potential on the feed of the membrane surface compared to the solvent chemical potential on the permeate side. This gives an osmotic back suck effect of solvent that has to be taken into account at high macromolecular concentrations on the feed side. This gradient of solvent chemical potential across the membrane can be expressed as an osmotic pressure difference (Δπ) across the membrane. When the osmotic pressure difference is taken into account, eq 5 can be extended to an osmotic pressure model: The flux in eq 9 is therefore determined by different subresistances in series (R tot) and from an osmotic pressure difference that arises from concentration polarization on the feed side of the membrane. When the concentration polarization phenomenon is the domi- (12) Ho, C.; Zydney, A. L. J. Membr. Sci. 1999, 155, (13) Ho, C.; Zydney, A. L. Ind. Eng. Chem. Res. 2001, 40, (14) Beier, S. P. Pressure DriVen Membrane Processes; Ventus Publishing: Copenhagen, (15) Mulder, M. Basic Principles of Membrane Technology, 2nd ed.; Kluwer Academic: Boston, (16) Jonsson, G. Desalination 1984, 51, R f )Rm p (6) 1 J v ) ( R m + R a ΔP ) + R ΔP m p (8) J v ) 1 R tot (ΔP - Δπ) (9)
 K( C m - C p C b - C p) (10) The mass transfer coefficient (K)")
 will be larger than the bulk concentration (C b) due to concentration polarization.")
115 9344 Langmuir, Vol. 23, No. 18, 2007 Beier et al. nating factor affecting the flux, stagnant film theory can be used to describe the flux dependency on the bulk concentration: 17 J v ) K( C m - C p C b - C p) (10) The mass transfer coefficient (K) is therefore a very important factor describing the level of back diffusion from the boundary layer on the feed side of the membrane. The concentration on the membrane surface (C m) will be larger than the bulk concentration (C b) due to concentration polarization. The permeate concentration (C p) can be neglected if the retention of the membrane is close to 100%. The mass transfer coefficient can be determined from literature correlations. For a stirred cell (in the laminar region), the following correlation can be used: 18 Figure 1. Sketch of the experimental apparatus. Sh ) 0.285(Re) 0.55 (Sc) 0.33 (11) The Sherwood number is a dimensionless mass transfer coefficient (Sh ) Kr/D), which is given by the mass transfer coefficient (K), cell radius (r), and diffusion coefficient of the solute/ macromolecule in the solvent (D). The Reynolds number (Re) is calculated as ωr 2 /ν, where ω is the stirring speed and ν is the kinematic viscosity. The Schmidt number is defined as the ratio between the kinematic viscosity and the diffusivity (Sc ) ν/d). The initial and final water permeabilities of the membranes (before and after adsorption) are also used in the evaluation of the adsorption. The permeability drop is defined as follows: permeability drop ) (l p,initial - l p,final ) 100% (12) l p,initial As a value of the initial water permeability, an average value is used that is given for the two investigated membranes in Table 1. The final permeability is measured (after adsorption) after rinsing the membrane with only water. 3. Material and Methods In this section, the apparatus, solutions, and procedures used for the experimental work are described Apparatus, Materials, and Solutions Experimental Apparatus. A dead-end batch cell is used for the adsorption experiments. The circular membrane area is 44 cm 2, and the pressure in the cell can be established by connecting the cell to a nitrogen gas flask. Permeate is collected in a beaker placed on a balance. A sketch of the system is given in Figure 1. Pressure in the cell is established only when the water permeability of the membranes is measured, when the membrane before each adsorption experiment is chemically cleaned, and during the pressureforced adsorption experiments. During the static adsorption experiments, no pressure is established in the cell, and the batch cell is stored in the refrigerator. Stirring in the cell is turned on only during the water flux measurements and during the pressure-forced experiments Membranes. Two commercial ultrafiltration membranes with different hydrophilicity have been tested. Relevant data for the two membranes are given in Table 1. The PES membrane is more hydrophobic than the ETNA10PP. The difference in contact angles is visualized in Figure 2. (17) Zeman, L. J.; Zydney, A. L. Microfiltration and Ultrafiltration; Marcel Dekker: New York, (18) Blatt, W. F.; Dravid, A.; Michaels, A. S.; Nelson, L. Solute Polarization and Cake Formation in Membrane Ultrafiltration: Causes, Consequeneces, and Control Techniques; Membrane Science and Technology - Industrial, Biological, and Waste Treatment Processes, Columbus Laboratories of the Battelle Memorial Institute in Columbus, Ohio, Oct 21-22, 1969; pp Figure 2. Two dry pieces of the membranes, ETNA10PP to the left and PES to the right. A 10 μl water droplet has been placed on each membrane. In Figure 2, it is seen that the PES membrane is more hydrophobic than the ETNA10PP membrane because the contact angle is larger. The contact angle of the ETNA10PP membrane is around 40 whereas the contact angle of the PES membrane is around The contact angle of a polysulphone film that is very similar to the PES membrane surface had earlier been measured to be around The ETNA10PP membrane is made hydrophilic by introducing a surface modification consisting of grafting a thin layer of hydrophilic polymer onto the PVDF surface. Because of the grafting, covalent bonds are formed between the PVDF membrane and the hydrophilic polymer layer. This ensures the stability of the surface-modified membrane. 5 The water permeability of the PES membrane is around 3 times higher than the water permeability of the ETNA10PP membrane. The water permeabilities of the two membranes are determined as an average from 10 and 7 measurements of the PES and the ETNA10PP membranes, respectively. The standard deviations of the water permeability measurements are also given in Table Membrane Water Permeability. The water permeability (l p) is determined by measuring the water flux (J v) at different pressures between 0 and 2 bar according to eq 4. The water permeability is measured in each experiment before and after the exposure to enzyme solution. The final water permeability is measured after the batch cell is emptied, and the rest of the enzyme solution is removed by rinsing with water Amylase Enzyme Solutions. Solutions of an amylase enzyme called amylase-f have been used. The concentrated enzyme solution is produced by Novozymes A/S. The molecular weight is 55 kda, and the isoelectric point is around 3.5. The solutions were supplied by Novozymes A/S and were diafiltrated with demineralized water to remove salts and other minor components until the conductivity in the permeate is below 0.5 ms/cm. Beside the amylase enzymes, other compounds might be present (e.g., amino acids produced during fermentation or flocculation chemicals such as calcium chloride). However, a vast majority of these compounds are removed by diafiltration. A detailed description can be found elsewhere. 19 Adsorption has been measured in the concentration range from 0.1 to 100 g/l. The solubility of the amylase is above 200 g/l. The ph of the aqueous enzyme solutions is 5.5, which means that the enzymes are negatively charged. Concentration measurements are conducted by the Bradford reagent method. 20 (19) Enevoldsen, A. D; Hansen, E. B.; Jonsson, G. J. Membr. Sci. 2007, 299,
116 Amylase Enzyme Adsorption on Membranes Langmuir, Vol. 23, No. 18, Figure 3. Water flux vs pressure for the PES membrane before and after static adsorption for 144 h at 5 C. Amylase-F concentration ) 50 g/l Adsorption Experiments. Two types of adsorption experiments were conducted: the static adsorption experiments and the pressure-forced adsorption experiments, which are defined as follows: Static adsorption is the adsorption of components from a solution that is in contact with a membrane under atmospheric pressure with no volumetric flux through the membrane. Pressure-forced adsorption is the adsorption of components that occurs during a membrane filtration experiment with volumetric flux through the membrane. Both types of experiments are conducted in a batch cell. During static adsorption, the batch cell ensures that the adsorption takes place only on the skin layer of the membrane and not onto (and into) the support structure on the back side of the membrane. This would not have been the case if a piece of membrane was just immersed in the enzyme solution. However, some adsorption might take place on the pore walls inside the membrane, especially if the membrane has a broad pore size distribution, which seems to be the case for the ETNA10PP membrane (Figure 9) Static Adsorption Experiments. In the static adsorption experiments, the batch cell is used only as a container. The membrane is placed in the bottom, and the solution is contained above the membrane. The permeate outlet of the cell is closed so that no volumetric flux occurs. No pressure above the membrane and no stirring are established. The batch cell with the membrane and the enzyme solution is kept in the refrigerator (to avoid decomposition of the enzymes) for 6 days. This rather long period of time is chosen to ensure that adsorption equilibrium is reached because adsorption can be a time-consuming process, as described earlier. Adsorption experiments have been carried out with different concentrations of the enzyme solution. The experimental procedure is the following: A virgin membrane is placed in the stirred cell. Cleaning is carried out with 300 ml of a 0.125% NaOH solution at 0.5 bar. Approximately ml of permeate is collected. The cleaning temperature is 20 C, and the cleaning time is 1 h. The membrane is rinsed with water. The remaining cleaning solution is removed as the cell is opened and separated. The different parts, including the membrane, are cleaned with demineralized water under a running tap. Initial water permeability is measured. Water (300 ml) is placed in the cell, and the flux is measured at approximately 0.5, 1.0, 1.5, and 2.0 bar. The temperature is 20 C. Adsorption in the refrigerator is carried out for 144 h (6 days) at different enzyme concentrations between 0.1 and 100 g/l. The volume of enzyme solution is 30 ml with no stirring, and the temperature is 5 C. (20) Bradford, M. M. Anal. Biochem. 1976, 72, Removal of enzyme solution followed by gently rinsing the membrane with water for 3 to 4 s under a running tap. The different parts of the batch cell are held under the running tap as well. The final water permeability is measured in a similar way as the initial water permeability. From the initial and final water permeabilities, the permeability drop can be calculated according to eq 12. Furthermore, the adsorption resistance is calculated according to eq 5. The activity of a reference enzyme solution has been measured at Novozymes laboratories before and after it has been placed in the refrigerator for 6 days. This is done to detect any loss in enzyme activity during the adsorption experiment Pressure-Forced Adsorption Experiments. In this case, the adsorption is conducted during concentration of the enzyme solution under a pressure of 2 bar. The flux is measured by collecting permeate in a beaker placed on the balance. The experimental procedure is as follows: Virgin membrane is placed in the batch cell. Cleaning is carried out with 300 ml of a 0.125% NaOH solution at 0.5 bar. Approximately ml of permeate is collected. The cleaning temperature is 20 C, and the cleaning time is 1 h. The membrane is rinsed with water. The remaining cleaning solution is removed, and the cell is opened and separated. The different parts, including the membrane, are cleaned with demineralized water under a running tap. Initial water permeability is measured. Water (300 ml) is placed in the cell, and the flux is measured at approximately 0.5, 1.0, 1.5, and 2.0 bar. The temperature is 20 C. Enzyme solution (300 ml) is placed in the stirred cell (300 rpm), and the pressure is set to 2 bar. Filtration is continued until 150 g of permeate was collected. The enzyme concentrations are 5 and 50 g/l, and the filtration temperature is 20 C. Removal of remaining enzyme solution followed by gently rinsing the membrane with water for 3 to 4 s under a running tap. The different parts of the batch cell are held under the running tap as well. The final water permeability is measured in a similar way as the initial water permeability. In the pressure-forced adsorption experiments, the permeability drop is again calculated according to eq 12. From the static adsorption experiments, the adsorption resistance is known. Because the membrane resistance is also known, from the initial permeabilities given in Table 1, the fouling resistance can be calculated according to eq SEM Picture Analysis. Scanning electron microscopy (SEM) pictures have been made in the back-scattering mode of the two membrane types under different conditions: with clean surfaces (cleaned with 0.125% NaOH solution); with surfaces at which enzymes have been adsorbed for 144 h from a 100 g/l solution in the refrigerator (static adsorption); and with surfaces at which enzymes have been adsorbed during the concentration of enzyme solution from 50 to 100 g/l at 2 bar (pressure-forced adsorption). These pictures have been taken as a supplement to the permeability data. The pictures are present in Figure Overview of Experimental Work. An overview of the different experiments and analysis is given in Table Results and Discussion 4.1. Permeability Drop and Adsorption Resistance. In Figure 3, the initial and final water permeabilities are depicted for one of the static adsorption experiments. The membrane water permeability (l p) corresponds to the slope of the fitted line according to Darcy s law. 14 In Figure 3, it is seen that for this amylase-f concentration the final water permeability is 59 L/(m 2 h bar). In this case, the initial water permeability is 219 L/(m 2 h bar), and according to Table 1, the average value of the PES membrane water permeability is 207 L/(m 2 h bar). According to eq 12, this gives a permeability
117 9346 Langmuir, Vol. 23, No. 18, 2007 Beier et al. Figure 4. Adsorption isotherms. Permeability drop and adsorption resistance vs concentration for static adsorption experiments on the two membrane types at constant temperature (5 C). Figure 5. Linear plot of the static adsorption according to the Langmuir equation (eq 3). Concentration divided by permeability drop (Conc./Perm.drop) vs concentration and concentration divided by adsorption resistance (Conc./R a) vs concentration at constant temperature (5 C). drop of 71%. The permeability drop for all experiments listed in Table 2 are calculated according to eq 12. Beside the permeability drop, the adsorption resistance (R a) toward mass transport through the membrane can be determined by using eq 5. This adsorption resistance is also used to express the degree of adsorption. From the initial water permeability, the membrane resistance (R m) is determined because at this stage the adsorption resistance and the fouling resistance (R f) are both zero. The membrane resistance is calculated on the basis of the average water permeability value given in Table 1. The total resistance (R tot) toward transport is determined on the basis of the final water permeability. In the static adsorption experiments, the fouling resistance is assumed to be zero. Thus, the adsorption resistance can be calculated as the difference between the total resistance and the membrane resistance. This has been done for all concentrations listed in Table 2 for both membrane types. Figure 6. Flux and fouling resistance vs collected mass of permeate (m p) during the pressure-forced adsorption experiments on the two different membranes at low enzyme concentration (5-10 g/l). Temperature ) 20 C, P ) 2 bar Static Adsorption. The permeability drop and the adsorption resistance can, as mentioned, be translated into a relative measurement of the adsorption. To determine if the static adsorption follows the Langmuir theory, these terms are plotted in Figure 4 at different concentrations. The adsorption isotherms have the shape of a Langmuir isotherm. However, there is a clear difference in the level of permeability drop and adsorption resistance between the PES and the ETNA10PP membrane. The maximum permeability drop and adsorption resistance are around 3 times larger for the PES membrane compared to those for the ETNA10PP membrane. The adsorption for the PES membrane increases from around 40 to 60% when the concentration increases from 0.5 to 10 g/l. The curve levels out at a concentration of 30 g/l, where the permeability has dropped to around 70% from its initial value and the adsorption resistance has reached a value of m 2 h bar/l. The permeability drop and adsorption resistance for
118 Amylase Enzyme Adsorption on Membranes Langmuir, Vol. 23, No. 18, Figure 7. 1/J v versus m p during the pressure-forced adsorption experiments on the two different membranes at low enzyme concentration (5-10 g/l). Temperature ) 20 C, P ) 2 bar. Figure 8. Flux vs ln(c b) according to the stagnant film theory for the high-concentration pressure-forced experiments. Enzyme concentration ) g/l, P ) 2 bar. the ETNA10PP membrane are much smaller. At a concentration of 10 g/l, the permeability has dropped around 20% from the initial value, which is around the value of the maximum permeability drop. The adsorption resistance for the ETNA10PP membrane is also much smaller than for the PES membrane with a maximum value of around m 2 h bar/l. The activity analysis of the enzyme solution showed no change in activity during the 6 days in the refrigerator. Thus, the enzymes are not degraded during the adsorption experiments at 5 C. To determine whether the Langmuir theory (eq 2) actually describes the adsorption, the data in Figure 4 are plotted according to the linear form of the Langmuir adsorption theory (eq 3). In Figure 5, the concentrations divided by the permeability drop and the adsorption resistance are plotted as a function of the concentrations, respectively. In Figure 5, it is seen that the linear form of the Langmuir isotherm fits the data for both membranes, regardless of whether the plots are based on the permeability drop or the adsorption resistance. This means that the Langmuir theory can indeed describe the adsorption over the entire concentration range, even though the membrane surfaces are not totally homogeneous as assumed in the derivation of the theory. Because the Langmuir theory describes the adsorption data well, we conclude that the static adsorption of amylase-f on the two different UF membranes consists of monolayer coverage. From the linear plots, the maximum static adsorption Γ max (maximum static permeability drop or maximum static adsorption resistance) and the adsorption equilibrium constant k can be determined from eq 3. These terms are determined from the slopes and the intercepts of the linear plots in Figure 5, respectively. The results are given in Table 3. The maximum static adsorption is around 3 times larger for the PES membrane compared to that for the ETNA10PP membrane. This shows that the degree of adsorption is significantly smaller on the ETNA10PP membrane than on the PES membrane, probably because of a more hydrophilic surface. This is in agreement with the results found by Wei and coworkers. 5 Because of the large adsorption on the PES membrane, the amylase-f molecules must be more closely packed on the PES surface than on the ETNA10PP surface. The adsorption equilibrium constants are determined from the intercepts with the y axis (Figure 5). The equilibrium constants, based on both the permeability drop and the adsorption resistance, have approximately the same value for the two different membranes except for one estimation, which is smaller. The Gibbs adsorption energy is related to the adsorption equilibrium constant; 3 therefore, the amylase-f must be attached to the adsorption sites on the PES membrane and on the ETNA10PP membrane, respectively, at approximately equal strength if the adsorption equilibrium constants are assumed to be at the same level. Thus, the number of adsorption sites on the ETNA10PP membrane seems to be less than on the PES membrane because the maximum static adsorption is 3 time larger for the PES membrane. This also supports the statement of the amylase-f molecules being more closely packed on the PES surface Pressure-Forced Adsorption. Pressure-forced adsorption experiments have been conducted for both membrane types during the collection of 150 g of permeate from an initial bulk volume of 300 ml, as seen in Table 2. The experiments are conducted at 20 C. The permeability of the membranes is measured before and after each experiment similar to the static adsorption experiments, as described earlier. The permeability drop for the low concentration pressure-forced adsorption experiments is shown in Table 4. It is seen in Table 4 that during filtration the maximum static adsorption is exceeded for both membranes, even at low enzyme concentrations. The static adsorption is measured at 5 C, and the pressure-forced adsorption is measured at 20 C. However, according to the Gibbs adsorption equation (eq 1), a higher temperature would result in a lower adsorption if the change in surface tension with concentration (dγ/dc) is assumed to be more or less constant at the two temperatures. Thus, the higher adsorption (permeability drop) for the pressure-forced adsorption measured at the higher temperature emphasizes that the maximum static adsorption is actually exceeded at the pressure-forced conditions. The higher permeability drop in the pressure-forced condition is likely due to a higher concentration on the membrane surface during filtration (concentration polarization), which leads to coverage of the surface beyond a monolayer. In this case, the Langmuir adsorption theory can no longer be applied, and permeability drops above the maximum static adsorption can be observed. The number of adsorbed macromolecules on membranes can be determined in many different ways, as extensively discussed in the literature. 4-10,21 The adsorption in these cases could be described by the Langmuir adsorption theory regardless of whether it is measured under static or dynamic conditions. In our case, this is in agreement only in the static case. The Langmuir (21) Bowen, W. R.; Hughes, D. T. J. Membr. Sci. 1990, 51,
 Clean membrane surface, (ii) static adsorbed membrane surface (100 g/l enzyme solution at 5 C for 144 h), and (iii) pressure-forced adsorbed membrane surface (50 g/l enzyme solution concentrated")
119 9348 Langmuir, Vol. 23, No. 18, 2007 Beier et al. Figure 9. SEM pictures (backscattered mode) of the ETNA10PP and PES membranes. Magnification on the actual pictures is (i) Clean membrane surface, (ii) static adsorbed membrane surface (100 g/l enzyme solution at 5 C for 144 h), and (iii) pressure-forced adsorbed membrane surface (50 g/l enzyme solution concentrated to 100 g/l at 20 C). White lines corresponding to 1 μm are present at each SEM picture. Table 2. Overview of Conducted Experiments and Analysis membrane static adsorption pressure-forced adsorption SEM pictures ETNA10PP enzyme concentration: 0, 0.1, 1, 10, 15, 20, 30, 50, 75, 100 g/l temperature: 5 C pressure: atmospheric enzyme concentration: 5, 50 g/l temperature: 20 C pressure: 2 bar clean static adsorbed pressure-forced adsorbed PES enzyme concentration: 0, 0.5, 2, 10, 30, 50, 100 g/l temperature: 5 C pressure: atmospheric adsorption theory is not able to describe the permeability drop during the pressure-forced experiments, in which a volumetric flux through the membrane exists. It is interesting that because of the adsorption/fouling the two membranes behave similarly during filtration even though the initial water permeability of the PES membrane is around 3 times larger than for the ETNA10PP membrane even at low enzyme concentrations. The flux is depicted in Figure 6 at low enzyme concentration (concentration from 5 to 10 g/l) as a enzyme concentration: 5, 50 g/l temperature: 20 C pressure: 2 bar clean static adsorbed pressure-forced adsorbed function of the collected mass of permeate for two of the pressureforced experiments. The fouling resistance is depicted as well. The fouling resistance is calculated according to eq 5 in which the adsorption resistances (the maximum static adsorption resistance) and the membrane resistances are known from the static adsorption experiments. Thus, the level of maximum static adsorption resistance is assumed to be the same in the pressureforced case, and thus the fouling resistance can be calculated according to eq 5.
120 Amylase Enzyme Adsorption on Membranes Langmuir, Vol. 23, No. 18, Table 3. Results from Static Adsorption Experiments at Constant Temperature (5 C), Maximum Static Adsorption (Maximum Static Permeability Drop or Maximum Static Adsorption Resistance), and Adsorption Equilibrium Constant membrane maximum static adsorption Γ max, (1/slope) adsorption equilibrium constant k (1/(intercept Γ max) ETNA10PP (perm. drop) Table 4. Permeability Drop during Pressure-Forced Adsorption and Maximum Static Permeability Drop during Static Adsorption for the ETNA10PP and the PES Membranes a membrane permeability drop (%) (pressure-forced adsorption) It is seen in Figure 6 that even though the PES membrane has a high initial water permeability (Table 1), in practice this has no effect. Actually, the ETNA10PP membrane has a slightly larger flux. However, the flux during the amylase-f filtration is approximately the same for the two membranes at the end of the experiment, in spite of the initial difference in water permeability. It is also interesting that the fouling resistances during the experiments are almost the same for the two membranes. From the static adsorption experiments, we saw that the maximum static adsorption resistance is around 3 times larger for the PES membrane, which is attributed to a more dense adsorbed monolayer on the PES membrane. However, because the fouling resistance level and rate of increase are almost the same for the two membranes, the fouling layer on the adsorbed monolayer yields the same resistance whether it is on the PES or the ETNA10PP membrane. Because the increase in fouling resistances is almost identical for the two membranes, the fouling mechanisms on the adsorbed monolayer must be equal and independent of the membrane type. The fouling resistances versus mass of permeate increase more or less linearly, which is in agreement with the increasing resistance of a growing cake layer according to eq 6. This indicates that the fouling appears as cake-layer formation at the low enzyme concentration. This is further investigated in Figure 7, which shows a plot of 1/J v versus m p according to eq 8. In Figure 7, it is seen that for both membranes almost straight lines with nearly equal slopes are obtained. Therefore, fouling during the pressure-forced experiments actually occur as or can be described by cake-layer formation. This is emphasized by the almost equal slopes, which shows that fouling parameter R is equal for both membranes and therefore independent of the membrane type. Thus, the increase in fouling resistance depends on the volume of permeate and is independent of the membrane itself. At these rather low enzyme concentrations (5-10 g/l), the osmotic pressure is neglected because it is assumed to be very low compared to the hydrostatic pressure. According to eq 8, the y-axis intercepts are related to the sum of the membrane resistance and the maximum static adsorption resistances. The two intercepts are almost equal, which is in agreement with results from the static adsorption experiments. It has been shown that at low enzyme concentration the flux can be described by a resistance-in-series model (eq 7) with increasing fouling resistance that is dependent on the mass of permeate that passes the membrane. However, the osmotic pressure difference has to be taken into account at higher ETNA10PP (R a) PES (perm. drop) PES (R a) 23% m 2 h bar/l 75% m 2 h bar/l 0.75 L/g 0.58 L/g 0.62 L/g 0.15 L/g maximum static permeability drop (%) (static adsorption) b ETNA10PP PES a Concentration from 5 to 10 g/l. b From Table 3. macromolecular concentrations at which the concentration polarization can play the role expressed as an osmotic pressure difference that has to be subtracted from the hydrostatic pressure difference (eq 9). 16 Therefore, when concentration polarization is the main factor determining the flux (when the osmotic pressure of the macromolecular solutions cannot be neglected), it can be shown that the flux is mainly determined by the bulk concentration. This can be shown for the pressure-forced experiments conducted with an initial bulk concentration of 50 g/l. Data for those high-concentration pressure-forced experiments are plotted according to stagnant film theory (eq 10). Because straight lines for both membrane types are obtained (Figure 8) and because they are almost completely overlapping, it can be concluded that at these rather high enzyme concentrations, concentration polarization and thus the osmotic pressure difference determine the flux. Furthermore, the concentration polarization is independent of the membrane type. From the slope, the mass transfer coefficient is 19 L/(m 2 h). With a stirring speed in the cell of 300 rpm, the flow in the cell is laminar, and from the flow and mass transfer literature correlation (eq 11), a mass transfer coefficient of 11 L/(m 2 h) is obtained. This is rather close to the experimentally determined mass transfer coefficient, which emphasizes that at these concentrations the osmotic pressure difference caused by concentration polarization is the main term determining the flux. Using the osmotic pressure model combined with the stagnant film theory (eqs 9 and 10) and inserting J v ) 0, the concentration at which the osmotic pressure equals the hydrostatic pressure can be found. 16 From Figure 8, it can be seen that an enzyme concentration of around 150 g/l (C ) exp(95/19)) gives an osmotic pressure of 2 bar, which equals the hydrostatic pressure difference and thus gives zero flux. Overall, it has been shown that when the immediate adsorbed monolayer has been established, a growing fouling layer is formed. The formation of this fouling layer can be described as a cakelayer formation. This cake-layer gives a subresistance that when added to the membrane resistance, and the adsorption resistance gives the total resistance toward transport through the membrane. Furthermore, it has been shown that at higher enzyme concentrations the concentration polarization results in osmotic pressure differences that cannot be neglected. Under these conditions, the flux is mainly determined by the bulk concentration and thus the concentration polarization. Cake-layer formation and concentration polarization are independent of the membrane type. The effect of static adsorption also affects cross-flow systems. Jonsson et al. 22 have reported flux decreases due to BSA adsorption in cross-flow ultrafiltration under both static and pressure-forced conditions. The retention of amylase-f is also measured at the end of the pressure-forced experiments. For both membranes, the retention at the end is very close to 100%. This means that the two membranes act almost equally with the same retention and the (22) Jonsson,G.;Johansen,P.;Li,W.Proceedings of The CEE-Brazil Workshop on Membrane Separation Processes, Rio de Janeiro, Brazil, May 3-8, 1992; pp
121 9350 Langmuir, Vol. 23, No. 18, 2007 Beier et al. same flux and indicates that the membrane properties of the two investigated UF membranes in our experiments are mainly determined by the (adsorbed) monolayer formed on the membrane surface (often referred to as a secondary membrane) rather than by the virgin membrane properties. It should be noted that the initial retention for the ETNA10PP membrane was measured to be approximately 97% whereas the initial retention for the PES membrane is measured to be close to 100%. The initial retentions were measured after 5 min of filtration (concentration 5-10 g/l), and after 20 min of filtration (concentration 5-10 g/l), the retention of the ETNA10PP membrane was close to 100%. The retentions are determined on the basis of enzyme concentration measurements of bulk and permeate samples, as described earlier. Thus, the retention of the ETNA10PP membrane increases relatively quickly to approximately 100% during filtration, resulting in a membrane with very similar properties compared to those of the PES membrane. This was also concluded by Wei and co-workers, who measured very similar BSA fluxes for the two UF membranes during filtration at 2 bar and a BSA concentration of 0.1 wt %, even though the initial water flux of the PES membrane is much larger than for the ETNA10PP membrane. 5 Wei and co-workers 5 have described anti-fouling behavior during filtration for the ETNA10PP membrane. This is also seen in our data in Figure 6, where the fluxes are at the same level even though the initial water flux at 2 bar is around 3 times larger for the PES membrane. Thus, the maximum static adsorption (permeability drop and adsorption resistance), shown in Figure 4 and Table 3, gives an idea as to what extent the flux decreases during filtration from its initial water flux. The maximum static permeability drop of 23% and maximum static adsorption resistance of m 2 h bar/l for the ETNA10PP membrane result in a relatively smaller flux decrease from the initial water flux during filtration (Figure 6) compared to that for the PES membrane with a maximum static permeability drop of 75% and a maximum static adsorption resistance of m 2 h bar/l SEM Picture Analysis. SEM pictures have been taken for both membranes after they have been exposed to either static or pressure-forced adsorption. A picture of a chemically cleaned membrane was also taken. The pictures are shown in Figure 9. The surfaces of the ETNA10PP and PES membranes are very different. The pictures of the clean surfaces show that the PES membrane has a more open structure compared to that of the ETNA10PP membrane. The pores are distributed more evenly on the clean PES membrane. The ETNA10PP membrane has a denser surface, which is consistent with the lower water permeability measured for that membrane compared to that for the PES membrane. The water permeability of the PES membrane is around 3 times larger than that of the ETNA10PP membrane, according to Table 1. Furthermore, the pores are not as evenly distributed for the ETNA10PP membrane. Some areas appear to be denser than others, and some large pores are present, which could be the reason for the lower initial retention (97%) measured for this membrane compared to the retention of almost 100% measured for both membranes after 20 min of the pressureforced experiments. Also, the fact that the ETNA10PP membrane relatively quickly reached a retention of around 100% is in agreement with Jonsson et al., 22 who reported relatively large pores to be blocked by protein adsorption, which therefore changed the retention of the membrane. After static adsorption, the surface of the PES membrane appears to be denser than the clean membrane. The difference is clearer for the ETNA10PP membrane, where the surface has a denser appearance and the pore size has apparently decreased, which can explain the increase in retention after pressure-forced adsorption. The static adsorption gives monolayer coverage of the membrane surfaces. Whether the monolayer packing of molecules on the PES surface is denser than on the ETNA10PP surface is difficult to conclude from the SEM pictures. It shall be noted that denaturation is likely to occur for the vacuum under which the samples are prepared and coated with gold. Thus, the actual SEM pictures can be disturbed by this. For both membranes, a change in the surface structure has taken place after pressure-forced adsorption. The membranes have a denser surface, and a large number of the pores have been blocked or narrowed by enzymes. The change in the surface structure is more pronounced for the ETNA10PP membrane than for the PES membrane after pressure-forced adsorption. There is a resemblance to the surface structure of the PES membrane regardless of whether it has been exposed to static or pressureforced adsorption. There is a clear difference in the surface structure of the ETNA10PP membrane. The surface exposed to static adsorption has a granulated surface, whereas the pores have an oblong shape in the surface exposed to pressure-forced adsorption. The permeability drop after the pressure-forced experiments exceeds the maximum static permeability drop during static adsorption. This can be explained by the addition of a fouling resistance, which is seen in Figure 6. Therefore, it can be concluded that the adsorption (or rather fouling) during the pressure-forced experiments goes beyond monolayer coverage and the flux and mass of permeate data are in agreement with a cake filtration model. The SEM pictures seem to support this statement because the surfaces of the pressure-forced membranes seem to be denser and different in appearance than the surfaces of the static-adsorbed membranes. In particular, exceeding the monolayer coverage under the pressure-forced condition for the ETNA10PP membrane is visualized by the white spaghetti areas, but the surface of the pressure-forced PES surface also seems to be much denser than under the static condition. 5. Conclusions Static adsorption experiments were conducted with two different ultrafiltration membranes. The following can be stated: An easy method to measure static adsorption on a membrane surface in terms of a permeability drop or an adsorption resistance has been developed. The method ensures that the adsorption is facilitated only from the skin-layer side of the membrane and not from the support-layer side. It has been shown that the static adsorption of a 55 kda amylase-f enzyme onto two different polymeric ultrafiltration membranes follows the Langmuir adsorption theory. Thus, static adsorption consists of monolayer coverage on the surface. From the adsorption isotherms, the maximum static adsorption (permeability drop and adsorption resistance) is determined. The maximum static adsorption is more than 3 times larger on the more hydrophobic surface (the PES membrane) compared to that on the more hydrophilic surface (the ETNA10PP membrane). On the basis of the maximum static permeability drops, the value is around 3 (75%/23%), and on the basis of the maximum static adsorption resistance, the value is also around 3 (0.014 m 2 h bar/l/ m 2 h bar/l). The amylase-f molecules must therefore be more closely arranged and packed in the monolayer on the PES surface than on the ETNA10PP surface. In addition, some filtration experiments have been conducted to investigate the so-called pressure-forced adsorption. On the basis of these experiments, the following can be stated: The permeability drop during filtration exceeds the maximum static permeability drop, even at low enzyme concentration. Thus,
122 Amylase Enzyme Adsorption on Membranes Langmuir, Vol. 23, No. 18, the surfaces are covered beyond a monolayer, which is also seen by the increasing fouling resistance during filtration. The fouling resistances are at the same level for the two membranes during filtration. Fouling onto the absorbed monolayer can be described as a cake-layer formation with a resistance that increases with the amount of permeate that passes the membrane. The exceeding of the monolayer coverage and cake/fouling formation are supported by SEM. The two membranes show almost equal properties during filtration, even at low enzyme concentration. Thus, the very high initial water flux for the PES membrane has no effect in practice because the flux during filtration and the final flux are almost equal to the flux of the ETNA10PP membrane that has a much lower initial permeability. This is attributed to the difference in static adsorption for the two membranes. At higher enzyme concentrations, concentration polarization has to be taken into account. High enzyme concentrations yield significant osmotic pressures; therefore, the flux can be described from stagnant film theory and the osmotic pressure model. Overall, the static adsorption on the membrane contributes to the total resistance to transport through the membrane. The static adsorption is highly dependent on the membrane surface chemistry, but other factors such as cake-layer buildup and concentration polarization also have to be taken into account when the performance of a certain membrane is to be evaluated. The latter two phenomena are independent of the type and surface chemistry of the membrane. List of Symbols C concentration (g/l) D diffusion coefficient (m 2 /s) J v volumetric flux (L/(m 2 h)) k adsorption equilibrium constant (L/g) K mass transfer coefficient (L/(m 2 h)) l p membrane permeability (L/(m 2 h bar)) m p mass of permeate (g) P pressure (bar) r cell radius (m) R gas constant (J/(kg K)) R m,a,f,tot resistance (m 2 h bar/l) T absolute temperature (K) Greek Symbols R fouling constant (m 2 h bar/(l g)) Γ adsorption (permeability drop) (%) Γ max maximum static permeability drop (%) Γ max maximum static adsorption resistance (m 2 h bar/l) γ surface tension (J/m 2 ) ν kinematic viscosity (m 2 /s) π osmotic pressure (bar) ω stirring speed (rad/s) LA701524X
123 Critical Flux Determination by Flux-Stepping Søren Prip Beier and Gunnar Jonsson CAPEC, Dept. of Chemical and Biochemical Engineering, Technical University of Denmark, DK-2800 Kgs. Lyngby, Denmark DOI /aic Published online November 2, 2009 in Wiley InterScience ( In membrane filtration related scientific literature, often step-by-step determined critical fluxes are reported. Using a dynamic microfiltration device, it is shown that critical fluxes determined from two different flux-stepping methods are dependent upon operational parameters such as step length, step height, and flux start level. Filtrating 8 kg/m 3 yeast cell suspensions by a vibrating m pore size microfiltration hollow fiber module, critical fluxes from to m/s have been measured using various step lengths from 300 to 1200 seconds. Thus, such values are more or less useless in itself as critical flux predictors, and constant flux verification experiments have to be conducted to check if the determined critical fluxes can predict sustainable flux regimes. However, it is shown that using the step-by-step predicted critical fluxes as start guesses, in our case, in constant flux verification experiments for 5 and 1/2 hours, a sustainable flux was identifiable. VC 2009 American Institute of Chemical Engineers AIChE J, 56: , 2010 Keywords: critical flux, dynamic microfiltration, yeast cells, step length, flux-stepping, bioseparation, membrane separations Introduction The concept of critical flux in membrane filtration processes has in the last 15 years gained more and more interest as a way of controlling fouling to achieve sustainable operation. When talking about critical fluxes, sustainable flux regimes are defined as sub-critical flux regions that are sustainable from a constant flux and TMP point of view. By operating at sub-critical flux, the need for membrane cleaning, necessary due to enhanced hydraulic resistance will be reduced. In that way, for example macromolecular transmission in microfiltration can be improved. 1 In 2006, an indepth review about critical and sustainable fluxes was published by Bacchin et al. 2 In this review it is underlined that three different forms of the critical flux should be distinguished according to the level of hydraulic resistance: The strong form, the weak form, and the irreversible form. The strong and weak forms of the critical flux are well known and described in the literature. In the irreversible form of the Correspondence concerning this article should be addressed to G. Jonsson at gj@kt.dtu.dk. VC 2009 American Institute of Chemical Engineers critical flux, however, the hydraulic resistance just has to be kept below the sum of a membrane resistance, an eventual adsorption resistance, and a reversible fouling resistance not to be exceeded. When using the search words critical flux, membrane, or?filtration, almost 200 papers appear, published since 1979 (using the DADS database, Technical Knowledge Center, Technical University of Denmark, February 2008). The majority of all critical flux determinations reported in the literature are conducted using step-by-step methods, in which either the transmembrane pressure (TMP) or the flux is stepwise increased, and the response (either flux or TMP) is monitored. This method is easy to apply, which might explain its popularity, and out of the almost 200 mentioned critical flux papers, the step-by-step method is applied in more than 100 of these papers to determine critical fluxes. However, a main disadvantage of the step-by-step technique is that it only measures the critical flux of the dominant fouling species. 3 5 Furthermore, when using this method, the determined critical fluxes can vary quite much depending on the flux start level J 0, step length sl, and step height sh although, only very few publications actually focus on this. The step height was reported by Le Clech et al. 6 to be the AIChE Journal July 2010 Vol. 56, No
124 Figure 1. Sketch of two different approaches for critical flux determination. Step up method and step up down method. J 0: Initial flux level, sh: step height, sl: step length. main parameter impacting the fouling rate (dp/dt), using an MBR system processing sewage, whereas the step length has been reported by Kwon and Vigneswaran 7 not to influence the determined critical fluxes for crossflow microfiltration of latex particles with step lengths of 1200 and 2400 seconds. Neither did Guo et al. 8 detect a difference in the determined critical fluxes in crossflow microfiltration of synthetic wastewater when using step lengths of either 2400 or 7200 seconds. Also, Le Clech et al. 6 only detected minor differences in the determined critical fluxes for step lengths of 300, 600, 900, and 1800 seconds in MBR filtration of synthetic sewage. Only when the step length was increased to 7200 seconds, a significant change in the critical flux could be detected, whereas Choi and Dempsey 9 observed the determined critical fluxes to decrease when the step length was increased from 600 over 1200 to 1800 seconds, using a low pressure membrane system processing raw water. The aims of this article are (i) to show that one cannot be sure to use a critical flux value based on one single step-bystep measurement to actually determine a critical flux, (ii) to show that a step-by-step determined critical flux has to be verified against constant flux experiments, and (iii) to emphasize that when talking about critical fluxes and sustainable flux regimes, a time period for sustainability has to be assessed. Two different flux-stepping critical flux determination methods are tested using our dynamic microfiltration system. It must be emphasized that we use the term critical flux as the outcome of the flux-stepping experiments, although it is later shown that many of these determined values actually are not real critical fluxes able to predict long term behavior. A step up method and a step up down method are tested using different values of the step length to evaluate the response in the determined critical fluxes. Furthermore, the onset of irreversible fouling will be tried to be determined using the step up down method. The experimentally determined critical fluxes are verified against constant flux experiments at, above and below, the average critical fluxes to check if one actually can predict sustainable behavior for an extended period, which in this case is 5 and 1/2 hours. Suspensions of bakers yeast cells are being processed. This medium is chosen to use some sort of a model fluid to simulate fermentation broth or other biological media as we in our earlier work also have added macromolecules to such suspensions. 1 Furthermore, our later results 10 are also obtained using yeast cell suspensions containing different macromolecules. Our system is in many contexts thought to be coupled to treatment of such media. Flux-stepping concept When the critical flux is determined by a step-by-step method, the flux is often controlled, and the corresponding TMP is monitored. The flux is increased in steps and at a point, at which the TMP increase exceeds some defined threshold limit, the critical flux is said to be exceeded. However, as pointed out by Bacchin et al., 2 it would be more correct to talk about this level as a sustainable flux beause the transition detected by this method is often the transition from slow fouling to rapid fouling. Still, we will use the term critical flux to emphasize that this is the flux one has to stay below to achieve sustainable filtration. Two different flux-step approaches are sketched in Figure 1. These two methods are chosen, as they are both well known and often reported in the literature. Important parameters in both methods are the initial flux level (J 0 ), the step height (sh), and the step length (sl). Le Clech et al. 6 introduced three key TMP related parameters, useful to determine the onset of fouling, for a step up method. In this work, these parameters have also been applied for a step up down method. In Figure 2, the concept is sketched for both methods. The average of the TMP values for a flux step is denoted P avg, whereas dp/dt is the slope of the linear regression line covering the TMP data of a flux step. The latter parameter is often referred to as the fouling rate. The sudden increase in TMP in the transition from one flux step to another is denoted DP 0 and can be determined as the distance between the linear regression lines for the two particular flux steps at the time of transition. The critical flux is determined from plots of P avg, dp/dt, and DP 0 vs. the flux as the point where the curves break. The advantage of the step up down method is that, in theory, fouling irreversibility can be recognized at a certain flux level as each flux level is touched two times. Thus, the onset of irreversible fouling, irreversibility form of critical flux can be identified by plotting the difference in P avg, J, and dp/dt, (P avg,n,ii P avg,n,i ), (dp/dt n,ii dp/dt n,i ), and (J n,i J n,ii ), as function of the flux. This method, distinguishing the reversible fouling and the irreversible fouling, is earlier described by Espinasse et al DOI /aic Published on behalf of the AIChE July 2010 Vol. 56, No. 7 AIChE Journal

 that sucks permeate through the fibers at a constant rate.")
125 Figure 2. TMP related key parameters. Upper plot: Step up method. P avg, dp/dt, and DP 6 0. Lower plot: Step up down method. P avg and dp/dt. n: number of the flux step J n. Materials and Methods Apparatus and feed suspensions The vibrating microfiltration system, often referred to as a dynamic microfiltration system, used in this work consists of a module with 9 hollow fibers placed vertically in a bundle. The system is sketched in Figure 3. The hollow fibers are all closed in the bottom ends by a steel plate. The top ends of the fibers are, via a permeate gap and the permeate pipe, connected to a suction pump (permeate pump) that sucks permeate through the fibers at a constant rate. Permeate is collected in a beaker on an electronic scale connected to a PC. Permeate is manually poured back to the feed tank when the volume in the permeate beaker is around 100 ml. The permeate pump is controlled by a PC, and the corresponding TMP is monitored and logged by the PC by use of a pressure transducer. The module is placed in a plastic cylinder connected to a feed tank. The feed fluid (3 liters in total) is circulated between the feed tank and module cylinder by a feed pump at very low pumping rate, corresponding to a velocity in the module cylinder below m/s. The temperature is monitored during the experiment by a thermometer in the feed tank, and the temperature is kept constant by a thermostatic regulation on the feed side. The membrane module can be vibrated in the module cylinder at variable frequency and amplitude by a rotation head, and the frequency and amplitude can be varied independently. Suspensions of bakers yeast cells are filtrated. Solutions contained 8 kg/m 3 dry weight bakers yeast. The suspensions were all buffered to a ph of 6.3 by adding 100 ml of 30 mm phosphate buffer (KH 2 PO 4 /Na 2 HPO 4 7H 2 O), which yield a feed buffer concentration of 1 mm. Relevant membrane parameters are listed in Table 1 together with the module hydrodynamic parameters used in this work. The skin layer is located on the outside of the fibers, which are made of a polyethersulphone (PES) and polyvinylpyrrolidone (PVP) blend in a 98/2% ratio. PVP is added to make the fibers more hydrophilic as hydrophilic membranes tend to foul less. The average water permeability of the clean membrane module was measured to m/(s Pa) with a standard deviation of 13% based on 16 measurements. Neither an increasing nor a decreasing tendency of the water permeability was observed during the experimental work. Between each experiment, the membrane module was chemically cleaned with a 2% alkaline solution (P3 Ultrasil-141) for 30 minutes at 50 C. Improvements of the system have been made compared with the system used and described earlier. 1,12 The number of fibers has been decreased from 54 to 9. The membrane area/module volume ratio has, therefore, been decreased, but the modified configuration makes it much easier to do reparation in case of a single fiber breakage. The liquid level above the module has also been increased from m to m. In the old system, with a liquid level above the module of only m, air bubbles were induced and spread out in the whole module cylinder because of the fast vibrating module. The air bubbles might have disturbed the picture so that the effect of the pure vibrations was not clear. In the new system, with a liquid level of m above the module, no air bubbles are induced at the liquid Figure 3. Sketch of the experimental apparatus. [Color figure can be viewed in the online issue, which is available at AIChE Journal July 2010 Vol. 56, No. 7 Published on behalf of the AIChE DOI /aic 1741
126 Table 1. Characteristics of the Membrane Module and Hydrodynamic Conditions During the Experimental Runs Membrane Number Length of Total Membrane Permeability of Material of Fibers Fibers (m) Area (m 2 ) Pore Size (m) Module [m/(s Pa)] PES/PVP (98/2%) % Feed flow velocity (m/s) Vibration frequency (s 1 ) Vibration amplitude (m) Average surface shear rate (s -1 ) Temperature ( C) Bakers yeast concentration (kg/m 3 ) surface. Though air bubbles are often reported to reduce fouling in MBR systems, we focus on investigating effects of pure vibrations with our system so the elimination of air bubbles is an advantage from that point of view. Experimental Procedures All experiments were conducted at the same hydrodynamic and physical conditions as listed in Table 1. The vibration frequency and amplitude of 20 s 1 and m, respectively, can be calculated into an average surface shear rate of 1235 s 1 according to the fluid dynamical equation of our previous work. 12 The mass flow of permeate and TMP were logged every 4th second in all experiments, and the feed recirculation velocity was kept very low, below m/s in the module cylinder between the module and the feed tank. The operational parameters for the critical flux determination experiments are listed in Table 2. Each experimental run was repeated three times. As a limit for acceptable fouling rate (dp/dt), we use a value of 1.1 Pa/s (40 mbar/h), which we have defined and used in a previous study, in which critical fluxes were determined using a step up down method, for the same type of feed suspension. 12 This limit indicates the shift from slow fouling to rapid fouling. The values of the flux start level, step length, and step height were chosen at the same level as for many earlier reported critical flux studies. Constant suction experiments for 5 and 1/2 hours were also conducted to verify the experimentally determined critical fluxes. Each constant suction experiment was conducted three times. Experiments were conducted at, above and below, the average experimentally determined critical flux: Sub-critical flux: m/s below the average determined critical flux (Cho and Fane 13 state that extended operation at a fixed sustainable flux should be possible as long as the flux is substantially below the nominal critical flux of the dominant foulant). At the average determined critical flux. Supra-critical flux: m/s above the average determined critical flux. Each experiment was initiated by slowly step-wise increasing the flux until the fixed flux level was reached. Step length of 120 seconds and step heights of m/s were used to reach the fixed flux level not to over-foul the membrane by imposing the given flux level immediately. The importance of a slow start-up procedure is underlined by Le Clech et al. 6 who proposed a small initial step height. Also, Chen et al., 14 working with microfiltration and ultrafiltration of silica particles, stated that slow incrementation of the flux to a given value can result in a significantly lower TMP than the direct application of that flux. Results and Discussion Critical flux determination The critical fluxes were determined in different ways using a step up and a step up down method. The TMP curves were analyzed as sketched in Figure 2. At a certain flux level, for both methods, the increase of pumping rate was not able to increase the flux further, and the limiting flux was reached (around m/s). After that, the flux actually decreases when the pumping rate is increased. This is probably because after the critical flux has been reached, cavities are induced in the permeate pump because of deposition, fouling, and probably pore blocking of the membrane which lead to a large increase in hydraulic resistance. The pump is, therefore, not able to maintain the flux. Bacchin 15 has proposed a theoretical link, stating that the critical flux equals 2/3 of the limiting flux, which then will give a critical flux of around m/s. In Figure 4, it is seen how the critical flux is determined based on the dp/dt parameter, fouling rate, when plotted vs. the flux for both methods for a random choice of operational parameters. The uncertainty in the fouling rates is seen as the standard deviation, especially above the critical flux, is very high whereas below this level the fouling rate is relatively constant. The convective forces dragging the main foulant species toward the membrane must exceed the drag forces away from the membrane surface around the critical flux, making the fouling rate curve break. However, the fouling rate is not zero below the critical flux, which indicates a slow, progressive fouling build-up below the critical flux. Therefore, in our case the critical flux indicates a change in the type of fouling and not the onset of fouling. Using the method of Le Clech et al., 6 the critical flux was further determined from plots of the flux vs. the average pressure P avg (TMP), which is shown in Figure 5 for a random choice of operational parameters. The deviation from linearity can be identified as a critical flux. It is, furthermore, seen that the critical flux is of the weak form, according to the definition of the work of Field et al., 16 as the slope is smaller than the slope of the water flux curve. This, probably, indicates adsorption that changes the permeability of Table 2. Operational Parameters for the Critical Flux Determination Experiments Step Up Method Step Up Down Method J 0, flux start level (m/s) ; sl, step length (s) 300; 600; ; 600 sh, step height (m/s) ; DOI /aic Published on behalf of the AIChE July 2010 Vol. 56, No. 7 AIChE Journal
127 Figure 4. Fouling rate (dp/dt) vs. flux for one of the step up experiment (step length: 1200 s, step height: m/s, flux start level J 0 : m/s) and for one of the step up down experiments (step length: 600 s, step height: m/s, flux start level: m/s). Standard deviation for the three identical experiments is shown with error bars. The fouling rate threshold limit of 1.1 Pa/s is adapted from our previous work 12. [Color figure can be viewed in the online issue, which is available at the membrane. We have earlier determined such irreversible adsorption resistances caused by macromolecular adsorption on ultrafiltration membranes. 17 The decreasing behavior of the flux is probably caused by cavitations in the pump at the largest flux levels. The critical flux based on the parameter DP 0 (Figure 6) is identified at the point where the value (or the standard deviation) undergo a dramatic change. In Figure 6, three step lengths for the step up method are shown. It is seen that using this parameter for identification of the critical flux, with our experimental system, is very uncertain. For a step length of 1200 s, a relatively large deviation in the curve is observed slightly above m/s, but the deviation could also be assessed just slightly above m/s if the fluctuation in the curve at that point is defined as being too large. For the step length of 600 and 300 s, the critical flux has to be identified as the levels where the standard deviation of the curves starts to increase, since the value itself fluctuate, which is around m/s and m/s, respectively. Le Clech et al. 6 have observed a significant increase in DP 0 for the longer step length (7200 s), using a MBR system processing sludge and sewage, but at lower step lengths, the effect on DP 0 is less pronounced, which also seems to be the case with our system. Altogether, as seen in Figure 6 for our system, the critical flux determination using this parameter is very uncertain. As seen in Figure 7, the experimentally determined critical fluxes are mostly sensitive to the used step length when the step up method is used, but also to some extent for the step up down method. For the step up method, the average critical flux value is m/s 30%, whereas the value is m/s 11% for the step up down method. Therefore, the results of the two methods cannot be characterized as being different within the experimental error. It should be noted that the prediction of the critical flux as 2/3 of the limiting flux, reported by Bacchin, 15 seems to be reasonable in our case although one should not really conclude much based on data with such large error. However, the 2/ 3 theoretical link between critical and limiting flux is based on the assumption that a flux distribution and a boundary layer thickness distribution exist along the membrane surface. Bacchin states, the critical flux is reached when irreversible fouling occurs locally on the membrane, whereas Figure 5. Flux vs. TMP for one of the step up experiment (step length: 1200 s, step height: m/s, flux start level J 0 : m/s) and for one of the step up down experiment (step length: 600 s, step height: m/s, flux start level: m/s). Standard deviation for the three identical experiments is shown with error bars and the water flux curve is shown as well. Figure 6. DP 0 vs. flux for the step up experiments. Step length: 1200, 600, and 300 s, step height: m/s, flux start level J 0 : m/s. Standard deviation is shown with error bars. [Color figure can be viewed in the online issue, which is available at AIChE Journal July 2010 Vol. 56, No. 7 Published on behalf of the AIChE DOI /aic 1743
 using step lengths of 300, 600, and 1200 s and based on different pressure related parameters (P avg, dp/dt, and DP 0 ), and for the step up down method")
128 Figure 7. Critical fluxes for step up method (left) using step lengths of 300, 600, and 1200 s and based on different pressure related parameters (P avg, dp/dt, and DP 0 ), and for the step up down method (right) using step lengths of 300 and 600 s using the P avg and dp/dt parameters. Step height ¼ m/s and flux start level ¼ m/s. NB: 1200 s*; experiment conducted with a step length of 1200 s, a flux start level of m/s, and a step height of m/s. the limiting flux is reached when the whole membrane surface operates above the critical flux. 15 This could be the same case for our system. Generally, the determined critical fluxes increase with increasing step length. This is opposite to the observations reported by Le Clech et al., 6 and Choi and Dempsey 9 who reported decreasing critical fluxes with increasing step length, which might be due to the possibility for fouling to build-up during a longer step length period, causing a decreased critical flux. However, other effects must be dominant during operation of our system. Kwon and Vigneswaran, 7 and Guo et al. 8 reported no effect of different step lengths on the determined critical fluxes, which is also contradictory to our observations. Even though one has to remember that these systems are different from our system, as well as the nature of the feed solutions/suspensions are not the same, the reason and mechanism behind our observed tendency of increasing critical flux with increasing step length is not known, but part of the variation in the data might be ascribed to experimental error. Furthermore, when using step length of 1200 s, a higher flux start level of m/s, and a larger step height of m/s, the determined critical flux is around half the value as that with the lower flux start level and step height. However, it is surprising that less fouling is observed at longer filtration step lengths when the step height and flux start level are fixed. Overall, it must be concluded that experimentally determined critical fluxes, in our case, are very sensitive to choice of operational parameters. Altogether, it must be stated in our case that these critical flux measurements are useless in itself as critical flux predictors. However, as will be shown later, the data will be used as starting points for verification experiments. Fouling irreversibility The advantage of the step up down method is, in theory, the possibility of determining the onset of irreversible fouling which by Bacchin et al. 2 is referred to as the irreversibility critical flux form. This can be done by depicting the difference in flux, TMP, and fouling rate for same level steps, which is similar to the SWB method described by Espinasse et al. 11 Figure 8 shows the difference in flux, TMP, and fouling rate between the same level steps, n. When fouling is reversible, the flux, TMP, and fouling rate difference should be zero as the pump operates at the same rate at that certain step and, therefore, an eventual polarized layer should decrease when the suction pressure is released back to a previous level. When fouling starts to get irreversible, the TMP will not be restored when moving from step n,i to step n,ii because in-between the flux has passed a higher flux step. According to Espinasse et al., 11 a transition from a dispersed to a condensed phase occur at the membrane surface when the permeate flux is high enough to overcome the dispersive repulsive forces between the suspended components, and between the surface and the suspended components. At this stage, pore blocking or constriction is probably likely to occur. The point, where the differences in flux, TMP, and Figure 8. Step up down method. Flux, TMP, and fouling rate difference between same level steps. Indication of fouling irreversibility. Step length: 600 s, step height: m/s, flux start level: m/s. [Color figure can be viewed in the online issue, which is available at DOI /aic Published on behalf of the AIChE July 2010 Vol. 56, No. 7 AIChE Journal

129 Figure 9. The flux level at the onset of irreversible fouling based on flux, dp/dt, and P avg difference. Step up down method. Step length: 300 and 600 s, step height: m/s, and flux start level m/s. fouling rate are no longer zero, is taken as the irreversible critical flux form. Actually, when looking at Figure 8, it is seen that the TMP difference curve, before the break, is throughout most of the flux interval slightly above zero (0.8 kpa 0.4 kpa), which indicate slow build-up of irreversible fouling during the whole experiment. Therefore, it might be more correct to refer to a sustainability of fouling irreversibility even though 0.8 kpa 0.4 kpa is a very low and almost undetectable pressure difference. The flux and fouling rate difference, before the curves break, is m/s 150% and 0.22 Pa/s 410%, respectively, which shows that within the standard deviation, these values are not significantly different from zero. The fluxes, at which irreversible fouling is observed (irreversible critical flux form), by using the step up down method is depicted in Figure 9. It can be seen that the flux level, at which irreversible fouling is observed, is dependent upon the used step length as well as the method, by which the flux level is determined (flux, dp/dt, orp avg difference). The main tendency, similar to the step up method, is that increased step length leads to increase in critical irreversibility flux. The average flux level for irreversible fouling is m/s 13% which is slightly higher compared with the critical fluxes for the step up method ( m/s 30%) and for the step up down method ( m/s 11%). This was also expected, according to the definitions of the different types of critical fluxes given in the appendix A of Bacchin et al., 2 as the difference between weak form of critical flux and irreversible form of critical flux is that the total hydraulic filtration resistance is the sum of membrane and adsorption resistance (weak form critical flux) and membrane, adsorption and reversible resistance (irreversible form critical flux), respectively. However, regarding the large variation in the determined critical fluxes and in the irreversible form critical fluxes, one should be very cautious in differentiating between weak form critical flux and irreversible form critical flux from our measurements as the values are all within the experimental error (standard deviation). Therefore, one cannot conclude a difference in the different determined critical flux forms. Critical fluxes tested against constant suction experiments As seen in the previous section, the determined critical fluxes vary quite much from m/s to m/s and are very dependent upon the used step length and also the combination of step height and the flux start level as well as the determination method. Therefore, the data should be verified against constant suction experiments. Three 5 and 1/2 hours constant suction experiments were conducted, each repeated three times. The three flux levels were chosen based on the average values of the determined critical fluxes from the flux-stepping experiments: J 0 ¼ m/s. This flux level was chosen in order to be below the average critical flux value. J 0 ¼ m/s. This flux level was chosen in order to seek to be around the critical flux. J 0 ¼ m/s. This flux level was chosen in order to seek to be in the supra-critical flux regime around the onset of irreversible fouling. In Figure 10 and Figure 11 the flux and TMP versus time for the constant suction experiments are shown. The m/s experiments clearly show that this flux level is supra-critical and not sustainable. The flux in the supra-critical regime is not sustainable and decreases relatively fast in the first 4 and 1/2 hours (16,200 s), probably because of cavitations in the pump. The TMP curve at supra-critical flux increases linearly in the first 1 and 1/2 hour with a slope, fouling rate, of 14.5 Pa/s which is more than one order of magnitude larger than the acceptable fouling rate limit of 1.1 Pa/s. After around 2 hours (7200 s), the permeate pump probably started to cavitate, explaining the flux decrease and the leveling out of the TMP curve. It is seen that in the experiment at m/s, the flux level might be at some critical or intermediate level with a TMP Figure 10. Flux vs. time for the constant suction experiments with flux start levels J 0 of m/s, m/s, and m/s. Error bars show the standard deviation between the three repetitions of each experiment. AIChE Journal July 2010 Vol. 56, No. 7 Published on behalf of the AIChE DOI /aic 1745
130 Figure 11. TMP vs. time for the constant suction experiments with flux start levels J 0 of of m/s, m/s, and m/s. Linear regression lines are shown for each of the curves. For the J0 ¼ m/s experiment, the linear regression line is only fitted to the first part of the curve until 1 1 = 2 h (5400 s). Error bars show the standard deviation between the three repetitions of each experiment. increasing almost linearly with a slope, fouling rate, of 1.4 Pa/s. This fouling rate is slightly above the earlier defined limit. Only the experiments conducted at m/s, seems to be in a sub-critical and sustainable flux regime with a fouling rate below the accepted limit (0.4 Pa/s). The difference in the TMP curves probably indicate differences in the mode of fouling at the different flux levels or at least the degree of fouling is significantly different. Where pore blocking is probably likely to have occurred at the highest flux level, only minor depositions and pore constrictions might have occurred at the lowest flux level. However, as seen in Figure 10, the fluxes also decrease slightly in the experiments, J 0 ¼ m/s and m/s, which indicate slowly, but progressively, fouling build-up on the membrane. As mentioned earlier, step-by-step methods only determine critical fluxes for the dominant fouling species, which in our case probably corresponds to whole yeast cell, or maybe larger yeast cell debris, but still, extracellular polymeric substances (EPS) from the yeast cells can cause severe fouling and is likely also to cause part of the permeability drop. The influence of EPS on membrane fouling and on macromolecular transmission has been investigated and described in other parts of our research. 10 Altogether, the step-by-step experiments generated critical flux values with very large standard deviation. Thus, in itself these values are useless to predict critical fluxes. However, when using these values as start guesses in constant flux verification experiments, a sub-critical and sustainable flux was actually identifiable. The duration of the verification experiment was 5 and 1/2 hours, and therefore the sustainable time period is 5 and 1/2 hours. Conclusions The aims of this article are (i) to show that one cannot be sure to use a critical flux value based on one single step-by-step measurement to actually determine a critical flux. This has been proved, as two different critical flux determination methods both generated critical flux values with large standard deviation. The average critical fluxes for the step up method is m/s 30%, whereas the average of the critical fluxes for the step up down method is m/s 11%. Thus, the two methods gave the same results within the experiment error, and because of the large standard deviation, the critical flux values are in itself useless as predictors for sustainable flux regimes. Furthermore, the theoretical possibility of determining the onset of irreversible fouling, using the step up down procedure, was not achievable in our case, and differentiation between irreversible critical flux form and weak critical flux was, therefore, not possible because of the large standard deviation in the obtained values. How to use the two flux-stepping procedures have been described in detail. (ii) to show that step-by-step determined critical fluxes has to be verified against constant flux experiments. Using the step-by-step determined critical fluxes as start guesses for constant flux verification experiments, a sub-critical and sustainable flux was actually identified. Distinctions in the fouling levels were observed at flux levels of m/s, m/s, and m/s. Only the m/s level was in the sub-critical flux region and sustainable. Thus, the lowest determined critical flux values turned out to be at a sustainable level. (iii) to emphasize that when talking about critical fluxes and sustainable flux regimes, a time period for sustainability has to be assessed. The duration of the constant flux verification experiments was 5 and 1/2 hours. Thus, in our case the sustainability time is 5 and 1/2 hours. Whether this flux level is sustainable after 5 and 1/2 hours cannot be assessed from these data. Overall, one should be very cautious in talking about sustainable fluxes based on critical flux values determined from step-by-step determination procedures. One should at least consider the three conclusions of this article in the evaluation of critical flux results obtained from flux-stepping experiments. Acknowledgments The authors thank the help and support from Henning Koldbech, from the Workshop of the Department of Chemical and Biochemical Engineering, Technical University of Denmark, who rebuild our experimental equipment and proposed and implemented very useful ideas, thus, making the equipment to run smoothly. Literature Cited 1. Beier SP, Jonsson G. Separation of enzymes and yeast cells with a vibrating hollow fiber membrane module. Separ Purif Tech. 2007; 53: Bacchin P, Aimar P, Field RW. Review critical and sustainable fluxes: theory, experiments and applications. J Membr Sci. 2006; 281: DOI /aic Published on behalf of the AIChE July 2010 Vol. 56, No. 7 AIChE Journal
131 3. Cho BD, Fane AG. Fouling transients in nominally sub-critical flux operation of a membrane bioreactor. J Membr Sci. 2002;209: Fane A, Chang S. Membrane bioreactors: design and operational options. Filtr Separ. 2002;39: Fane AG, Chang S, Chardon E. Submerged hollow fibre membrane module design options and operational considerations. Desalination. 2002;146: Le Clech P, Jefferson B, Chang IS, Judd SJ. Critical flux determination by flux-step method in a submerged membrane bioreactor. J Membr Sci. 2003;227: Kwon DY, Vigneswaran S. Influence of particle size and surface charge on critical flux of crossflow microfiltration. Water Sci Technol. 1998;38: Guo WS, Vigneswaran S, Ngo HH. Effect of flucculation and/or adsorption as pretreatment on the critical flux of crossflow microfiltration. Desalination. 2005;172: Choi KYJ, Dempsey BA. Bench-scale evaluation of critical flux and TMP in low-pressure membrane filtration. J Am Water Works Asso. 2005;97: Beier SP, Jonsson G. A vibrating membrane bioreactor (VMBR): macromolecular transmission influence of extracellular polymeric substances. Chem Eng Sci. 2009;64: Espinasse B, Bacchin P, Aimar P. Filtration method characterizing the reversibility of colloidal fouling layers at a membrane surface: analysis through critical flux and osmotic pressure. J Membr Sci. 2008;320: Beier SP, Guerra M, Garde A, Jonsson G. Dynamic microfiltration with a vibrating hollow fiber membrane module: Filtration of yeast suspensions. J Membr Sci. 2006;281: Cho BD, Fane AG. Fouling phenomena in MBR: transmembrane pressure transients and the role of EPS (extracellular polymeric substances). Water Sci Technol. 2003;3: Chen V, Fane AG, Madaeni S, Wenten IG. Particle deposition during membrane filtration of colloids: transition between concentration polarization and cake formation. J Membr Sci. 1997;125: Bacchin P. A possible link between critical and limiting flux for colloidal systems: consideration of critical deposition formation along a membrane. J Membr Sci. 2004;228: Field RW, Wu D, Howell JA, Gupta BB. Critical flux concept for microfiltration fouling. J Membr Sci. 1995;100: Beier SP, Enevoldsen AD, Kontogeorgis GM, Hansen EB, Jonsson G. Adsorption of amylase enzyme on ultrafiltration membranes. Langmuir. 2007;23: Manuscript received Apr. 24, 2009, and revision received Sept. 23, AIChE Journal July 2010 Vol. 56, No. 7 Published on behalf of the AIChE DOI /aic 1747
: Macromolecular transmission influence of extracellular polymeric substances SBren Prip Beier, Gunnar Jonsson CAPEC, Department of Chemical and")

132 Chemical Engineering Science 64 (2009) Contents lists available at ScienceDirect Chemical Engineering Science journal homepage: A vibrating membrane bioreactor (VMBR): Macromolecular transmission influence of extracellular polymeric substances SBren Prip Beier, Gunnar Jonsson CAPEC, Department of Chemical and Biochemical Engineering, Technical University of Denmark, DK-2800 Kgs. Lyngby, Denmark A R T I C L E I N F O A B S T R A C T Article history: Received 9 July 2008 Received in revised form 27 November 2008 Accepted 8 December 2008 Available online 16 December 2008 Keywords: Membranes Vibrating filtration Particle yeast cells Adsorption Critical flux BSA transmission The vibrating membrane bioreactor (VMBR) system facilitates the possibility of conducting a separation of macromolecules (BSA) from larger biological components (yeast cells) with a relatively high and stable macromolecular transmission at sub-critical flux. This is not possible to achieve for a static non-vibrating membrane module. A BSA transmission of 74% has been measured in the separation of 4 g/l BSA from 8 g/l dry weight yeast cells in suspension at sub-critical flux (20 L/(m 2 h)). However, this transmission is lower than the 85% BSA transmission measured for at pure 4 g/l BSA solution. This can be ascribed to the presence of extracellular polymeric substances (EPS) from the yeast cells. The initial fouling rate for constant sub-critical flux filtration of unwashed yeast cells is 3 4 times larger than for washed yeast cells (18 (mbar/h)/5(mbar/h)). At sub-critical flux, an EPS transmission of around 32% is measured for a pure yeast cell suspension. Thus, EPS and BSA are competing in being transmitted which might explain the lowered BSA transmission in the presence of yeast cells. Additionally, EPS heavily foul the membranes, leading to a 86% permeability drop and a fouling resistance 6 times larger than the membrane resistance after h of constant sub-critical flux filtration (20 L/(m2 h)) of pure 8 g/l dry weight yeast cell suspensions. Thus, the addition of hydraulic resistance caused by EPS might also explain the lowered BSA transmission, in the presence of yeast cells, since the membrane pores might be narrowed or partly blocked. EPS is, furthermore, able to cause a relatively large permeability drop even on a membrane module pre-fouled by EPS Elsevier Ltd. All rights reserved. 1. Introduction Submerged suction pressure driven membrane systems are of increasing interest and are often reported in relation to waste water treatment. However, applications in other areas are also seen. When connected to, or submerged into, a fermentation tank, waste water tank, or another tank or reactor, from which water or eventually a solute has to be continually removed, such a setup is called a submerged membrane bioreactor (SMBR) or simply just a membrane bioreactor (MBR). In contrast to more conventional membrane filtration systems, which are often operated at constant pressure, MBR's are often operated at constant flux, controlled by a suction pump. The pump creates a lowered pressure on the permeate side, thereby inducing a pressure driving force which often is relatively low. When operating at constant flux, the transport towards the membrane surface is kept constant which might be advantageous in order to Corresponding author. Tel.: ; fax: address: gj@kt.dtu.dk (G. Jonsson). handle and control fouling problems. MBR's in different configurations have been described widely in the literature in treatment of waste water (Defrance and Jaffrin, 1999; Le Clech et al., 2003; Ognier et al., 2004; Kimura et al., 2005; Yamato et al., 2006; Guglielmi et al., 2007; Jeison and van Lier, 2007; Guo et al., 2008; Matosic et al., 2008), yeast cell suspensions and biomass suspensions in general (Chang and Fane, 2001; Cho and Fane, 2002; Fane et al., 2002; Beieretal.,2006; Beier and Jonsson, 2007; Akram and Stucky, 2008), and different inorganic substances/particles (latex, bentonite) (Kim and DiGiano, 2006). The critical flux concept is widely used as a guideline flux, below which fouling in principle is avoided. Much have been said and stated about the strong and weak form of the critical flux hypothesis (Field et al., 1995), and in the later years there seem to be a general agreement that the term normally sub-critical flux, sub-critical flux, or sustainable flux is a term that can be used as a guideline level for the flux at which only an acceptable TMP increase in a given period of time is observed when the flux is kept constant (Cho and Fane, 2002; Ognier et al., 2004; Hughes and Field, 2006; Bacchin et al., 2006). MBR operation performance and fouling is often related to the presence of extracellular polymeric substances (EPS) /$ - see front matter 2008 Elsevier Ltd. All rights reserved. doi: /j.ces
Research Article Performance of Single and Double Shaft Disk Separators
 Hindawi Publishing Corporation Physical Separation in Science and Engineering Volume 8, Article ID 58617, 5 pages doi:1.1155/8/58617 Research Article Performance of Single and Double Shaft Disk Separators
Controlling membrane pore blocking and filter cake build-up in side-stream MBR systems
 1 Controlling membrane pore blocking and filter cake build-up in side-stream MBR systems T. Jiang 1,a,2,b*#, M.D. Kennedy 1,c, W.G.J. van der Meer 3,d, P.A. Vanrolleghem 2,e, J.C. Schippers 1,f 1 International
Applicability Assessment of Subcritical Flux Operation in Crossflow Microfiltration with a Concentration Polarization Model
 Applicability Assessment of Subcritical Flux Operation in Crossflow Microfiltration with a Concentration Polarization Model Suhan Kim 1 and Heekyung Park 2 Abstract: In the process of crossflow microfiltration,
Chemical Product and Process Modeling
 Chemical Product and Process Modeling Volume 4, Issue 4 2009 Article 5 CHEMPOR 2008 Determination of the Wall Shear Stress by Numerical Simulation: Membrane Process Applications Fanny Springer Rémy Ghidossi
Separation through Dialysis
 Separation through Dialysis SOLVED WITH COMSOL MULTIPHYSICS 3.5a COPYRIGHT 2008. All right reserved. No part of this documentation may be photocopied or reproduced in any form without prior written consent
COMPUTATIONAL STUDY OF PARTICLE/LIQUID FLOWS IN CURVED/COILED MEMBRANE SYSTEMS
 COMPUTATIONAL STUDY OF PARTICLE/LIQUID FLOWS IN CURVED/COILED MEMBRANE SYSTEMS Prashant Tiwari 1, Steven P. Antal 1,2, Michael Z. Podowski 1,2 * 1 Department of Mechanical, Aerospace and Nuclear Engineering,
Investigation of cake deposition on various parts of the surface of microfiltration membrane due to fouling
 Korean J. Chem. Eng., 27(1), 206-213 (2010) DOI: 10.1007/s11814-009-0299-z RAPID COMMUNICATION Investigation of cake deposition on various parts of the surface of microfiltration membrane due to fouling
Beneficial Effect of Particle Adsorption in UF/MF Outside-In Hollow Fiber Filters. Yuriy Polyakov USPolyResearch, New Jersey Institute of Technology
 Beneficial Effect of Particle Adsorption in UF/MF Outside-In Hollow Fiber Filters Yuriy Polyakov USPolyResearch, New Jersey Institute of Technology NAMS 2005 BENEFICIAL EFFECT OF PARTICLE ADSORPTION Slide
Impact of protein interactions and transmembrane pressure on physical properties of filter cakes formed during filtrations of skim milk
 Impact of protein interactions and transmembrane pressure on physical properties of filter cakes formed during filtrations of skim milk Tim Steinhauer a, Wolfgang Kühnl a, Ulrich Kulozik a a Chair for
A Model for Transport Phenomena in a Cross-Flow Ultrafiltration Module with Microchannels
 Membranes 2011, 1, 13-24; doi:10.3390/membranes1010013 Article OPEN ACCESS membranes ISSN 2077-0375 www.mdpi.com/journal/membranes/ A Model for Transport Phenomena in a Cross-Flow Ultrafiltration Module
SHEAR ENHANCING HYDRODYNAMICS FOR LOW PRESSURE MEMBRANE PROCESSES
 SHEAR ENHANCING HYDRODYNAMICS FOR LOW PRESSURE MEMBRANE PROCESSES Farhad Zamani SCHOOL OF CIVIL AND ENVIRONMENTAL ENGINEERING 2014 SHEAR ENHANCING HYDRODYNAMICS FOR LOW PRESSURE MEMBRANE PROCESSES Farhad
CFD STUDY OF MASS TRANSFER IN SPACER FILLED MEMBRANE MODULE
 GANIT J. Bangladesh Math. Soc. (ISSN 1606-3694) 31 (2011) 33-41 CFD STUDY OF MASS TRANSFER IN SPACER FILLED MEMBRANE MODULE Sharmina Hussain Department of Mathematics and Natural Science BRAC University,
Studies on flow through and around a porous permeable sphere: II. Heat Transfer
 Studies on flow through and around a porous permeable sphere: II. Heat Transfer A. K. Jain and S. Basu 1 Department of Chemical Engineering Indian Institute of Technology Delhi New Delhi 110016, India
Estimate the extent of concentration polarization in crossflow filtration Select filtration unit operations to meet product requirements, consistent
 Membrane Separation Process Objectives Estimate the extent of concentration polarization in crossflow filtration Select filtration unit operations to meet product requirements, consistent with product
CONCENTRATION POLARIZATION
 CONCENTRATION POLARIZATION Smart Membrane Products. More Water. Less Cost. www.waterplanet.com CONCENTRATION POLARIZATION: EARLY THEORIES Subir Bhattacharjee, Ph.D. Founder & CTO Water Planet, Inc. OVERVIEW
CENG 501 Examination Problem: Estimation of Viscosity with a Falling - Cylinder Viscometer
 CENG 501 Examination Problem: Estimation of Viscosity with a Falling - Cylinder Viscometer You are assigned to design a fallingcylinder viscometer to measure the viscosity of Newtonian liquids. A schematic
Benjamin Espinasse, Patrice Bacchin, Pierre Aimar
 Journal of Colloid and Interface Science 320 (2008) 483 490 www.elsevier.com/locate/jcis Filtration method characterizing the reversibility of colloidal fouling layers at a membrane surface: Analysis through
Fouling of reverse osmosis membranes using electrical impedance spectroscopy: Measurements and simulations
 Desalination 236 (2009) 187 193 Fouling of reverse osmosis membranes using electrical impedance spectroscopy: Measurements and simulations J.M. Kavanagh*, S. Hussain, T.C. Chilcott, H.G.L. Coster School
A mass transfer model for the prediction of permeate concentration during ultrafiltration of methyl violet dye solution
 Indian Journal of Chemical Technology Vol. 11, March 2005, pp. 205-211 A mass transfer model for the prediction of permeate concentration during ultrafiltration of methyl violet dye solution S Chatterjee
PERMEATION OF SUPERCRITICAL CARBON DIOXIDE ACROSS POLYMERIC HOLLOW FIBER MEMBRANES
 PERMEATION OF SUPERCRITICAL CARBON DIOXIDE ACROSS POLYMERIC HOLLOW FIBER MEMBRANES V. E. Patil* 1, L. J. P. van den Broeke 1, F. Vercauteren and J.T.F. Keurentjes 1 1 Department of Chemistry and Chemical
Some physico-chemical data can be found at the web page (E-Tables):
:") Reminiscences 1 Physical data have been supplied to Problem_#4. Some physico-chemical data can be found at the web page (E-Tables): http://uchi.vscht.cz/index.php/en/studium/navody-a-pomucky/e-tabulky
Reminiscences 1 Physical data have been supplied to Problem_#4. Some physico-chemical data can be found at the web page (E-Tables): http://uchi.vscht.cz/index.php/en/studium/navody-a-pomucky/e-tabulky
Membrane Performance Forecast
 Membrane Performance Forecast Interested in Membranes? Liquid Selectivity in s ea cr Zeta potential analysis with SurPASS 3 from Anton Paar opens up new possibilities in the characterization of membranes
Filtration. Praktikum Mechanical Engineering. Spring semester 2016
 Praktikum Mechanical Engineering Spring semester 2016 Filtration Supervisor: Anastasia Spyrogianni ML F24 spyrogianni@ptl.mavt.ethz.ch Tel.: 044 632 39 52 1 1 Table of Contents 1 TABLE OF CONTENTS... 2
The effects of physicochemical changes on critical flux of skimmed milk ultrafiltration
 ORIGINAL ARTICLE The effects of physicochemical changes on critical flux of skimmed milk ultrafiltration Wirote Yourvaong 1, Alistair Steven Grandison 2 and Michael John Lewis 3 Abstract Yourvaong, W.,
CENG 5210 Advanced Separation Processes. Reverse osmosis
 Reverse osmosis CENG 510 Advanced Separation Processes In osmosis, solvent transports from a dilute solute or salt solution to a concentrated solute or salt solution across a semipermeable membrane hich
Mass Transfer and Fluid Hydrodynamics in Sealed End Hydrophobic Hollow Fiber Membrane Gas-liquid Contactors
 J. Applied Membrane Science & Technology, Vol.2, Dec. 2005, 1 12 Mass Transfer and Fluid Hydrodynamics in Sealed End Hydrophobic Hollow Fiber 1 Universiti Teknologi Malaysia Mass Transfer and Fluid Hydrodynamics
Dansk Mejeriteknisk Selskab Billund, June 14th Challenges in the Dairy Industry: Perspective on extreme performance membranes
 Dansk Mejeriteknisk Selskab Billund, June 14th 2018 Challenges in the Dairy Industry: Perspective on extreme performance membranes OLE LILLEVANG, TECHNOLOGY SPECIALIST GEA PRODUCT TECHNOLOGY CENTER FILTRATION
Effect of flocculation conditions on membrane permeability in coagulation microfiltration
 Desalination 191 (2006) 386 396 Effect of flocculation conditions on membrane permeability in coagulation microfiltration Min-Ho Cho a, Chung-Hak Lee a*, Sangho Lee b a School of Chemical and Biological
Membrane processes selective hydromechanical diffusion-based porous nonporous
 Membrane processes Separation of liquid or gaseous mixtures by mass transport through membrane (= permeation). Membrane is selective, i.e. it has different permeability for different components. Conditions
In-situ characterization of fouling layers: which tool for which measurement?
 Desalination and Water Treatment www.deswater.com 34 (211) 156 162 October 1944-3994/1944-3986 211 Desalination Publications. All rights reserved doi: 1/54/dwt.211.2898 In-situ characterization of fouling
THE HYDRODYNAMICS OF MICRO-PARTICLE SLURRIES IN HOLLOW FIBER MEMBRANES
 The Pennsylvania State University The Graduate School College of Engineering THE HYDRODYNAMICS OF MICRO-PARTICLE SLURRIES IN HOLLOW FIBER MEMBRANES A Thesis in Chemical Engineering by Matthew R. Long Submitted
The student will experimentally determine the parameters to represent the behavior of a damped oscillatory system of one degree of freedom.
 Practice 3 NAME STUDENT ID LAB GROUP PROFESSOR INSTRUCTOR Vibrations of systems of one degree of freedom with damping QUIZ 10% PARTICIPATION & PRESENTATION 5% INVESTIGATION 10% DESIGN PROBLEM 15% CALCULATIONS
Critical and sustainable fluxes: theory, experiments and applications
 Critical and sustainable fluxes: theory, experiments and applications Patrice Bacchin, Pierre Aimar, Robert Field To cite this version: Patrice Bacchin, Pierre Aimar, Robert Field. Critical and sustainable
INPHAZE HiRes-EIS High Resolution Electrical Impedance Spectroscopy. HiRes-EIS for Characterization of Membranes & Membrane Fouling
 INPHAZE HiRes-EIS High Resolution Electrical Impedance Spectroscopy Abstract HiRes-EIS for Characterization of Membranes & Membrane Fouling Separation membranes typically have a thin skin layer supported
Study on Flow Characteristics of Oil Viscosity Pump for Refrigerant Compressors
 Purdue University Purdue e-pubs International Compressor Engineering Conference School of Mechanical Engineering 2016 Study on Flow Characteristics of Oil Viscosity Pump for Refrigerant Compressors Kiyoshi
Contents. Microfluidics - Jens Ducrée Physics: Laminar and Turbulent Flow 1
 Contents 1. Introduction 2. Fluids 3. Physics of Microfluidic Systems 4. Microfabrication Technologies 5. Flow Control 6. Micropumps 7. Sensors 8. Ink-Jet Technology 9. Liquid Handling 10.Microarrays 11.Microreactors
/05/ MAIK Nauka /Interperiodica
 Theoretical Foundations of Chemical Engineering, Vol. 39, No. 4, 5, pp. 4 46. Translated from Teoreticheskie Osnovy Khimicheskoi Tekhnologii, Vol. 39, No. 4, 5, pp. 46 43. Original Russian Text Copyright
Effect of Liquid Viscosity on Sloshing in A Rectangular Tank
 International Journal of Research in Engineering and Science (IJRES) ISSN (Online): 2320-9364, ISSN (Print): 2320-9356 Volume 5 Issue 8 ǁ August. 2017 ǁ PP. 32-39 Effect of Liquid Viscosity on Sloshing
Experimental Study on Port to Channel Flow Distribution of Plate Heat Exchangers
 Proceedings of Fifth International Conference on Enhanced, Compact and Ultra-Compact Heat Exchangers: Science, Engineering and Technology, Eds. R.K. Shah, M. Ishizuka, T.M. Rudy, and V.V. Wadekar, Engineering
Lecture 10. Membrane Separation Materials and Modules
 ecture 10. Membrane Separation Materials and Modules Membrane Separation Types of Membrane Membrane Separation Operations - Microporous membrane - Dense membrane Membrane Materials Asymmetric Polymer Membrane
Differential Acoustic Resonance Spectroscopy Analysis of Fluids in Porous Media
 http://ijopaar.com; 2016 Vol. 2(1); pp. 22-30 Differential Acoustic Resonance Spectroscopy Analysis of Fluids in Porous Media Dr.Mohammad Miyan Associate Professor, Department of Mathematics, Shia P.G.College,
WATER-OIL SEPARATION PROCESS USING A CONCENTRIC TUBULAR CERAMIC MEMBRANE MODULE: A NUMERICAL INVESTIGATION
 WATER-OIL SEPARATION PROCESS USING A CONCENTRIC TUBULAR CERAMIC MEMBRANE MODULE: A NUMERICAL INVESTIGATION a Cunha, A. L. 1 ; b Farias Neto, S. R.; c Lima, A. G. B.; c Barbosa, E. S.; a Santos, J. P. L.;
Rheology of strongly sedimenting magnetite suspensions
 ANNUAL TRANSACTIONS OF THE NORDIC RHEOLOGY SOCIETY, VOL. 13, 05 Rheology of strongly sedimenting magnetite suspensions Jan Gustafsson1, Martti Toivakka1, and Kari K. Koskinen2 1 Laboratory of Paper Coating
DESIGN OF A HIGH-EFFICIENCY MAGNETORHEOLOGICAL VALVE
 DESIGN OF A HIGH-EFFICIENCY MAGNETORHEOLOGICAL VALVE JIN-HYEONG YOO AND NORMAN M. WERELEY Alfred Gessow Rotorcraft Center, Department of Aerospace Engineering University of Maryland, College Park, Maryland
Title: Combined membrane process at waste water treatment. Authors: Hana Jirankova, Jiri Cakl, Olga Markvartova, Petr Dolecek
 Title: Combined membrane process at waste water treatment Authors: Hana Jirankova, Jiri Cakl, Olga Markvartova, Petr Dolecek PII: S1383-5866(07)00448-0 DOI: doi:10.1016/j.seppur.2007.09.027 Reference:
Self-Excited Vibration in Hydraulic Ball Check Valve
 Self-Excited Vibration in Hydraulic Ball Check Valve L. Grinis, V. Haslavsky, U. Tzadka Abstract This paper describes an experimental, theoretical model and numerical study of concentrated vortex flow
Exact Solution of an MHD Natural Convection Flow in Vertical Concentric Annulus with Heat Absorption
 International Journal of Fluid Mechanics & Thermal Sciences 217; 3(5): 52-61 http://www.sciencepublishinggroup.com/j/ijfmts doi: 1.11648/j.ijfmts.21735.12 ISSN: 2469-815 (Print); ISSN: 2469-8113 (Online)
Simulation analysis using CFD on vibration behaviors of circular cylinders subjected to free jets through narrow gaps in the vicinity of walls
 Fluid Structure Interaction V 85 Simulation analysis using CFD on vibration behaviors of circular cylinders subjected to free jets through narrow gaps in the vicinity of walls K. Fujita Osaka City University,
PREFACE. Julian C. Smith Peter Harriott. xvii
 PREFACE This sixth edition of the text on the unit operations of chemical engineering has been extensively revised and updated, with much new material and considerable condensation of some sections. Its
Chemical and Biomolecular Engineering 150A Transport Processes Spring Semester 2017
 Chemical and Biomolecular Engineering 150A Transport Processes Spring Semester 2017 Objective: Text: To introduce the basic concepts of fluid mechanics and heat transfer necessary for solution of engineering
High frequency backshock effect on ultrafiltration of selected polysaccharides
 High frequency backshock effect on ultrafiltration of selected polysaccharides Inês Rosinha a, Maria Norberta de Pinho a, Oscar Rubio b, Manuel Pinelo b, Gunnar Jonsson b a Chemical Engineering Department,
THEORY: SETTLING PROCESSES
 INTRODUCTION MANY METHODS OF MECHANICAL SEPARATION ARE BASED ON THE MOVEMENT OF THE SOLID PARTICLES OR LIQUID DROPS THROUGH A FLUID. IN THIS TOPIC WE ARE FOCUSING ON SOME SITUATIONS OF THE PARTICLES DELIBERATELY
Rheometry. II.1 Introduction
 II Rheometry II.1 Introduction Structured materials are generally composed of microstructures dispersed in a homogeneous phase [30]. These materials usually have a yield stress, i.e. a threshold stress
Simulation of Turbulent Flow of a Rotating Cylinder Electrode. Influence of Using Plates and Concentric Cylinder as Counter Electrodes
 Int. J. Electrochem. Sci., 8 (2013) 4690-4699 International Journal of ELECTROCHEMICAL SCIENCE www.electrochemsci.org Simulation of Turbulent Flow of a Rotating Cylinder Electrode. Influence of Using Plates
CHAPTER 1 Fluids and their Properties
 FLUID MECHANICS Gaza CHAPTER 1 Fluids and their Properties Dr. Khalil Mahmoud ALASTAL Objectives of this Chapter: Define the nature of a fluid. Show where fluid mechanics concepts are common with those
B.1 NAVIER STOKES EQUATION AND REYNOLDS NUMBER. = UL ν. Re = U ρ f L μ
 APPENDIX B FLUID DYNAMICS This section is a brief introduction to fluid dynamics. Historically, a simplified concept of the boundary layer, the unstirred water layer, has been operationally used in the
Membrane for water reuse: effect of pre-coagulation on fouling and selectivity
 Membrane for water reuse: effect of pre-coagulation on fouling and selectivity Y. Soffer*, R. Ben Aim** and A. Adin* *Division of Environmental Sciences, The Hebrew University of Jerusalem, Jerusalem 91904,
Backflushing, pulsation and in-line flocculation techniques for flux improvement in crossflow microfiltration
 Korean J. Chem. Eng., 3(3), 39398 (006) SHORT COMMUNICATION Backflushing, pulsation and inline flocculation techniques for flux improvement in crossflow microfiltration SungHee Roh, HyunJae Shin and SunIl
Application of CFD Techniques for Prediction of NH 3. Transport Through Porous Membranes
 Est. 1984 ORIENTAL JOURNAL OF CHEMISTRY An International Open Free Access, Peer Reviewed Research Journal www.orientjchem.org ISSN: 0970-020 X CODEN: OJCHEG 2012, Vol. 28, No. (1): Pg. 67-72 Application
Supporting Information. Technique for real-time measurements of endothelial permeability in a
 Supporting Information Technique for real-time measurements of endothelial permeability in a microfluidic membrane chip using laser-induced fluorescence detection Edmond W.K. Young a,b,, Michael W.L. Watson
Particle size analysis -Chapter 3
 Particle size analysis -Chapter 3 Importance of PSA Size and hence surface area of particles affect: The rate of drug dissolution and release from dosage forms Flow properties of granules and powders.
Application of COMSOL Multiphysics in Transport Phenomena Educational Processes
 Application of COMSOL Multiphysics in Transport Phenomena Educational Processes M. Vasilev, P. Sharma and P. L. Mills * Department of Chemical and Natural Gas Engineering, Texas A&M University-Kingsville,
UNIVERSITY OF EAST ANGLIA
 UNIVERSITY OF EAST ANGLIA School of Mathematics May/June UG Examination 2007 2008 FLUIDS DYNAMICS WITH ADVANCED TOPICS Time allowed: 3 hours Attempt question ONE and FOUR other questions. Candidates must
Supplementary Information
 Supplementary Information For Hierarchically Multifunctional TiO 2 Nano-thorn Membrane for Water Purification Hongwei Bai, Zhaoyang Liu*, and Darren Delai, Sun* School of Civil & Environmental Engineering,
Application of Viscous Vortex Domains Method for Solving Flow-Structure Problems
 Application of Viscous Vortex Domains Method for Solving Flow-Structure Problems Yaroslav Dynnikov 1, Galina Dynnikova 1 1 Institute of Mechanics of Lomonosov Moscow State University, Michurinskiy pr.
Patrice Bacchin, Djaffar Si-Hassen, Victor Starov, Michael Clifton, Pierre Aimar. To cite this version:
 A unifying model for concentration polarization, gel-layer formation and particle deposition in cross-flow membrane filtration of colloidal suspensions Patrice Bacchin, Djaffar Si-Hassen, Victor Starov,
1. Starting of a project and entering of basic initial data.
 PROGRAM VISIMIX TURBULENT SV. Example 1. Contents. 1. Starting of a project and entering of basic initial data. 1.1. Opening a Project. 1.2. Entering dimensions of the tank. 1.3. Entering baffles. 1.4.
Centrifugation. Tubular Bowl Centrifuge. Disc Bowl Centrifuge
 CENTRIFUGATION Centrifugation Centrifugation involves separation of liquids and particles based on density. Centrifugation can be used to separate cells from a culture liquid, cell debris from a broth,
Effect of physicochemical conditions on crossflow microfiltration of mineral dispersions using ceramic
 Proceedings of European Congress of Chemical Engineering (ECCE-6) Copenhagen, 16- September 7 Effect of physicochemical conditions on crossflow microfiltration of mineral dispersions using ceramic P. Mikulášek,
EXPERIMENTAL AND NUMERICAL STUDIES OF A SPIRAL PLATE HEAT EXCHANGER
 THERMAL SCIENCE: Year 2014, Vol. 18, No. 4, pp. 1355-1360 1355 EXPERIMENTAL AND NUMERICAL STUDIES OF A SPIRAL PLATE HEAT EXCHANGER by Rangasamy RAJAVEL Department of Mechanical Engineering, AMET University,
IDENTIFICATION OF DEFLUIDIZATION REGION IN A GAS-SOLID FLUIDIZED BED USING A METHOD BASED ON PRESSURE FLUCTUATION MEASUREMENTS
 Brazilian Journal of Chemical Engineering ISSN 14-663 Printed in Brazil www.abeq.org.br/bjche Vol. 6, No. 3, pp. 537-543, July - September, 9 IDENTIFICATION OF DEFLUIDIZATION REGION IN A GAS-SOLID FLUIDIZED
ActiPix SDI300 Surface Dissolution Imaging System
 Product Note: PN002B Figure 1. SDI300 Surface Dissolution Imaging System Introduction The ActiPix SDI300 is a powerful UV area imaging system which enables quantitative imaging of surface phenomena for
Concentration polarization in a membrane placed under an impinging jet confined by a conical wall a numerical approach
 Journal of Membrane Science 182 (2001) 257 270 Concentration polarization in a membrane placed under an impinging jet confined by a conical wall a numerical approach João M. Miranda, João B.L.M. Campos
2.500 Desalination and Water Purification
 MIT OpenCourseWare http://ocw.mit.edu 2.500 Desalination and Water Purification Spring 2009 For information about citing these materials or our Terms of Use, visit: http://ocw.mit.edu/terms. MASSACHUSETTS
 Document downloaded from: http://hdl.handle.net/10251/37065 This paper must be cited as: Corbatón Báguena, MJ.; Vincent Vela, MC.; Alvarez Blanco, S.; Lora García, J. (2013). Analysis of Two Ultrafiltration
INTERNATIONAL STANDARD
 INTERNATIONAL STANDARD ISO 8426 Second edition 2008-02-01 Hydraulic fluid power Positive displacement pumps and motors Determination of derived capacity Transmissions hydrauliques Pompes et moteurs volumétriques
SIMULATION IN MAGNETIC FIELD ENHANCED CENTRIFUGATION
 SIMULATION IN MAGNETIC FIELD ENHANCED CENTRIFUGATION Dipl.-Ing. Johannes Lindner*, Dipl.-Ing. Katharina Menzel, Prof. Dr.-Ing. Hermann Nirschl Institute of Mechanical Process Engineering and Mechanics
10 Measurement of Acceleration, Vibration and Shock Transducers
 Chapter 10: Acceleration, Vibration and Shock Measurement Dr. Lufti Al-Sharif (Revision 1.0, 25/5/2008) 1. Introduction This chapter examines the measurement of acceleration, vibration and shock. It starts
SIMULATION OF FLOW IN A RADIAL FLOW FIXED BED REACTOR (RFBR)
") SIMULATION OF FLOW IN A RADIAL FLOW FIXED BED REACTOR (RFBR) Aqeel A. KAREERI, Habib H. ZUGHBI, *, and Habib H. AL-ALI * Ras Tanura Refinery, SAUDI ARAMCO, Saudi Arabia * Department of Chemical Engineering,
SIMULATION OF FLOW IN A RADIAL FLOW FIXED BED REACTOR (RFBR) Aqeel A. KAREERI, Habib H. ZUGHBI, *, and Habib H. AL-ALI * Ras Tanura Refinery, SAUDI ARAMCO, Saudi Arabia * Department of Chemical Engineering,
Determination of Pressure Losses in Hydraulic Pipeline Systems by Considering Temperature and Pressure
 Strojniški vestnik - Journal of Mechanical Engineering 55(009)4, 7-4 Paper received: 7.10.008 UDC 61.64 Paper accepted: 0.04.009 Determination of Pressure Losses in Hydraulic Pipeline Systems by Considering
Membrane Clean In Place Recipe Optimization
 Membrane Clean In Place Recipe Optimization Surface Water Treatment Workshop May 2, 2018 Matt Erickson, PE Outline Introduction UF/RO Background Pretreatment Optimization UF/RO CIP Optimization Case Studies
Analytical Technologies in Biotechnology Prof. Dr. Ashwani K. Sharma Department of Biotechnology Indian Institute of Technology, Roorkee
 Analytical Technologies in Biotechnology Prof. Dr. Ashwani K. Sharma Department of Biotechnology Indian Institute of Technology, Roorkee Module - 4 Electrophoresis Lecture - 1 Basis Concept in Electrophoresis
RISE TIME EVALUATION OF THE HEAT FLUX MICROSENSOR (HFM) ON A HOT- AIR-GUN TEST RIG
 ON A HOT- AIR-GUN TEST RIG") 8th International Conference on Heat Transfer, Fluid Mechanics and Thermodynamics HEFAT2011 8 th International Conference on Heat Transfer, Fluid Mechanics and Thermodynamics 11-13 July 2011 Pointe Aux
8th International Conference on Heat Transfer, Fluid Mechanics and Thermodynamics HEFAT2011 8 th International Conference on Heat Transfer, Fluid Mechanics and Thermodynamics 11-13 July 2011 Pointe Aux
Effect of Coagulation Conditions on Membrane Filtration Characteristics in Coagulation-Microfiltration Process for Water Treatment
 Environ. Sci. Technol. 2000, 34, 3780-3788 Effect of Coagulation Conditions on Membrane Filtration Characteristics in Coagulation-Microfiltration Process for Water Treatment JEONG-DAE LEE, SANG-HO LEE,
Side-View Mirror Vibrations Induced Aerodynamically by Separating Vortices
 Open Journal of Fluid Dynamics, 2016, 6, 42-56 Published Online March 2016 in SciRes. http://www.scirp.org/journal/ojfd http://dx.doi.org/10.4236/ojfd.2016.61004 Side-View Mirror Vibrations Induced Aerodynamically
Investigation of Packing Effect on Mass Transfer Coefficient in a Single Drop Liquid Extraction Column
 Iranian Journal of Chemical Engineering Vol. 7, No. 4 (Autumn), 2010, IAChE Investigation of Packing Effect on Mass Transfer Coefficient Z. Azizi, A. Rahbar, H. Bahmanyar Engineering College, Chemical
Modelling the effectiveness of magnets in particle extraction
 ANZIAM J. 57 (MINZ215) pp.m332 M352, 217 M332 Modelling the effectiveness of magnets in particle extraction H. Cooper 1 J. Denier 2 A. Ali 3 V. Chopovda 4 A. Gulley 5 (Received 19 April 217; revised 11
Research of a novel fiber Bragg grating underwater acoustic sensor
 Sensors and Actuators A 138 (2007) 76 80 Research of a novel fiber Bragg grating underwater acoustic sensor Xingjie Ni, Yong Zhao, Jian Yang Department of Automation, Tsinghua University, Beijing 100084,
Lab M4: The Torsional Pendulum and Moment of Inertia
 M4.1 Lab M4: The Torsional Pendulum and Moment of Inertia Introduction A torsional pendulum, or torsional oscillator, consists of a disk-like mass suspended from a thin rod or wire. When the mass is twisted
A calibration method for a new type of rheometer
 ANNUAL TRANSACTIONS OF THE NORDIC RHEOLOGY SOCIETY, VOL 14, 2006 A calibration method for a new type of rheometer C Salas-Bringas 1, WK Jeksrud 1, O-I Lekang 1 and RB Schüller 2 1 Dep of Mathematical Sciences
AGITATION AND AERATION
 AGITATION AND AERATION Although in many aerobic cultures, gas sparging provides the method for both mixing and aeration - it is important that these two aspects of fermenter design be considered separately.
SIMPLIFICATION OF LAMINAR BOUNDARY LAYER EQUATIONS. Karlo T. Raić. University of Belgrade, Faculty of Technology and Metallurgy
 Metallurgical and Materials Engineering Association of Metallurgical Engineers of Serbia AMES Scientific paper https://doi.org/10.30544/347 SIMPLIFICATION OF LAMINAR BOUNDARY LAYER EQUATIONS Karlo T. Raić
Fluid Dynamics for Ocean and Environmental Engineering Homework #2 Viscous Flow
 OCEN 678-600 Fluid Dynamics for Ocean and Environmental Engineering Homework #2 Viscous Flow Date distributed : 9.18.2005 Date due : 9.29.2005 at 5:00 pm Return your solution either in class or in my mail
Novel method for on-line rheology measurement in manufacturing of non- Newtonian liquids
 Novel method for on-line rheology measurement in manufacturing of non- Newtonian liquids Fridolin Okkels, Anders L. Østergård, Mohammad Amin Mohammadifar 2 Fluidan ApS, Kgs. Lyngby, Denmark 2 National
The Torsion Pendulum (One or two weights)
") The Torsion Pendulum (One or two weights) Exercises I through V form the one-weight experiment. Exercises VI and VII, completed after Exercises I -V, add one weight more. Preparatory Questions: 1. The
The Torsion Pendulum (One or two weights) Exercises I through V form the one-weight experiment. Exercises VI and VII, completed after Exercises I -V, add one weight more. Preparatory Questions: 1. The
Journal of Membrane Science
 Journal of Membrane Science 318 (2008) 247 254 Contents lists available at ScienceDirect Journal of Membrane Science journal homepage: www.elsevier.com/locate/memsci A combined fouling model to describe
Advantages of a Finite Extensible Nonlinear Elastic Potential in Lattice Boltzmann Simulations
 The Hilltop Review Volume 7 Issue 1 Winter 2014 Article 10 December 2014 Advantages of a Finite Extensible Nonlinear Elastic Potential in Lattice Boltzmann Simulations Tai-Hsien Wu Western Michigan University
EMA 3702 Mechanics & Materials Science (Mechanics of Materials) Chapter 3 Torsion
 Chapter 3 Torsion") EMA 3702 Mechanics & Materials Science (Mechanics of Materials) Chapter 3 Torsion Introduction Stress and strain in components subjected to torque T Circular Cross-section shape Material Shaft design Non-circular
EMA 3702 Mechanics & Materials Science (Mechanics of Materials) Chapter 3 Torsion Introduction Stress and strain in components subjected to torque T Circular Cross-section shape Material Shaft design Non-circular
REE 307 Fluid Mechanics II. Lecture 1. Sep 27, Dr./ Ahmed Mohamed Nagib Elmekawy. Zewail City for Science and Technology
 REE 307 Fluid Mechanics II Lecture 1 Sep 27, 2017 Dr./ Ahmed Mohamed Nagib Elmekawy Zewail City for Science and Technology Course Materials drahmednagib.com 2 COURSE OUTLINE Fundamental of Flow in pipes