On the Relation Between Storm Tracks and North American Precipitation in the Boreal Winter. Katherine E. Lukens
|
|
|
- Maria Bradley
- 5 years ago
- Views:
Transcription
1 On the Relation Between Storm Tracks and North American Precipitation in the Boreal Winter Katherine E. Lukens A scholarly paper in partial fulfillment of the requirements for the degree of Master of Science April 2015 Department of Atmospheric and Oceanic Science, University of Maryland College Park, Maryland Advisor: Dr. Ernesto Hugo Berbery
2 Table of Contents Abstract..ii Acknowledgements iii List of Figures..iv List of Symbols v Chapter 1. Chapter 2. Chapter 3. Chapter 4. Chapter 5. Introduction 1 Methods Eulerian Approach Lagrangian Approach..10 Results Eulerian Approach Lagrangian Approach Pacific Storm Track North American-Atlantic Storm Track Mediterranean Storm Track and Other Features.26 Discussion Comparisons between variables using Eulerian Approach Comparisons between Eulerian and Lagrangian Approaches Pacific Storm Track North American-Atlantic Storm Track Mediterranean Storm Track Lagrangian comparisons between ζ 850 and PV Pacific Storm Track North America-Atlantic Storm Track Mediterranean Storm Track.35 Conclusions.36 References...38 i
3 Abstract Groups of storms, known as storm tracks, can have a profound impact on the climate by influencing the variability in cyclonic activity in the mid-latitudes. This study investigates the behaviors of Northern Hemisphere winter storm tracks and their relation to surface precipitation in North America. A local diagnostic and a cyclone tracking algorithm are used to quantify storm tracks described by 200hPa winds, 850hPa vorticity, and potential vorticity at θ=320k from NCEP s Climate Forecast System Reanalysis (CFSR) product. Statistics are computed using these variables, revealing detailed characteristics of storm tracks. Isentropic potential vorticity within the Lagrangian framework is determined to be the preferred combination of variable and methodology to describe storm tracks. This combination reveals three distinct storm tracks, as well as regions of cyclogenesis and cyclolysis. The precipitation associated with identified cyclones is computed. Storm tracks identified from isentropic potential vorticity leave a strong footprint in surface precipitation, exposing small scaled features of precipitation patterns in North America. ii
4 Acknowledgements The author thanks Dr. E. Hugo Berbery for his patient and indispensable advisement of this work. The author also thanks Dr. Kevin I. Hodges for providing essential computational support for the feature tracking program. iii
5 List of Figures Figure Page 1. Mean of u at 200mb for DJF , non-polar, global A. Standard deviation of v at 200mb for DJF , polar, NH B. Standard deviation of v at 200mb for DJF , global C. Standard deviation of v at 200mb for DJF , North America A. One-point Correlations of v at 200hPa for DJF , North America B. One-point Correlations of v at 200hPa on precip for DJF , North America Standard deviation of vorticity at 850mb for DJF , polar, NH A. Regression of vorticity at 850hPa for DJF , global B. Regression of vorticity on precip at 850hPa for DJF , global A DJF vorticity at 850hPa trajectories, North America B DJF potential vorticity at 320K trajectories, North America C DJF potential vorticity at 320K trajectories, polar, NH A DJF vorticity at 850hPa Track Density, polar, NH B DJF potential vorticity at 320K Track Density, polar, NH..19 8A DJF vorticity at 850hPa Mean Intensity, polar, NH B DJF potential vorticity at 320K Mean Intensity, polar, NH A DJF vorticity at 850hPa Genesis Density, polar, NH B DJF potential vorticity at 320K Genesis Density, polar, NH A DJF vorticity at 850hPa Lysis Density, polar, NH B DJF potential vorticity at 320K Lysis Density, polar, NH A DJF Mean Intensity of precip associated with vorticity at 850hPa, polar, NH B DJF Mean Intensity of precip associated with potential vorticity at 320K, polar, NH..22 iv
6 List of Symbols A. ζ 850 vorticity at 850hPa following the Lagrangian framework B. θ vertical level in units of Kelvin (K) C. PV 320 potential vorticity on an isentropic surface of θ=320k v
7 Chapter 1. Introduction While storms strongly influence local weather, groups of storms can impact the climate by contributing to shifts in tropospheric jets, and altering global atmospheric flow patterns. Wallace et al. (1988) explored the influences of both cyclones and anticyclones on regions of high variability in the Northern Hemisphere. They deduced that cyclones follow the baroclinic waveguides and move northeastward (In the Northern Hemisphere) towards climatological oceanic low pressure systems; anticyclones follow the same waveguides and move southeastward towards climatological oceanic high pressure systems. They defined these regions as baroclinic waveguides or areas of strong variability that coincide with bands of strong teleconnectivity, which quantifies the extent to which high-frequency fluctuations are wavelike. They described the evolution of baroclinic waves as exerting westerly flows that contribute to the surface winds, causing cyclones (anticyclones) at the surface to drift poleward (equatorward) relative to the background flow. Chang and Orlanski (1993) also found that the temporal evolution of this largescale eddy activity remained confined to certain latitude bands. These spatial bands of large-scale eddy development are paths along which cyclones and anticyclones most likely travel, and so they can be thought of as baroclinic waveguides, or storm tracks. Many studies on baroclinic wave activity have only considered cyclones when investigating storm track patterns and characteristics during their analyses. The term storm track can thus be misleading, for it implies that cyclones solely follow these paths while ignoring the development and propagation of anticyclones. 1
8 Hoskins and Valdes (1990) supplemented this description through the examination of vorticity fluxes, demonstrating that divergence aloft produces a cyclonic (anticyclonic) circulation poleward (equatorward) of the large-scale eddy activity, generating upstream confluence. If this confluence is strong enough, it can predominantly contribute to the maintenance of the mean baroclinicity needed to sustain baroclinic waves downstream. The growth and decay of individual storms is influenced by surface friction, orographic effects, and the state of the atmosphere at the time of the storm s initial development. While baroclinicity is a key ingredient of the storm tracks, Orlanski and Chang (1993) found that ageostrophic fluxes radiated by upstream eddies trigger the development and maintenance of new eddies downstream, despite the lower baroclinicity there. Unstable upstream eddies then decay due to the radiation of energy downstream; the more stable downstream eddies grow from this influx of energy and decay from the subsequent divergence of ageostrophic geopotential fluxes. Individual eddies tend to develop in groups with subsequent eddies developing downstream due to the downstream radiation of energy previously mentioned. These groups of eddies propagate as a large-scale wave packet, moving at a group velocity. The group velocity as described by Orlanski and Chang (1993) primarily dictates the speed at which a wave packet spreads up- and downstream. Conventional diagnostic methods have provided information regarding general storm track behavior. The extent of storm tracks can be hindered by regions of increased surface roughness and orography. Areas of stronger friction also dissipate the intensity of the storm tracks, allowing for the existence of more localized maxima and minima of 2
9 storm track strength (Chang and Orlanski 1993). Storm tracks can be identified as areas of high variability of key variables when studying transient eddies. Brayshaw et al. (2008) found that the atmospheric baroclinicity along with the relative positions of the subtropical and subpolar jets affect the latitudinal locations of storm tracks. From the previous studies of Hsu and Lin (1992) and Hoskins and Ambrizzi (1993), Lu et al. (2002) interpreted that anomalies of upper tropospheric stream function and vorticity become zonally elongated largely due to the latitudinal shifts in the jet stream brought on by its seasonal and interannual variabilities, making the zonallyoriented Rossby waves associated with these variables unidentifiable. Thus, the stream function and vorticity in the upper troposphere do not well represent storm tracks. Lu et al. (2002) found that zonal Rossby waves associated with the meridional component of the upper tropospheric wind are not noticeably elongated by the jet stream, implying that the meridional wind field better depicts zonally-propagating atmospheric wave patterns. Orlanski and Chang (1993) confirmed the advantage of using this variable during their analyses of the development of individual cyclones: the downstream divergence of the ageostrophic geopotential flux dominates the decay of a cyclone while providing energy for the development of another cyclone farther downstream. Therefore, the analysis of this variable has become standard when studying storm track behavior. Two well-documented storm tracks in the Northern Hemisphere are the Pacific and Atlantic tracks. These tracks are characterized as zonally elongated regions of high baroclinicity, or deep baroclinic instability. Hoskins and Valdes (1990) found that during the boreal winter, diabatic heating off the western boundaries of Asia and North America act to maintain regions of high atmospheric baroclinicity, making these regions favorable 3
10 for increased large-scale eddy activity. They found that both the Atlantic and Pacific storm tracks are well-defined when examining the baroclinicity parameter, or the Eady growth rate maximum; from this view the Atlantic track primarily extends from the eastern coast of North America to northwestern Europe, and the Pacific track primarily extends from the eastern coast of Asia to northwestern North America. The baroclinicity parameter provides a definitive western boundary to both tracks in the form of minimum values downstream of the respective maximums. The standard deviation of the meridional wind at 200 hpa spatially represents the Northern Hemisphere storm track patterns in the DJF season with relative accuracy as it captures the Pacific and Atlantic tracks. The lower atmospheric vorticity field converted is also considered in this local approach; areas of high variability of the 850 hpa vorticity indicate storm track maxima, or areas of strong storm development. Storm tracks in the Southern Hemisphere differ from their Northern Hemisphere counterparts, primarily due to the greater zonal symmetry in the Southern Hemisphere. Trenberth (1991) suggested that the zonal nature of and the dominant presence of oceans in the Southern Hemisphere allow storm tracks to sustain strong baroclinic activity in both the summer and winter seasons. The strong meridional temperature gradient in the summer season and the prominent maximum in the variance of geopotential height in the southern Indian Ocean in both the summer and winter contribute to the year-round baroclinic wave activity. These waves unceasingly undergo life cycles of growth and decay. Berbery and Vera (1996) documented the behavior of these two storm tracks. In both the subtropical and subpolar storm tracks the well-defined wave packet structures demonstrate that down-stream development contributes to the evolution of the synoptic-scale 4
11 waves. The subtropical storm track exhibits a stronger wave packet structure, probably due to its weaker baroclinicity. They also note that, overall, the wave trains produced follow the paths of the subtropical and subpolar jets, with periods and wavelengths similar to those found in the Northern Hemisphere by Wallace et al. (1988), Chang and Orlanski (1993), and others. Most of the previous studies followed an Eulerian (or local) approach. A more recent method for diagnosing storm tracks is inspired by the Lagrangian view. The Lagrangian view follows an entity throughout its life cycle, contrasting the Eulerian view which observes an entity as it passes over a fixed location. Motivated by the Lagrangian view, Hoskins and Hodges (2002) used feature tracking software to identify 850hPa vorticity maxima as individual cyclones and then track them; they also explored the use of isentropic potential vorticity at 330K to identify and track cyclones. Isentropic potential vorticity (IPV) is conserved for adiabatic, frictionless flow. It is said to induce changes in the wind and temperature fields, and so one may conclude that IPV determines the flow field and is advected by it. Because a parcel (i.e., a cyclone) conserves potential vorticity on an isentropic surface, it must move parallel to isocontours of potential vorticity, making this variable ideal for clearly identifying and tracking storms (Holton 2004). Hoskins and Hodges (2002) stressed that the vorticity at 850hPa is the preferred variable to diagnose storm track behavior, explaining that it is able to identify low pressure systems earlier in their life cycles because it is less influenced by the background flow and so it able to better expose smaller spatial scales. This allows for the detection of storm genesis regions, which are typically small in scale. This method allows for the separate extraction and analysis of cyclones and anticyclones, whereas the local diagnostic described above 5
12 does not. It also shows better defined and detailed Northern Hemisphere winter storm tracks than the traditional Eulerian method. The passages of extratropical cyclones are associated with precipitation events. By considering the Lagrangian view, Hawcroft et al. (2012) identified areas within the oceanic regions of the Atlantic and Pacific storm tracks as having the greatest absolute storm associated precipitation, with over 70% of the total precipitation associated with the passage of a cyclone in North America and parts of Europe; they did note that precipitation may be enhanced over mountainous regions due to orographic effects. They also found that heavy precipitating storms have a greater impact on the total precipitation climatology in the DJF season compared to the other seasons because the largest amount of precipitation occurs in the boreal winter. Studies of daily precipitation characteristics have revealed the importance of relationships between storm tracks, precipitation, and global atmospheric patterns, such as the El Niño Southern Oscillation (ENSO), the Pacific-North American pattern (PNA), and the Madden-Julian Oscillation (MJO). Trenberth et al. (2003) analyzed the various aspects that potentially modulate the characterization of precipitation over time. Storm track changes over the Northern Pacific Ocean associated with the PNA and the positive phase of ENSO create precipitation anomalies that extend south to California and to the southeastern United States, demonstrating increased storm activity and rainfall to the south and decreased rainfall to the north. Salathé (2006) studied the influences of the Aleutian Low on North American precipitation through storm track changes. The location and intensity of this low contributes to the movement and intensification of the storm track in the North Pacific. He also found that a northward shift and deepening of the 6
13 Aleutian Low causes a similar shift in the North Pacific storm track, which in turn amplifies winter precipitation and contributes to its northward movement in this area. Becker et al. (2009) examined precipitation characteristics associated with ENSO over the contiguous United States. During winter, they found a 40-60% increase in daily precipitation intensity, defined as a daily average over days with recorded precipitation matching and/or exceeding 1.0 mm, over the southwestern and central United States during an El Niño as compared to a La Niña. Becker et al. (2011) examined these characteristics in conjunction the MJO, focusing on phases 5-7. They found that the frequency of precipitation events, defined as the number of days with recorded precipitation of 1.0 mm or higher, slightly decreased in the Mississippi River basin while substantially dropping in Florida. They also found that the daily precipitation intensity increased in much of the lower Mississippi River basin, implying the development of more intense storms. Precipitation variability and the varying extremes of drastic precipitation events, some of which can last for multiple seasons or years, significantly impact agriculture, businesses, and the general population in North America. As storms develop and propagate, they affect the environment around them. The goal of this work is to establish a better understanding of the relationship between North American precipitation and the intensities and spatial patterns of storm tracks in the boreal winter. We first apply the Eulerian diagnostic to the meridional wind at 200hPa. We then apply the Lagrangian approach to vorticity at 850hPa and potential vorticity at θ=320k to obtain storm track patterns and extract the surface precipitation associated with each cyclone identified from these patterns. By analyzing these groups of storms of varying se- 7
14 verity, we deepen our understanding of how storm track characteristics influence precipitation. Section II defines the data and methodology used. Section III describes the figures and results produced from this study. Section IV highlights the similarities and differences between the approaches and variables used in our analyses. Section V summarizes our findings detailed in sections III and IV. 8
15 Chapter 2. Methods The vorticity at 850hPa (ζ 850 ), isentropic potential vorticity at 320K (PV 320 ), and precipitation data range from December 1979 to December 2010 and are from the NCEP Climate Forecast System Reanalysis (CFSR) product at a horizontal resolution of 32km. In our analyses we employ the wind components at 200hPa and 850hPa in units of m s -1, the potential vorticity at θ=320k in units of one PVU, and the surface precipitation rate in units of mm day -1. In October 1998, data from the Advance TIROS operational vertical sounder (ATOVS) from the NOAA 15 satellite was assimilated into CFSR. Chelliah et al. (2011) explains that this may be a contributing factor to an observed artificial jump in the precipitation and wind data around this time. For low-level zonal winds, they determined that CFSR data after 1998 agrees with reanalyses from other products for the same time period with no notable systematic differences, while prior to 1998 CFSR demonstrates that equatorial Pacific easterlies are more easterly and equatorial Indian westerlies are more westerly than the other reanalyses. Other reanalysis investigations such as Wang et al. (2011) have found that CFSR provides a better-quality dataset of precipitation than past NCEP reanalyses. 2.1 Eulerian Approach The traditional Eulerian diagnostic provides information regarding general storm track behavior, but without the ability to separately analyze cyclones and anticyclones. This approach characterizes storm tracks as regions of high variability as estimated by, e.g., the standard deviation of the meridional wind at 200hPa; areas of high standard de- 9
16 viation indicate areas of strong storm development. This approach is similar to that in Chang and Orlanski (1993) and Berbery and Vera (1996). An Eulerian view of the vorticity at 850hPa is also examined. The winds at 200hPa have the seasonal variability removed by subtracting the seasonal mean of each year from the seasonal data of each year. A band-pass filter of 2-6 days and a T21 truncation are applied to the Eulerian vorticity data at 850hPa. 2.2 Lagrangian Approach The Lagrangian approach examines ζ 850 and PV 320 and identifies maxima that exceed 1*10-5 s -1 and 1.0 PVU, respectively, as individual cyclones; this method can also separately identify anticyclones and track their evolutions. In this study, the propagation and evolution of each cyclone center is followed, producing tracks of individual storms. This method computes statistics that represent storm tracks, storm strength, and other characteristics of storm tracks such as regions of strong cyclogenesis and cyclolysis. The storms examined last at least 2 days and travel farther than 1000km; these minimum criteria help to remove the possibility of capturing stationary waves alongside individual storms. The Lagrangian approach is able to identify low pressure systems earlier in their life cycles; because vorticity is less influenced by the background flow, and storm genesis regions are typically small in scale, the vorticity fields can more easily expose these regions than mean sea level pressure, the meridional wind, and other such variables. For this approach, the vorticity and potential vorticity fields undergo filtering schemes similar to those found in Hoskins and Hodges (2002). The planetary scales with 10
17 total wavenumbers less than or equal to 5 are removed at each analysis time for ζ 850 and PV 320. A band-pass filter of days is applied as well as a taper acting as a 4 smoother and having a value of 0.1 on the smallest retained scale (Hoskins and Hodges 2002). 11
 at 200hPa (Fig.")
18 Chapter 3. Results 3.1 Eulerian Approach Figure 1: Mean zonal wind at 200hPa for DJF season from , global. Values less than 15.0 m/s removed for aesthetic clarity. Contour interval is 2.0 m/s. We use the Eulerian or local approach to analyze storm tracks in the Northern Hemisphere. The average position of the Northern Hemisphere high-velocity mean zonal wind (i.e., the jet stream) at 200hPa (Fig. 1) extends east from the western coast of Africa around 35 N and achieves a maximum over the western Pacific Ocean. A second maximum is centered over the eastern coast of North America around 40 N and extends northeast into the western Atlantic Ocean. The Southern Hemisphere mean zonal wind pattern (Fig. 1) exhibits a single zonally elongated maximum around 45 S in the Southern Ocean south of the African continent. Storm tracks represented as regions of high variability of the meridional wind at 200hPa (Fig. 2A) occur on the poleward side of the jet stream in both hemispheres (Fig. 2B); for the remainder of this paper, we focus on the Northern Hemisphere. 12


: A global, non-polar view of Fig. 2A. Values less than 11.0 m/s removed for aesthetic clarity. Contour interval is 0.5 m/s. Figure 2C (bottom): An enlarged version of Fig.")
19 Individual storm tracks are indistinguishable in the 200hPa pattern; rather, a wide latitude band of high variability extends eastward from the central North Pacific Ocean to the western coast of North America, and from the central United States to the western coast of the United Kingdom. Three centers of particularly high variability reside over the central-eastern North Pacific, the central United States, and the western North Atlantic Ocean (Fig. 2C). These areas exemplify regions of particularly strong storm development. Figure 2A: Standard deviation of meridional wind at 200hPa for DJF season from for the Northern Hemisphere. Each year s seasonal mean is removed from each year before calculation; no other filtering is applied. Values less than 11.0 m/s removed for aesthetic clarity. Contour interval is 0.5 m/s. Figure 2B (top): A global, non-polar view of Fig. 2A. Values less than 11.0 m/s removed for aesthetic clarity. Contour interval is 0.5 m/s. Figure 2C (bottom): An enlarged version of Fig. 2B concentrating over North America. Values less than 11.0 m/s removed for aesthetic clarity. Contour interval is 0.5 m/s. We explore one such area over North America at a base point of 38 N, 95 W located over the central United States. The base point 38 N, 95 W was chosen because it is a maximum in the variability of the meridional wind at 200hPa. Correlation and regres- 13

20 sion techniques reveal an eastward-propagating wave characteristic of an individual storm passing over the base point (Fig. 3A). Its average longitudinal extension is 90 degrees. The wave begins with split centers over the northern Pacific Ocean in Lag -2, and Figure 3A: Lagged correlation of the meridional wind at 200hPa for DJF season from at base point 38 N,95 W. Contour interval is correlations show no noticeable difference from those presented here. then develops into a high energy wave with a single center. The wave s tilt is mirrored on either side of the base point 38 N, 95 W, exhibiting a tilt of a NNW-SSE orientation upstream and a NNE-SSW orientation downstream. The tilt of the wave increases with the wave s evolution. The energy builds as the wave propagates toward the base point, maximizing over North America at lag 0. By lag +2, the wave has propagated across North America, splitting into two centers once again when it reaches the western coasts of Europe and Africa. In these areas the 200hPa storm track diverges into two separate tracks: one extends northeast into Europe and northern Russia, and the other extends across the Middle East along 30 N. As the wave moves over the Atlantic Ocean, its energy begins to dissipate, further weakening as the wave splits. Through similar local diagnostics, we find that this wave pattern leaves a signature in surface precipitation (Fig. 3B). A wave propagates eastward and crosses the North 14

21 American continent. This wave shares similar characteristics with that produced from the 200hPa meridional wind; however, the precipitation wave does not show split wave centers at any lag, nor does the tilt of this wave shift from its NNE-SSW orientation. As this wave Figure 3B: Lagged correlation of the meridional wind at 200hPa at base point 38 N,95 W against surface precipitation for DJF season from Contour interval is correlations show no noticeable difference from those presented here. evolves, it elongates meridionally, and its tilt increases to a NE-SW direction. From lags - 2 to 0, the wave energy rises. Once it crosses into the Atlantic Ocean, the energy rapidly dissolves. In lag +2, this wave follows a path that lies between the split centers of the 200hPa wave train; by the time this wave reaches the western shores of Europe and northern Africa, little to no signal of the upper tropospheric meridional wind pattern remains in the precipitation pattern. Storm tracks represented by the variability of vorticity at 850hPa are also examined (Fig. 4). Two individual regions of vorticity variability are discerned: one extends west to east across the North Pacific Ocean from Japan to the west coast of Canada, and the other extends southwest to northeast across the North Atlantic Ocean from eastern North America to the Norwegian Sea. Regressions are computed to ascertain the structure of an individual wave passing over the base point 38 N, 95 W (Fig. 5A). The wave 15

 1/s removed for aesthetic clarity. Contour interval is 0.1*10^(-5) 1/s.")
.")
22 produced loses energy when it shifts from a NE-SW tilt to a NNE-SSW tilt as it propagates eastward from the base point to the Atlantic Ocean. Compared to the synoptic nature of the wave train at 200hPa, the lowlevel vorticity wave reveals smaller scales; this wave is confined to the latitudes Figure 4: Standard deviation of vorticity at 850hPa for DJF season from for the Northern Hemisphere. Bandpass filter is applied from 2-6 days. T21 truncation is also applied (i.e., all wavenumbers greater than or equal to 21 are removed. Values less than 7.0*10^(-6) 1/s removed for aesthetic clarity. Contour interval is 0.1*10^(-5) 1/s. bounding the United States, contrary to the 200hPa wave train that spreads meridionally from Mexico to northern Canada. Smaller scaled features are also shown in the singlepoint regression of vorticity onto surface precipitation (Fig. 5B). Regional precipitation signals are revealed as the wave produced propagates eastward from the base point and disappears over the eastern North Atlantic Ocean. Enhanced precipitation from orographic effects on the western coast of North America is also observed. The tilt of the wave shifts from N-S to NNE-SSW; the wave maintains its energy until it crosses into the eastern half of the North Atlantic Ocean where it rapidly dissipates. Figure 5: Regression of A) Eulerian filtered vorticity at 850hPa (left), and B) Eulerian filtered vorticity at 850hPa onto surface precipitation rate field (right), at base point 38 N,95 W for DJF season from Values -0.2 to 0.2 are removed for aesthetic clarity. Contour interval is 0.1 and 0.2 for Figs. 5A and 5B, respectively regressions show no noticeable difference from those presented here. 16
23 3.2 Lagrangian Approach The analysis centers on two variables: vorticity at 850hPa and potential vorticity at θ=320k. A variety of statistics is computed as in Hoskins and Hodges (2002) to diagnose and characterize storm tracks and their behaviors in the Northern Hemisphere, focusing on the boreal winter season. Individual tracks of storms are estimated as single points derived from spherical kernel estimators with local kernel functions, resulting in a set of data that can be normalized to a PDF. A brief description of each diagnostic is presented here, followed in the next sections by a deeper analysis of each storm track. The statistic labeled track density as defined by Hoskins and Hodges (2002) is the density of these single track points and is the storm track pattern. Figures 6A and 6B show the tracks of individual storms identified in 1980 from the variables ζ 850 and PV 320, respectively. Figure 6C shows the tracks of individual storms identified from the PV 320 field from The track density statistic represents the storm track pattern in the Northern Hemisphere. The pattern of ζ 850 (Fig. 7A) reveals four separate and distinct tracks mostly residing above 30 N. The pattern of PV 320 (Fig. 7B) shows three distinct tracks confined between latitudes 30 N and 60 N. 17


 reveals a band of storm track strength reaching eastward from the central North Pacific Ocean to just west of the Mediterranean Sea. 18")
24 Figure 6A: Individual storm tracks from vorticity at 850hPa that last longer than 2 days and travel further than 1000 km over North America in the DJF season for Blue dots mark the starting points of each track. These storms are identified and tracked using the Lagrangian approach via TRACK. Figure 6B: Individual storm tracks from potential vorticity at θ=320k that last longer than 2 days and travel further than 1000 km over North America in the DJF season for Blue dots mark the starting points of each track. These storms are identified and tracked using the Lagrangian approach via TRACK. Figure 6C: A Northern Hemisphere view of Fig. 6B but from The mean intensity statistic denotes the average strength of the storms that comprise each storm track. The ζ 850 mean intensity statistic (Fig. 8A) shows two regions of strong storms concentrated over the northern Pacific and Atlantic Ocean basins. The PV 320 mean intensity pattern (Fig. 8B) reveals a band of storm track strength reaching eastward from the central North Pacific Ocean to just west of the Mediterranean Sea. 18


![0 number of storms per month with a unit area of 10 6 km 2 [5 spherical cap] for both figures.](/docs-images/89/99804509/images/25-2.jpg "Figure 8A (left): Lagrangian mean intensity of the Northern Hemisphere storm track patterns of vorticity at 850hPa as seen in Fig.")
 1/s.")
25 Figure 7: Lagrangian track density of A) vorticity at 850hPa (left), and B) potential vorticity at θ=320k (right), for the DJF season from Individual storm tracks are represented by single estimation points using kernel estimators. This shows the density of individual tracks, as represented by these points, thus displaying the storm track pattern for the DJF season in the Northern Hemisphere. Values less than 3.0 and 1.0 are removed for aesthetic clarity from Figs. 7A and 7B, respectively. Contour interval is 1.0 number of storms per month with a unit area of 10 6 km 2 [5 spherical cap] for both figures. Figure 8A (left): Lagrangian mean intensity of the Northern Hemisphere storm track patterns of vorticity at 850hPa as seen in Fig. 7A for the DJF season from This shows the average strength of the storm tracks. Values less than 3. 0*10^(-5) are removed for aesthetic clarity. Contour interval is 0.5*10^(-5) 1/s. Figure 8B (right): Lagrangian mean intensity of the Northern Hemisphere storm track patterns of potential vorticity at θ=320k as seen in Fig. 7B for the DJF season from This shows the average strength of the storm tracks. Values less than 1.5 PVU are removed for aesthetic clarity. Contour interval is 0.25 PVU. 19
26 The genesis density statistic is computed using the points of origin of each cyclone identified; in other words, it highlights regions of cyclogenesis. The ζ 850 cyclogenesis pattern (Fig. 9A) exhibits isolated regions of cyclogenesis. The PV 320 cyclogenesis pattern (Fig. 9B) reveals cyclogenesis regions that are more zonally oriented and appear to follow the PV 320 storm track pattern. The lysis density statistic is computed using the points at which each cyclone disappears; in other words, it highlights regions of cyclolysis. The ζ 850 lysis density statistic (Fig. 10A) shows concentrated regions of cyclolysis, while the PV 320 lysis density pattern (Fig. 10B) reveals more zonally oriented regions of cyclolysis that seem to follow the PV 320 storm track pattern. This approach allows for the identification of precipitation associated with an individual storm center. Precipitation that falls within a specified spherical radius of an individual storm center is considered to be associated with that particular storm; the spherical radius used in this study is 5 ; this precipitation is referred to as storm-associated precipitation. We compute the mean intensity of the precipitation associated with storms derived from the ζ 850 and PV 320 fields (Figs. 11A and 11B, respectively). 20
 for the DJF season from 1980-2010.")

![1 number of storms per month with a unit area of 10 6 km 2 [5 spherical cap] for Figs. 10A and 10B, respectively.](/docs-images/89/99804509/images/27-2.jpg "Figure 10: Lagrangian lysis density for A) vorticity at 850hPa (left), and B) potential vorticity at θ=320k (right), for the Northern Hemisphere")
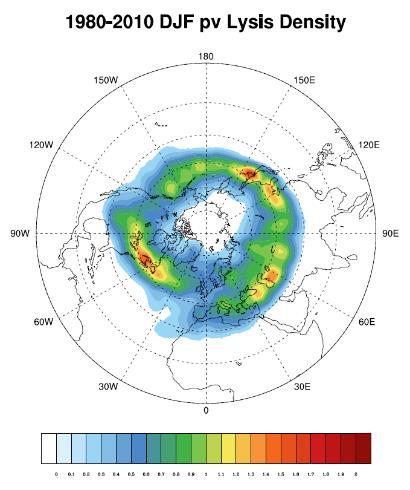
27 Figure 9: Lagrangian genesis density for A) vorticity at 850hPa (left), and B) potential vorticity at θ=320k (right), for the Northern Hemisphere storm track patterns (as seen in Figs. 7A and 7B, respectively) for the DJF season from This highlights regions of cyclogenesis using the starting points of each track to compute the density Values less than 0.5 and 0.2 are removed from Figs. 10A and 10B, respectively, for aesthetic clarity. Contour interval is 0.2 and 0.1 number of storms per month with a unit area of 10 6 km 2 [5 spherical cap] for Figs. 10A and 10B, respectively. Figure 10: Lagrangian lysis density for A) vorticity at 850hPa (left), and B) potential vorticity at θ=320k (right), for the Northern Hemisphere storm track patterns (as seen in Figs. 7A and 7B, respectively) for the DJF season from This highlights regions of cyclolysis using the end points of each track to compute the density. Values less than 0.5 and 0.2 are removed from Figs. 10A and 10B, respectively, for aesthetic clarity. Contour interval is 0.2 and 0.1 number of storms per month with a unit area of 10 6 km 2 [5 spherical cap] for Figs. 10A and 10B, respectively. 21

 for the DJF season from 1980-2010. This shows the average precipitation rate associated with storms that travel farther than 1000km and last longer than 2 days. Values less than 1.")
28 Figure 11A: Lagrangian mean intensity of the Northern Hemisphere precipitation associated with the vorticity at 850hPa storm track pattern (as seen in Fig. 7A) for the DJF season from This shows the average precipitation rate associated with storms that travel farther than 1000km and last longer than 2 days. Values less than 3.0 mm/day are removed for aesthetic clarity. Contour interval is 1.0 mm/day. Figure 11B: Lagrangian mean intensity of the Northern Hemisphere precipitation associated with the potential vorticity at θ=320k storm track pattern (as seen in Fig. 7B) for the DJF season from This shows the average precipitation rate associated with storms that travel farther than 1000km and last longer than 2 days. Values less than 1.2 mm/day and greater than 8.0 mm/day are removed for clarity. Contour interval is 0.02 mm/day Pacific Storm Track The ζ 850 Pacific storm track shown in Fig. 7A resides primarily over the North Pacific Ocean, extending from eastern Asia to the western coast of North America. The greatest number of storms in the Northern Hemisphere DJF season occurs within the western half of the Pacific track. From the mean intensity pattern (Fig. 8A) we see that its peak strength occurs over the western half of the Pacific Ocean. Two cyclogenesis regions of similar magnitude are shown to reside east of Japan and in the central North Pacific Ocean (Fig. 9A). This track reveals small scaled features such as the low latitude extension of the eastern end of the Pacific track into southern California, USA. Fig. 10A shows that the 22
29 two regions where cyclolysis occurs the most are located over the western coast of Canada, implying that many storms originating from the Pacific track dissipate there. Several storms from the Pacific track also decay in the Southern California, USA area, coinciding with the low latitude extension of that storm track. The PV 320 view of the Pacific storm track is shown in Fig. 7B, and spreads across the North Pacific Ocean from eastern Asia to the east of North America. The greatest number of storms within the Pacific track occurs over the western-central North Pacific Ocean. Fig. 8B reveals the largest peak of mean intensity in the Northern Hemisphere to be related to the Pacific track, and it reaches a maximum intensity in the eastern half of the North Pacific Ocean. The most dense region of cyclogenesis (Fig. 9B) is that over the North Pacific Ocean; this region spreads eastward from east of Japan to the eastern North Pacific Ocean and is associated with the Pacific track. The highest peaks in density that are associated with the Pacific track reside west of and over northern Japan. In Fig. 10B we see that a band of relatively lower lysis density reaches eastward across the North Pacific Ocean, peaking in the central North Pacific and off the coast of western North America. The PV 320 cyclolysis pattern does not show the unusually high lysis density peaks on the western coast of Canada shown in the ζ 850 pattern. As expected, the ζ 850 storm-associated precipitation pattern (Fig. 11A) reveals the highest rate of precipitation over the warm pool in the western tropical Pacific Ocean. Also as expected, bands of high precipitation circle the globe in the lower latitudes (i.e., the tropics), following the Intertropical Convergence Zone (ITCZ). In the mid-latitudes, precipitation patterns over the Pacific Ocean span between 15 N and 45 N, approximate- 23
30 ly south of the ζ 850 Pacific storm track. The local peaks in precipitation associated with the Pacific track occur east of Japan and north of Hawaii, USA. Fig. 11B reveals that the highest rate of precipitation associated with storms identified from PV 320 occurs over the warm pool region in the western tropical Pacific Ocean. The values in this region are masked out because the extremely large magnitude of precipitation in this region is an artifact of the computation, since the 320K surface intersects the Earth s surface and would be below it. Aside from differences in the tropics, the PV 320 storm-associated precipitation pattern follows a somewhat similar pattern to that of ζ 850. One region of PV 320 storm-associated precipitation that is dominant in the Northern Hemisphere occurs over the Pacific Ocean, and is associated with the Pacific storm track. This pattern lies between 15 N and 45 N except for its eastern end, which extends into the high latitudes beyond 45 N. It peaks in precipitation in two locations: one occurs just northwest of Hawaii, USA and the other occurs west of Hawaii, USA around the dateline. The PV 320 storm-associated precipitation pattern highlights the higher latitude extensions of precipitation, underlining the effect that storms from the Pacific storm track have on precipitation above the mid-latitudes in the Northern Hemisphere. This is exemplified in the eastern end of the precipitation pattern related to the Pacific track (Fig. 11B), where the existence of the local peak in precipitation is likely due to orographic effects associated with the Rocky Mountains North American-Atlantic (NAA) Storm Track The ζ 850 NAA storm track seen in Fig. 7A extends northeast from the central North American continent across the North Atlantic Ocean and into the Greenland Sea. 24
31 This track reveals small scale features such as the high latitude extension of the eastern end of the Atlantic track into the Greenland Sea. The highest number of storms in the NAA track occurs over the eastern coast of North America and southwest of Iceland. From the mean intensity pattern in Fig. 8A we see that one of the strongest storm tracks is the NAA track; its maximum strength is similar in magnitude to that of the Pacific track and occurs over the western half of the North Atlantic Ocean. Right away we notice three isolated regions of high genesis density in the ζ 850 cyclogenesis pattern on the leeward side of the Rocky Mountains in North America (Fig. 9A). The unusually high densities here could perhaps incorporate stationary waves; further study is needed to verify this. There is a region of relatively high genesis density off the eastern coast of North America that is thought to exist because of the Nor easter storms that develop there in the boreal winter; again, more analysis is required for verification. The ζ 850 cyclolysis pattern (Fig. 10A) reveals a few isolated regions of high lysis density over North America and Eurasia. Many storms from the NAA storm track dissipate east of the Hudson Bay in Canada and also south of Greenland. The PV 320 NAA storm track seen in Fig. 7B extends from the western-central North American continent to the western North Atlantic basin. The NAA track appears to have the greatest number of its storms occur around the Great Lakes region and also over the northeastern coast of North America. The peak mean intensity of the NAA track (Fig. 8B) occurs over the western North Atlantic Ocean. Fig. 9B shows that the most dense cyclogenesis regions associated with the NAA storm track spread from central North America to the western North Atlantic Ocean. Fig. 10B shows that the cyclolysis pattern 25
32 associated with the NAA track spreads across the northeastern North American continent into the North Atlantic Ocean. In the mid-latitudes, Fig. 11A reveals that the ζ 850 storm-associated precipitation pattern over the Atlantic Ocean spans between 15 N and 45 N, approximately south of its respective storm track. The local peaks in precipitation associated with the NAA storm track occur in the Gulf of Mexico and east of the United States. A dominant region of PV 320 storm-associated precipitation in the Northern Hemisphere (Fig. 11B) occurs over the Atlantic Ocean. This precipitation pattern lies between 15 N and 45 N except for the eastern end of the pattern, which extends into the high latitudes beyond 45 N. The PV 320 precipitation pattern associated with the NAA storm track peaks southeast of Florida, USA and east of North America. As the pattern approaches Europe, it extends northeastward toward Iceland and the Norwegian Sea, with a local peak residing west of the United Kingdom Mediterranean Storm Track and Other Features The ζ 850 Mediterranean storm track shown in Fig. 7A extends east across the entire Mediterranean Sea into the Middle East. The majority of storms that originate in the Mediterranean track travel over the eastern half of the Mediterranean Sea. Fig. 8A reveals the mean intensity of the Mediterranean track to be weak even when compared to the weak signal captured over the warm pool region in the western tropical Pacific Ocean. A region of high genesis density exists over western Italy in the Mediterranean Sea, and another exists south of Lake Baikal in Russia (Fig. 9A). Fig. 10A reveals that storms fol- 26
33 lowing the Mediterranean track disappear southeast from the eastern edge of the Mediterranean Sea to the Persian Gulf. The PV 320 Mediterranean storm track seen in Fig. 7B reaches eastward across the entire Mediterranean Sea to east of the Caspian Sea. The majority of storms that originate in the Mediterranean track travel over the eastern half of the Mediterranean Sea. The peak mean intensity of the Mediterranean track (Fig. 8B) is similar in magnitude to that of the PV 320 NAA track and occurs over the western half of the Mediterranean Sea. Fig. 9B shows that the Mediterranean track has the fewest number of cyclogenesis events when compared to the PV 320 Pacific and NAA tracks and spreads eastward from the Mediterranean Sea to the Middle East. The region south of Lake Baikal in Russia is vividly captured in the ζ 850 genesis pattern in Fig. 9A but is not at pronounced in the PV 320 pattern. The peaks in lysis density related to the Mediterranean track occur southeast of the Black Sea and east of the Caspian Sea, and are more isolated those related to the PV 320 Pacific and NAA tracks (Fig. 10B). There is a slight hint of the ζ 850 Mediterranean storm track in its corresponding precipitation pattern over the Mediterranean Sea, although its magnitude is about half of the local maxima in precipitation in both the ζ 850 Pacific and NAA patterns (Fig. 11A). The precipitation rate associated with the PV 320 Mediterranean track is low compared to those related to the PV 320 Pacific and NAA tracks (Fig. 11B). The Mediterranean precipitation reaches a maximum in the middle of the Mediterranean Sea; this region spreads from west of Spain to south of the Black Sea. 27
34 The ζ 850 storm track pattern in Fig. 7A reveals a fourth storm track in Siberia, which extends southwestward from Siberia until approximately 45 N. The magnitude of this track is comparable to the ζ 850 NAA storm track. The ζ 850 cyclolysis pattern (Fig. 10A) shows that many storms traveling across Siberia tend to disappear there. However, note that the PV 320 storm track pattern (Fig. 7B) does not display any hint of a Siberian storm track. There is speculation that the high magnitude of densities in Siberia highlighted in the ζ 850 storm track and ζ 850 cyclolysis pattern exist due to orographic effects or may be a mathematical product; these theories are supported by the lack of any notable cyclogenesis regions in or near Siberia in the cyclogenesis patterns of ζ 850 and PV 320 (Figs. 9A and 9B, respectively). It is suggested that the possible existence of a Siberian track be further studied to verify these theories. 28
35 Chapter 4. Discussion 4.1 Comparisons between variables using Eulerian Approach The storm track at 200hPa is displayed in the Northern Hemisphere as one large track that spans the entire globe. This track is slightly poleward of the 200hPa jet stream and has a spatial pattern that is similar to the jet stream but offset to the east by about 30 degrees longitude. Small spatial scales are not captured in part because of the vertical distance between the 200hPa pressure level and the earth s surface. The use of variables at this upper tropospheric level via the Eulerian approach is not recommended for detecting storms at stages of development that occur on small scales. The storm track pattern derived from the vorticity at 850hPa reveals two tracks that are clearly positioned poleward of the jet stream at 200hPa. Some small scaled features are captured as, e.g., peaks of strong storm tracks that occur in the central and eastern North Pacific basin. 4.2 Comparisons between Eulerian and Lagrangian Approaches The ζ 850 storm track pattern from the Lagrangian approach somewhat spatially resembles the Eulerian storm track at 200hPa. The ζ 850 mean intensity more closely resembles the standard deviation of the Eulerian vorticity field at 850hPa than it does the ζ 850 track density pattern. This is reasonable because the ζ 850 mean intensity is derived from the raw vorticity field at 850hPa, which is filtered in a similar fashion to that of the Eulerian low-level vorticity field. At first it seems that the Eulerian vorticity pattern exhibits more small scaled features than the Lagrangian ζ 850 mean intensity pattern; however, the Eulerian field appears to be biased toward higher latitudes as it entirely misses the storm strength over the warm pool region captured by the Lagrangian ζ 850 mean intensity pat- 29
36 tern. The Lagrangian ζ 850 field and the Eulerian vorticity best match in the mid-latitudes. Therefore, it is suggested that the standard deviation of the filtered vorticity field at 850hPa is better suited for the analysis of storm intensity rather than storm tracks themselves in the mid-latitudes in the Northern Hemisphere. The Siberian track highlighted in the ζ 850 track density pattern does not appear in the Eulerian 200hPa pattern. The PV 320 track density pattern shares only one notable commonality with the storm track pattern at 200hPa: they both flow along and on either side of 45 N. The PV 320 mean intensity pattern only slightly resembles the storm track pattern at 200hPa. The spatial structure of the PV 320 pattern extends from 30 N to 60 N from the western North Pacific Ocean to east of the Mediterranean Sea; the 200hPa storm track pattern shares the same latitudinal extension in the eastern North Pacific and North Atlantic basins, narrowing slightly over North America. The PV 320 mean intensity pattern reaches a maximum in the western North Pacific Ocean just a few degrees east of the local maximum in variability at 200hPa. The local maxima in PV 320 mean intensity over the North Atlantic basin reside near the single maximum in variability over the same basin at 200hPa. Other than these spatial similarities, the two patterns are dissimilar Pacific Storm Track The maxima in track density in the ζ 850 Pacific storm track are 5-10 degrees poleward of the strong Eulerian storm tracks in the Pacific; this is reflected over the North Pacific Ocean. The western end of the Pacific storm track shown in the ζ 850 track density pattern displays two extensions into the Asian continent, one emerging from eastern Asia and the other from south of Japan. These extensions are represented as one thin zonal area of average intensity in the 200hPa pattern. The 200hPa pattern does not capture the 30
Katherine E. Lukens and E. Hugo Berbery. Acknowledgements: Kevin I. Hodges 1 and Matthew Hawcroft 2. University of Reading, Reading, Berkshire, UK
 Boreal Winter Storm Tracks and Related Precipitation in North America: A Potential Vorticity Perspective Katherine E. Lukens and E. Hugo Berbery Acknowledgements: Kevin I. Hodges 1 and Matthew Hawcroft
The Planetary Circulation System
 12 The Planetary Circulation System Learning Goals After studying this chapter, students should be able to: 1. describe and account for the global patterns of pressure, wind patterns and ocean currents
The feature of atmospheric circulation in the extremely warm winter 2006/2007
 The feature of atmospheric circulation in the extremely warm winter 2006/2007 Hiroshi Hasegawa 1, Yayoi Harada 1, Hiroshi Nakamigawa 1, Atsushi Goto 1 1 Climate Prediction Division, Japan Meteorological
3. Midlatitude Storm Tracks and the North Atlantic Oscillation
 3. Midlatitude Storm Tracks and the North Atlantic Oscillation Copyright 2006 Emily Shuckburgh, University of Cambridge. Not to be quoted or reproduced without permission. EFS 3/1 Review of key results
Introduction of climate monitoring and analysis products for one-month forecast
 Introduction of climate monitoring and analysis products for one-month forecast TCC Training Seminar on One-month Forecast on 13 November 2018 10:30 11:00 1 Typical flow of making one-month forecast Observed
The imprint of strong storm tracks on winter weather in North America
 The imprint of strong storm tracks on winter weather in North America Article Accepted Version Lukens, K. E., Berbery, E. H. and Hodges, K. I. (2018) The imprint of strong storm tracks on winter weather
Wind: Global Systems Chapter 10
 Wind: Global Systems Chapter 10 General Circulation of the Atmosphere General circulation of the atmosphere describes average wind patterns and is useful for understanding climate Over the earth, incoming
Introduction of products for Climate System Monitoring
 Introduction of products for Climate System Monitoring 1 Typical flow of making one month forecast Textbook P.66 Observed data Atmospheric and Oceanic conditions Analysis Numerical model Ensemble forecast
East-west SST contrast over the tropical oceans and the post El Niño western North Pacific summer monsoon
 GEOPHYSICAL RESEARCH LETTERS, VOL. 32, L15706, doi:10.1029/2005gl023010, 2005 East-west SST contrast over the tropical oceans and the post El Niño western North Pacific summer monsoon Toru Terao Faculty
Eurasian Snow Cover Variability and Links with Stratosphere-Troposphere Coupling and Their Potential Use in Seasonal to Decadal Climate Predictions
 US National Oceanic and Atmospheric Administration Climate Test Bed Joint Seminar Series NCEP, Camp Springs, Maryland, 22 June 2011 Eurasian Snow Cover Variability and Links with Stratosphere-Troposphere
Maintenance of Circulation Anomalies during the 1988 Drought and 1993 Floods over the United States
 Department of Physical Sciences - Daytona Beach College of Arts & Sciences 9-1-1998 Maintenance of Circulation Anomalies during the 1988 Drought and 1993 Floods over the United States Alan Z. Liu Embry
Lecture 5: Atmospheric General Circulation and Climate
 Lecture 5: Atmospheric General Circulation and Climate Geostrophic balance Zonal-mean circulation Transients and eddies Meridional energy transport Moist static energy Angular momentum balance Atmosphere
Special blog on winter 2016/2017 retrospective can be found here -
 March 4, 2019 Special blog on winter 2016/2017 retrospective can be found here - http://www.aer.com/winter2017 Special blog on winter 2015/2016 retrospective can be found here - http://www.aer.com/winter2016
Charles Jones ICESS University of California, Santa Barbara CA Outline
 The Influence of Tropical Variations on Wintertime Precipitation in California: Pineapple express, Extreme rainfall Events and Long-range Statistical Forecasts Charles Jones ICESS University of California,
Analysis of Fall Transition Season (Sept-Early Dec) Why has the weather been so violent?
 Why has the weather been so violent?") WEATHER TOPICS Analysis of Fall Transition Season (Sept-Early Dec) 2009 Why has the weather been so violent? As can be seen by the following forecast map, the Fall Transition and early Winter Season of
WEATHER TOPICS Analysis of Fall Transition Season (Sept-Early Dec) 2009 Why has the weather been so violent? As can be seen by the following forecast map, the Fall Transition and early Winter Season of
What is the Madden-Julian Oscillation (MJO)?
?") What is the Madden-Julian Oscillation (MJO)? Planetary scale, 30 90 day oscillation in zonal wind, precipitation, surface pressure, humidity, etc., that propagates slowly eastward Wavelength = 12,000 20,000
What is the Madden-Julian Oscillation (MJO)? Planetary scale, 30 90 day oscillation in zonal wind, precipitation, surface pressure, humidity, etc., that propagates slowly eastward Wavelength = 12,000 20,000
Dynamics of the Extratropical Response to Tropical Heating
 Regional and Local Climate Modeling and Analysis Research Group R e L o C l i m Dynamics of the Extratropical Response to Tropical Heating (1) Wegener Center for Climate and Global Change (WegCenter) and
Lecture 8: Natural Climate Variability
 Lecture 8: Natural Climate Variability Extratropics: PNA, NAO, AM (aka. AO), SAM Tropics: MJO Coupled A-O Variability: ENSO Decadal Variability: PDO, AMO Unforced vs. Forced Variability We often distinguish
The Atmospheric Circulation
 The Atmospheric Circulation Vertical structure of the Atmosphere http://www.uwsp.edu/geo/faculty/ritter/geog101/textbook/atmosphere/atmospheric_structure.html The global heat engine [courtesy Kevin Trenberth,
Synoptic Meteorology
 M.Sc. in Meteorology Synoptic Meteorology [MAPH P312] Prof Peter Lynch Second Semester, 2004 2005 Seminar Room Dept. of Maths. Physics, UCD, Belfield. Part 9 Extratropical Weather Systems These lectures
The Morphology of Northern Hemisphere Blocking
 MAY 2008 T Y R L I S A N D H O S K I N S 1653 The Morphology of Northern Hemisphere Blocking E. TYRLIS AND B. J. HOSKINS Department of Meteorology, University of Reading, Reading, United Kingdom (Manuscript
The North Atlantic Oscillation: Climatic Significance and Environmental Impact
 1 The North Atlantic Oscillation: Climatic Significance and Environmental Impact James W. Hurrell National Center for Atmospheric Research Climate and Global Dynamics Division, Climate Analysis Section
CHAPTER 9 ATMOSPHERE S PLANETARY CIRCULATION MULTIPLE CHOICE QUESTIONS
 CHAPTER 9 ATMOSPHERE S PLANETARY CIRCULATION MULTIPLE CHOICE QUESTIONS 1. Viewed from above in the Northern Hemisphere, surface winds about a subtropical high blow a. clockwise and inward. b. counterclockwise.
Special blog on winter 2016/2017 retrospective can be found here -
 January 28, 2019 Special blog on winter 2016/2017 retrospective can be found here - http://www.aer.com/winter2017 Special blog on winter 2015/2016 retrospective can be found here - http://www.aer.com/winter2016
CPTEC and NCEP Model Forecast Drift and South America during the Southern Hemisphere Summer
 CPTEC and NCEP Model Forecast Drift and South America during the Southern Hemisphere Summer José Antonio Aravéquia 1 Pedro L. Silva Dias 2 (1) Center for Weather Forecasting and Climate Research National
Satellites, Weather and Climate Module??: Polar Vortex
 Satellites, Weather and Climate Module??: Polar Vortex SWAC Jan 2014 AKA Circumpolar Vortex Science or Hype? Will there be one this year? Today s objectives Pre and Post exams What is the Polar Vortex
ENSO, AO, and climate in Japan. 15 November 2016 Yoshinori Oikawa, Tokyo Climate Center, Japan Meteorological Agency
 ENSO, AO, and climate in Japan 15 November 2016 Yoshinori Oikawa, Tokyo Climate Center, Japan Meteorological Agency Aims of this lecture At the end of the yesterday s lecture, Hare-run said, - In the exercise
Possible Roles of Atlantic Circulations on the Weakening Indian Monsoon Rainfall ENSO Relationship
 2376 JOURNAL OF CLIMATE Possible Roles of Atlantic Circulations on the Weakening Indian Monsoon Rainfall ENSO Relationship C.-P. CHANG, PATRICK HARR, AND JIANHUA JU Department of Meteorology, Naval Postgraduate
ENSO Cycle: Recent Evolution, Current Status and Predictions. Update prepared by Climate Prediction Center / NCEP 23 April 2012
 ENSO Cycle: Recent Evolution, Current Status and Predictions Update prepared by Climate Prediction Center / NCEP 23 April 2012 Outline Overview Recent Evolution and Current Conditions Oceanic Niño Index
the 2 past three decades
 SUPPLEMENTARY INFORMATION DOI: 10.1038/NCLIMATE2840 Atlantic-induced 1 pan-tropical climate change over the 2 past three decades 3 4 5 6 7 8 9 10 POP simulation forced by the Atlantic-induced atmospheric
Dynamics of the Atmosphere. Large-scale flow with rotation and stratification
 12.810 Dynamics of the Atmosphere Large-scale flow with rotation and stratification Visualization of meandering jet stream Upper level winds from June 10th to July 8th 1988 from MERRA Red shows faster
Winds and Global Circulation
 Winds and Global Circulation Atmospheric Pressure Winds Global Wind and Pressure Patterns Oceans and Ocean Currents El Nino How is Energy Transported to its escape zones? Both atmospheric and ocean transport
Chapter 10: Mid-latitude Cyclones Mid-Latitude Cyclones
 Chapter 10: Mid-latitude Cyclones Mid-Latitude Cyclones Mid-latitude cyclones form along a boundary separating polar air from warmer air to the south. Life Cycle of Cyclone Cyclone Structures Steering
Chapter 10: Mid-latitude Cyclones
 Chapter 10: Mid-latitude Cyclones Life Cycle of Cyclone Cyclone Structures Steering of Cyclone Mid-Latitude Cyclones Mid-latitude cyclones form along a boundary separating polar air from warmer air to
JournalofGeophysicalResearch: Atmospheres
 JournalofGeophysicalResearch: Atmospheres RESEARCH ARTICLE Key Points: There is a connection between the tropical Pacific and the winter climate The SVD2 influence the winter climate over a large area
Characteristic blocking events over Ural-Siberia in Boreal Winter under Present and Future Climate Conditions
 Characteristic blocking events over Ural-Siberia in Boreal Winter under Present and Future Climate Conditions Wen Zhou & Hoffman Cheung Guy Carpenter Asia-Pacific Climate Impact Center School of Energy
MJO Influence in Continental United States Temperatures
 MJO Influence in Continental United States Temperatures An honors thesis presented to the Department of Atmospheric Science, University at Albany, State University Of New York in partial fulfillment of
Fixed Rossby Waves: Quasigeostrophic Explanations and Conservation of Potential Vorticity
 Fixed Rossby Waves: Quasigeostrophic Explanations and Conservation of Potential Vorticity 1. Observed Planetary Wave Patterns After upper air observations became routine, it became easy to produce contour
The ENSO s Effect on Eastern China Rainfall in the Following Early Summer
 ADVANCES IN ATMOSPHERIC SCIENCES, VOL. 26, NO. 2, 2009, 333 342 The ENSO s Effect on Eastern China Rainfall in the Following Early Summer LIN Zhongda ( ) andluriyu( F ) Center for Monsoon System Research,
General Circulation. Nili Harnik DEES, Lamont-Doherty Earth Observatory
 General Circulation Nili Harnik DEES, Lamont-Doherty Earth Observatory nili@ldeo.columbia.edu Latitudinal Radiation Imbalance The annual mean, averaged around latitude circles, of the balance between the
Climate Outlook for December 2015 May 2016
 The APEC CLIMATE CENTER Climate Outlook for December 2015 May 2016 BUSAN, 25 November 2015 Synthesis of the latest model forecasts for December 2015 to May 2016 (DJFMAM) at the APEC Climate Center (APCC),
Global Atmospheric Circulation
 Global Atmospheric Circulation Polar Climatology & Climate Variability Lecture 11 Nov. 22, 2010 Global Atmospheric Circulation Global Atmospheric Circulation Global Atmospheric Circulation The Polar Vortex
Role of Multiple-Level Tropospheric Circulations in Forcing ENSO Winter Precipitation Anomalies
 3102 MONTHLY WEATHER REVIEW Role of Multiple-Level Tropospheric Circulations in Forcing ENSO Winter Precipitation Anomalies SHAWN R. SMITH, PHAEDRA M. GREEN,* ALAN P. LEONARDI, AND JAMES J. O BRIEN Center
SUPPLEMENTARY INFORMATION
 Intensification of Northern Hemisphere Subtropical Highs in a Warming Climate Wenhong Li, Laifang Li, Mingfang Ting, and Yimin Liu 1. Data and Methods The data used in this study consists of the atmospheric
A Sub-Seasonal Teleconnection Analysis: PNA Development and Its. Relationship to the NAO
 A Sub-Seasonal Teleconnection Analysis: PNA Development and Its Relationship to the NAO Stephen Baxter Advisor: Professor Sumant Nigam University of Maryland, College Park A Scholarly Paper in partial
Changes in Southern Hemisphere rainfall, circulation and weather systems
 19th International Congress on Modelling and Simulation, Perth, Australia, 12 16 December 2011 http://mssanz.org.au/modsim2011 Changes in Southern Hemisphere rainfall, circulation and weather systems Frederiksen,
Examples of Pressure Gradient. Pressure Gradient Force. Chapter 7: Forces and Force Balances. Forces that Affect Atmospheric Motion 2/2/2015
 Chapter 7: Forces and Force Balances Forces that Affect Atmospheric Motion Fundamental force - Apparent force - Pressure gradient force Gravitational force Frictional force Centrifugal force Forces that
ENSO: Recent Evolution, Current Status and Predictions. Update prepared by: Climate Prediction Center / NCEP 30 October 2017
 ENSO: Recent Evolution, Current Status and Predictions Update prepared by: Climate Prediction Center / NCEP 30 October 2017 Outline Summary Recent Evolution and Current Conditions Oceanic Niño Index (ONI)
1. INTRODUCTION: 2. DATA AND METHODOLOGY:
 27th Conference on Hurricanes and Tropical Meteorology, 24-28 April 2006, Monterey, CA 3A.4 SUPERTYPHOON DALE (1996): A REMARKABLE STORM FROM BIRTH THROUGH EXTRATROPICAL TRANSITION TO EXPLOSIVE REINTENSIFICATION
5D.6 EASTERLY WAVE STRUCTURAL EVOLUTION OVER WEST AFRICA AND THE EAST ATLANTIC 1. INTRODUCTION 2. COMPOSITE GENERATION
 5D.6 EASTERLY WAVE STRUCTURAL EVOLUTION OVER WEST AFRICA AND THE EAST ATLANTIC Matthew A. Janiga* University at Albany, Albany, NY 1. INTRODUCTION African easterly waves (AEWs) are synoptic-scale disturbances
Interannual Teleconnection between Ural-Siberian Blocking and the East Asian Winter Monsoon
 Interannual Teleconnection between Ural-Siberian Blocking and the East Asian Winter Monsoon Hoffman H. N. Cheung 1,2, Wen Zhou 1,2 (hoffmancheung@gmail.com) 1 City University of Hong Kong Shenzhen Institute
Delayed Response of the Extratropical Northern Atmosphere to ENSO: A Revisit *
 Delayed Response of the Extratropical Northern Atmosphere to ENSO: A Revisit * Ruping Mo Pacific Storm Prediction Centre, Environment Canada, Vancouver, BC, Canada Corresponding author s address: Ruping
Tropical Cyclone Formation/Structure/Motion Studies
 Tropical Cyclone Formation/Structure/Motion Studies Patrick A. Harr Department of Meteorology Naval Postgraduate School Monterey, CA 93943-5114 phone: (831) 656-3787 fax: (831) 656-3061 email: paharr@nps.edu
Special blog on winter 2016/2017 retrospective can be found here -
 January 21, 2019 Special blog on winter 2016/2017 retrospective can be found here - http://www.aer.com/winter2017 Special blog on winter 2015/2016 retrospective can be found here - http://www.aer.com/winter2016
Quiz 2 Review Questions
 Quiz 2 Review Questions Chapter 7 Lectures: Winds and Global Winds and Global Winds cont 1) What is the thermal circulation (thermal wind) and how does it form? When we have this type of circulation, how
Special blog on winter 2016/2017 retrospective can be found here -
 February 11, 2019 Special blog on winter 2016/2017 retrospective can be found here - http://www.aer.com/winter2017 Special blog on winter 2015/2016 retrospective can be found here - http://www.aer.com/winter2016
UPDATE OF REGIONAL WEATHER AND SMOKE HAZE (December 2017)
") UPDATE OF REGIONAL WEATHER AND SMOKE HAZE (December 2017) 1. Review of Regional Weather Conditions for November 2017 1.1 In November 2017, Southeast Asia experienced inter-monsoon conditions in the first
UPDATE OF REGIONAL WEATHER AND SMOKE HAZE (December 2017) 1. Review of Regional Weather Conditions for November 2017 1.1 In November 2017, Southeast Asia experienced inter-monsoon conditions in the first
Transient and Eddy. Transient/Eddy Flux. Flux Components. Lecture 3: Weather/Disturbance. Transient: deviations from time mean Time Mean
 Lecture 3: Weather/Disturbance Transients and Eddies Climate Roles Mid-Latitude Cyclones Tropical Hurricanes Mid-Ocean Eddies Transient and Eddy Transient: deviations from time mean Time Mean Eddy: deviations
THE INFLUENCE OF CLIMATE TELECONNECTIONS ON WINTER TEMPERATURES IN WESTERN NEW YORK INTRODUCTION
 Middle States Geographer, 2014, 47: 60-67 THE INFLUENCE OF CLIMATE TELECONNECTIONS ON WINTER TEMPERATURES IN WESTERN NEW YORK Frederick J. Bloom and Stephen J. Vermette Department of Geography and Planning
ENSO: Recent Evolution, Current Status and Predictions. Update prepared by: Climate Prediction Center / NCEP 9 November 2015
 ENSO: Recent Evolution, Current Status and Predictions Update prepared by: Climate Prediction Center / NCEP 9 November 2015 Outline Summary Recent Evolution and Current Conditions Oceanic Niño Index (ONI)
Climate Forecast Applications Network (CFAN)
") Forecast of 2018 Atlantic Hurricane Activity April 5, 2018 Summary CFAN s inaugural April seasonal forecast for Atlantic tropical cyclone activity is based on systematic interactions among ENSO, stratospheric
Forecast of 2018 Atlantic Hurricane Activity April 5, 2018 Summary CFAN s inaugural April seasonal forecast for Atlantic tropical cyclone activity is based on systematic interactions among ENSO, stratospheric
General Atmospheric Circulation
 General Atmospheric Circulation Take away Concepts and Ideas Global circulation: The mean meridional (N-S) circulation Trade winds and westerlies The Jet Stream Earth s climate zones Monsoonal climate
Eliassen-Palm Theory
 Eliassen-Palm Theory David Painemal MPO611 April 2007 I. Introduction The separation of the flow into its zonal average and the deviations therefrom has been a dominant paradigm for analyses of the general
North Pacific Climate Overview N. Bond (UW/JISAO), J. Overland (NOAA/PMEL) Contact: Last updated: September 2008
, J. Overland (NOAA/PMEL) Contact: Last updated: September 2008") North Pacific Climate Overview N. Bond (UW/JISAO), J. Overland (NOAA/PMEL) Contact: Nicholas.Bond@noaa.gov Last updated: September 2008 Summary. The North Pacific atmosphere-ocean system from fall 2007
North Pacific Climate Overview N. Bond (UW/JISAO), J. Overland (NOAA/PMEL) Contact: Nicholas.Bond@noaa.gov Last updated: September 2008 Summary. The North Pacific atmosphere-ocean system from fall 2007
Lec 10: Interpreting Weather Maps
 Lec 10: Interpreting Weather Maps Case Study: October 2011 Nor easter FIU MET 3502 Synoptic Hurricane Forecasts Genesis: on large scale weather maps or satellite images, look for tropical waves (Africa
A kinematic mechanism for positive feedback between synoptic eddies and NAO
 Click Here for Full Article GEOPHYSICAL RESEARCH LETTERS, VOL. 36, L11709, doi:10.1029/2009gl037294, 2009 A kinematic mechanism for positive feedback between synoptic eddies and NAO Hong-Li Ren, 1,2 Fei-Fei
Special blog on winter 2016/2017 retrospective can be found here -
 February 25, 2019 Special blog on winter 2016/2017 retrospective can be found here - http://www.aer.com/winter2017 Special blog on winter 2015/2016 retrospective can be found here - http://www.aer.com/winter2016
A Preliminary Climatology of Extratropical Transitions in the Southwest Indian Ocean
 A Preliminary Climatology of Extratropical Transitions in the Southwest Indian Ocean Kyle S. Griffin Department of Atmospheric and Environmental Sciences, University at Albany, State University of New
Sources of CAM3 vorticity bias during northern winter from diagnostic study of the vorticity. equation. Richard Grotjahn and Lin-Lin Pan
 Sources of AM3 vorticity bias during northern winter from diagnostic study of the vorticity equation Richard Grotjahn and Lin-Lin Pan Department of Land, Air and Water Resources, University of alifornia,
Monitoring and Prediction of Climate Extremes
 Monitoring and Prediction of Climate Extremes Stephen Baxter Meteorologist, Climate Prediction Center NOAA/NWS/NCEP Deicing and Stormwater Management Conference ACI-NA/A4A Arlington, VA May 19, 2017 What
Early May Cut-off low and Mid-Atlantic rains
 Abstract: Early May Cut-off low and Mid-Atlantic rains By Richard H. Grumm National Weather Service State College, PA A deep 500 hpa cutoff developed in the southern Plains on 3 May 2013. It produced a
Warm Episode over Indian Sub-continent March 2010 By Richard Grumm National Weather Service State College Contributions by Lance Bosart SUNY Albany
 Warm Episode over Indian Sub-continent March 2010 By Richard Grumm National Weather Service State College Contributions by Lance Bosart SUNY Albany 1. INTRODUCTION A massive subtropical ridge formed over
The Origin and Dispersion Characteristics of the Observed Tropical Summertime Synoptic-Scale Waves over the Western Pacific*
 1630 M O N T H L Y W E A T H E R R E V I E W VOLUME 134 The Origin and Dispersion Characteristics of the Observed Tropical Summertime Synoptic-Scale Waves over the Western Pacific* CHI-YUNG TAM AND TIM
Instituto Geofisico del Perú (IGP), Lima, Peru; 2. University at Albany- State University of New York, New York, USA; 3
, Lima, Peru; 2. University at Albany- State University of New York, New York, USA; 3") Impacts of different ENSO flavors and tropical Pacific convection variability (ITCZ and SPCZ) on austral summer rainfall in South America, with a focus on Peru Juan Sulca 1, *, Ken Takahashi 1, Jhan-Carlo
Impacts of different ENSO flavors and tropical Pacific convection variability (ITCZ and SPCZ) on austral summer rainfall in South America, with a focus on Peru Juan Sulca 1, *, Ken Takahashi 1, Jhan-Carlo
ENSO Cycle: Recent Evolution, Current Status and Predictions. Update prepared by Climate Prediction Center / NCEP 11 November 2013
 ENSO Cycle: Recent Evolution, Current Status and Predictions Update prepared by Climate Prediction Center / NCEP 11 November 2013 Outline Overview Recent Evolution and Current Conditions Oceanic Niño Index
ENSO Cycle: Recent Evolution, Current Status and Predictions. Update prepared by Climate Prediction Center / NCEP 15 July 2013
 ENSO Cycle: Recent Evolution, Current Status and Predictions Update prepared by Climate Prediction Center / NCEP 15 July 2013 Outline Overview Recent Evolution and Current Conditions Oceanic Niño Index
A Subseasonal Teleconnection Analysis: PNA Development and Its Relationship to the NAO
 VOLUME 26 J O U R N A L O F C L I M A T E 15 SEPTEMBER 2013 A Subseasonal Teleconnection Analysis: PNA Development and Its Relationship to the NAO STEPHEN BAXTER AND SUMANT NIGAM University of Maryland,
Observational Study of Subtropical Highs. Richard Grotjahn Dept. of Land, Air, and Water Resources University of California, Davis, U.S.A.
 Observational Study of Subtropical Highs Richard Grotjahn Dept. of Land, Air, and Water Resources University of California, Davis, U.S.A. Organization of Talk There are 5 subtropical highs Question: What
Intraseasonal Variability and TC Forecasting
 Intraseasonal Variability and TC Forecasting 2017 WMO Class Eric Blake Hurricane Specialist National Hurricane Center 3/1/2017 Outline Madden-Julian Oscillation (MJO) MJO analysis tools Kelvin Waves Brief
The Predictability of Extratropical Storm Tracks and the. Sensitivity of their Prediction to the Observing System
 The Predictability of Extratropical Storm Tracks and the Sensitivity of their Prediction to the Observing System Lizzie S. R. Froude *, Lennart Bengtsson and Kevin I. Hodges Environmental Systems Science
Seasonal Climate Outlook for South Asia (June to September) Issued in May 2014
 Issued in May 2014") Ministry of Earth Sciences Earth System Science Organization India Meteorological Department WMO Regional Climate Centre (Demonstration Phase) Pune, India Seasonal Climate Outlook for South Asia (June
Ministry of Earth Sciences Earth System Science Organization India Meteorological Department WMO Regional Climate Centre (Demonstration Phase) Pune, India Seasonal Climate Outlook for South Asia (June
Climate Outlook for October 2017 March 2018
 The APEC CLIMATE CENTER Climate Outlook for October 2017 March 2018 BUSAN, 25 September 2017 The synthesis of the latest model forecasts for October 2017 to March 2018 (ONDJFM) from the APEC Climate Center
TROPICAL-EXTRATROPICAL INTERACTIONS
 Notes of the tutorial lectures for the Natural Sciences part by Alice Grimm Fourth lecture TROPICAL-EXTRATROPICAL INTERACTIONS Anomalous tropical SST Anomalous convection Anomalous latent heat source Anomalous
Tropical drivers of the Antarctic atmosphere
 Tropical drivers of the Antarctic atmosphere Bradford S. Barrett Gina R. Henderson Oceanography Department U. S. Naval Academy Acknowledge support of: NSF awards ARC-1203843 and AGS-1240143 ONR award N1416WX01752
Climate Outlook for March August 2018
 The APEC CLIMATE CENTER Climate Outlook for March August 2018 BUSAN, 26 February 2018 The synthesis of the latest model forecasts for March to August 2018 (MAMJJA) from the APEC Climate Center (APCC),
CHAPTER 2 DATA AND METHODS. Errors using inadequate data are much less than those using no data at all. Charles Babbage, circa 1850
 CHAPTER 2 DATA AND METHODS Errors using inadequate data are much less than those using no data at all. Charles Babbage, circa 185 2.1 Datasets 2.1.1 OLR The primary data used in this study are the outgoing
Conference on Teleconnections in the Atmosphere and Oceans November 2008
 1968-38 Conference on Teleconnections in the Atmosphere and Oceans 17-20 November 2008 Mid-latitude - MJO teleconnection over East Asia in the Northern winter KIM Baekmin Yonsei University Dept. of Atmospheric
ENSO Cycle: Recent Evolution, Current Status and Predictions. Update prepared by Climate Prediction Center / NCEP 5 August 2013
 ENSO Cycle: Recent Evolution, Current Status and Predictions Update prepared by Climate Prediction Center / NCEP 5 August 2013 Outline Overview Recent Evolution and Current Conditions Oceanic Niño Index
 Page 1 of 5 Home research global climate enso effects Research Effects of El Niño on world weather Precipitation Temperature Tropical Cyclones El Niño affects the weather in large parts of the world. The
Transient/Eddy Flux. Transient and Eddy. Flux Components. Lecture 7: Disturbance (Outline) Why transients/eddies matter to zonal and time means?
 Why transients/eddies matter to zonal and time means?") Lecture 7: Disturbance (Outline) Transients and Eddies Climate Roles Mid-Latitude Cyclones Tropical Hurricanes Mid-Ocean Eddies (From Weather & Climate) Flux Components (1) (2) (3) Three components contribute
Lecture 7: Disturbance (Outline) Transients and Eddies Climate Roles Mid-Latitude Cyclones Tropical Hurricanes Mid-Ocean Eddies (From Weather & Climate) Flux Components (1) (2) (3) Three components contribute
Four ways of inferring the MMC. 1. direct measurement of [v] 2. vorticity balance. 3. total energy balance
![Four ways of inferring the MMC. 1. direct measurement of [v] 2. vorticity balance. 3. total energy balance](/thumbs/88/114934484.jpg "Four ways of inferring the MMC. 1. direct measurement of [v] 2. vorticity balance. 3. total energy balance") Four ways of inferring the MMC 1. direct measurement of [v] 2. vorticity balance 3. total energy balance 4. eliminating time derivatives in governing equations Four ways of inferring the MMC 1. direct
Four ways of inferring the MMC 1. direct measurement of [v] 2. vorticity balance 3. total energy balance 4. eliminating time derivatives in governing equations Four ways of inferring the MMC 1. direct
The dynamics of the North Atlantic Oscillation during the summer season
 QUARTERLY JOURNAL OF THE ROYAL METEOROLOGICAL SOCIETY Q. J. R. Meteorol. Soc. (7) Published online in Wiley InterScience (www.interscience.wiley.com) DOI:./qj.7 The dynamics of the North Atlantic Oscillation
Characteristics of Storm Tracks in JMA s Seasonal Forecast Model
 Characteristics of Storm Tracks in JMA s Seasonal Forecast Model Akihiko Shimpo 1 1 Climate Prediction Division, Japan Meteorological Agency, Japan Correspondence: ashimpo@naps.kishou.go.jp INTRODUCTION
ENSO Cycle: Recent Evolution, Current Status and Predictions. Update prepared by Climate Prediction Center / NCEP 25 February 2013
 ENSO Cycle: Recent Evolution, Current Status and Predictions Update prepared by Climate Prediction Center / NCEP 25 February 2013 Outline Overview Recent Evolution and Current Conditions Oceanic Niño Index
KUALA LUMPUR MONSOON ACTIVITY CENT
 T KUALA LUMPUR MONSOON ACTIVITY CENT 2 ALAYSIAN METEOROLOGICAL http://www.met.gov.my DEPARTMENT MINISTRY OF SCIENCE. TECHNOLOGY AND INNOVATIO Introduction Atmospheric and oceanic conditions over the tropical
7.6 THE INFLUENCE OF LOW FREQUENCY AND SYNOPTIC VARIABILITY ON THE TIMING, MAGNITUDE, AND GEOGRAPHICAL DISTRIBUTION OF EXTREME WIND EVENTS
 7.6 THE INFLUENCE OF LOW FREQUENCY AND SYNOPTIC VARIABILITY ON THE TIMING, MAGNITUDE, AND GEOGRAPHICAL DISTRIBUTION OF EXTREME WIND EVENTS Jeffrey H. Yin* and Grant W. Branstator National Center for Atmospheric
The Arctic Oscillation (AO) or Northern Annular Mode (NAM)
 or Northern Annular Mode (NAM)") The Arctic Oscillation (AO) or Northern Annular Mode (NAM) Required reading for Thursday, Oct.14: -Kerr, R.A., 1999: A new force in high-latitude climate. Science, 284, 5412, 241-242. -Thompson DWJ, Wallace
The Arctic Oscillation (AO) or Northern Annular Mode (NAM) Required reading for Thursday, Oct.14: -Kerr, R.A., 1999: A new force in high-latitude climate. Science, 284, 5412, 241-242. -Thompson DWJ, Wallace
Toward Seamless Weather-Climate Prediction with a Global Cloud Resolving Model
 DISTRIBUTION STATEMENT A. Approved for public release; distribution is unlimited. Toward Seamless Weather-Climate Prediction with a Global Cloud Resolving Model PI: Tim Li IPRC/SOEST, University of Hawaii
Synoptic Meteorology II: Self-Development in the IPV Framework. 5-7 May 2015
 Synoptic Meteorology II: Self-Development in the IPV Framework 5-7 May 2015 Readings: Section 5.3.6 of Midlatitude Synoptic Meteorology. Introduction In this and other recent lectures, we have developed
UPDATE OF REGIONAL WEATHER AND SMOKE HAZE (February 2018)
") UPDATE OF REGIONAL WEATHER AND SMOKE HAZE (February 2018) 1. Review of Regional Weather Conditions for January 2018 1.1 The prevailing Northeast monsoon conditions over Southeast Asia strengthened in January
UPDATE OF REGIONAL WEATHER AND SMOKE HAZE (February 2018) 1. Review of Regional Weather Conditions for January 2018 1.1 The prevailing Northeast monsoon conditions over Southeast Asia strengthened in January