How to use the guidance tool (Producing Guidance and Verification)
|
|
|
- Philip Bell
- 5 years ago
- Views:
Transcription
1 Ex.1 How to use the guidance tool (Producing Guidance and Verification) Masayuki Hirai Tokyo Climate Center (TCC)/ Climate Prediction Division of Japan Meteorological Agency (JMA)
2 Schedule of exercise 17 Nov. (Tue.) Exercise of the one-month forecast 1. Creation of the guidance using common data 2. Creation of the guidance using individual data 18 Nov. (Wed.) 3. Interpretation of the other product (forecast map, check up of the prediction skill etc.) 4. Building one-month forecast 5. Making presentation file 19 Nov. (Thu.) AM 5. Making presentation file (cont.) 20 Nov. (Fri) AM PM Presentation (15min. 15 persons)
3 Setting an example of creation of the guidance (common data) Initial time of the model: 4 Nov 2015 (Wed.) Forecast target period: 7 Nov to 4 Dec (4 weeks mean) Forecast point: Tokyo/JAPAN (35.7N, 139.8E)
4 Workflow of the guidance tool 1. (Preparation) 1. Create the past observation file (csv format) 2. (using EXCEL file and itacs) 1. Check the initial date and target period 2. Production of guidance and verification (1) Get past observation data (2) Get hindcast data Input of the guidance tool (We have already prepared.) (3) Confirmation of prediction skill of guidance 3. Application to the real-time forecast Input of real-time forecast of model Obtaining solution of probabilistic forecast by the guidance
5 Workflow of the guidance tool 1. (Preparation) 1. Create the past observation file (csv format) 2. (using EXCEL file and itacs) 1. Check the initial date and target period 2. Production of guidance and verification (1) Get past observation data (2) Get hindcast data Input of the guidance tool (We have already prepared.) (3) Confirmation of prediction skill of guidance 3. Application to the real-time forecast Input of real-time forecast of model Obtaining solution of probabilistic forecast by the guidance
6 1. Past observation data Element: Mean temperature and precipitation (daily) Create the files separately between temperature and precipitation File format: csv Period: Every day from 1 January 1981 to 31 January 2011 Describe some information on observation point in the beginning five lines Embedded undefined value in case of missing data The next slide illustrates the example

7 Example of the observation data file Line -1: #station={station name} -2: #undef={undefined value} -3: #elname={temperature or precipitation} -4: #lon={longitude of the observation point} -5: #lat={latitude of the observation point} 1 January 1981 to 31 January 2011 After line-6: observation data {Year}, {Month}, {Day}, {Observational value} Embedded undefined value in case of missing data
8 Workflow of the guidance tool 1. (Preparation) 1. Create the past observation file (csv format) 2. (using EXCEL file and itacs) 1. Check the initial date and target period 2. Production of guidance and verification (1) Get past observation data (2) Get hindcast data Input of the guidance tool (We have already prepared.) (3) Confirmation of prediction skill of guidance 3. Application to the real-time forecast Input of real-time forecast of model Obtaining solution of probabilistic forecast by the guidance
9 Difference of initial date between hindcast and real-time forecast Note: The initial time and the forecast target period are different between verification of guidance by hindcast and real-time forecast, because operation procedures of NWP model are different between real-time and hindcast. Initial date Hindcast 10th, 20th and the end of month (10 Jan, 20 Jan, 31 Jan, 10 Feb,, 31 Dec) Real-time forecast Every Wednesday
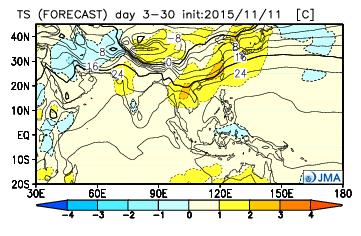
10 2.1. Check the initial date and target period (1) Initial date and forecast target period for hindcast Example 1 2 Hindcast 31 Jul 20 Nov 30 Nov Real-time forecast 29 Jul 25 Nov 1. Basically, the initial date for hindcast is the nearest to that for realtime forecast. 2. When the initial date for real-time forecast is just middle of the hindcast initial dates, later date is referred. Hindcast -4day Real-time forecast Initial time 31 Oct 4 Nov 2015 Target period 3 to 30 Nov. 7 Nov to 4 Dec 2015 Target period for the hindcast is shifted from the period for the real-time forecast.
11 Workflow of the guidance tool 1. (Preparation) 1. Create the past observation file (csv format) 2. (using EXCEL file and itacs) 1. Check the initial date and target period 2. Production of guidance and verification (1) Get past observation data (2) Get hindcast data Input of the guidance tool (We have already prepared.) (3) Confirmation of prediction skill of guidance 3. Application to the real-time forecast Input of real-time forecast of model Obtaining solution of probabilistic forecast by the guidance
12 Input data for the guidance Hindcast -4day Real-time forecast Initial time 31 Oct 4 Nov 2015 Target period 3 to 30 Nov. 7 Nov to 4 Dec 2015 Input of the guidance to create the guidance (3 to 30 Nov ( )) Past observation Model forecast (hindcast) For real-time forecast (for 7 Nov to 4 Dec) Model forecast (real-time forecast) Regression calculations using the data during hindcast period Input of the guidance for real-time forecast Calculations of nearnormal range for the real-time forecast
 1b; Real-time forecast period (1b) (2a, 2b) Hindcast (Model) (3) Real-time forecast (Model)")
13 Input field of the guidance tool observation Model 1a 1b 2a 2b Worksheet Calc_guidance (1a, 1b) Past observation Hindcast period (1a) 1b; Real-time forecast period (1b) (2a, 2b) Hindcast (Model) (3) Real-time forecast (Model) 3
 2.")

14 2.2 Input past observation data (1) Get past observation data (1 of 6) 1 itacs 1. Choose Analysis Dataset tab (default tab) 2. Choose USER_INPUT within Dataset for Data1 3. Choose UPLOAD_TXT within Element for Data1 4. Upload the past observation file created by users 5. Click Upload button 2 3 4a 5 4b Choose the past observation file in the dialog box
15 2.2 Input past observation data (1) Get past observation data (2 of 6) 6 itacs 7 Check Year-to-year Set period (hindcast or real-time forecast) 8 6. Click to check the box Year-to-year within Time unit 7. Set target period for hindcast Year: 1981 to 2010 Date; target period for {hindcast and real-time forecast} 8. Click Analysis Data Submit
 itacs (After")
 9 9.")

16 2.2 Input past observation data (1) Get past observation data (3 of 6) itacs (After Analysis Data Submit, time sequence graph is displayed.) 9 9.Click Download text zip file below the graph 10. Download the text file 11. Open the downloaded text file Downloaded text file
 Downloaded text file Time sequence data is described atfer nt =")
17 2.2 Input past observation data (1) Get past observation data (4 of 6) Downloaded text file Time sequence data is described atfer nt = **.

18 2.2 Input past observation data (1) Get past observation data (5 of 6) Worksheet Calc_guidance Copy and paste with the paste values option to the Excel file


 Once")

19 (Tips) For smoothly copy and paste The copied string sometimes include a blank line at the beginning. Thereupon, once copy the string to the tab Memopad and re-paste to the input field on the tab Calc_guidance 1) Once paste to the tab Memopad 2) Re-paste to the input field on the tab Calc_guidance Tab Memopad
 should be set with the exception of missing-data year.")
20 (Note) In case of continuous missing data in the past observation file If observation data for whole target period is missing for certain year, it is impossible to aggregate on itacs. If so, target year (i.e. Showing period ) should be set with the exception of missing-data year. (Example) Including missing data during 1981 to 1984; Aggregate 1985 to 2010 In this exercise, long-term missing data Cambodia data; 1981 to 1984 Singapore data; Jan to Jun 1981 Due to missing data during 1981 to 1984, itacs does not support aggregation of data.

 Copy and paste (with")
21 (Note) In case of continuous missing data in the past observation file Time sequence data from 1985 to 2010 Set blank field for missing period (1981 to 1984) Copy and paste (with value option)
 Get past")


22 2.2 Input past observation data (1) Get past observation data (6 of 6) Worksheet Calc_guidance Similarly, get the past observation data for the real-time forecast period
23 Workflow of the guidance tool 1. (Preparation) 1. Create the past observation file (csv format) 2. (using EXCEL file and itacs) 1. Check the initial date and target period 2. Production of guidance and verification (1) Get past observation data (2) Get hindcast data Input of the guidance tool (We have already prepared.) (3) Confirmation of prediction skill of guidance 3. Application to the real-time forecast Input of real-time forecast of model Obtaining solution of probabilistic forecast by the guidance

24 2.2 Input past observation data (2) Get hindcast data (1 of 5) 1 itacs 1. Choose Forecast Dataset tab 2. Choose 1MONTH_HIND within Dataset for Data1 3. Choose Element and Level for the predictor 2 3a 3b Major element for predictors Ex. 1000hPa temp. Isobatic (pressure levels) (1000,925,850,700,500, hpa) Temperature Dew-point depression (=T-Td) Wind (U or V) Geopotential height Surface Temperature Rain


25 2.2 Input past observation data (2) Get hindcast data (2 of 5) itacs 4. Input the nearest grid point from the observation site by 2.5, with in the cells Lat and Lon 5. Click to check the box Year-to-year within Time unit 6. Set target period for hindcast 7. Click Forecast Data Submit 7 4 In units of 2.5 Ex. Tokyo 35.7 N --> 35 N E --> 140 E 6a Check Year-to-year Year: 1981 to 2010 Date; target period for hindcast 5 6b
 itacs 8 8.")

26 2.2 Input past observation data (2) Get hindcast data (3 of 5) itacs 8 8. Click Download text zip file below the graph 9. Download the text file 10. Open the downloaded text file 9 10
 Copy and paste with paste values option 11 11.")
27 2.2 Input past observation data (2) Get hindcast data (4 of 5) Worksheet Calc_guidance (Recommendation) The element name should be memorized (ex. T1000) Copy and paste with paste values option Copy and paste with the paste values option to the Predictor (1 or 2) field in the Excel file
 Select the second predictors and")

28 2.2 Input past observation data (2) Get hindcast data (5 of 5) Select the second predictors and paste the hindcast data In this example, Meridional wind at 850hPa is selected as the second element.
29 Workflow of the guidance tool 1. (Preparation) 1. Create the past observation file (csv format) 2. (using EXCEL file and itacs) 1. Check the initial date and target period 2. Production of guidance and verification (1) Get past observation data (2) Get hindcast data Input of the guidance tool (We have already prepared.) (3) Confirmation of prediction skill of guidance 3. Application to the real-time forecast Input of real-time forecast of model Obtaining solution of probabilistic forecast by the guidance

30 2.2 Input past observation data (3) Confirmation of prediction skill of guidance (1 of 3) Worksheet Calc_guidance 1 1. Check up correlation Whether the correlation score of multi-regression better than that of single-regression? Normal The lower limit of near normal The upper limit of near normal slope Single Regression intercept Correlation slope Multi Regression intercept Correlation Correlation with the singleregression (predictor-1,-2, respectively) Correlation of guidance (multi-regression) Closer to 1 (preferably)
 BSS (preferable >0) (2b) reliability diagram Whether the reliability curve has a positive slope?")
31 2.2 Input past observation data (3) Confirmation of prediction skill of guidance (2 of 3) Worksheet Verification 2a 2b 2. Check up probabilistic verification (2a) BSS (preferable >0) (2b) reliability diagram Whether the reliability curve has a positive slope? Brier Skill Score 0.217
 Worksheet Calc_guidance 3 3.")

32 2.2 Input past observation data (3) Confirmation of prediction skill of guidance (3 of 3) Worksheet Calc_guidance 3 3. Check up prediction result for the noticeable year Example; Cool year; 1988, 2002 Warm year; 1990, 2004 The above cases are well predicted.
33 An example Prediction skill of guidance Objective variable Temperature Predictors 1000 hpa temperature 850hPa meridional wind Correlation Brier Skill Score Check up the skill of guidance selected two elements (predictors) Look for the more effective combination of variables
34 Hint; Recommended combination of predictors (Forecast of temperature) One predictor is selected among temperature Lower troposphere temperature (1000, 925, 850 hpa) or surface temperature As for the island point, to avoid using surface temp. might be better (i.e. using 925, 850hPa temp.). Another predictor is selected except for temperature, such as wind, TTD. In statistics, if two or more predictor variables in a multiple-regression are remarkably correlated, reliability of regression analysis become poor (multicollinearity). Example; (o) T1000 and V850, (x) T1000 and Tsurface
35 Hint; Recommended combination of predictors (Forecast of precipitation) One predictor is selected precipitation Another predictor is selected depending on regionality Example; Temperature or geopotential height in consideration of temperature-precipitation correlation Lower wind (U or V) in consideration of terrain condition
36 Workflow of the guidance tool 1. (Preparation) 1. Create the past observation file (csv format) 2. (using EXCEL file and itacs) 1. Check the initial date and target period 2. Production of guidance and verification (1) Get past observation data (2) Get hindcast data Input of the guidance tool (We have already prepared.) (3) Confirmation of prediction skill of guidance 3. Application to the real-time forecast Input of real-time forecast of model Obtaining solution of probabilistic forecast by the guidance

37 3 Application to the real-time forecast (1 of 5) itacs 1 2 3a 1. Choose Forecast Dataset tab 2. Choose 1MONTH_ENS_MEAN within Dataset for Data1 3. Choose Element and Level for the predictor 4. Input the nearest grid point from the observation site by 2.5, with in the cells Lat and Lon 3b 4 In units of 2.5 Ex. 1000hPa temp. Ex. Tokyo 35.7 N --> 35 N E --> 140 E

38 3 Application to the real-time forecast (2 of 5) 5. Click to check the box Ave within Time unit 6. Set target period for forecast 7. Click Forecast Data Submit itacs 6a 5 6b 7 Check Ave


39 3 Application to the real-time forecast (3 of 5) 8. Click Download text zip file 9. Download the text file 10. Open the downloaded text file itacs 9 10 Forecast value is described atfer nt = 1.
 Predictor")

40 3 Application to the real-time forecast (4 of 5) Worksheet Calc_guidance Predictor 1 (T1000) Predictor 2 (V850) 11.Copy and paste with the paste values option to the Predictor (1 or 2) field in the Excel file 11a 11b
 Probabilities by guidance for real-time")
41 3 Application to the real-time forecast (5 of 5) Worksheet Calc_guidance Below normal Near normal Above normal 3% 24% 73% (Output) Probabilities by guidance for real-time forecast

42 Confirmation of the output guidance In order to validate the output of guidance, it is recommended that the output of the guidance is compares with forecast of model. Forecast map Positive anomalies are predicted around Tokyo
43
How to Use the Guidance Tool (Producing Guidance and Verification)
") How to Use the Guidance Tool (Producing Guidance and Verification) Hiroshi Ohno Tokyo Climate Center (TCC)/ Climate Prediction Division of Japan Meteorological Agency (JMA) Workflow of the Excel Guidance
How to Use the Guidance Tool (Producing Guidance and Verification) Hiroshi Ohno Tokyo Climate Center (TCC)/ Climate Prediction Division of Japan Meteorological Agency (JMA) Workflow of the Excel Guidance
Akira Ito & Staffs of seasonal forecast sector
 Exercise : Producing site-specific guidance using domestic data Akira Ito & Staffs of seasonal forecast sector Climate Prediction Division Japan Meteorological Agency TCC Training Seminar on One-month
Exercise for Guidance. TCC Training Seminar on Application of Seasonal Forecast GPV Data to Seasonal Forecast Products January 2011
 Exercise for Guidance TCC Training Seminar on Application of Seasonal Forecast GPV Data to Seasonal Forecast Products 18-21 January 2011 Objectives To understand how to make guidance for seasonal-mean
Example of the one month forecast
 Example of the one month forecast Masayuki Hirai Tokyo Climate Center (TCC)/ Climate Prediction Division of Japan Meteorological Agency (JMA) Example Note that the initial time and the forecast target
Interpretation of Outputs from Numerical Prediction System
 Interpretation of Outputs from Numerical Prediction System Hiroshi OHNO Tokyo Climate Center (TCC)/ Climate Prediction Division of Japan Meteorological Agency (JMA) Procedure of Seasonal Forecast (1) 1.
Atmospheric circulation analysis for seasonal forecasting
 Training Seminar on Application of Seasonal Forecast GPV Data to Seasonal Forecast Products 18 21 January 2011 Tokyo, Japan Atmospheric circulation analysis for seasonal forecasting Shotaro Tanaka Climate
Exercise Part 1 - Producing Guidance and Verification -
 Exercise Part 1 - Producing Guidance and Verification - 1 Objectives To understand how to produce guidance for seasonal temperature and precipitation. To think rationally and find possible predictors.
Ryuji Yamada Tokyo Climate Center Japan Meteorological Agency E mail: URL:
 Ryuji Yamada Tokyo Center Japan Meteorological Agency E mail: tcc@met.kishou.go.jp URL: http://ds.data.jma.go.jp/tcc/tcc/index.html Tokyo Center (TCC) Established in April 2002 at JMA to support climate
Tokyo Climate Center Website (TCC website) and its products -For monitoring the world climate and ocean-
 and its products -For monitoring the world climate and ocean-") Tokyo, 14 November 2016, TCC Training Seminar Tokyo Climate Center Website (TCC website) and its products -For monitoring the world climate and ocean- Yasushi MOCHIZUKI Tokyo Climate Center Japan Meteorological
Tokyo, 14 November 2016, TCC Training Seminar Tokyo Climate Center Website (TCC website) and its products -For monitoring the world climate and ocean- Yasushi MOCHIZUKI Tokyo Climate Center Japan Meteorological
Products of the JMA Ensemble Prediction System for One-month Forecast
 Products of the JMA Ensemble Prediction System for One-month Forecast Shuhei MAEDA, Akira ITO, and Hitoshi SATO Climate Prediction Division Japan Meteorological Agency smaeda@met.kishou.go.jp Contents
JMA s Ensemble Prediction System for One-month and Seasonal Predictions
 JMA s Ensemble Prediction System for One-month and Seasonal Predictions Akihiko Shimpo Japan Meteorological Agency Seasonal Prediction Modeling Team: H. Kamahori, R. Kumabe, I. Ishikawa, T. Tokuhiro, S.
What is one-month forecast guidance?
 What is one-month forecast guidance? Kohshiro DEHARA (dehara@met.kishou.go.jp) Forecast Unit Climate Prediction Division Japan Meteorological Agency Outline 1. Introduction 2. Purposes of using guidance
Methods of forecast verification
 Methods of forecast verification Kiyotoshi Takahashi Climate Prediction Division Japan Meteorological Agency 1 Outline 1. Purposes of verification 2. Verification methods For deterministic forecasts For
JMA s Seasonal Prediction of South Asian Climate for Summer 2018
 JMA s Seasonal Prediction of South Asian Climate for Summer 2018 Atsushi Minami Tokyo Climate Center (TCC) Japan Meteorological Agency (JMA) Contents Outline of JMA s Seasonal Ensemble Prediction System
Verification of the Seasonal Forecast for the 2005/06 Winter
 Verification of the Seasonal Forecast for the 2005/06 Winter Shingo Yamada Tokyo Climate Center Japan Meteorological Agency 2006/11/02 7 th Joint Meeting on EAWM Contents 1. Verification of the Seasonal
Winter Forecast for GPC Tokyo. Shotaro TANAKA Tokyo Climate Center (TCC) Japan Meteorological Agency (JMA)
 Japan Meteorological Agency (JMA)") Winter Forecast for 2013 2014 GPC Tokyo Shotaro TANAKA Tokyo Climate Center (TCC) Japan Meteorological Agency (JMA) NEACOF 5, October 29 November 1, 2013 1 Outline 1. Numerical prediction 2. Interannual
Winter Forecast for 2013 2014 GPC Tokyo Shotaro TANAKA Tokyo Climate Center (TCC) Japan Meteorological Agency (JMA) NEACOF 5, October 29 November 1, 2013 1 Outline 1. Numerical prediction 2. Interannual
Verification at JMA on Ensemble Prediction
 Verification at JMA on Ensemble Prediction - Part Ⅱ : Seasonal prediction - Yukiko Naruse, Hitoshi Sato Climate Prediction Division Japan Meteorological Agency 05/11/08 05/11/08 Training seminar on Forecasting
TCC Training Seminar on One-month Forecast Products
 TCC Training Seminar on One-month Forecast Products 7 9 November 2011 Tokyo, Japan Tokyo Climate Center Japan Meteorological Agency TCC Training Seminar on One-month Forecast Products 7 9 November 2011
Lecture on outline of JMA s interactive tool for analysis of climate system
 Lecture on outline of JMA s interactive tool for analysis of climate system November 4, 2008 Ushida Shingo Climate Prediction Division of JMA Introduction To announce advanced information about climate
Recent Developments in Climate Information Services at JMA. Koichi Kurihara Climate Prediction Division, Japan Meteorological Agency
 Recent Developments in Climate Information Services at JMA Koichi Kurihara Climate Prediction Division, Japan Meteorological Agency 1 Topics 1. Diagnosis of the Northern Hemispheric circulation in December
S e a s o n a l F o r e c a s t i n g f o r t h e E u r o p e a n e n e r g y s e c t o r
 S e a s o n a l F o r e c a s t i n g f o r t h e E u r o p e a n e n e r g y s e c t o r C3S European Climatic Energy Mixes (ECEM) Webinar 18 th Oct 2017 Philip Bett, Met Office Hadley Centre S e a s
Shuhei Maeda Climate Prediction Division Global Environment and Marine Department Japan Meteorological Agency
 Eighth Session of the Forum on Regional Climate Monitoring, Assessment and Prediction for Asia (FOCRAII) 5-7 April 2012, Beijing, China Shuhei Maeda Climate Prediction Division Global Environment and Marine
In this activity, students will compare weather data from to determine if there is a warming trend in their community.
 Overview: In this activity, students will compare weather data from 1910-2000 to determine if there is a warming trend in their community. Objectives: The student will: use the Internet to locate scientific
University of Florida Department of Geography GEO 3280 Assignment 3
 G E O 3 2 8 A s s i g n m e n t # 3 Page 1 University of Florida Department of Geography GEO 328 Assignment 3 Modeling Precipitation and Elevation Solar Radiation Precipitation Evapo- Transpiration Vegetation
SYSTEM BRIEF DAILY SUMMARY
 SYSTEM BRIEF DAILY SUMMARY * ANNUAL MaxTemp NEL (MWH) Hr Ending Hr Ending LOAD (PEAK HOURS 7:00 AM TO 10:00 PM MON-SAT) ENERGY (MWH) INCREMENTAL COST DAY DATE Civic TOTAL MAXIMUM @Max MINIMUM @Min FACTOR
Predictability of Sudden Stratospheric Warmings in sub-seasonal forecast models
 Predictability of Sudden Stratospheric Warmings in sub-seasonal forecast models Alexey Karpechko Finnish Meteorological Institute with contributions from A. Charlton-Perez, N. Tyrrell, M. Balmaseda, F.
TCC Training Seminar on 17 th Nov 2015 JMA s Ensemble Prediction Systems (EPSs) and their Products for Climate Forecast.
 and their Products for Climate Forecast.") TCC Training Seminar on 17 th Nov 2015 JMA s Ensemble Prediction Systems (EPSs) and their Products for Climate Forecast Takashi Yamada Climate Prediction Division Japan Meteorological Agency 1 Contents
TCC Training Seminar on 17 th Nov 2015 JMA s Ensemble Prediction Systems (EPSs) and their Products for Climate Forecast Takashi Yamada Climate Prediction Division Japan Meteorological Agency 1 Contents
Seasonal Climate Watch September 2018 to January 2019
 Seasonal Climate Watch September 2018 to January 2019 Date issued: Aug 31, 2018 1. Overview The El Niño-Southern Oscillation (ENSO) is still in a neutral phase and is still expected to rise towards an
SYSTEM BRIEF DAILY SUMMARY
 SYSTEM BRIEF DAILY SUMMARY * ANNUAL MaxTemp NEL (MWH) Hr Ending Hr Ending LOAD (PEAK HOURS 7:00 AM TO 10:00 PM MON-SAT) ENERGY (MWH) INCREMENTAL COST DAY DATE Civic TOTAL MAXIMUM @Max MINIMUM @Min FACTOR
Clustering Techniques and their applications at ECMWF
 Clustering Techniques and their applications at ECMWF Laura Ferranti European Centre for Medium-Range Weather Forecasts Training Course NWP-PR: Clustering techniques and their applications at ECMWF 1/32
Program of the morning lectures
 Program of the morning lectures 09:30~11:00 Lecture Explanation of the numerical weather prediction (NWP) system Introduction of the NWP Products 11:15~12:45 Exercise Download of the binary model outputs
Exploring ensemble forecast calibration issues using reforecast data sets
 NOAA Earth System Research Laboratory Exploring ensemble forecast calibration issues using reforecast data sets Tom Hamill and Jeff Whitaker NOAA Earth System Research Lab, Boulder, CO tom.hamill@noaa.gov
Seasonal Hydrometeorological Ensemble Prediction System: Forecast of Irrigation Potentials in Denmark
 Seasonal Hydrometeorological Ensemble Prediction System: Forecast of Irrigation Potentials in Denmark Diana Lucatero 1*, Henrik Madsen 2, Karsten H. Jensen 1, Jens C. Refsgaard 3, Jacob Kidmose 3 1 University
Introduction of Seasonal Forecast Guidance. TCC Training Seminar on Seasonal Prediction Products November 2013
 Introduction of Seasonal Forecast Guidance TCC Training Seminar on Seasonal Prediction Products 11-15 November 2013 1 Outline 1. Introduction 2. Regression method Single/Multi regression model Selection
Update of the JMA s One-month Ensemble Prediction System
 Update of the JMA s One-month Ensemble Prediction System Japan Meteorological Agency, Climate Prediction Division Atsushi Minami, Masayuki Hirai, Akihiko Shimpo, Yuhei Takaya, Kengo Miyaoka, Hitoshi Sato,
Seasonal Climate Watch July to November 2018
 Seasonal Climate Watch July to November 2018 Date issued: Jun 25, 2018 1. Overview The El Niño-Southern Oscillation (ENSO) is now in a neutral phase and is expected to rise towards an El Niño phase through
Standardized Anomaly Model Output Statistics Over Complex Terrain.
 Standardized Anomaly Model Output Statistics Over Complex Terrain Reto.Stauffer@uibk.ac.at Outline statistical ensemble postprocessing introduction to SAMOS new snow amount forecasts in Tyrol sub-seasonal
Upgrade of JMA s Typhoon Ensemble Prediction System
 Upgrade of JMA s Typhoon Ensemble Prediction System Masayuki Kyouda Numerical Prediction Division, Japan Meteorological Agency and Masakazu Higaki Office of Marine Prediction, Japan Meteorological Agency
WHEN IS IT EVER GOING TO RAIN? Table of Average Annual Rainfall and Rainfall For Selected Arizona Cities
 WHEN IS IT EVER GOING TO RAIN? Table of Average Annual Rainfall and 2001-2002 Rainfall For Selected Arizona Cities Phoenix Tucson Flagstaff Avg. 2001-2002 Avg. 2001-2002 Avg. 2001-2002 October 0.7 0.0
What Does It Take to Get Out of Drought?
 What Does It Take to Get Out of Drought? Nolan J. Doesken Colorado Climate Center Colorado State University http://ccc.atmos.colostate.edu Presented at the Insects, Diseases and Drought Workshop, May 19,
Experimental MOS Precipitation Type Guidance from the ECMWF Model
 Experimental MOS Precipitation Type Guidance from the ECMWF Model Phillip E. Shafer David E. Rudack National Weather Service Meteorological Development Laboratory Silver Spring, MD Development Overview:
ENSO, AO, and climate in Japan. 15 November 2016 Yoshinori Oikawa, Tokyo Climate Center, Japan Meteorological Agency
 ENSO, AO, and climate in Japan 15 November 2016 Yoshinori Oikawa, Tokyo Climate Center, Japan Meteorological Agency Aims of this lecture At the end of the yesterday s lecture, Hare-run said, - In the exercise
Seasonal Climate Watch June to October 2018
 Seasonal Climate Watch June to October 2018 Date issued: May 28, 2018 1. Overview The El Niño-Southern Oscillation (ENSO) has now moved into the neutral phase and is expected to rise towards an El Niño
Utilization of seasonal climate predictions for application fields Yonghee Shin/APEC Climate Center Busan, South Korea
 The 20 th AIM International Workshop January 23-24, 2015 NIES, Japan Utilization of seasonal climate predictions for application fields Yonghee Shin/APEC Climate Center Busan, South Korea Background Natural
Seasonal Climate Watch April to August 2018
 Seasonal Climate Watch April to August 2018 Date issued: Mar 23, 2018 1. Overview The El Niño-Southern Oscillation (ENSO) is expected to weaken from a moderate La Niña phase to a neutral phase through
Fig.3.1 Dispersion of an isolated source at 45N using propagating zonal harmonics. The wave speeds are derived from a multiyear 500 mb height daily
 Fig.3.1 Dispersion of an isolated source at 45N using propagating zonal harmonics. The wave speeds are derived from a multiyear 500 mb height daily data set in January. The four panels show the result
Climatography of the United States No
 Climate Division: AK 5 NWS Call Sign: ANC Month (1) Min (2) Month(1) Extremes Lowest (2) Temperature ( F) Lowest Month(1) Degree s (1) Base Temp 65 Heating Cooling 90 Number of s (3) Jan 22.2 9.3 15.8
How far in advance can we forecast cold/heat spells?
 Sub-seasonal time scales: a user-oriented verification approach How far in advance can we forecast cold/heat spells? Laura Ferranti, L. Magnusson, F. Vitart, D. Richardson, M. Rodwell Danube, Feb 2012
Investigating Factors that Influence Climate
 Investigating Factors that Influence Climate Description In this lesson* students investigate the climate of a particular latitude and longitude in North America by collecting real data from My NASA Data
4.3.2 Configuration. 4.3 Ensemble Prediction System Introduction
 4.3 Ensemble Prediction System 4.3.1 Introduction JMA launched its operational ensemble prediction systems (EPSs) for one-month forecasting, one-week forecasting, and seasonal forecasting in March of 1996,
Using a library of downscaled climate projections to teach climate change analysis
 Using a library of downscaled climate projections to teach climate change analysis Eugene Cordero, Department of Meteorology San Jose State University Overview of Dataset Climate change activity Applications
Time Series and Forecasting
 Chapter 8 Time Series and Forecasting 8.1 Introduction A time series is a collection of observations made sequentially in time. When observations are made continuously, the time series is said to be continuous;
Activities of NOAA s NWS Climate Prediction Center (CPC)
") Activities of NOAA s NWS Climate Prediction Center (CPC) Jon Gottschalck and Dave DeWitt Improving Sub-Seasonal and Seasonal Precipitation Forecasting for Drought Preparedness May 27-29, 2015 San Diego,
Activities of NOAA s NWS Climate Prediction Center (CPC) Jon Gottschalck and Dave DeWitt Improving Sub-Seasonal and Seasonal Precipitation Forecasting for Drought Preparedness May 27-29, 2015 San Diego,
ENSO Outlook by JMA. Hiroyuki Sugimoto. El Niño Monitoring and Prediction Group Climate Prediction Division Japan Meteorological Agency
 ENSO Outlook by JMA Hiroyuki Sugimoto El Niño Monitoring and Prediction Group Climate Prediction Division Outline 1. ENSO impacts on the climate 2. Current Conditions 3. Prediction by JMA/MRI-CGCM 4. Summary
Application and verification of ECMWF products 2012
 Application and verification of ECMWF products 2012 Met Eireann, Glasnevin Hill, Dublin 9, Ireland. J.Hamilton 1. Summary of major highlights The verification of ECMWF products has continued as in previous
Orange Visualization Tool (OVT) Manual
 Manual") Orange Visualization Tool (OVT) Manual This manual describes the features of the tool and how to use it. 1. Contents of the OVT Once the OVT is open (the first time it may take some seconds), it should
Orange Visualization Tool (OVT) Manual This manual describes the features of the tool and how to use it. 1. Contents of the OVT Once the OVT is open (the first time it may take some seconds), it should
TCC Recent Development and Activity
 11 May 2015, FOCRAII TCC Recent Development and Activity Yasushi MOCHIZUKI Tokyo Climate Center Japan Meteorological Agency TCC Recent Development and Activity / Tokyo Climate Center Tokyo Climate Center
Sub-seasonal predictions at ECMWF and links with international programmes
 Sub-seasonal predictions at ECMWF and links with international programmes Frederic Vitart and Franco Molteni ECMWF, Reading, U.K. Using ECMWF forecasts, 4-6 June 2014 1 Outline Recent progress and plans
WMO LC-LRFMME Website User Manual
 WMO LC-LRFMME Website User Manual World Meteorological Organization Lead Centre for Long-Range Forecast Multi-Model Ensemble Last update: August 2016 Contents 1. WMO LC-LRFMME Introduction... 1 1.1. Overview
Guidelines for the Submission of the World Weather Records 2011+
 Guidelines for the Submission of the World Weather Records 2011+ 2017 edition WEATHER CLIMATE WATER WMO-No. 1186 Guidelines for the Submission of the World Weather Records 2011+ 2017 edition WMO-No. 1186
A review on recent progresses of THORPEX activities in JMA
 4th THORPEX workshop 31 Oct. 2012, Kunming, China A review on recent progresses of THORPEX activities in JMA Masaomi NAKAMURA Typhoon Research Department Meteorological Research Institute / JMA Contents
Application and verification of ECMWF products 2018
 Application and verification of ECMWF products 2018 National Meteorological Administration, Romania 1. Summary of major highlights In the field of numerical model verification, the daily GRID_STAT method
Tokyo Climate Center s activities as RCC Tokyo
 First WMO Workshop on Operational Climate Prediction Pune, India, 09-11 November 2015 Tokyo Climate Center s activities as RCC Tokyo Arata Endo Tokyo Climate Center Japan Meteorological Agency E-mail:
What is the difference between Weather and Climate?
 What is the difference between Weather and Climate? Objective Many people are confused about the difference between weather and climate. This makes understanding the difference between weather forecasts
The 2010/11 drought in the Horn of Africa: Monitoring and forecasts using ECMWF products
 The 2010/11 drought in the Horn of Africa: Monitoring and forecasts using ECMWF products Emanuel Dutra Fredrik Wetterhall Florian Pappenberger Souhail Boussetta Gianpaolo Balsamo Linus Magnusson Slide
Long Range Forecasts of 2015 SW and NE Monsoons and its Verification D. S. Pai Climate Division, IMD, Pune
 Long Range Forecasts of 2015 SW and NE Monsoons and its Verification D. S. Pai Climate Division, IMD, Pune Other Contributors: Soma Sen Roy, O. P. Sreejith, Kailas, Madhuri, Pallavi, Mahendra and Jasmine
Probabilistic Weather Forecasting and the EPS at ECMWF
 Probabilistic Weather Forecasting and the EPS at ECMWF Renate Hagedorn European Centre for Medium-Range Weather Forecasts 30 January 2009: Ensemble Prediction at ECMWF 1/ 30 Questions What is an Ensemble
Data Structures & Database Queries in GIS
 Data Structures & Database Queries in GIS Objective In this lab we will show you how to use ArcGIS for analysis of digital elevation models (DEM s), in relationship to Rocky Mountain bighorn sheep (Ovis
August 2014 Climate Summary. Rainfall Outlook and Drought Update for October - December 2014
 METEOROLOGY DIVISION MINISTRY OF CLIMATE CHANGE, ENERGY, DISASTER MANAGEMENT, METEOROLOGY, INFORMATION & COMMUNICATIONS. KINGDOM OF TONGA Climate Update for Tonga August Climate Summary Rainfall Outlook
Appendix 4 Weather. Weather Providers
 Appendix 4 Weather Using weather data in your automation solution can have many benefits. Without weather data, your home automation happens regardless of environmental conditions. Some things you can
Seasonal Forecast (One-month Forecast)
") Seasonal Forecast (One-month Forecast) Hiroshi Ohno Tokyo Climate Center (TCC)/ Climate Prediction Division of Japan Meteorological Agency (JMA) Outline Introduction Predictability and Ensemble Prediction
Seasonal Forecast (One-month Forecast) Hiroshi Ohno Tokyo Climate Center (TCC)/ Climate Prediction Division of Japan Meteorological Agency (JMA) Outline Introduction Predictability and Ensemble Prediction
Climatography of the United States No
 Climate Division: CA 6 NWS Call Sign: 1L2 N Lon: 118 3W Month (1) Min (2) Month(1) Extremes Lowest (2) Temperature ( F) Lowest Month(1) Degree s (1) Base Temp 65 Heating Cooling 1 Number of s (3) Jan 63.7
UWM Field Station meteorological data
 University of Wisconsin Milwaukee UWM Digital Commons Field Station Bulletins UWM Field Station Spring 992 UWM Field Station meteorological data James W. Popp University of Wisconsin - Milwaukee Follow
The benefits and developments in ensemble wind forecasting
 The benefits and developments in ensemble wind forecasting Erik Andersson Slide 1 ECMWF European Centre for Medium-Range Weather Forecasts Slide 1 ECMWF s global forecasting system High resolution forecast
In order to save time, the following data files have already been preloaded to the computer (most likely under c:\odmc2012\data\)
") ODMC2012 QGIS Ex1 Schools and Public Transport In this exercise, users will learn how to a) map the location of secondary schools in and around the Southampton area; b) overlay the school location map
ODMC2012 QGIS Ex1 Schools and Public Transport In this exercise, users will learn how to a) map the location of secondary schools in and around the Southampton area; b) overlay the school location map
TIGGE at ECMWF. David Richardson, Head, Meteorological Operations Section Slide 1. Slide 1
 TIGGE at ECMWF David Richardson, Head, Meteorological Operations Section david.richardson@ecmwf.int Slide 1 Slide 1 ECMWF TIGGE archive The TIGGE database now contains five years of global EPS data Holds
WMO Lead Centre activities for global sub-seasonal MME prediction
 Workshop on sub-seasonal predictability, 2-5 November 2015, ECMWF WMO Lead Centre activities for global sub-seasonal MME prediction Suhee Park Korea Meteorological Administration Contents Introduction
Precipitation verification. Thanks to CMC, CPTEC, DWD, ECMWF, JMA, MF, NCEP, NRL, RHMC, UKMO
 Precipitation verification Thanks to CMC, CPTEC, DWD, ECMWF, JMA, MF, NCEP, NRL, RHMC, UKMO Outline 1) Status of WGNE QPF intercomparisons 2) Overview of the use of recommended methods for the verification
Using the EartH2Observe data portal to analyse drought indicators. Lesson 4: Using Python Notebook to access and process data
 Using the EartH2Observe data portal to analyse drought indicators Lesson 4: Using Python Notebook to access and process data Preface In this fourth lesson you will again work with the Water Cycle Integrator
YEAR 10 GENERAL MATHEMATICS 2017 STRAND: BIVARIATE DATA PART II CHAPTER 12 RESIDUAL ANALYSIS, LINEARITY AND TIME SERIES
 YEAR 10 GENERAL MATHEMATICS 2017 STRAND: BIVARIATE DATA PART II CHAPTER 12 RESIDUAL ANALYSIS, LINEARITY AND TIME SERIES This topic includes: Transformation of data to linearity to establish relationships
Application and verification of the ECMWF products Report 2007
 Application and verification of the ECMWF products Report 2007 National Meteorological Administration Romania 1. Summary of major highlights The medium range forecast activity within the National Meteorological
Application and verification of ECMWF products 2012
 Application and verification of ECMWF products 2012 National Meteorological Administration 1. Summary of major highlights The objective verification of all deterministic models forecasts in use have been
Climatography of the United States No
 Climate Division: CA 5 NWS Call Sign: Elevation: 6 Feet Lat: 37 Month (1) Min (2) Month(1) Extremes Lowest (2) Temperature ( F) Lowest Month(1) Degree s (1) Base Temp 65 Heating Cooling 1 Number of s (3)
The Impact of Horizontal Resolution and Ensemble Size on Probabilistic Forecasts of Precipitation by the ECMWF EPS
 The Impact of Horizontal Resolution and Ensemble Size on Probabilistic Forecasts of Precipitation by the ECMWF EPS S. L. Mullen Univ. of Arizona R. Buizza ECMWF University of Wisconsin Predictability Workshop,
Climatography of the United States No
 Climate Division: CA 4 NWS Call Sign: Elevation: 2 Feet Lat: 37 Month (1) Min (2) Month(1) Extremes Lowest (2) Temperature ( F) Lowest Month(1) Degree s (1) Base Temp 65 Heating Cooling 1 Number of s (3)
Climatography of the United States No
 Climate Division: CA 4 NWS Call Sign: Elevation: 13 Feet Lat: 36 Month (1) Min (2) Month(1) Extremes Lowest (2) Temperature ( F) Lowest Month(1) Degree s (1) Base Temp 65 Heating Cooling 1 Number of s
Climatography of the United States No
 Climate Division: CA 5 NWS Call Sign: Elevation: 1,14 Feet Lat: 36 Month (1) Min (2) Month(1) Extremes Lowest (2) Temperature ( F) Lowest Month(1) Degree s (1) Base Temp 65 Heating Cooling 1 Number of
Developing Operational MME Forecasts for Subseasonal Timescales
 Developing Operational MME Forecasts for Subseasonal Timescales Dan C. Collins NOAA Climate Prediction Center (CPC) Acknowledgements: Stephen Baxter and Augustin Vintzileos (CPC and UMD) 1 Outline I. Operational
Forecasting the electricity consumption by aggregating specialized experts
 Forecasting the electricity consumption by aggregating specialized experts Pierre Gaillard (EDF R&D, ENS Paris) with Yannig Goude (EDF R&D) Gilles Stoltz (CNRS, ENS Paris, HEC Paris) June 2013 WIPFOR Goal
UNST 232 Mentor Section Assignment 5 Historical Climate Data
 UNST 232 Mentor Section Assignment 5 Historical Climate Data 1 introduction Informally, we can define climate as the typical weather experienced in a particular region. More rigorously, it is the statistical
ALASKA REGION CLIMATE OUTLOOK BRIEFING. December 22, 2017 Rick Thoman National Weather Service Alaska Region
 ALASKA REGION CLIMATE OUTLOOK BRIEFING December 22, 2017 Rick Thoman National Weather Service Alaska Region Today s Outline Feature of the month: Autumn sea ice near Alaska Climate Forecast Basics Climate
Climatography of the United States No
 Climate Division: CA 6 NWS Call Sign: LAX Elevation: 1 Feet Lat: 33 Month (1) Min (2) Month(1) Extremes Lowest (2) Temperature ( F) Lowest Month(1) Degree s (1) Base Temp 65 Heating Cooling 1 Number of
Climatography of the United States No
 Climate Division: CA 6 NWS Call Sign: TOA Elevation: 11 Feet Lat: 33 2W Temperature ( F) Month (1) Min (2) Month(1) Extremes Lowest (2) Lowest Month(1) Degree s (1) Base Temp 65 Heating Cooling 1 Number
GPC Exeter forecast for winter Crown copyright Met Office
 GPC Exeter forecast for winter 2015-2016 Global Seasonal Forecast System version 5 (GloSea5) ensemble prediction system the source for Met Office monthly and seasonal forecasts uses a coupled model (atmosphere
Hands-on Exercise Quantitative Precipitation Estimation
 Hands-on Exercise Quantitative Precipitation Estimation 8 February 2018 Takanori SAKANASHI Asia Pacific Severe Weather Center, Forecast Division, Forecast Department Purpose of this hands-on training To
Five years of limited-area ensemble activities at ARPA-SIM: the COSMO-LEPS system
 Five years of limited-area ensemble activities at ARPA-SIM: the COSMO-LEPS system Andrea Montani, Chiara Marsigli and Tiziana Paccagnella ARPA-SIM Hydrometeorological service of Emilia-Romagna, Italy 11
Application and verification of ECMWF products 2016
 Application and verification of ECMWF products 2016 Met Eireann, Glasnevin Hill, Dublin 9, Ireland. J.Hamilton 1. Summary of major highlights The verification of ECMWF products has continued as in previous
Global climate predictions: forecast drift and bias adjustment issues
 www.bsc.es Ispra, 23 May 2017 Global climate predictions: forecast drift and bias adjustment issues Francisco J. Doblas-Reyes BSC Earth Sciences Department and ICREA Many of the ideas in this presentation
Climatography of the United States No
 No. 2 1971-2 Asheville, North Carolina 2881 COOP ID: 43417 Climate Division: CA 4 NWS Call Sign: N Lon: 121 Month (1) Min (2) Month(1) Extremes Lowest (2) Temperature ( F) Lowest Month(1) Degree s (1)
TC/PR/RB Lecture 3 - Simulation of Random Model Errors
 TC/PR/RB Lecture 3 - Simulation of Random Model Errors Roberto Buizza (buizza@ecmwf.int) European Centre for Medium-Range Weather Forecasts http://www.ecmwf.int Roberto Buizza (buizza@ecmwf.int) 1 ECMWF