ERTH 365 Homework #2: Hurricane Harvey. 100 points
|
|
|
- Hugh Lloyd
- 5 years ago
- Views:
Transcription
1 ERTH 365 Homework #2: Hurricane Harvey 100 points Due by 6pm, Tuesday 30 October 2018, ELECTRONIC SUBMISSON BY ONLY BY 6PM (send to (acceptable formats: MS Word, Google Doc, plain text, or answers via regular ) NO LATE SUBMISSONS ACEPTED Student Learning Outcomes: Upper Division Science A. C, E,F, and G; Environmental Interconnection, A, C, D, and E; Ethical Reasoning and Action, A and B. Note: When written answers are required, please respond with a complete sentence or sentences, each with a subject, verb and object. You do not need to print the graphics, though you will need to look at them. Use this link to see a web version of this homework including the graphics, which you will need to answer these questions: ork_2_f18.html Look at all the links associated with Harvey on the supplementary class notes page to assist you with this homework. Part 1. Hurricane Harvey, August 25, 2017 Satellite Imagery (20pts)
2
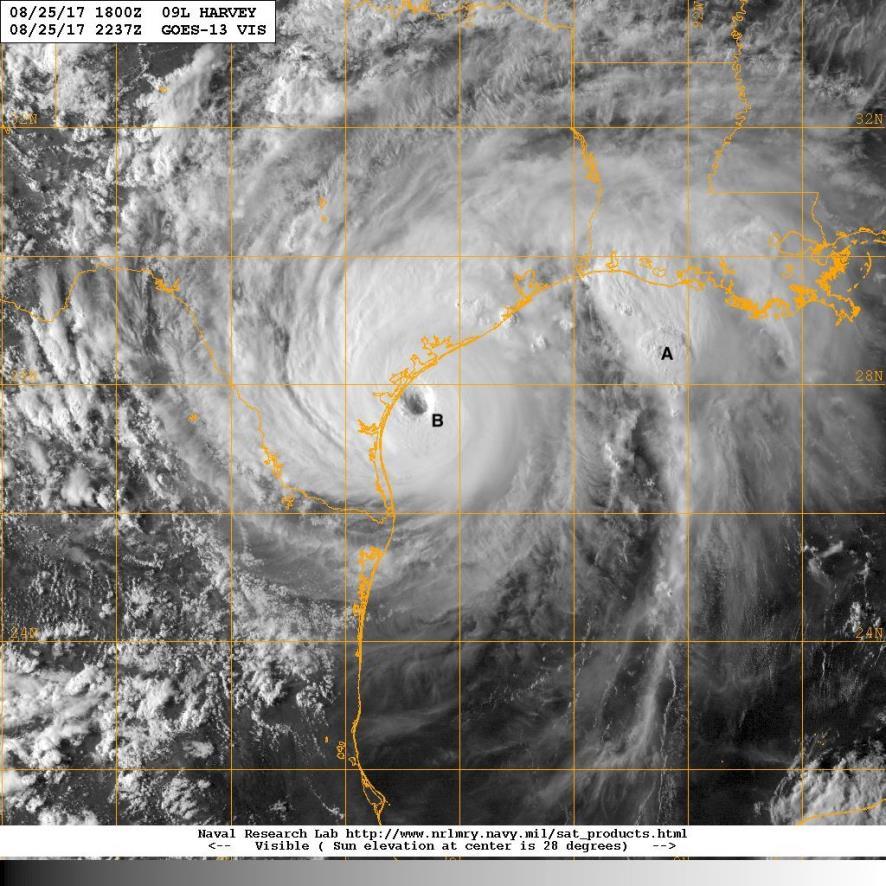
 The coldest cloud tops are associated with the two locations.")
3 Compare the two images, which are for 2237 UTC 8/25/17. Note the portions of the images labeled A and B (the same locations at the same times for both images). Answer the following questions. Questions: 1 What evidence do you see on the INFRARED image that the clouds at the two locations are probably cumulonimbus? (6 pts) The coldest cloud tops are associated with the two locations. The red and yellow color indicates temperatures of around -70C and -80C. Cold temperatures can be associated with towering clouds, such as cumulonimbus. 2 What evidence do you see on the VISIBLE image that the cloud at A is cumulonimbus? (6 pts) The area labeled A is towering so high above the surrounding overcast that it is casting a shadow. This means that the top of the cloud is much taller than the surrounding cloud mass, and is probably associated with a cumulonimbus.
 The coldest cloud tops appear to be around the center of the storm, as mentioned in answer to (1) above.")
4 3 In general, with respect to the center of the storm, where would you expect the heaviest precipitation to be occurring and why? use the images to justify your answer (8 pts) The coldest cloud tops appear to be around the center of the storm, as mentioned in answer to (1) above. Thus, towering cloud forms, usually associated with heavy precipitation, should be occurring around the center of the storm. Part 2. Hurricane Harvey, Surface Weather Map (25pts) Surface pressure map at 06UTC on Friday, 25 th August Isobars every 4hPa. Questions: 1. What time was this weather chart created for in local time for Corpus Christie? (2pts) 01 AM CDT FRI, 25 th August What is the approximate lowest pressure seen in Hurricane Harvey? (3pts) 992 hpa. 3. Assuming that there no actual data on the weather chart, but only pressure lines or isobars are visible, describe what you see on the surface weather map that would suggest that strong winds would be occurring at the location of SHIP A in the north-
5 west Gulf of Mexico coastal sections (5 pts) The isobars are very close together. This suggests that the wind speeds would be very high in that location. 4. Examine the weather information for SHIP A and write down the temperature, dewpoint, pressure and wind speed. Describe how the (a) dew point temperature; (b) wind speed; and, (c) atmospheric pressure were unusual (compared to the kind of values we have seen so far this semester on the surface weather maps). (10 pts) The temperature is 85F. The dewpoint temperature of 78F is higher than any dewpoint we have seen on a weather map in this class, and much greater than the 60F dew point we've discussed as being a threshold for thunderstorms. The sustained wind speed is 35 mph, which is also the highest sustained wind speed we have seen on a surface weather map, as well as being strong for a sustained wind speed at sea-level. Finally, the atmospheric pressure is hpa, which is also lower than average pressure of hPa and also lower than we have seen on a weather map in this class, but not as low as some pressures we have seen in some of the hurricanes discussed this semester, which were well below 1000hPa. 5. Examine the weather information for SHIP A and Ship B and write down the wind speeds at each location and why the wind speed at SHIP A is much higher than the wind speeds at SHIP B. (5pts) The wind speed at SHIP A is approximately 35mph, while at SHIP B it is about 10mph. SHIP A is much closer to the center of Hurricane Harvey and the isobars are much closer together a SHIP A than at SHIP B, therefore accounting for the higher wind speed. Part 3. Hurricane Harvey, Corpus Christie Meteogram (15pts) CDT = 5hrs behind UTC CST = 6hrs behind UTC. It s AUG, so CDT. (answers in either local or UTC are acceptable)
 The lowest pressure was observed around 23 UTC (6:00 PM CDT) on 25 August. This appears to be the time that the storm was closest to Corpus Christie.")
6 Meteogram for Corpus Christie from 00UTC 23UTC 25 August Questions: 1. Give the date and time at which the center of Harvey was closest to Corpus Christie and how did you tell. (7 pts) The lowest pressure was observed around 23 UTC (6:00 PM CDT) on 25 August. This appears to be the time that the storm was closest to Corpus Christie. Also, the strongest winds occurred at that time. 2. What was the date and time of the peak wind gust, and what was its strength and direction? (5 pts) The peak wind gust was 54 mph, and that was observed at 23 UTC (6 PM CDT) on 25 August. 3. One of the chief problems in the Corpus Christie region with the passage of Harvey was
, and how much rainfall occurred at Corpus Christie over the 24hour period shown?")
7 something called the "storm surge" and not the wind, or the rainfall associated with the storm. However, what was the strongest sustained wind (include date and time), and how much rainfall occurred at Corpus Christie over the 24hour period shown? (3pts) The strongest sustained wind was northwest at 35 mph, and that was observed at 23 UTC (6:00 PM CDT) on 25 August. 0.98" of rainfall occurred during the 24hr period. Part 4. Hurricane Harvey, Corpus Christie Radar Animation (20pts) Radar showing Hurricane 00:25UTC on 26 th August Questions: 1. In general, in what direction was Harvey itself moving as it was affecting the city of Corpus Christie? (5 pts) Harvey appeared to be moving towards the Northwest as it was affecting Corpus Christie. 2. In general, how were the precipitation areas associated with Harvey moving with respect to the storm itself (clockwise or counterclockwise)? (5 pts) The rain areas appear to be moving counterclockwise with respect to the center of the storm.
 The heaviest precipitation, indicated by the oranges and red colors, are found around the center of the storm, with a greater concentration suggested west of the center, east to northeast of")
 Cyclones are low pressure areas with the center completely enclosed by at least one isobar.")
8 3. In general, where was the heaviest precipitation/strongest thunderstorm activity located with respect to the center of the storm? (5 pts) The heaviest precipitation, indicated by the oranges and red colors, are found around the center of the storm, with a greater concentration suggested west of the center, east to northeast of Corpus Christie (offshore). The colors indicate heaviness of precipitation, with reds, yellows and purples indicating the heaviest precipitation. This is consistent with my answer in Part 1 above. 4. How does the radar animation corroborate the fact that hurricanes are cyclones? (5 pts) Cyclones are low pressure areas with the center completely enclosed by at least one isobar. Wind should move counterclockwise around such pressure systems. The radar animation shows that the rain bands are moving counterclockwise. Assuming that the rainfall areas are associated with clouds whose motion is directed by the winds, then the winds are moving counterclockwise. In addition, the rainfall areas are making a complete circuit around the center of the disturbance, consistent with the fact that at least one isobar encircles the center. Part 5. Hurricane Harvey and resulting heavy rainfall (20pts) It is a well-known fact that the highest hurricane fatalities arise from fresh water flooding. Harvey produced unprecedented rainfall totals. First, examine the diagrams below showing the forecast tracks (pay VERY CAREFULL attention to the FORWARD speed of the hurricane), the actual sea-surface temperature (SST) and sea-surface departure from average plots and finally the forecast (predicted) 7-day rainfall, the estimated observed (actually occurred) 7-day rainfall totals and answer the following questions based on your knowledge of hurricanes and the information provided by the diagrams below: (click to make larger)

 and track")

9 Hurricane Harvey Forecast tracks issued: 10PM CDT WED AUG 23 rd, 7PM CDT SAT AUG 26 th and 10PM CDT SUN Aug 27 th Actual sea-surface temperatures ( C) and track (yellow arrow) of Harvey (left) and sea-surface temperature departures from average ( C) (right).


10 Forecast (predicted) 7-day rainfall totals (inches) on the left and estimated observed (actually occurred) 7-day rainfall totals on the right for roughly the same period ~ 11PM CDT 23 rd AUG to ~11PM 30 th AUG. Questions: 1. Look carefully at the three track plots above and note roughly the locations where Harvey was forecast to be and the forward speed on each of the three advisory plots. What can you say about the forward speed and location of Harvey by looking at all three track plots? (5pts). On Wednesday 23 rd AUG at 10PM CDT Harvey was moving slowly at 2mph towards the NW and forecast to become a hurricane by 7PM on FRI evening, covering some distance before making landfall, however, thereafter very little movement of Harvey was expected between 7PM SAT night and 7PM SUN night. The 2 nd advisory shown at 7PM CDT SAT night shows very little movement of Harvey was forecast and the final advisory at 10PM CDT on SUN continued to show very little movement of Harvey until at least 7PM, THU. This means Harvey was near stationary from at least 7PM SAT until 7PM WED over almost the same area. 2. Look at the sea-surface temperature and the sea-surface temperature anomaly map. The yellow arrow on the sea-surface temperature map shows the rough path of Harvey towards the Texas coast. What where the sea-surface temperatures encountered by Harvey? Where these temperatures normal? What effect do you think these sea-surface temperatures had on Harvey? (5pts) Sea-surface temperatures were mostly above 30 C (86 F) and were about 1-2 C (2-4 F) above average. We know that for hurricanes to form and intensify, sea-surface
11 temperatures must be above 28 C (82 F), so Harvey was bound to intensify rather rapidly as it was also moving very slowly over these extremely warm waters. 3. Finally, look at the 7-DAY FORECAST rainfall chart produced on the 23 rd of AUG (i.e. predicted/expected rainfall between AUG) and the estimated total 7-DAY OBSERVED rainfall ending on the 30 th of AUG (i.e. what actually occurred between AUG). Compare the rainfall totals FORECAST in the black rectangle (they cover the same areas in both plots) with those in the estimated OBSERVED total-7day rainfall totals and discuss the amounts, why they are different and what could have been the cause for such high rainfall totals that actually occurred versus what was forecast. The previous two questions should provide you with some of the answers. (10pts). The highest forecast rainfall in the forecast chart was southwest of Houston with forecast totals of between 16 and 20, and in Houston, between 4 to 8 was forecast. However, the estimated 7-day rainfall totals show the highest values of over 50 to the east of Houston, with the bulk of the heaviest rain (40-50 ) to the east of Houston. Possible reasons why the forecast is so different from the estimated observed rainfall: The forecast models are updated every 6 hours and it is possible that forecasts on THU through SAT may have predicted substantially more rainfall on those days compared to the forecast on WED when Harvey was still a tropical depression a few hundred miles away from the coast. The forecast model did not accurately take into account the stalling of Harvey over the same area; The fact that the tracks show that Harvey essentially stalled out over the same areas for a long period of time accounts for the very high rainfall totals seen. Another reason so much rain fell was that Harvey moved over very warm seasurface temperatures. Very high sea-surface temperatures pump a lot more water into the air above it, so Harvey had a lot more water vapor to absorb and then release as rainfall over the same area for days on end.
Homework 2: Hurricane Katrina. Part 1. Hurricane Katrina, August 28, 2005 Satellite Imagery
 Metr 302 Homework 2 Fall 2014 Meteorology 302 Fall 2014 Name Homework 2: Hurricane Katrina 100 points total Distributed Thursday 30 October 2014; Due Thursday 13 November 2014 Answer all questions in complete
DEPARTMENT OF EARTH & CLIMATE SCIENCES SAN FRANCISCO STATE UNIVERSITY. Metr Fall 2014 Test #1 September 30, 2014
 DEPARTMENT OF EARTH & CLIMATE SCIENCES SAN FRANCISCO STATE UNIVERSITY NAME Metr 302.02 Fall 2014 Test #1 September 30, 2014 200 pts (4 pts each answer) Part I. Surface Chart Interpretation. Questions 1
Department of Earth & Climate Sciences San Francisco State University Fall 2016 ERTH 360. Homework #1 Answer Sheet (Graphics Online) 100 points
 100 points") Department of Earth & Climate Sciences Name San Francisco State University Fall 2016 ERTH 360 Homework #1 Answer Sheet (Graphics Online) 100 points (Due Beginning of Class, Thursday 22 September 2016)
Department of Earth & Climate Sciences Name San Francisco State University Fall 2016 ERTH 360 Homework #1 Answer Sheet (Graphics Online) 100 points (Due Beginning of Class, Thursday 22 September 2016)
Department of Earth & Climate Sciences San Francisco State University Fall 2018 ERTH 360. Homework #1 Answer Sheet (Graphics Online) 100 points
 100 points") Department of Earth & Climate Sciences Name San Francisco State University Fall 2018 ERTH 360 Homework #1 Answer Sheet (Graphics Online) 100 points (Due Beginning of Class, Thursday 20 September 2018)
Department of Earth & Climate Sciences Name San Francisco State University Fall 2018 ERTH 360 Homework #1 Answer Sheet (Graphics Online) 100 points (Due Beginning of Class, Thursday 20 September 2018)
TROPICAL STORM HARVEY BRIEFING
 TROPICAL STORM HARVEY BRIEFING 10:00 AM CDT Sunday, August 27, 2017 Prepared by: NWS LIX NWSNewOrleans www.weather.gov/neworleans Situation Overview New Information Tropical Storm Winds 40mph Immediate
HURRICANE HARVEY COE Navigation BRIEFING
 HURRICANE HARVEY COE Navigation BRIEFING 10:00 AM CDT Friday, August 25, 2017 NWSNewOrleans www.weather.gov/neworleans Situation Overview New Information Harvey continues to strengthen Max sustained winds
Tropical Storm Harvey: SE Texas Impacts
 Tropical Storm Harvey: SE Texas Impacts 10 AM CDT UPDATE Thursday, August 24, 2017 Prepared by: Dan Reilly, Brian Kyle PLEASE MUTE YOUR LINES AND DON T PUT ON HOLD! Situation Overview Tropical Storm Harvey
TROPICAL STORM HARVEY COE Navigation Call - Update
 TROPICAL STORM HARVEY COE Navigation Call - Update 10:00 AM CDT Tuesday, August 29, 2017 Prepared by: NWS LIX NWSNewOrleans www.weather.gov/neworleans Situation Overview New Information Drifting ENE at
Hurricane Harvey the Name says it all. by Richard H. Grumm and Charles Ross National Weather Service office State College, PA
 Hurricane Harvey the Name says it all by Richard H. Grumm and Charles Ross National Weather Service office State College, PA 16803. 1. Overview Hurricane Harvey crossed the Texas coast (Fig. 1) as a category
GC Briefing. Weather Sentinel Tropical Storm Michael. Status at 8 AM EDT (12 UTC) Today (NHC) Discussion. October 11, 2018
 Today (NHC) Discussion. October 11, 2018") GC Briefing Weather Sentinel Tropical Storm Michael October 11, 2018 After making landfall as a high-end category-4 hurricane on the Florida Panhandle, Michael weakened to tropical storm status early this
GC Briefing Weather Sentinel Tropical Storm Michael October 11, 2018 After making landfall as a high-end category-4 hurricane on the Florida Panhandle, Michael weakened to tropical storm status early this
DEPARTMENT OF GEOSCIENCES SAN FRANCISCO STATE UNIVERSITY. Metr Fall 2012 Test #1 200 pts. Part I. Surface Chart Interpretation.
 DEPARTMENT OF GEOSCIENCES SAN FRANCISCO STATE UNIVERSITY NAME Metr 356.01 Fall 2012 Test #1 200 pts Part I. Surface Chart Interpretation. Figure 1. Surface Chart for 1500Z 7 September 2007 1 1. Pressure
DEPARTMENT OF EARTH & CLIMATE SCIENCES Name SAN FRANCISCO STATE UNIVERSITY Nov 29, ERTH 360 Test #2 200 pts
 DEPARTMENT OF EARTH & CLIMATE SCIENCES Name SAN FRANCISCO STATE UNIVERSITY Nov 29, 2018 ERTH 360 Test #2 200 pts Each question is worth 4 points. Indicate your BEST CHOICE for each question on the Scantron
TROPICAL STORM NATE BRIEFING
 TROPICAL STORM NATE BRIEFING 5:00 AM CDT Friday, October 6, 2017 Prepared by: NWS NWSNewOrleans www.weather.gov/neworleans Situation Overview No significant changes to the track forecast this morning.
Student Exploration: Hurricane Motion
 Name: Date: Student Exploration: Hurricane Motion Vocabulary: air pressure, Coriolis effect, eye, hurricane, knot, meteorologist, precipitation Prior Knowledge Questions (Do these BEFORE using the Gizmo.)
TROPICAL DEPRESSION HARVEY BRIEFING
 TROPICAL DEPRESSION HARVEY BRIEFING 10:15 PM CDT Wednesday, August 23, 2017 Prepared by: Lara Beal NWSCorpus www.weather.gov/corpuschristi Situation Overview No changes to Watches. Hurricane Watch remains
b. The boundary between two different air masses is called a.
 NAME Earth Science Weather WebQuest Part 1. Air Masses 1. Find out what an air mass is. http://okfirst.mesonet.org/train/meteorology/airmasses.html a. What is an air mass? An air mass is b. The boundary
Page 1. Name:
 Name: 1) As the difference between the dewpoint temperature and the air temperature decreases, the probability of precipitation increases remains the same decreases 2) Which statement best explains why
1. Which weather map symbol is associated with extremely low air pressure? A) B) C) D) 2. The diagram below represents a weather instrument.
 B) C) D) 2. The diagram below represents a weather instrument.") 1. Which weather map symbol is associated with extremely low air pressure? 2. The diagram below represents a weather instrument. Which weather variable was this instrument designed to measure? A) air pressure
1. Which weather map symbol is associated with extremely low air pressure? 2. The diagram below represents a weather instrument. Which weather variable was this instrument designed to measure? A) air pressure
Tropical Update. 5 PM EDT Sunday, October 7, 2018 Tropical Storm Michael, Tropical Storm Leslie, & Invest 92L (30%)
") Tropical Update 5 PM EDT Sunday, October 7, 2018 Tropical Storm Michael, Tropical Storm Leslie, & Invest 92L (30%) This update is intended for government and emergency response officials, and is provided
Tropical Update 5 PM EDT Sunday, October 7, 2018 Tropical Storm Michael, Tropical Storm Leslie, & Invest 92L (30%) This update is intended for government and emergency response officials, and is provided
Figure 1. Idealized global atmospheric circulation (C= surface convergence, D= surface divergence).
.") page - 1 Laboratory Exercise #8 - Introduction to Atmospheric Science: Global Circulation and Weather Makers Section A - Global Atmospheric Circulation: To understand weather you need to understand how
page - 1 Laboratory Exercise #8 - Introduction to Atmospheric Science: Global Circulation and Weather Makers Section A - Global Atmospheric Circulation: To understand weather you need to understand how
Tropical Weather Briefing
 Tropical Weather Briefing August 28, 2012 700 AM CDT National Weather Service Weather Forecast Office Slidell, LA Current Satellite Tropical Storm Isaac Watches/Warnings Tropical Storm Isaac Track Guidance
Hydrologic Briefing Tropical Storm Harvey
 Hydrologic Briefing Tropical Storm Harvey 10:30 AM CDT Sunday, August 27, 2017 Prepared by: John Metz NWSCorpus www.weather.gov/corpuschristi Situation Overview Tropical Storm Harvey Harvey to remain a
Figure 1. Idealized global atmospheric circulation (C = surface convergence, D = surface divergence).
.") page - Laboratory Exercise #8 - Introduction to Atmospheric Science: Global Circulation and Weather Makers Section A - Global Atmospheric Circulation: To understand weather you need to understand how the
page - Laboratory Exercise #8 - Introduction to Atmospheric Science: Global Circulation and Weather Makers Section A - Global Atmospheric Circulation: To understand weather you need to understand how the
TROPICAL STORM NATE BRIEFING
 TROPICAL STORM NATE BRIEFING 2:00 PM CDT Friday, October 06, 2017 Prepared by: NWS NWSNewOrleans www.weather.gov/neworleans Situation Overview Track forecast has not changed since the 10 am advisory. Hurricane
HURRICANE IRMA. 12 PM ET Saturday, September Prepared by: Kyle Thiem / Sid King.
 HURRICANE IRMA 12 PM ET Saturday, September 9 2017 Prepared by: Kyle Thiem / Sid King www.weather.gov/atlanta/briefings @NWSAtlanta www.weather.gov/atlanta Situation Overview 11:00 AM EDT Sat Sep 9 Location:
HURRICANE NATE BRIEFING
 HURRICANE NATE BRIEFING 2:00 PM CDT Saturday, October 07, 2017 Prepared by: NWS NWSNewOrleans www.weather.gov/neworleans Situation Overview continues to intensify. It is now forecast to be a category 2
Hurricane Harvey: SE Texas Impacts. 10 AM CDT UPDATE Saturday, August 26, 2017 Prepared by: Dan Reilly, Brian Kyle
 Hurricane Harvey: SE Texas Impacts 10 AM CDT UPDATE Saturday, August 26, 2017 Prepared by: Dan Reilly, Brian Kyle Latest Observations and Radar Hurricane Harvey centered near Victoria and weakening Wind
TROPICAL STORM HARVEY BRIEFING
 TROPICAL STORM HARVEY BRIEFING 2:00 PM CDT Tuesday, August 29, 2017 Prepared by: NWS LIX NWSNewOrleans www.weather.gov/neworleans Situation Overview New Information Moving NNE Max sustained wind 45 mph
(What do you want to know)
") K (What do you know) W (What do you want to know) L (What have you learned) Flow of Energy Activity Sheet Purpose: Students will learn that there is more energy in warm/hot water than in cold water. This
K (What do you know) W (What do you want to know) L (What have you learned) Flow of Energy Activity Sheet Purpose: Students will learn that there is more energy in warm/hot water than in cold water. This
Tropical Update. 11 AM EDT Wednesday, October 10, 2018 Hurricane Michael, Hurricane Leslie & Tropical Storm Nadine, Caribbean Low (40%)
") Tropical Update 11 AM EDT Wednesday, October 10, 2018 Hurricane Michael, Hurricane Leslie & Tropical Storm Nadine, Caribbean Low (40%) This update is intended for government and emergency response officials,
Tropical Update 11 AM EDT Wednesday, October 10, 2018 Hurricane Michael, Hurricane Leslie & Tropical Storm Nadine, Caribbean Low (40%) This update is intended for government and emergency response officials,
TROPICAL STORM NATE BRIEFING
 TROPICAL STORM NATE BRIEFING 10:30 AM CDT Friday, October 06, 2017 Prepared by: NWS NWSNewOrleans www.weather.gov/neworleans Situation Overview Track forecast has shifted slightly eastward. Hurricane Watch
WEDNESDAY 30 TH AUGUST, :57 p.m. Tropical Storm Irma forms in the Atlantic. Don t let your guard down, always #Be Ready.
 Chapter 1 - The Set Up In the days leading up to Irma a series of composed and sobering text messages, presented in truncated form below, from Department of Disaster Management warned us of the pending
What s s New for 2009
 What s s New for 2009 Graphical Tropical Weather Outlook becomes operational Special Tropical Disturbance Statement replaced with Special Tropical Weather Outlook Tropical Cyclone Wind Field Graphic becomes
Tropical Update. 11 AM EDT Tuesday, October 9, 2018 Hurricane Michael, Tropical Storm Leslie, Tropical Storm Nadine
 Tropical Update 11 AM EDT Tuesday, October 9, 2018 Hurricane Michael, Tropical Storm Leslie, Tropical Storm Nadine This update is intended for government and emergency response officials, and is provided
3 Severe Weather. Critical Thinking
 CHAPTER 2 3 Severe Weather SECTION Understanding Weather BEFORE YOU READ After you read this section, you should be able to answer these questions: What are some types of severe weather? How can you stay
Tuesday, September 13, 16
 Weather Weather State Objectives 4.c, 4.d, 4.h. Discussion What are some ways in which weather affects your everyday life? Discussion What are some ways in which weather affects your everyday life? What
2A.5 A Climatology of Catastrophic Flooding in Texas From Tropical Cyclones Derek Ortt and Cameron Self StormGeo Inc, Houston, Texas
 2A.5 A Climatology of Catastrophic Flooding in Texas From Tropical Cyclones Derek Ortt and Cameron Self StormGeo Inc, Houston, Texas 1. INTRODUCTION In August 2017, Hurricane Harvey produced catastrophic
ESCI 1010 Lab 6 Midlatitude Cyclones and Thunderstorms
 ESCI 1010 Lab 6 Midlatitude Cyclones and Thunderstorms Before Lab: Review pages 244-324 in your Weather and Climate textbook. Pay special attention to the sections entitled Fronts, Life Cyclone of a Midlatitude
Module 11: Meteorology Topic 5 Content: Weather Maps Notes
 Introduction A variety of weather maps are produced by the National Weather Service and National Oceanographic Atmospheric Administration. These maps are used to help meteorologists accurately predict
Hurricane Harvey: SE Texas Impacts. 10 PM CDT UPDATE Friday, August 25, 2017 Prepared by: Lance Wood
 Hurricane Harvey: SE Texas Impacts 10 PM CDT UPDATE Friday, August 25, 2017 Prepared by: Lance Wood Latest Observations Hurricane Harvey making landfall this evening near Rockport as a category 4 hurricane.
WEEKLY WEATHER OUTLOOK BELIZE, CENTRAL AMERICA
 WEEKLY WEATHER OUTLOOK BELIZE, CENTRAL AMERICA PERIOD: Sunday, June 17 until Monday, June 25, 2012 DATE ISSUED: Sunday, June 17, 2012; 3:00 pm RFrutos EcoSolutions & Services SYNOPSIS: An upper level trough
Navigating the Hurricane Highway Understanding Hurricanes With Google Earth
 Navigating the Hurricane Highway Understanding Hurricanes With Google Earth 2008 Amato Evan, Kelda Hutson, Steve Kluge, Lindsey Kropuenke, Margaret Mooney, and Joe Turk Images and data courtesy hurricanetracking.com,
3. As warm, moist air moves into a region, barometric pressure readings in the region will generally 1. decrease 2. increase 3.
 Teacher: Mr. Prizzi Castle Learning Review 1 1. Which process most directly results in cloud formation? 1. condensation 3. precipitation 2. transpiration 4. radiation 2. An air mass originating over north
Major Hurricane Matthew Briefing Situation Overview
 Major Hurricane Matthew Briefing Situation Overview At 5 p.m. Tuesday, Category 4 Hurricane Matthew was about 860 miles South-Southeast of Mayport, Florida, moving north around 10 mph. Maximum sustained
Weather is the of the Earth s atmosphere at a place and time. It is the movement of through the atmosphere o Energy comes from the
 Weather Notes Weather Weather is the of the Earth s atmosphere at a place and time It is the movement of through the atmosphere o Energy comes from the The sun is the force that weather The sun s energy
TROPICAL STORM HARVEY BRIEFING
 TROPICAL STORM HARVEY BRIEFING 1 PM CDT Saturday, August 26, 2017 Prepared by: John Metz NWSCorpus www.weather.gov/corpuschristi Overview Life-threatening conditions continue. Storm Surge Warnings remain
Name Earth Science Pd. Hurricanes. Directions: Read the information, view diagrams and answer the questions in the worksheet.
 Hurricanes Directions: Read the information, view diagrams and answer the questions in the worksheet. Hurricane Basics The ingredients for a hurricane include a pre-existing weather disturbance, warm tropical
Inner core dynamics: Eyewall Replacement and hot towers
 Inner core dynamics: Eyewall Replacement and hot towers FIU Undergraduate Hurricane Internship Lecture 4 8/13/2012 Why inner core dynamics is important? Current TC intensity and structure forecasts contain
Ch. 3: Weather Patterns
 Ch. 3: Weather Patterns Sect. 1: Air Mass & Fronts Sect. 2: Storms Sect. 3: Predicting the Weather Sect. 4: Weather forecasters use advanced technologies Ch. 3 Weather Fronts and Storms Objective(s) 7.E.1.3
An upper to mid level circulation (Low) in the NW Caribbean is
 in the NW Caribbean is") WEEKLY WEATHER OUTLOOK BELIZE, CENTRAL AMERICA PERIOD: Monday-Monday, Oct. 1 October 8, 2012 DATE ISSUED: Monday, Oct 1, 2012 6:00 am RFrutos EcoSolutions & Services SYNOPSIS: An upper to mid level circulation
WEEKLY WEATHER OUTLOOK BELIZE, CENTRAL AMERICA PERIOD: Monday-Monday, Oct. 1 October 8, 2012 DATE ISSUED: Monday, Oct 1, 2012 6:00 am RFrutos EcoSolutions & Services SYNOPSIS: An upper to mid level circulation
Frank Revitte National Weather Service. Weather Forecast Office New Orleans/Baton Rouge
 Frank Revitte National Weather Service Weather Forecast Office New Orleans/Baton Rouge Above normal activity 17 Total Named Storms 7 Tropical Storms 4 Hurricanes 6 Major Hurricanes Not the most active,
Indiana County Flash Flood of 22 June 2017
 Indiana County Flash Flood of 22 June 2017 By Richard H. Grumm National Weather Service State College, PA 1. Overview Slow moving thunderstorms brought 3 to 4 inches of rainfall to Indiana County, PA during
National Hurricane Center Products. Jack Beven National Hurricane Center
 National Hurricane Center Products Jack Beven National Hurricane Center Florida Governor s Hurricane Conference 11 May 2014 NHC Tropical Cyclone Products NHC provides the big picture that complements and
Department of Earth & Climate Sciences San Francisco State University
 Department of Earth & Climate Sciences San Francisco State University Name ERTH 260: Inclass Exercise #5 Working With Weather Maps and Soundings: Finding Pressure Features and Fronts Due Wednesday 28 February
Tropical Storm Colin Briefing Last Briefing on this System
 Tropical Storm Colin Briefing Last Briefing on this System NWS WFO Jacksonville, Florida Tuesday, June 07, 2016 6:00 a.m. EDT Tropical Storm Colin s Impacts SE Georgia & North Florida Local Watches & Warnings:
Tropical Update. 5 AM EDT Monday, October 8, 2018 Tropical Storm Michael, Tropical Storm Leslie, Invest 92L (10%) & African Tropical Wave (50%)
 & African Tropical Wave (50%)") Tropical Update 5 AM EDT Monday, October 8, 2018 Tropical Storm Michael, Tropical Storm Leslie, Invest 92L (10%) & African Tropical Wave (50%) This update is intended for government and emergency response
Tropical Update 5 AM EDT Monday, October 8, 2018 Tropical Storm Michael, Tropical Storm Leslie, Invest 92L (10%) & African Tropical Wave (50%) This update is intended for government and emergency response
Guided Notes Weather. Part 1: Weather Factors Temperature Humidity Air Pressure Winds Station Models
 Guided Notes Weather Part 1: Weather Factors Temperature Humidity Air Pressure Winds Station Models. 1. What is weather? Weather: short-term atmospheric conditions in a specific area at a specific time
Module 11: Meteorology Topic 6 Content: Severe Weather Notes
 Severe weather can pose a risk to you and your property. Meteorologists monitor extreme weather to inform the public about dangerous atmospheric conditions. Thunderstorms, hurricanes, and tornadoes are
Issued by: National Weather Service San Joaquin Valley - Hanford CA. Issue time: 409 AM PST Wed Jan
 Forecast Information Location: New_Exchequer_Dam Updated: January 16, 2019, 11:45 am NWS Weather Discussion: Issued by: National Weather Service San Joaquin Valley - Hanford CA Issue time: 409 AM PST Wed
Tropical Update. 5 AM EDT Tuesday, September 12, 2017 Post-Tropical Cyclone Irma, Hurricane Jose, & Tropical Wave (10%)
") Tropical Update 5 AM EDT Tuesday, September 12, 2017 Post-Tropical Cyclone Irma, Hurricane Jose, & Tropical Wave (10%) This update is intended for government and emergency response officials, and is provided
Tropical Update 5 AM EDT Tuesday, September 12, 2017 Post-Tropical Cyclone Irma, Hurricane Jose, & Tropical Wave (10%) This update is intended for government and emergency response officials, and is provided
DEPARTMENT OF EARTH & CLIMATE SCIENCES NAME SAN FRANCISCO STATE UNIVERSITY Fall ERTH FINAL EXAMINATION KEY 200 pts
 DEPARTMENT OF EARTH & CLIMATE SCIENCES NAME SAN FRANCISCO STATE UNIVERSITY Fall 2016 Part 1. Weather Map Interpretation ERTH 365.02 FINAL EXAMINATION KEY 200 pts Questions 1 through 9 refer to Figure 1,
ARUBA CLIMATOLOGICAL SUMMARY 2017 PRECIPITATION
 ARUBA CLIMATOLOGICAL SUMMARY 2017 PRECIPITATION The total amount of rainfall recorded at Reina Beatrix International Airport for the year 2017 was 391.0 mm. This is 17.1 % below normal ( Figure 1 ). During
Major Hurricane Earl
 Major Hurricane Earl Advisory 32 North Carolina Threat Assessment Prepared at: 8 AM Thursday September 2, 2010 Hurricane and Tropical Storm Warnings in effect for the North Carolina Coast and Sounds. NWS
Ch. 3: Weather Patterns. Sect. 1: Air Mass & Fronts Sect. 2: Storms Sect. 3: Predicting the Weather
 Ch. 3: Weather Patterns Sect. 1: Air Mass & Fronts Sect. 2: Storms Sect. 3: Predicting the Weather Sect. 1: Air Masses & Fronts An air mass is a huge body of air that has similar temperature, humidity,
Tropical Update. 5 PM EDT Thursday, September 7, 2017 Hurricane Irma, Hurricane Jose, and Hurricane Katia
 Tropical Update 5 PM EDT Thursday, September 7, 2017 Hurricane Irma, Hurricane Jose, and Hurricane Katia This update is intended for government and emergency response officials, and is provided for informational
Tropical Update. 5 PM EDT Sunday, September 10, 2017 Hurricane Irma, Hurricane Jose, Tropical Wave (60%)
") Tropical Update 5 PM EDT Sunday, September 10, 2017 Hurricane Irma, Hurricane Jose, Tropical Wave (60%) This update is intended for government and emergency response officials, and is provided for informational
Tropical Update 5 PM EDT Sunday, September 10, 2017 Hurricane Irma, Hurricane Jose, Tropical Wave (60%) This update is intended for government and emergency response officials, and is provided for informational
Weather Notes. Chapter 16, 17, & 18
 Weather Notes Chapter 16, 17, & 18 Weather Weather is the condition of the Earth s atmosphere at a particular place and time Weather It is the movement of energy through the atmosphere Energy comes from
WEATHER SYSTEMS IMPACTING THE CAYMAN ISLANDS Prepared by the staff of the Cayman Islands National Weather Service
 WEATHER SYSTEMS IMPACTING THE CAYMAN ISLANDS 2008 Prepared by the staff of the Cayman Islands National Weather Service TROPICAL STORM DOLLY Formed 194 miles west of Grand Cayman July 19 th. The tropical
Hurricane Harvey and What is to come. Eric Berger, Space City Weather
 Hurricane Harvey and What is to come Eric Berger, Space City Weather Today s talk A word about Space City Weather Social media-rology A look back at Hurricane Harvey Why does Houston get these storms Rainfall
4 Forecasting Weather
 CHAPTER 2 4 Forecasting Weather SECTION Understanding Weather BEFORE YOU READ After you read this section, you should be able to answer these questions: What instruments are used to forecast weather? How
PREDICTING THE WEATHER
 NAME DATE PARTNER(S) PREDICTING THE WEATHER How well does your local weatherman do in predicting the weather? Is he or she more accurate for the next day or for a week in the future? Why do you think that
PLOTTING WEATHER DATA to perform a SURFACE ANALYSIS
 PLOTTING WEATHER DATA to perform a SURFACE ANALYSIS The surface analysis permits one to identify and locate the large scale features of the sea level pressure field and the surface fronts. Isobars with
Hurricane Wilma Post Storm Data Acquisition Estimated Peak Wind Analysis and Storm Tide Data. December 27, 2005
 Hurricane Wilma Post Storm Data Acquisition Estimated Peak Wind Analysis and Storm Tide Data December 27, 2005 Hurricane Wilma was the sixth major hurricane of the record-breaking 2005 Atlantic hurricane
Monthly Long Range Weather Commentary Issued: SEPTEMBER 19, 2016 Steven A. Root, CCM, Chief Analytics Officer, Sr. VP,
 Monthly Long Range Weather Commentary Issued: SEPTEMBER 19, 2016 Steven A. Root, CCM, Chief Analytics Officer, Sr. VP, sroot@weatherbank.com SEPTEMBER 2016 Climate Highlights The Month in Review The contiguous
Metr 201 Quiz #4 Key 100 pts. A. Short Answer and Definitions. (3 points each for a total of 18 points in this section).
.") Department of Earth & Climate Sciences Name San Francisco State University March 30, 2015 Metr 201 Quiz #4 Key 100 pts. A. Short Answer and Definitions. (3 points each for a total of 18 points in this
Department of Earth & Climate Sciences Name San Francisco State University March 30, 2015 Metr 201 Quiz #4 Key 100 pts. A. Short Answer and Definitions. (3 points each for a total of 18 points in this
Unit: Weather Study Guide
 Name: Period: Unit: Weather Study Guide Define each vocabulary word on a separate piece of paper or index card. Weather Climate Temperature Wind chill Heat index Sky conditions UV index Visibility Wind
Hydrologic Briefing Tropical Storm Harvey
 Hydrologic Briefing Tropical Storm Harvey 5:00 PM CDT Sunday, August 27, 2017 Prepared by: Jennifer Dunn/Christina Barron NWSCorpus www.weather.gov/corpuschristi Situation Overview Tropical Storm Harvey
NOAA s National Weather Service Philadelphia/Mt. Holly NJ
 Next Briefing Package: Thursday, October 1, 2015 no later than 300 PM Hazards and Impacts: Overview: A dangerous weather pattern is developing for our region. Threats include very heavy rainfall, inland
SEVERE WEATHER AND FRONTS TAKE HOME QUIZ
 1. Most of the hurricanes that affect the east coast of the United States originally form over the A) warm waters of the Atlantic Ocean in summer B) warm land of the southeastern United States in summer
IWT Scenario 2 Integrated Warning Team Workshop National Weather Service Albany, NY October 31, 2014
 IWT Scenario 2 Integrated Warning Team Workshop National Weather Service Albany, NY October 31, 2014 09 10 11 12 13 Scenario 2 Timeline December 9-13 Tue Wed Thu Fri Sat Tue, Dec. 9 @ 5 am 2014 2014 2014
What a Hurricane Needs to Develop
 Weather Weather is the current atmospheric conditions, such as air temperature, wind speed, wind direction, cloud cover, precipitation, relative humidity, air pressure, etc. 8.10B: global patterns of atmospheric
Tropical Storm Harvey: SE Texas Impacts. 10 AM CDT UPDATE Sunday August 27, 2017 Prepared by: Lance Wood
 Tropical Storm Harvey: SE Texas Impacts 10 AM CDT UPDATE Sunday August 27, 2017 Prepared by: Lance Wood Situation Overview Catastrophic flooding is ongoing with flash flood emergencies remaining in effect.
Mr. P s Science Test!
 WEATHER- 2017 Mr. P s Science Test! # Name Date 1. Draw and label a weather station model. (10 pts) 2. The is the layer of the atmosphere with our weather. 3. Meteorologists classify clouds in about different
Critical Thinking Review
 Critical Thinking Review (wk3) Cognitive Skill of the Week: Analysis Analysis is the examination of a system (or complex), its components (or ingredients), and the linkages among these components. One
Coastal Storm Potential
 Coastal Storm Potential Event Date/Time: 11/12/2009-11/14/2009 Today through Saturday National Weather Service Newport/Morehead City, NC Date: 11/12/2009 1000 am Coastal Storm Remnants of Ida, coupled
4. Which map best represents the type of fronts and direction of movement of these fronts in relation to the low-pressure center?
 1. Adjacent water and landmasses are heated by the morning Sun on a clear, calm day. After a few hours, a surface wind develops. Which map best represents this wind's direction? 2. An air pressure of 29.47
photo courtesy of
 BRITISH VIRGIN ISLANDS REPORT TROPICAL STORM JEANNE photo courtesy of www.bviplatinum.com PREPARED BY THE DEPARTMENT OF DISASTER MANAGEMENT 1 EVENT 13 th -16 th September, 2004 TROPICAL STORM JEANNE Sequence
A surge in the easterlies and an influx of moisture and instability is inducing
 WEEKLY WEATHER OUTLOOK BELIZE, CENTRAL AMERICA PERIOD: Monday-Monday, July 16-23, 2012 DATE ISSUED: Monday, July 16, 2012 6:00 am RFrutos EcoSolutions & Services SYNOPSIS: A number of features of interest
WEEKLY WEATHER OUTLOOK BELIZE, CENTRAL AMERICA
 WEEKLY WEATHER OUTLOOK BELIZE, CENTRAL AMERICA PERIOD: Sunday, July 1 until Monday, July 9, 2012 DATE ISSUED: Sunday, July 1, 2012 3:00 pm RFrutos EcoSolutions & Services SYNOPSIS: The features of interest
CASE STUDY: Tropical Cyclone Monica, April 2006
 CASE STUDY: Tropical Cyclone Monica, April 2006 By Mr Jeff Callaghan Retired Senior Severe Weather Forecaster, Bureau of Meteorology, Brisbane The track of tropical cyclone Monica (Figure 1) took it from
True or false: The atmosphere is always in hydrostatic balance. A. True B. False
 Clicker Questions and Clicker Quizzes Clicker Questions Chapter 7 Of the four forces that affect the motion of air in our atmosphere, which is to thank for opposing the vertical pressure gradient force
A LOOK AT TROPICAL STORM GASTON FLOODING IN VIRGINIA
 J12B.4 A LOOK AT TROPICAL STORM GASTON FLOODING IN VIRGINIA John Billet* and Keith Lynch NOAA/NWS Wakefield, VA 1. INTRODUCTION Hurricane Gaston made landfall north of Charleston, SC on Sunday morning
Third Grade Math and Science DBQ Weather and Climate/Representing and Interpreting Charts and Data - Teacher s Guide
 Third Grade Math and Science DBQ Weather and Climate/Representing and Interpreting Charts and Data - Teacher s Guide A document based question (DBQ) is an authentic assessment where students interact with
IWT Scenario 1 Integrated Warning Team Workshop National Weather Service Albany, NY October 31, 2014
 Integrated Warning Team Workshop National Weather Service Albany, NY October 31, 2014 23 24 25 26 27 Scenario 1 Timeline November 23-27 Sun Mon Tue Wed Thu Thanksgiving Day Sunday, Nov. 23 @ 430 pm NWS
RR#4 - Multiple Choice
 1. The map below shows the amount of snowfall, in inches, produced by a lake-effect snowstorm in central New York State. The wind that produced this snowfall pattern most likely came from the 1) northeast
Chapter 3: Weather Fronts & Storms
 Chapter 3: Weather Fronts & Storms An AIR MASS is a large body of air that has similar characteristics (temperature, humidity) throughout. Air masses can be massively large. Air masses are classified by
WEEKEND WEATHER OUTLOOK BELIZE, CENTRAL AMERICA
 WEEKEND WEATHER OUTLOOK BELIZE, CENTRAL AMERICA PERIOD: Friday, July 13 until Monday, July 16, 2012 DATE ISSUED: Friday, June 13, 2012, 9:00 am RFrutos SYNOPSIS: A weak pressure gradient over the NW Caribbean
TROPICAL CYCLONE TORNADOES
 TROPICAL CYCLONE TORNADOES 2018 GOVERNOR S HURRICANE CONFERENCE TUESDAY, MAY 15, 2018 WILL ULRICH NWS FORECAST OFFICE MELBOURNE WHERE ARE THE TORNADOES? WHERE ARE THE TORNADOES? C B A WEST MELBOURNE, FL
Tropical Storm Ana. Created 6:00 AM Sun May 10, 2015 John Cole Warning Coordination Meteorologist
 Tropical Storm Ana Threat Assessment for Eastern North Carolina Created 6:00 AM Sun May 10, 2015 John Cole Warning Coordination Meteorologist John.cole@noaa.gov National Weather Service Newport/Morehead
WEEKEND WEATHER OUTLOOK BELIZE, CENTRAL AMERICA
 WEEKEND WEATHER OUTLOOK BELIZE, CENTRAL AMERICA PERIOD: Friday, July 6 until Monday, July 9, 2012 DATE ISSUED: Friday, July 6, 2012; 9:00 am RFrutos SYNOPSIS: An active tropical wave (TW) just west of