Trevor Lee Director, Buildings. Grant Edwards PhD Department of Environment and Geography
|
|
|
- Gerard Farmer
- 5 years ago
- Views:
Transcription
1 Weather Affects Building Performance Simulation v Monitoring real time solar and coincident weather data for building optimisation and energy management Trevor Lee Director, Buildings Grant Edwards PhD Department of Environment and Geography
2 Real time solar and coincident weather data for building system optimisation The Australian Solar and Climate Resource Australian Solar Radiation Data Handbook background and applications Beyond TMY: Typical Meteorological Year Climate Data for Specific Applications Australian Climate Data Bank and using Reference Meteorological Years (RMY) Creation of Ersatz Future Weather Data Files Measuring energy performance of buildings under predicted future weather conditions Team members: Zhongran Talent Deng and Chun Yin Wu Adelaide Applied Algebra, Global Sustainable Energy Solutions
3 Beyond TMY: Climate Data for Specific Applications

4 Weather Data - satellite measurement

5 Weather Data - satellite measurement Exemplary Australian Solar Energy Atlas
6 Representative Extremes extreme Meteorological Year (XMY) data sets still require full definition Examples include Performance during a hot, dry (El Niño) year Performance during a windy, wet (La Niña) year Amalgamation of hottest summer with coldest winter months Warmest months ever (changed warmer climate)
7 Real-time Data Weather not Climate Simulation Model Calibration Building or system monitoring Renewable energy system monitoring Measuring actual output or consumption in previous year or month relative to RMY Real-time year-to-date data (RTY)


8 Weather is the state of the atmosphere at a given time and place. It is constantly changing hour to hour, or day to day. Climate is the aggregate of weather conditions, the sum of all statistical weather information that helps describe a place or region. Both Weather and Climate are typically expressed in terms of key parameters: Solar radiation (direct, diffuse and global), air temperature, humidity, speed and direction of the wind, air pressure, precipitation, cloud type and amount. Climate and weather data are key to the design of energy efficient buildings, human comfort, and management of energy systems on local and regional scales. Climate Examples; Top Graph: annual mean max. and min. temperature record for Observatory Hill, CBD. Bottom Graph: mean hourly temperature for January and July at Observatory Hill, CBD.
.")
9 Macquarie University Automatic Weather Station The Automatic Weather Station since 1998 has been located within the sports grounds of Macquarie University at North Ryde, Sydney, Australia, denoted on the map by Its latitude and longitude are 33º 45' 55.1" South and 151º 7' 3.2" East. Its elevation is 66.8 m above mean sea level (accurate to 4.4 m). From 1992 to 1998 the AWS was located on the NW side of the main campus
 established nearby at Macquarie University sports fields.")
10 Macquarie University AWS - Brief History First site (AWS1) established at Macquarie University (Main Campus) Second site (AWS2) established nearby at Macquarie University sports fields. Late Major upgrade to AWS2 including upgrade of communications from phone line to radio modem, replacement of cup and vane anemometer with sonic anemometer, installation of several new sensors and replacement of a significant portion of underground wiring. Mid Vaisala WS425 Ultrasonic Anemometer installed for wind measurements, replacing Met One 50.5 Ultrasonic Anemometer. January Automatic QA/QC checks implemented in datalogger program. August Cynet 405U Radio modems replaced with Netcomm NTC-6908 Cellular modem due to tree growth blocking radio signal.
11 Macquarie University AWS - Specifications Dry Bulb Temperature Wet Bulb Temperature Dew Point Temperature Pressure Vapour Pressure Saturation Vapour Pressure Relative Humidity Precipitation Wind speed and direction Standard Deviation of Wind Direction Sunshine Duration Global Shortwave Radiation Diffuse Shortwave Radiation Reflected Shortwave Radiation Net (All Wave) Radiation UVB Radiation Sky Longwave Radiation Soil Temperature at 1, 5, 10, 20, 50 and 100cm Soil Heat Flux at 5cm and 50cm soil depth Modified Vector Instruments H301 Psychrometer - Dry Bulb RTD Modified Vector Instruments H301 Psychrometer - Wet Bulb RTD Derived by the datalogger Vaisala PTA-427 Pressure Transducer Derived by the datalogger Derived by the datalogger Met One 083c Relative Humidity Probe Hydrological Services TB3 Tipping Bucket Rain-Gauge R.M. Young Wind Monitor Derived by the datalogger Middleton RS-6 Sunshine Duration Detector Kipp & Zonen CNR1 Net Radiometer Kipp and Zonen CM5 Pyranometer Kipp & Zonen CNR1 Net Radiometer Kipp & Zonen CNR1 Net Radiometer Middleton UVR1-B Solar Ultraviolet Pyranometer Kipp & Zonen CNR1 Net Radiometer Omega Thermistors encased in epoxy housed in stainless steel tube Huxeflux HFP-01 Soil Heat Flux Plates
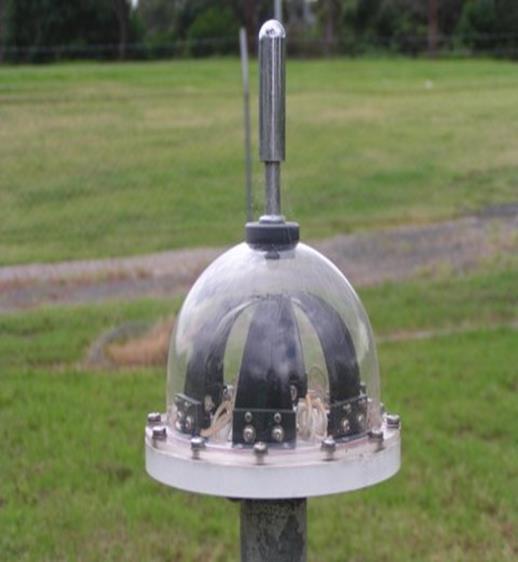
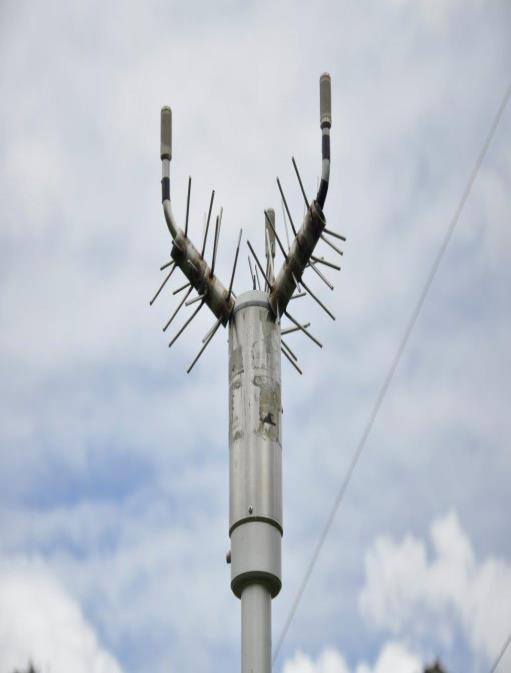
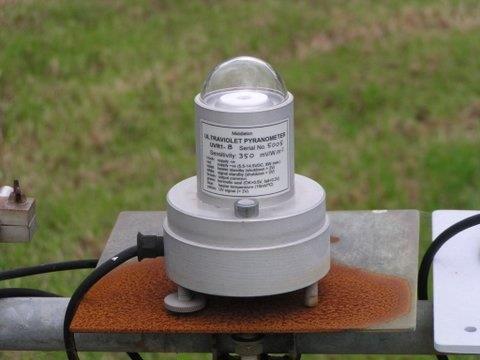
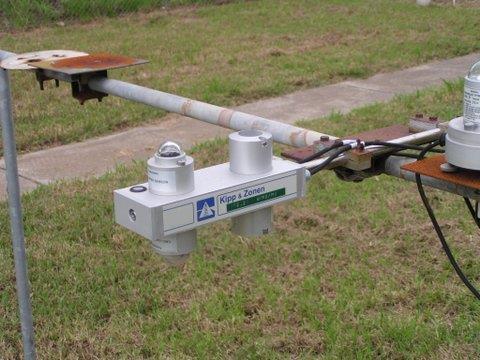
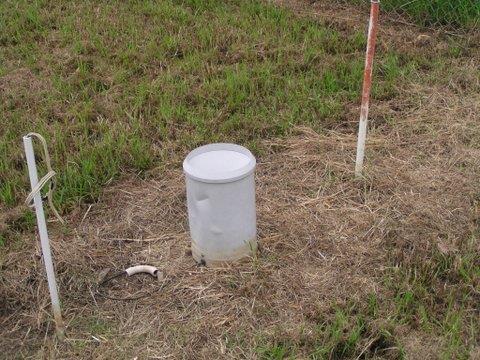
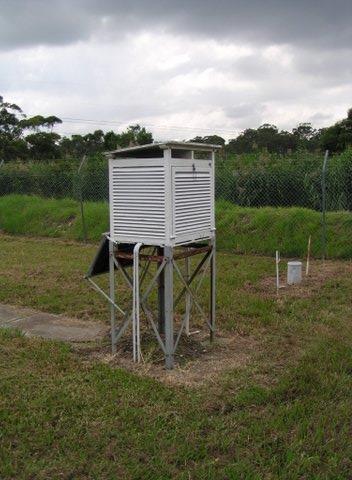
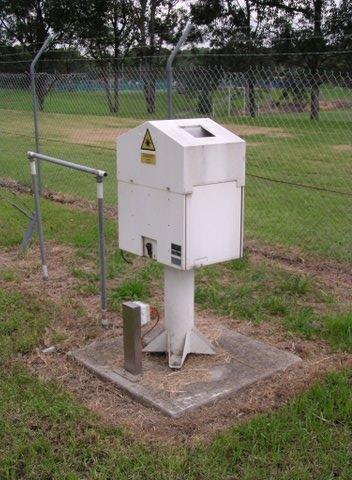
12 Macquarie University Automatic Weather Station

13 Macquarie University AWS Uses and Applications Within the Department of Environment and Geography, the AWS is used for both teaching and research. Climatic studies Study of interesting weather events such as depicted here where the temperature was above 40 degrees Celsius from 10:30 am to 7:15 pm at which time there was a dramatic temperature drop of more than 10 degrees Celcius. The wind direction plot below tells us why. Provide data to outside users for energy management and other uses such as; Local weather data during the construction of the M2 a study of the shelf life of food assessment of the air conditioning requirements for a new animal house at Macquarie in-filling missing radiation data for a study at Manly Reservoir estimating maximum rainfall intensities during severe storms estimating maximum wind speeds during gales studying relationships between various radiation variables estimating sunshine hours and solar energy available
14 Macquarie University AWS Normalisation to CBD

15 Macquarie University AWS Normalisation to CBD
16 Real-time Data Weather vs Climate Exemplary Weather and Energy Index Monthly Graphs (last updated 6 Jun 2015) Sydney (using Macquarie Uni data) Canberra (CSIRO), Perth (Murdoch Uni) Archetypical 10 storey office building Archetypical 3 storey office building Archetypical 1 storey supermarket building Typical 3 kw domestic solar PV system

17 Exemplary Weather and Energy Index Sydney 12 months actual v RMY


18 Exemplary Weather and Energy Index - Sydney

19 Exemplary Weather and Energy Index - Sydney


20 Exemplary Weather and Energy Index - Sydney

21 Exemplary Weather and Energy Index - Sydney PV


22 Creation of Ersatz Future Weather Data Files

23 Climate Forecast (Seasonal) 50 th percentile change in drybulb temperature

24 Climate Forecast (Seasonal) 50 th percentile change in Relative Humidity
25 Conclusions Climate and weather data may be tailored to suit a wide range of renewable energy and energy conservation applications. XMYs and RTYs can be created for system design and operational optimisation. Ersatz Future Weather Data based on forecast scenarios for climate change can predict energy performance in the future. Weather data collected by institutions like CSIRO and Macquarie University can be applied with building and renewable energy system simulation techniques to maintain systems in optimal working order commensurate with designs. That same data can be applied to publish a Weather and Energy Index based on archetypical systems as an indicator of variation in weather (compared with long term climate).
26 Weather Affects Building Performance Simulation v Monitoring real time solar and coincident weather data for building optimisation and energy management Questions? Trevor Lee ARAIA trevor.lee@exemplary.com.au Grant Edwards PhD grant.edwards@mq.edu.au
Series tore word. Acknowledgements
 Series tore word p. xi Preface p. xiii Acknowledgements p. xv Disclaimer p. xvii Introduction p. 1 The instrumental age p. 2 Measurements and the climate record p. 2 Clouds and rainfall p. 3 Standardisation
Microclimate. Climate & scale. Measuring a Microclimate Microclimates VARY. Microclimate factors. Aboveground environment.
 Microenvironments Microenvironments Aboveground environment Belowground environment Edaphic factors soil environment Macroclimate Climate & scale Mesoclimate factors Temperature s VARY I. In Time Long
Module 11: Meteorology Topic 3 Content: Weather Instruments Notes
 Introduction In order for meteorologists to accurately predict the weather, they take thousands of different weather measurements each day. Meteorologists need to use many tools in order to draw an accurate
Vermont Soil Climate Analysis Network (SCAN) sites at Lye Brook and Mount Mansfield
 sites at Lye Brook and Mount Mansfield") Vermont Soil Climate Analysis Network (SCAN) sites at Lye Brook and Mount Mansfield 13 Years of Soil Temperature and Soil Moisture Data Collection September 2000 September 2013 Soil Climate Analysis Network
Vermont Soil Climate Analysis Network (SCAN) sites at Lye Brook and Mount Mansfield 13 Years of Soil Temperature and Soil Moisture Data Collection September 2000 September 2013 Soil Climate Analysis Network
Figure 1. Daily variation of air temperature
 Comparative analysis of the meteorological data acquired on standard equipment and by automatic weather station of CAMPBELL SCIENTIFIC, INC Company Kudekov T.K. Director-General of the KAZHYDROMET 050022
Energy Systems, Structures and Processes Essential Standard: Analyze patterns of global climate change over time Learning Objective: Differentiate
 Energy Systems, Structures and Processes Essential Standard: Analyze patterns of global climate change over time Learning Objective: Differentiate between weather and climate Global Climate Focus Question
East Penn School District Curriculum and Instruction
 East Penn School District Curriculum and Instruction Curriculum for: Meteorology Course(s): Meteorology Grades: 10-12 Department: Science Length of Period (average minutes): 42 Periods per cycle: 6 Length
PRESENT STATE OF METEOROLOGICAL INSTRUMENTS IN MONGOLIA
 JMA/WMO TRAINING WORKSHOP ON CALIBRATION AND MAINTENANCE OF METEOROLOGICAL INSTRUMENTS IN RA II (ASIA) PRESENT STATE OF METEOROLOGICAL INSTRUMENTS IN MONGOLIA Tseveenravdan DOVCHIN NAMEM-CLEM Mongolia
7. The weather instrument below can be used to determine relative humidity.
 1. What is the dewpoint temperature when the dry-bulb temperature is 12 C and the wet-bulb temperature is 7 C? A) 1 C B) -2 C C) -5 C D) 4 C 2. A parcel of air has a dry-bulb temperature reading of 16
Chapter 2 Available Solar Radiation
 Chapter 2 Available Solar Radiation DEFINITIONS Figure shows the primary radiation fluxes on a surface at or near the ground that are important in connection with solar thermal processes. DEFINITIONS It
Chapter 2 Agro-meteorological Observatory
 Chapter 2 Agro-meteorological Observatory Abstract A Meteorological observatory is an area where all the weather instruments and structures are installed. The chapter gives a description of a meteorological
GEOG415 Mid-term Exam 110 minute February 27, 2003
 GEOG415 Mid-term Exam 110 minute February 27, 2003 1 Name: ID: 1. The graph shows the relationship between air temperature and saturation vapor pressure. (a) Estimate the relative humidity of an air parcel
Predicting Weather Conditions. Do you have a career as a meteorologist?
 Predicting Weather Conditions Do you have a career as a meteorologist? It is essential for students for know 1. Weather conditions and patterns can be based on weather data collected from various sources.
Development of Innovative Technology to Provide Low-Cost Surface Atmospheric Observations in Data-sparse Regions
 Development of Innovative Technology to Provide Low-Cost Surface Atmospheric Observations in Data-sparse Regions Paul Kucera and Martin Steinson University Corporation for Atmospheric Research/COMET 3D-Printed
Introductions to RIC-Beijing. NAN Xuejing, CUI Xiai Meteorological Observation Center China Meteorological Administration March,2018
 Introductions to RIC-Beijing NAN Xuejing, CUI Xiai China Meteorological Administration March,2018 Contents 1. China Meteorological Administration (CMA) Organization 2. (MOC) Functional Structure Responsibilities
Atmosphere and Weather Revision Notes
 Atmosphere and Weather Revision Notes Atmosphere The blanket of gases that surrounds the Earth is called the atmosphere. The main gases are nitrogen (78 %), oxygen (21 %), water vapour, ozone and carbon
Climate & Earth System Science. Introduction to Meteorology & Climate. Chapter 05 SOME OBSERVING INSTRUMENTS. Instrument Enclosure.
 Climate & Earth System Science Introduction to Meteorology & Climate MAPH 10050 Peter Lynch Peter Lynch Meteorology & Climate Centre School of Mathematical Sciences University College Dublin Meteorology
Content. Climate Parameters used for the measurement and recording of weather phenomena The Psychrometric Chart
 Climate Content Climate Parameters used for the measurement and recording of weather phenomena The Psychrometric Chart Climate Climate is a measure of the average pattern of variation in temperature, humidity,
SU solar resource measurement station: Sonbesie metadata
 SU solar resource measurement station: Sonbesie metadata Date: 30 July 2013 Introduction A solar resource measurement station, known as Sonbesie, has been installed at Stellenbosch University. The system
Weather Practice. 4. As wind velocity decreases, the distance between isobars on a weather map will A) decrease B) increase C) remain the same
 decrease B) increase C) remain the same") 1. The chart below shows the air temperature and the dewpoint temperature near the ground at a given location for four consecutive days. All temperatures were recorded at noon. Which statement is best
1. The chart below shows the air temperature and the dewpoint temperature near the ground at a given location for four consecutive days. All temperatures were recorded at noon. Which statement is best
LE Accumulation, Net Radiation, and Drying with Tipped Sensors
 LE Accumulation, Net Radiation, and Drying with Tipped Sensors Three different situations were examined, where the influence that the deployment angle of the sensor has on the accumulation of latent heat
LOCAL CLIMATOLOGICAL DATA Monthly Summary July 2013
 Deg. Days Precip Ty Precip Wind Solar Hu- Adj. to Sea Level mid- ity Avg Res Res Peak Minute 1 fog 2 hvy fog 3 thunder 4 ice plt 5 hail 6 glaze 7 duststm 8 smk, hz 9 blw snw 1 2 3 4A 4B 5 6 7 8 9 12 14
Analysis Global and Ultraviolet Radiation in Baghdad City, Iraq
 Analysis Global and Ultraviolet Radiation in Baghdad City, Iraq Ali M. Alsalihi 1 Siaf H. Abdulatif 1,2 1.Department of Atmospheric Sciences, College of science, Al-Mustansiriyah University, Baghdad, Iraq
Observing Weather: Making the Invisible Visible. Dr. Michael J. Passow
 Observing Weather: Making the Invisible Visible Dr. Michael J. Passow What Is Weather? Weather refers to the conditions of the atmosphere at a certain place and time. Weather differs from Climate, which
Weather and Climate A B1
 Weather and Climate A B1 1. What causes the Coriolis effect? (1) Earth s tilt on its axis (2) the spin of Earth on its axis (3) the orbital motion of the Moon around Earth (4) the orbital motion of Earth
for JMA/WMO Training Workshop on CALIBRATION AND MAINTENANCE OF METEOROLOGICAL INSTRUMENTS
 for JMA/WMO Training Workshop on CALIBRATION AND MAINTENANCE OF METEOROLOGICAL INSTRUMENTS in RA II (ASIA) 0. Overview of JMA 3 4 1. Surface observation station 5-8 2. Instruments in operational use 9-14
The Arable Mark: Accuracy and Applications
 The Arable Mark: Accuracy and Applications January 7, 2018 Overview Physical and Biological Observations Precipitation Air temperature, humidity, pressure Shortwave (SW) radiation (down & upwelling) Longwave
Weather Systems Study Guide:
 Weather Systems Study Guide: 1. Draw a diagram of Earth s water cycle and label each part. 2. Explain how the water cycle works. 3. What happens in the troposphere and stratosphere? Atmosphere Level What
Road Weather: The Science Behind What You Know
 The Weather Road Weather: The Science Behind What You Know Jon Tarleton Global Roads Marketing Manager Meteorologist Jon.tarleton@vaisala.com Page 2 / date / name / Internal use / Vaisala Weather and Our
WIND DATA REPORT FOR THE YAKUTAT JULY 2004 APRIL 2005
 WIND DATA REPORT FOR THE YAKUTAT JULY 2004 APRIL 2005 Prepared on July 12, 2005 For Bob Lynette 212 Jamestown Beach Lane Sequim WA 98382 By John Wade Wind Consultant LLC 2575 NE 32 nd Ave Portland OR 97212
Quality assurance for sensors at the Deutscher Wetterdienst (DWD)
") Quality assurance for sensors at the Deutscher Wetterdienst (DWD) Quality assurance / maintenance / calibration Holger Dörschel, Dr Tilman Holfelder WMO International Conference on Automatic Weather Stations
Quality assurance for sensors at the Deutscher Wetterdienst (DWD) Quality assurance / maintenance / calibration Holger Dörschel, Dr Tilman Holfelder WMO International Conference on Automatic Weather Stations
Analysis of meteorological measurements made over three rainy seasons in Sinazongwe District, Zambia.
 Analysis of meteorological measurements made over three rainy seasons in Sinazongwe District, Zambia. 1 Hiromitsu Kanno, 2 Hiroyuki Shimono, 3 Takeshi Sakurai, and 4 Taro Yamauchi 1 National Agricultural
Site: M001/W026 Network: W Update Date: 03/01/2014 Observer: ELW & DTY Version: 3.0
 Site: M001/W026 Network: W Update Date: 03/01/2014 Observer: ELW & Version: 3.0 UMN STATION METADATA Metadata template from: Muller, C. L., Chapman, L., Grimmond, C. S. B., Young, D. T., and Cai, X.-M.
The Colorado Climate Center at CSU. residents of the state through its threefold
 The CoAgMet Network: Overview History and How It Overview, Works N l Doesken Nolan D k and d Wendy W d Ryan R Colorado Climate Center Colorado State University First -- A short background In 1973 the federal
WEATHER ON WHEELS Elementary School Program
 WEATHER ON WHEELS Elementary School Program MAST ACADEMY OUTREACH On-Site Packet Miami-Dade County Public Schools Miami, Florida MAST ACADEMY OUTREACH WEATHER ON WHEELS ELEMENTARY ON-SITE HIGHLIGHTS PACKET
WEATHER NORMALIZATION METHODS AND ISSUES. Stuart McMenamin Mark Quan David Simons
 WEATHER NORMALIZATION METHODS AND ISSUES Stuart McMenamin Mark Quan David Simons Itron Forecasting Brown Bag September 17, 2013 Please Remember» Phones are Muted: In order to help this session run smoothly,
Climate vs. Weather. Weather: Short term state of the atmosphere. Climate: The average weather conditions in an area over a long period of time
 Weather and Climate Climate vs. Weather Weather: Short term state of the atmosphere. Temperature, humidity, cloud cover, precipitation, winds, visibility, air pressure, air pollution, etc Climate: The
Impact on Agriculture
 Weather Variability and the Impact on Agriculture InfoAg 2017 Copyright 2017, awhere. All Rights Reserved The Problem: The Earth s Atmosphere is a Heat Engine In transition 1 C warming of atmosphere Triples
Activity 2.2: Recognizing Change (Observation vs. Inference)
") Activity 2.2: Recognizing Change (Observation vs. Inference) Teacher Notes: Evidence for Climate Change PowerPoint Slide 1 Slide 2 Introduction Image 1 (Namib Desert, Namibia) The sun is on the horizon
Activity 2.2: Recognizing Change (Observation vs. Inference) Teacher Notes: Evidence for Climate Change PowerPoint Slide 1 Slide 2 Introduction Image 1 (Namib Desert, Namibia) The sun is on the horizon
OverviewofRIC Tsukuba (Japan,RAII )
") OverviewofRIC Tsukuba (Japan,RAII ) 7Nov.2016 Hiroshi Yoshimura Scientific Officer Regional Instrument Centre Tsukuba Observing Division, Observing Department Outline 1. WMO Regional Instrument Center
OverviewofRIC Tsukuba (Japan,RAII ) 7Nov.2016 Hiroshi Yoshimura Scientific Officer Regional Instrument Centre Tsukuba Observing Division, Observing Department Outline 1. WMO Regional Instrument Center
London Heathrow Field Site Metadata
 London Heathrow Field Site Metadata Field Site Information Name: Heathrow src_id (Station ID number): 708 Geographic Area: Greater London Latitude (decimal ): 51.479 Longitude (decimal ): -0.449 OS Grid
* * * Table (1) Table (2)
 Table (2)") A step Forward to Atomize the Sudan Meteorological Authority (SMA) Net work Y.S. Odan Surface Instruments Department Tel: 00249 912220246 E-mail yaseen@ersad.gov.sd Abstract AWS has been introduced to
A step Forward to Atomize the Sudan Meteorological Authority (SMA) Net work Y.S. Odan Surface Instruments Department Tel: 00249 912220246 E-mail yaseen@ersad.gov.sd Abstract AWS has been introduced to
The Climate of Bryan County
 The Climate of Bryan County Bryan County is part of the Crosstimbers throughout most of the county. The extreme eastern portions of Bryan County are part of the Cypress Swamp and Forest. Average annual
A summary of the weather year based on data from the Zumwalt weather station
 ZUMWALT PRAIRIE WEATHER 2016 A summary of the weather year based on data from the Zumwalt weather station Figure 1. An unusual summer storm on July 10, 2016 brought the second-largest precipitation day
The Climate of Marshall County
 The Climate of Marshall County Marshall County is part of the Crosstimbers. This region is a transition region from the Central Great Plains to the more irregular terrain of southeastern Oklahoma. Average
The Climate of Murray County
 The Climate of Murray County Murray County is part of the Crosstimbers. This region is a transition between prairies and the mountains of southeastern Oklahoma. Average annual precipitation ranges from
Funding provided by NOAA Sectoral Applications Research Project THE ATMOSPHERE. Basic Climatology Oklahoma Climatological Survey
 Funding provided by NOAA Sectoral Applications Research Project THE ATMOSPHERE Basic Climatology Oklahoma Climatological Survey What we are going to cover 1. Composition of the Atmosphere 2. State Variables
Guided Notes Weather. Part 1: Weather Factors Temperature Humidity Air Pressure Winds Station Models
 Guided Notes Weather Part 1: Weather Factors Temperature Humidity Air Pressure Winds Station Models. 1. What is weather? Weather: short-term atmospheric conditions in a specific area at a specific time
Flux Tower Data Quality Analysis in the North American Monsoon Region
 Flux Tower Data Quality Analysis in the North American Monsoon Region 1. Motivation The area of focus in this study is mainly Arizona, due to data richness and availability. Monsoon rains in Arizona usually
Weather. A. atmosphere is a layer of gases that wrap around the Earth like a blanket.
 Weather I. The air around us A. atmosphere is a layer of gases that wrap around the Earth like a blanket. II. Weather Temperature Humidity Air pressure Wind 1. contains the air we breathe, protects us
Plan for operational nowcasting system implementation in Pulkovo airport (St. Petersburg, Russia)
") Plan for operational nowcasting system implementation in Pulkovo airport (St. Petersburg, Russia) Pulkovo airport (St. Petersburg, Russia) is one of the biggest airports in the Russian Federation (150
Plan for operational nowcasting system implementation in Pulkovo airport (St. Petersburg, Russia) Pulkovo airport (St. Petersburg, Russia) is one of the biggest airports in the Russian Federation (150
Wali Ullah Khan Pakistan Meteorological Department
 An overview of Weather Observation practices over Pakistan By Wali Ullah Khan Pakistan Meteorological Department JMA/WMO TRAINING WORKSHOP ON CALIBRATION AND MAINTENANCE OF METEOROLOGICAL INSTRUMENTS IN
Variability of Reference Evapotranspiration Across Nebraska
 Know how. Know now. EC733 Variability of Reference Evapotranspiration Across Nebraska Suat Irmak, Extension Soil and Water Resources and Irrigation Specialist Kari E. Skaggs, Research Associate, Biological
Quality Assurance and Quality Control
 Quality Assurance and Quality Control of Surface Observations in JMA Japan Meteorological Agency Hakaru MIZUNO "Guide to Meteorological Instruments and Methods of Observation", WMO-No.8, 7th ed., 2008.
Meteorology. Chapter 15 Worksheet 1
 Chapter 15 Worksheet 1 Meteorology Name: Circle the letter that corresponds to the correct answer 1) The Tropic of Cancer and the Arctic Circle are examples of locations determined by: a) measuring systems.
Climate modeling: 1) Why? 2) How? 3) What?
 Why? 2) How? 3) What?") Climate modeling: 1) Why? 2) How? 3) What? Matthew Widlansky mwidlans@hawaii.edu 1) Why model the climate? Hawaii Fiji Sachs and Myhrvold: A Shifting Band of Rain 1 Evidence of Past Climate Change? Mean
Climate modeling: 1) Why? 2) How? 3) What? Matthew Widlansky mwidlans@hawaii.edu 1) Why model the climate? Hawaii Fiji Sachs and Myhrvold: A Shifting Band of Rain 1 Evidence of Past Climate Change? Mean
P1.34 MULTISEASONALVALIDATION OF GOES-BASED INSOLATION ESTIMATES. Jason A. Otkin*, Martha C. Anderson*, and John R. Mecikalski #
 P1.34 MULTISEASONALVALIDATION OF GOES-BASED INSOLATION ESTIMATES Jason A. Otkin*, Martha C. Anderson*, and John R. Mecikalski # *Cooperative Institute for Meteorological Satellite Studies, University of
Lecture 5: Precipitation
 Lecture 5: Precipitation Key Questions 1. What physical concepts control the formation of precipitation (air pressure, expanding gases and cooling, and vapor pressure)? 2. What are some air mass lifting
Weather and Climate of the Rogue Valley By Gregory V. Jones, Ph.D., Southern Oregon University
 Weather and Climate of the Rogue Valley By Gregory V. Jones, Ph.D., Southern Oregon University The Rogue Valley region is one of many intermountain valley areas along the west coast of the United States.
Name Period Date. Analyzing Climographs
 Name Period Date Analyzing Climographs Climographs: It is often helpful to plot two different types of data on the same graph. For example, a climograph is a single graph that charts both the average temperature
Practicaluseof standardmeteorolo gicalinstruments indomesticmeteorolo gical observationnetworks
 Practicaluseof standardmeteorolo gicalinstruments indomesticmeteorolo gical observationnetworks Satoshi HAGIYA Meteorolo gicalinst rumentcenter WMO/RegionalInst rumentcentre (RIC) Tsukuba JapanMeteorologicalAgency(JMA)
The Climate of Payne County
 The Climate of Payne County Payne County is part of the Central Great Plains in the west, encompassing some of the best agricultural land in Oklahoma. Payne County is also part of the Crosstimbers in the
COUNTRY REPORT. Jakarta. July, th National Directorate of Meteorology and Geophysics of Timor-Leste (DNMG)
") The Southeastern Asia-Oceania Flash Flood COUNTRY REPORT Jakarta. July, 10-12 th 2017 National Directorate of Meteorology and Geophysics of Timor-Leste (DNMG) Carla Feritas and Crisostimo Lobato Democratic
The Southeastern Asia-Oceania Flash Flood COUNTRY REPORT Jakarta. July, 10-12 th 2017 National Directorate of Meteorology and Geophysics of Timor-Leste (DNMG) Carla Feritas and Crisostimo Lobato Democratic
Name: Regents Earth Science. Weather and Climate - Review Questions
 Name: Regents Earth Science Weather and Climate - Review Questions Date: Thayer - 279 1. People sometimes release substances into the atmosphere to increase the probability of rain by A) raising the air
The Climate of Kiowa County
 The Climate of Kiowa County Kiowa County is part of the Central Great Plains, encompassing some of the best agricultural land in Oklahoma. Average annual precipitation ranges from about 24 inches in northwestern
MAST ACADEMY OUTREACH. WOW (Weather on Wheels)
") MAST ACADEMY OUTREACH ELEMENTARY SCHOOL PROGRAM Adventures Aboard WOW (Weather on Wheels) On-Site Packet MAST Academy Maritime and Science Technology High School Miami-Dade County Public Schools Miami,
MAST ACADEMY OUTREACH ELEMENTARY SCHOOL PROGRAM Adventures Aboard WOW (Weather on Wheels) On-Site Packet MAST Academy Maritime and Science Technology High School Miami-Dade County Public Schools Miami,
Regional Consultation on Climate Services at the National Level for South East Europe Antalya, Turkey November
 malsale@meteo.gov.vu Regional Consultation on Climate Services at the National Level for South East Europe Antalya, Turkey 21-22 November 2014 n.rudan@rhmzrs.com Capacities for the management of climatic
Meteorological Instruments for Solar Energy
 Meteorological Instruments for Solar Energy gillinstruments.com Gill Instruments has been designing and manufacturing professional use compact weather stations and ultrasonic wind speed and direction sensors
BSRN STATION DESCRIPTION
 Description page 1-7 valid until 2014-12-31, for the description from 2015-01-01 on see page 8-14 BSRN STATION STATION MANAGER Atmospheric Environment Division, Japan Meteorological Agency (JMA) Address:
CIMIS. California Irrigation Management Information System
 CIMIS California Irrigation Management Information System What is CIMIS? A network of over 130 fully automated weather stations that collect weather data throughout California and provide estimates of
Introduction. Sunny Partly Cloudy Cloudy. Flurries Snow Ice. Showers Thunderstorms Rain. High Pressure Low Pressure FRONTS. Cold Warm Stationary
 Introduction Weather can change from minute to minute, hour to hour, day to day, or season to season. Meteorologists are scientists who study Earth s atmosphere in order to predict these changes. Meteorologists
Climate Outlook through 2100 South Florida Ecological Services Office Vero Beach, FL September 9, 2014
 Climate Outlook through 2100 South Florida Ecological Services Office Vero Beach, FL September 9, 2014 Short Term Drought Map: Short-term (
4 Forecasting Weather
 CHAPTER 16 4 Forecasting Weather SECTION Understanding Weather BEFORE YOU READ After you read this section, you should be able to answer these questions: What instruments are used to forecast weather?
EXPLORING MOVEMENT CLIMATE FACTS WORKSHEET 1: WEATHER WATCHERS EXPERIMENT 1. You are going to measure the wind in two ways:
 WORKSHEET : WEATHER WATCHERS EXPERIMENT You are going to measure the wind in two ways: Using a weathervane to look at wind direction Using an anemometer to compare wind speed Follow the instructions to
Meteorology Division B Team Name: Team Number: Student Names: and
 Meteorology Division B Team Name: Team Number: Student Names: and You have 50 minutes to complete and revise this test. 1. Do not turn this page until you are told to do so. 2. Write your team name and
The Climate of Texas County
 The Climate of Texas County Texas County is part of the Western High Plains in the north and west and the Southwestern Tablelands in the east. The Western High Plains are characterized by abundant cropland
3) What is the difference between latitude and longitude and what is their affect on local and world weather and climate?
 What is the difference between latitude and longitude and what is their affect on local and world weather and climate?") www.discoveryeducation.com 1) Describe the difference between climate and weather citing an example of each. Describe how water (ocean, lake, river) has a local effect on weather and climate and provide
www.discoveryeducation.com 1) Describe the difference between climate and weather citing an example of each. Describe how water (ocean, lake, river) has a local effect on weather and climate and provide
Tracking the Climate Of Northern Colorado Nolan Doesken State Climatologist Colorado Climate Center Colorado State University
 Tracking the Climate Of Northern Colorado Nolan Doesken State Climatologist Colorado Climate Center Colorado State University Northern Colorado Business Innovations November 20, 2013 Loveland, Colorado
UNIT 1. WEATHER AND CLIMATE. PRIMARY 4/ Social Science Pedro Antonio López Hernández
 UNIT 1. WEATHER AND CLIMATE PRIMARY 4/ Social Science Pedro Antonio López Hernández LAYERS OF THE ATMOSPHERE The atmosphere is a mixture of gases that surround Earth and separate it from the rest of the
The Climate of Pontotoc County
 The Climate of Pontotoc County Pontotoc County is part of the Crosstimbers. This region is a transition region from the Central Great Plains to the more irregular terrain of southeast Oklahoma. Average
Climate Variables for Energy: WP2
 Climate Variables for Energy: WP2 Phil Jones CRU, UEA, Norwich, UK Within ECEM, WP2 provides climate data for numerous variables to feed into WP3, where ESCIIs will be used to produce energy-relevant series
MPACT OF EL-NINO ON SUMMER MONSOON RAINFALL OF PAKISTAN
 MPACT OF EL-NINO ON SUMMER MONSOON RAINFALL OF PAKISTAN Abdul Rashid 1 Abstract: El-Nino is the dominant mod of inter- annual climate variability on a planetary scale. Its impact is associated worldwide
Case Study Las Vegas, Nevada By: Susan Farkas Chika Nakazawa Simona Tamutyte Zhi-ya Wu AAE/AAL 330 Design with Climate
 Case Study Las Vegas, Nevada By: Susan Farkas Chika Nakazawa Simona Tamutyte Zhi-ya Wu AAE/AAL 330 Design with Climate Professor Alfredo Fernandez-Gonzalez School of Architecture University of Nevada,
SOUTH MOUNTAIN WEATHER STATION: REPORT FOR QUARTER 2 (APRIL JUNE) 2011
 2011") SOUTH MOUNTAIN WEATHER STATION: REPORT FOR QUARTER 2 (APRIL JUNE) 2011 Prepared for ESTANCIA BASIN WATERSHED HEALTH, RESTORATION AND MONITORING STEERING COMMITTEE c/o CLAUNCH-PINTO SOIL AND WATER CONSERVATION
SOUTH MOUNTAIN WEATHER STATION: REPORT FOR QUARTER 2 (APRIL JUNE) 2011 Prepared for ESTANCIA BASIN WATERSHED HEALTH, RESTORATION AND MONITORING STEERING COMMITTEE c/o CLAUNCH-PINTO SOIL AND WATER CONSERVATION
Weather to Climate Investigation: Maximum Temperature
 Name: Date: Guiding Questions: Weather to Climate Investigation: Maximum Temperature What are the historical and current weather patterns or events for a location in the United States? What are the long-term
Amplified Pyranometer SP-212 & 215
 Amplified Pyranometer SP-212 & 215 Amplified Pyranometer Sensor This sensor is calibrated to measure total shortwave radiation. The evaporation of water from soil and the transpiration of water from plant
National Meteorological Library and Archive
 National Meteorological Library and Archive Fact sheet No. 4 Climate of the United Kingdom Causes of the weather in the United Kingdom The United Kingdom lies in the latitude of predominately westerly
Climate outlook, longer term assessment and regional implications. What s Ahead for Agriculture: How to Keep One of Our Key Industries Sustainable
 Climate outlook, longer term assessment and regional implications What s Ahead for Agriculture: How to Keep One of Our Key Industries Sustainable Bureau of Meteorology presented by Dr Jeff Sabburg Business
Baton Rouge Climate Summary: July 2014
 Baton Rouge Climate Summary: July 2014 (based on available data as of 07 August 2014) July Weather Highlights: - 2014 s run of cooler-than-normal weather continues - three July cool fronts very uncommon
Weather Instruments WHAT IS WEATHER
 TOPIC TWO 1 WHAT IS WEATHER Weather is the combined short-term conditions found in the lower atmosphere. These conditions include precipitation, or rain and snow, as well as wind, pressure, storminess,
RR#4 - Multiple Choice
 1. The map below shows the amount of snowfall, in inches, produced by a lake-effect snowstorm in central New York State. The wind that produced this snowfall pattern most likely came from the 1) northeast
McArthur River Mining Borroloola Caravan and Devils Spring Stations
 Borroloola Caravan and Devils Spring Ambient Air Quality Monitoring Validated Report 1 st July 2016 31 st July 2016 Report No.: DAT10991 Report issue date: 25 th August 2016 Maintenance contract: MC1100,
1 What Is Climate? TAKE A LOOK 2. Explain Why do areas near the equator tend to have high temperatures?
 CHAPTER 17 1 What Is Climate? SECTION Climate BEFORE YOU READ After you read this section, you should be able to answer these questions: What is climate? What factors affect climate? How do climates differ
Colorado s 2003 Moisture Outlook
 Colorado s 2003 Moisture Outlook Nolan Doesken and Roger Pielke, Sr. Colorado Climate Center Prepared by Tara Green and Odie Bliss http://climate.atmos.colostate.edu How we got into this drought! Fort
Solar Resource Mapping in South Africa
 Solar Resource Mapping in South Africa Tom Fluri Stellenbosch, 27 March 2009 Outline The Sun and Solar Radiation Datasets for various technologies Tools for Solar Resource Mapping Maps for South Africa
ARUBA CLIMATOLOGICAL SUMMARY 2017 PRECIPITATION
 ARUBA CLIMATOLOGICAL SUMMARY 2017 PRECIPITATION The total amount of rainfall recorded at Reina Beatrix International Airport for the year 2017 was 391.0 mm. This is 17.1 % below normal ( Figure 1 ). During
L.O Students will learn about factors that influences the environment
 Name L.O Students will learn about factors that influences the environment Date 1. At the present time, glaciers occur mostly in areas of A) high latitude or high altitude B) low latitude or low altitude
AUTOMATION OF OBSERVING NETWORK IN BMKG
 Agency for Meteorology, Climatology, and Geophysics of the Republic of Indonesia AUTOMATION OF OBSERVING NETWORK IN BMKG Agung Saifulloh Majid, G.S. Budhi Dharmawan, Damianus Tri Heryanto, Untung Merdijanto
The Climate of Seminole County
 The Climate of Seminole County Seminole County is part of the Crosstimbers. This region is a transition region from the Central Great Plains to the more irregular terrain of southeastern Oklahoma. Average
The Climate of Haskell County
 The Climate of Haskell County Haskell County is part of the Hardwood Forest. The Hardwood Forest is characterized by its irregular landscape and the largest lake in Oklahoma, Lake Eufaula. Average annual