The 2005 Illinois Drought a
|
|
|
- Luke Barnaby Dixon
- 5 years ago
- Views:
Transcription
1 Informational/Educational Material The 2005 Illinois Drought a by Kenneth E. Kunkel (editor), James R. Angel, Stanley A. Changnon, Roger Claybrooke, Steven D. Hilberg, H. Vernon Knapp, Robert S. Larson, Michael Palecki, Robert W. Scott, and Derek Winstanley Illinois State Water Survey A Division of the Illinois Department of Natural Resources 2006
2
3 The 2005 Illinois Drought Kenneth E. Kunkel (editor), James R. Angel, Stanley A. Changnon, Roger Claybrooke, Steven D. Hilberg, H. Vernon Knapp, Robert S. Larson, Michael Palecki, Robert W. Scott, and Derek Winstanley Informational/Educational Material, i
4 ii
5 Contents Page Chapter 1. Introduction Acknowledgments... 1 Chapter 2. Illinois Temperature and Precipitation Characteristics of 2005 Introduction... 2 Statewide Monthly Temperatures and Precipitation... 4 Monthly Temperatures and Precipitation by Climate Division... 4 Statewide Daily Temperatures and Precipitation... 5 Summary... 5 Chapter 3. Physical Effects on Illinois Water Resources Introduction...14 State-Averaged Soil Moisture...14 Evolution of Soil Moisture Spatial Patterns during 2005 Drought...15 Evolution of Surface and Groundwater Levels during 2005 Drought...16 Summary...17 Chapter 4. Regional Analysis of the 2005 Drought Introduction...26 Precipitation on a Large Scale...27 Integrated Drought Measure: Modeled Soil Moisture during Integrated Drought Measure: Pasture Conditions during Summary...30 Chapter 5. Continental and Hemispheric Circulation Patterns Introduction...38 Circulation Patterns in Possible Causes...39 Summary...40 Chapter 6. The Role of Tropical Systems Introduction...48 Data and Methodology...48 Results and Discussion...49 Summary... Chapter 7. Societal and Economic Impacts Introduction...57 Agricultural Sector...57 Crop Conditions and Yields...57 Economic Impacts...59 Future Impacts...60 iii
6 Contents (concluded) Page Government Actions Effects on Agribusinesses Energy Sector Water Resources Retail Business Summary Chapter 8. Chemical Climatology of the 2005 Drought Introduction Chemical Climate in Climate and Chemical Climate Anomalies in Spring Summary Chapter 9. Summary References iv
7 List of Figures Page 2-1. January 2005 precipitation departures from the mean (inches) March 2005 precipitation departures from the mean (inches) April 2005 precipitation departures from the mean (inches) May 2005 precipitation departures from the mean (inches) June 2005 precipitation departures from the mean (inches) March-June 2005 precipitation departures from the mean (inches) July 2005 precipitation departures from the mean (inches) August 2005 precipitation departures from the mean (inches) March-August 2005 precipitation (percent of the mean) March-August 1936 precipitation (percent of the mean) September 2005 precipitation departures from the mean (inches) Monthly precipitation (inches) and temperature (ºF) departures from the mean, 2004 and Illinois climate divisions Temperature departures (ºF) from the mean by climate division, 2004 and Precipitation departures (inches) from the mean by climate division, 2004 and Precipitation departures (inches) from the mean by climate division, 2004 and Monthly soil moisture departures within the top 40 inches of soil (inches) from the mean, averaged for all soil moisture sites, January December Soil moisture expressed as percent of the monthly means for May 1, v
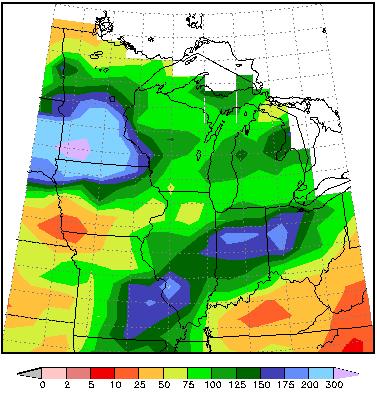
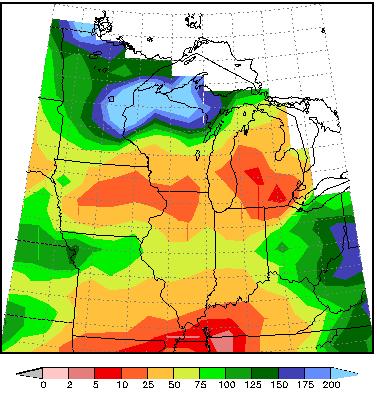
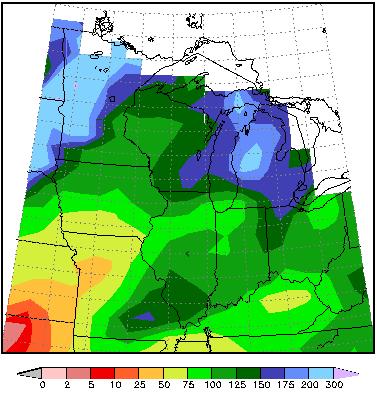
8 List of Figures (continued) Page 3-3. Soil moisture expressed as percent of the monthly means for June 1, Soil moisture expressed as percent of the monthly means for July 1, Soil moisture expressed as percent of the monthly means for August 1, Soil moisture expressed as percent of the monthly means for September 1, Hourly soil moisture at 6 levels under sod at DeKalb, Illinois, March-December Shallow groundwater-level deviation (feet) from the period-of-record mean, averaged for 17 stations from the WARM network, January December Streamline expressed as percent of the period-of-record median averaged for 26 Illinois gaging stations from the USGS network, January December Evolution of 2005 U.S. Drought Monitor status in the central United States Precipitation departures (inches) from the mean during 2005 in the United States: a) January-February; b) March-May; c) June-August; and d) September-December Monthly precipitation (percent of the mean) for the Midwest, March-November Weekly cumulative precipitation departures (inches) from the mean in Illinois climate division 1 (northwest Illinois) and Missouri climate division 2 (southeast Missouri) Climate Prediction Center Soil Moisture Anomaly (mm) maps: a) January 30, 2005; b) April 30, 2005; and c) June 30, Climate Prediction Center Soil Moisture Anomaly (mm) maps: a) August 31, 2005; b) September 30, 2005; and c) December 31, Percent of pasture acreage in poor or very poor condition: a) Illinois; and b) Missouri vi
9 List of Figures (continued) Page 5-1. Mean March-April-May sea level pressure (hpa) based on the NCEP/NCAR reanalysis: a) 2005; and b) Source: NOAA Climate Diagnostic Center, Boulder, CO March-April-May 8 hpa level vector winds (m/s) based on the NCEP/NCAR reanalysis: a) long-term mean; b) 2005 mean; and c) composite anomaly for the five driest springs between 19 and 2004: 1956, 1971, 1987, 1988, and 1992; and d) anomaly for spring Source: NOAA Climate Diagnostic Center, Boulder, CO. Note that the color code in c) and d) is different than in a) and b) Mean June-July-August sea level pressure (hpa) based on the NCAR/NCEP reanalysis: a) 2005; and b) Source: NOAA Climate Diagnostic Center, Boulder, CO June-July-August 8 hpa level vector winds (m/s) from the NCEP/NCAR reanalysis: a) long-term mean; b) 2005 mean; c) composite anomaly for the five driest summers between 19 and 2004: 1966, 1976, 1984, 1988, and 1991; and d) anomaly for summer Source: NOAA Climate Diagnostic Center, Boulder, CO. Note that the color code in c) and d) is different than in a) and b) hpa level geopotential height anomalies from the mean (gpm) from the NCEP/NCAR reanalysis: a) March-May 2005; b) June-August 2005; c) composite anomaly for the five driest springs between 19 and 2004: 1956, 1971, 1987, 1988 and 1992; and d) composite anomaly for the five driest summers between 19 and 2004:1966, 1976, 1984, 1988, and Source: NOAA Climate Diagnostic Center, Boulder, CO Sea surface temperature anomalies from the mean ( ºC): a) March-May 2005; b) June-August 2005; c) composite anomaly for the five driest springs between 1990 and 2004: 1925, 1930, 1934, 1936, and 1971; and d) composite anomaly for the five driest summers between 1990 and 2004: 1930, 1933, 1936, 1988, and Source: NOAA Climate Diagnostic Center, Boulder, CO Autumn circulation conditions: a) September-October hpa level height anomalies (gpm); b) September-October 2005 mean 8 hpa level vector winds (m/s); c) November hpa level height anomalies from the mean (gpm); and d) November 2005 sea surface temperature anomalies from the mean ( ºC). Source: NOAA Climate Diagnostic Center, Boulder, CO...47 vii
10 List of Figures (continued) Page 6-1. The storm tracks of all four tropical storms that passed through Illinois in 2005: They are, in chronological order: 1) Tropical Storm Arlene (white), 2) Hurricane Dennis (blue), 3) Hurricane Katrina (yellow), and 4) Hurricane Rita (red). Source: National Weather Service National Hurricane Center Rainfall (inches) from Tropical Storm Arlene Surface weather map, 7:00 A.M. C.D.T. June 12, Source: National Weather Service National Centers for Environmental Prediction Surface weather map, 7:00 A.M. C.D.T. July 12, Source: National Weather Service National Centers for Environmental Prediction Rainfall (inches) from Hurricane Dennis Rainfall (inches) from Hurricane Katrina Surface weather map, 7:00 A.M. C.D.T. August 30, Source: National Weather Service National Centers for Environmental Prediction Rainfall (inches) from Hurricane Rita Surface weather map, 7:00 A.M. C.D.T. September 25, Source: National Weather Service National Centers for Environmental Prediction March-September rainfall departure from the mean (inches) Accumulated contribution of total rainfall (inches) from four tropical systems through Illinois during 2005 growing season March-September rainfall departure from the mean (inches), without four tropical systems that passed through Illinois during 2005 growing season The higher-than-expected yields in 2005 resulted in surpluses and major grain storage problems in Illinois. Millions of bushels of corn are stored outside a Champaign elevator in early November because the numerous storage bins are already filled Chloride ion deposition for spring (March-May) averaged for Sodium ion deposition for spring (March-May) averaged for viii
11 List of Figures (concluded) Page 8-3. Sulfate ion deposition for spring (March-May) averaged for Nitrate ion deposition for spring (March-May) averaged for Mercury deposition for spring (March-May) averaged for Chloride ion deposition for spring (March-May) 2005 expressed as anomalies from the average Sodium ion deposition for spring (March-May) 2005 expressed as anomalies from the average Sulfate ion deposition for spring (March-May) 2005 expressed as anomalies from the average Nitrate ion deposition for spring (March-May) 2005 expressed as anomalies from the average Sulfate ion deposition for spring (March-May) 2005 expressed as anomalies from the average Mercury deposition for spring (March-May) 2005 expressed as anomalies from the average... ix
12 List of Tables Page 2-1. Selected Statewide Rankings of Precipitation since Selected Statewide Rankings of Temperature since The Status of Illinois Corn and Soybean Crops on Certain Dates during Regional Corn Yields in Illinois for 2004, 2005, Averages for , and the Difference between the Average and the 2005 Value. (Illinois Department of Agriculture) Regional Soybean Yields in Illinois for 2004, 2005, Averages for , and the Differences between the Average and the 2005Value. (Illinois Department of Agriculture) x
13 Abstract Dry conditions in 2005 reached a historic level of severity in some parts of Illinois and ranked as one of the three most severe droughts in Illinois in 112 years of record. The timing of the dryness during the spring and summer, when water demand and use are high, ensured substantial impacts on agriculture and other sectors. The drought also had several unusual characteristics. The drought area was long and narrow, extending from south Texas to the Great Lakes, but within the Midwest, the drought had relatively minor impacts on states other than Illinois. A record number of remnants of hurricanes and tropical storms passed through Illinois during July, August, and September, substantially ameliorating drought conditions in portions of central and southern Illinois. Crop yields were surprisingly high in parts of the state, perhaps providing evidence of increased drought resistance in modern varieties and the benefits of timely rains. xi
14 xii
15 Chapter 1. Introduction Although drought is a natural and recurring feature of climate, the dry conditions in 2005 reached a historic level of severity in some parts of Illinois and ranked as one of the three most severe droughts in Illinois in 112 years of record. The timing of the dryness during the spring and summer, when water demand and use are high, ensured substantial impacts on agriculture and other sectors. The drought also had several unusual characteristics. First, and most prominently, the long, narrow area affected extended from south Texas to the Great Lakes. Within the Midwest, the drought had relatively minor impacts on states other than Illinois, unlike the vast majority of past severe droughts that affected large portions of the Midwest. Second, a record number of remnants of hurricanes and tropical storms passed through Illinois during July, August, and September, substantially ameliorating drought conditions in portions of central and southern Illinois. Third, crop yields were surprisingly high in parts of the state, perhaps providing evidence of increased drought resistance in modern varieties. The unusual nature of the 2005 drought prompted this study to document and provide insights into the drought s physical and atmospheric chemistry characteristics and societal impacts. Chapter 2 provides an overview of the temporal and spatial features of precipitation and temperature anomalies during 2005, including a comparison with past major droughts. Since the early 1980s, the Illinois State Water Survey has operated a soil moisture network known worldwide for longevity and quality. Using data from this network, Chapter 3 describes the evolution of soil moisture conditions during the drought and also briefly discusses the effects on streamflows and groundwater levels. Chapter 4 describes regional climate conditions, showing the unusual spatial distribution of this drought. Chapter 5 identifies atmospheric circulation features associated with the precipitation deficiencies and explores possible connections to sea surface temperatures. The 2005 hurricane season in the North Atlantic set a record not only for the number of tropical storms and hurricanes, but also for the number of these events with direct precipitation effects on Illinois, as described in Chapter 6. Chapter 7 assesses drought impacts, particularly agricultural impacts. Atmospheric circulation anomalies that caused the drought also caused anomalies in the quantities of chemicals deposited from the atmosphere as described in Chapter 8. Finally, Chapter 9 provides a concise summary of the principal findings of the study. Acknowledgments The authors thank Eva Kingston for her diligent editorial work and Linda Hascall for careful page layout. This report was prepared using financial resources appropriated by the Illinois General Assembly and Governor Blagojevich to the Illinois Department of Natural Resources and the Illinois State Water Survey. Partial support also was provided by the National Oceanic and Atmospheric Administration under contract EA133E-02-CN
16 Chapter 2. Illinois Temperature and Precipitation Characteristics of 2005 James R. Angel and Stanley A. Changnon Introduction The precipitation and temperatures between January and December contributed to development and intensification of the 2005 drought. This chapter contains monthly and seasonal maps of precipitation, graphs of monthly precipitation and temperatures for Illinois and its nine climate divisions, and graphs of daily precipitation and temperature departures. Data used for these analyses were collected by the National Weather Service Cooperative Observer Network. Tables 2-1 and 2-2 summarize the more significant rankings of precipitation and temperature for It is important to note that hydrological conditions were at or above normal going into the 2005 drought as a result of near-normal precipitation in 2004, followed by the sixth wettest January since 1895 (Figure 2-1). Average precipitation in January 2005 was 5.39 inches, 3.42 inches above the statewide mean. Precipitation in February 2005 was 1.94 inches, near normal. Dry conditions began to develop in March Statewide rainfall was only 1.65 inches (51 percent of the mean): less than an inch in northern Illinois and 3 inches in far southern Illinois, with precipitation departures 1-2 inches below the mean (Figure 2-2). Farmers generally responded favorably because dry conditions allowed early planting of corn. The drying trend continued in April (Figure 2-3), with rainfall 1.24 inches below the statewide mean and temperatures much above the mean (Table 2-2). Rainfall deficits in May were even greater (Figure 2-4), with a statewide average of 1.70 inches (2.61 inches below the mean), the fourth driest May on record. In western, central, and eastern Illinois it also was the sixth, fourth, and fifth driest May, respectively, on record. The media began to carry stories noting the drought was centered in Illinois and adjacent portions of surrounding states (Burns, 2005a). Table 2-1. Selected Statewide Rankings of Precipitation since 1895 Period Rank Amount (inches) Departure from normal (inches) January 6 th wettest March 18 th driest April 30 th driest May 4 th driest June 8 th driest October 13 th driest December 17 th driest March-May 2 nd driest March-June 2 nd driest March-July 5 th driest March-August 5 th driest March-September 5 th driest March-October 4 th driest January-December 11 th driest
17 Table 2-2. Selected Statewide Rankings of Temperature since 1895 Period Rank Temperature Departure from normal ( F) ( F) January 34 th warmest February 12 th warmest April 15 th warmest June 12 th warmest January-June 13 th warmest June-August 16 th warmest June-November 3 rd warmest January-December 12 th warmest June conditions continued the dry regime with statewide average rainfall of 1.94 inches, 2.18 inches below the mean (Figure 2-5), and a statewide temperature average of 74.8 F, 3.2 F above the mean. Northern Illinois experienced the fifth warmest June on record. Some locations in southern Illinois received heavy rains early in June from Tropical Storm Arlene (see Chapter 6). Rainfall during March-June (Figure 2-6) was 5-9 inches below the mean, the second driest such period on record. In response to the worsening conditions, Governor Blagojevich activated the Drought Response Task Force in June to monitor and respond to issues with impacts on public safety and the economy. Task Force members represent various state agencies, including the Illinois Department of Agriculture, the Illinois Environmental Protection Agency, the Illinois Department of Public Health, and the Illinois Department of Natural Resources. July rainfall also was below normal (Figure 2-7), but the statewide average of 3.22 inches was only 0.72 inch below the mean. July temperatures were slightly above normal, despite a statewide heat wave with temperatures above 90 F in mid-july that lasted 10 days (National Weather Service, July 26, 2005). July rainfall was quite variable across the state: quite low in parts of western and northern Illinois but 30 percent above the mean across southern Illinois as a result of Hurricane Dennis (see Chapter 6). March-July 2005 ranked as the fifth driest such period on record, with rainfall averaging more than 8 inches below the mean across the state. Furthermore, high temperatures with daily highs of 90 F or more during June and July ranged from 8 to 22 days above the mean across Illinois. Thus, summer to that date was considered as hot and dry. August rainfall was deficient in central and northeastern Illinois (Figure 2-8), but tropical storms delivered significant above normal rainfall across the southern half of Illinois. The statewide average of 3.72 inches in August was 0.03 inch above the mean. Temperatures averaged 2 F above the mean. Statewide, March-August rainfall totaled inches, 8.29 inches below the mean, the fifth driest such period on record. Comparisons of the 2005 drought with past recent droughts began to appear in the media during June (Grant, 2005e). Most scientists compared the emerging 2005 drought with the 1988 drought. As summer wore on, however, scientists noted that the 2005 drought was localized and largely confined to a narrow band from south Texas across Illinois to the southern Great Lakes (see Chapter 4), unlike the 1988 drought which extended across most of the Midwest and High Plains (Riebsame et al., 1991). Comparison of the March-August 2005 drought pattern, expressed as a percent of the mean precipitation (Figure 2-9), and the March-August 1936 rainfall pattern (Figure 2-10), the driest on record, showed extensive areas with precipitation less than 60 percent of the
18 mean in both years. The more severe 1936 drought had statewide average rainfall of inches compared to inches in Other March-August periods since 1895 averaging less rainfall than that in 2005 included 1930 (12.55 inches), 1988 (13.03 inches), and 1914 (14.31 inches). September rainfall was above normal (Figure 2-11), with some areas receiving 5-6 inches. Temperatures were also well above normal across Illinois and averaged 71.0 F statewide, 5.2 F above the mean, the fifth warmest September on record. The northwest and northeast areas of Illinois continued to experience rainfall below average, with amounts 77 percent of the mean. Late fall and early winter typically provide an opportunity for recharge of water resources in Illinois as temperatures drop and vegetative growth ends. Statewide, precipitation in October, November, and December remained below normal, however. Precipitation was 1.26 inches in October (1.61 inches below the mean), 3.23 inches in November (0.18 inches below the mean); and 1.23 inches in December (1.31 inches below the mean). As a result, the statewide deficit since March 2005 increased another 3.3 inches, making March-December 2005 the third driest such period on record, only inches compared to the mean of inches. Statewide Monthly Temperatures and Precipitation Figure 2-12 illustrates statewide monthly precipitation and temperature departures in 2004 and Precipitation in 2004 was notable only in that amounts alternated between above and below normal. Overall, 2004 precipitation was inches, 1.09 inches above the mean. Precipitation in 2005 was markedly different. Despite a wet start in January, nine of the remaining 11 months were below normal. Overall, 2005 precipitation was inches, 7.85 inches below the mean, and the 11 th driest year on record. Temperatures in 2004 were very favorable for crops. Spring temperatures were above normal and led to early planting while summer temperatures below normal reduced plant stress. Fall temperatures above normal enabled rapid maturing of crops. Temperatures continued to be above normal through winter After alternating temperatures above and below normal in spring 2005, Illinois entered a June-November stretch of temperatures above normal, 2.9 F above the mean, and the third warmest June-November on record. It was also the 12 th warmest year on record, 53.8 F (2.0 F above the mean). Monthly Temperatures and Precipitation by Climate Division Figure 2-13 depicts the nine climate divisions in Illinois. Each climate division is a region of similar climatic features within Illinois. Figure 2-14 illustrates monthly temperature departures ( F) from the mean at each climate division. Monthly temperature patterns closely match the statewide pattern found in Figure 2-12, with most months in 2005 having temperatures above normal across the state. Temperature departures were greatest in northern and central Illinois where drought was most intense. It is fairly typical in Illinois for drought and temperatures above normal to occur together. Once surface soil moisture is depleted and crops are under stress, solar energy normally used for evaporation and transpiration instead heats the land surface, resulting in higher temperatures. Figure 2-15 shows the monthly precipitation departures (inches) from the mean at each climate division. Like the statewide precipitation pattern found in Figure 2-12, some fairly significant positive and negative precipitation departures occurred in 2004, but without long-term soil moisture stress. In 2005, January precipitation was above normal across the state. It should be noted, however, that the positive departures in the northwest, northeast, and west were smaller than in other parts of the state. After a wet start, conditions became uniformly dry across all regions for the period 4
19 March-June. Beginning in July, many southern climate divisions showed moderating conditions and several months of precipitation near to above normal. Precipitation in northwestern, northeastern, and western Illinois was consistently below normal through December, however. Statewide Daily Temperatures and Precipitation Figure 2-16 illustrates the 2005 daily statewide precipitation (inches) and temperature departures (ºF) from the mean statewide. After a wet start, statewide precipitation remained low until July-August. Besides generally small amounts during the critical March-June period, there were long stretches of more than a week with no significant precipitation at all. Notable dry periods in 2005 include early and late May, mid to late June, late July to early August, early September, and most of October. Except for generally cooler-than-normal March and May conditions, Illinois experienced several periods with temperatures much above normal during and after the growing season. In some cases, daily departures exceeded the daily normal temperature by 10 F or more. Notable warm periods include the beginning and end of June, mid-july, early August, much of September and early October, and early November. Summary Examination of temperature and precipitation conditions revealed several key features of the 2005 drought. Abnormally wet January conditions established ample levels of soil moisture, streamflows, and reservoir levels early in the year. This was followed by the second driest March-June on record, which resulted in rapid development of drought conditions across the state. By July, conditions in southern Illinois and parts of central Illinois had improved dramatically with timely rains from tropical storms (Chapter 6) as much of northern and western Illinois remained very dry. Temperatures during the growing season were generally above normal, with a high frequency of days with temperatures above 90 F. Data for Illinois indicate 2005 was the 11 th driest and 12 th warmest year on record with inches of precipitation (7. inches below the mean) and a mean temperature of 53.8ºF (2.1 F above the mean), respectively. 5
20 January 2005 precipitation departures March 2005 precipitation departures Figure 2-1. January 2005 precipitation departures from the mean (inches) Figure 2-2. March 2005 precipitation departures from the mean (inches) April 2005 precipitation departures May 2005 precipitation departures Figure 2-3. April 2005 precipitation departures from the mean (inches) Figure 2-4. May 2005 precipitation departures from the mean (inches) 6
21 June 2005 precipitation departures March-June 2005 precipitation departures Figure 2-5. June 2005 precipitation departures from the mean (inches) Figure 2-6. March-June 2005 precipitation departures from the mean (inches) July 2005 precipitation departures August 2005 precipitation departures Figure 2-7. July 2005 precipitation departures from the mean (inches) Figure 2-8. August 2005 precipitation departures from the mean (inches) 7
22 March-August 2005 precipitation March-August 1936 precipitation Figure 2-9. March-August 2005 precipitation (percent of the mean) Figure March-August 1936 precipitation (percent of the mean) September 2005 precipitation departures Figure September 2005 precipitation departures from the mean (inches) 8
23 a) Statewide Precipitation Precipitation Departure (inches) J04 F M A M J J A S O N D J05 F M A M J J A S O N D b) Statewide Temperature Temperature Departure (F) J04 F M A M J J A S O N D J05 F M A M J J A S O N D Figure Monthly precipitation (inches) and temperature ( F) departures from the mean, 2004 and
24 Northwest Northeast West Central East West Southwest East Southeast Southwest Southeast Figure Illinois climate divisions 10
25 Temperature Departure (F) Northwest West Southwest J04 F M A M J J A S O N D J05 F M A M J J A S O N D J04 F M A M J J A S O N D J05 F M A M J J A S O N D Temperature Departure (F) Northeast East Southeast J04 F M A M J J A S O N D J05 F M A M J J A S O N D J04 F M A M J J A S O N D J05 F M A M J J A S O N D Temperature Departure (F) West Southwest J04 F M A M J J A S O N D J05 F M A M J J A S O N D J04 F M A M J J A S O N D J05 F M A M J J A S O N D Temperature Departure (F) Central Southeast J04 F M A M J J A S O N D J05 F M A M J J A S O N D J04 F M A M J J A S O N D J05 F M A M J J A S O N D Temperature Departure (F) East J04 F M A M J J A S O N D J05 F M A M J J A S O N D Figure Temperature departures ( F) from the mean by climate division, 2004 and
26 Precipitation Departure (inches) Northwest West Southwest J04 F M A M J J A S O N DJ05 F M A M J J A S O N D J04 F M A M J J A S O N D J05 F M A M J J A S O N D Precipitation Departure (inches) Northeast J04 F M A M J J A S O N D J05 F M A M J J A S O N D East Southeast J04 F M A M J J A S O N D J05 F M A M J J A S O N D Precipitation Departure (inches) West J04 F M A M J J A S O N D J05 F M A M J J A S O N D Southwest J04 F M A M J J A S O N D J05 F M A M J J A S O N D Precipitation Departure (inches) Central J04 F M A M J J A S O N D J05 F M A M J J A S O N D Southeast J04 F M A M J J A S O N D J05 F M A M J J A S O N D Precipitation Departure (inches) East J04 F M A M J J A S O N D J05 F M A M J J A S O N D Figure Precipitation departures (inches) from the mean by climate division, 2004 and
27 a) Daily Statewide Precipitation b) Daily Statewide Temperature Temperature Departure (F) Precipitation (inches) Jan Feb Mar Apr May Jun Jul Aug Sep Oct Nov Dec -20 Jan Feb Mar Apr May Jun Jul Aug Sep Oct Nov Dec Figure a) Daily precipitation (inches) and b) temperature departures ( F) from the mean for
28 Chapter 3. Physical Effects on Illinois Water Resources Robert W. Scott and Stanley A. Changnon Introduction The Illinois State Water Survey (ISWS) regularly collects and archives data on soil moisture, streamflow, reservoir levels, and shallow groundwater depths. This information forms the basis for a monthly ISWS report on water resources, the Illinois Water and Climate Summary (IWCS). Longterm analyses and tracking of these data help scientists understand the impacts and extent of Illinois droughts and floods. Soil moisture data have been collected at 17 sites across Illinois since At all but one location, these sites roughly coincide with stations in the automated Illinois Climate Network (ICN), also operated by the ISWS. Through 2004, soil moisture was measured manually with a Troxler 3220 series neutron probe at 11 levels between the surface and a depth of 79 inches within a vertically aligned access tube placed under a sod-covered surface. Measurements were taken near the end of every month and also near mid-month during the growing season (March-September), totalling19 observations annually. Beginning in 2000, installation of Stevens-Vitel Hydra II continuous soil moisture sensors began at each ICN site, designed to replace the neutron probe measurements. Under this new system, individual sensors were placed at 6 levels under sod, 2-60 inches deep, connected to the ICN data logger, and automatically polled for information once each hour. After a 4-year comparative period, in December 2004, neutron probe observations were terminated at nine sites, but maintained at eight locations where the neutron probe observations were located some distance from the ICN tower, perhaps within a different soil profile. Thus, soil moisture observations in 2005 were collected using a combination of both data platform types. Drought impacts on streamflows were assessed using provisional flow data collected by the U. S. Geological Survey (USGS) and posted on its Web sites. These provisional data are compared to longterm streamflow records to determine the ranking and percentiles related to the flows that have occurred during the same time period in other years. Drought impacts on shallow groundwater levels were assessed from data routinely collected by the ISWS. The ISWS operates a network of 17 shallow groundwater monitoring wells (water table wells) sited in rural locations across the state. The selected wells are remote from pumping stations in order to assess short- and long-term trends in water table levels under natural conditions. These data are obtained from paper chart recording equipment and are extracted monthly during site visits. State-Averaged Soil Moisture Monthly departures from normal soil moisture statewide within the top 40 in. of soil are shown from January 2004-December 2005 (Figure 3-1). The time series shows a rapid response of soil moisture from more typical conditions in 2004 to a much drier condition that began in March In general, each month with above average precipitation in 2004 (Figure 2-12) also had a concomitant increase in soil moisture. Likewise, months with below average precipitation nearly always were identified with below normal soil moisture. However, the impacts on soil moisture of much larger monthly precipitation deficits during the drought appeared to be delayed by one month. That is, the largest soil moisture deficit (June 2005) occurred a month after the largest precipitation deficit, and the start of soil moisture recovery in August 2005 occurred a month after the first month with near average rainfall. 14
29 Monthly data after July 2005 showed continued dryness, but not as severe. Statewide soils remained dry through the following fall and winter, but on a lesser scale than was observed in late spring and early summer. Evolution of Soil Moisture Spatial Patterns during 2005 Drought Figures 3-2 to 3-6 show spatial patterns for five months, May to September 2005, respectively. Data displayed represent values at the start of each month within four layers of the soil profile, expressed as percent of the mean. By May 1 (Figure 3-2), two months of precipitation deficits had reduced soil moisture in most locations below normal levels. Spotty rains across parts of Illinois just prior to data collection resulted in scattered wet areas, but overall dryness was developing across much of the state. Moist conditions within deeper layers in southern Illinois appeared to reflect residual effects from heavier rains over the October 2004-January 2005 period. As the precipitation deficit continued, by June 1 (Figure 3-3), top layers had dried substantially, not only from lack of rain, but from increased seasonal surface evaporation as well. By July 1 (Figure 3-4), soil moisture was depleted across most of Illinois, except in areas where heavy rain events just prior to observations moistened soils near the surface. In general, broad areas of Illinois were characterized by very dry soils that were expanding into deeper layers. By August 1 (Figure 3-5), timely rains had ameliorated some dryness in upper layers, but these were insufficient to percolate downward very far as plant roots near the surface layers continued to extract moisture. Thus, dryness in deeper layers expanded. This pattern persisted into September (Figure 3-6). Even as crop moisture needs and surface evaporation began to wane seasonally, the entire soil moisture profile in the top 72 in. was largely depleted, especially in a north-south band from central to northeastern Illinois. At the same time, a few sites in southern and western Illinois had responded to increased precipitation from the passage of several tropical systems (see Chapter 6). The DeKalb site (DeKalb County) in northern Illinois exhibited some of the driest conditions during the drought. Observations at that site were made with continuous sensors. Hourly, March through December 2005, time series at the six monitoring levels (Figure 3-7) show temporal development of dry soils (water fraction by volume) as a function of depth. Analyses of these continuous data revealed rapid temporal responses to precipitation occurrence and deficits poorly detected by the far less frequent neutron probe observations. March 2005 values show small downward trends at the 2- and 8-inch levels, with a slightly greater drop at 4 inches Beginning in April, a significant downward trend was observed in all three levels nearest the surface. Moisture content decreased quickly during this period with quite noticeable episodes of short-term recharge due to precipitation events. As would be expected, these recharge episodes were more substantial in the 2-inch level and progressively diminished (and were not always observed) at 4 and 8 inches. Beginning slowly in March, but accelerating in May, soil moisture declined at the 20-inch level. Near the end of the first week in June, a substantial downward moisture trend commenced at 40 inches. The sensor at the deepest (60-inch) level detected no impact of the drought until mid-june, more than 3 months after the beginning of reduced precipitation, followed by a slow steady decrease in moisture into September. By the end of October, all levels were near their lowest readings for the year. Starting in mid- November, sensors at the top three levels began to observe sustained soil moisture recovery, while soils at the remaining levels maintained their lowest moisture readings through the end of It should be 15
30 noted that the top (2-inch) level showed significant variability during December, perhaps due to freezing soils at that level, a condition that yields a different response with these continuous sensors, thus, yielding less trustworthy values. As a final note, it is unclear why certain soil depths remained wetter than others (e.g., at 20 inches from July-November values). The situation may be due to the soil type/ texture profile at the site and the fractured or impervious nature of the soil with depth, a quite sitespecific situation. Further exploration of such features was beyond the scope of this report. Evolution of Surface and Groundwater Levels during 2005 Drought Shallow groundwater (water-table) levels were above average at the end of March 2005, but by the end of May, levels statewide were below average May levels by 1.1 feet (Figure 3-8). Levels fell slightly more during June and July, becoming 1.2 feet below the monthly average at the end of June and 1.5 feet below average by the end of July. At the end of August, groundwater levels were below the August average by 1.1 feet. Water levels in some wells fell a foot during August. Continued dryness, especially the cumulative effect of the drought, resulted in further declines during fall and early winter. By December 2005, shallow groundwater levels averaged more than 3 feet below the period-of-record mean for December. Averaged streamflows across Illinois (Figure 3-9) were near to above the period-of-record median at the end of February 2005; however, by the end of May, most rivers in Illinois were experiencing median flows normal below, generally 20 percent lower than the median. Period-of-record mean flows much below normal existed on June 1 on the Iroquois River, Salt Creek, and the Illinois River (at Valley City). By the end of July, most river flows in Illinois were much below normal (25 percent of period-of-record mean flows). Only the Cache River (in far southern Illinois) had a normal flow (ISWS, 2005). Many river flows in central Illinois were only 10 percent of the period-of-record mean, including those on the Spoon, La Moine, Mackinaw, Sangamon, Macoupin, Kaskaskia (at Vandalia), and Little Wabash Rivers. Low flows on the Little Wabash and Kishwaukee Rivers rated as once in 10-year events. The flow of the Illinois River at Valley City was the lowest July flow on record with records dating back to 1940 [6455 cubic feet per second (cfs) vs. the normal 21,580 cfs]. Streamflow conditions in August reflected those in July, although flows in southern Illinois had become normal (Figure 3-9). Dry conditions in Illinois did not create any serious decreases in the flows of the Mississippi and Ohio Rivers. Late August-September rains in central and southern Illinois brought streamflows there to near normal levels, but rivers in northern Illinois, including the Rock, Pecatonica, and Green Rivers, remained at levels well below normal through the end of Reservoir levels at the end of July reflected low streamflows, a foot or more below period-ofrecord mean levels at water-supply lakes in central and south-central Illinois: Bloomington, Carlinville, Highland, Mattoon, Pana, Paris, Pittsfield, Salem and Sparta (ISWS, 2005). No reservoirs showed levels at period-of-record mean or higher. Most water-supply reservoirs at the end of August showed decreases of 0.2 to 1 foot from levels for the previous month. A few locales with supply concerns, including Decatur, sought other sources of water. Several reservoirs in southern Illinois showed slight increases in levels at the end of August. Late August and September rains from Hurricanes Katrina and Rita brought reservoir levels up in central and southern Illinois within a foot or two below period-ofrecord means by the end of September. 16
31 Summary Spatial and temporal decreases in soil moisture near the surface occurred soon after the precipitation deficit began in March, while decreases in deeper layers were delayed and occurred at a slower pace with less amplitude. Recovery to higher levels was observed in upper soil layers by year s end, while deeper layers in central and northeastern Illinois remained at their lowest moisture values for the year. This sustained dryness eventually affected streamflows, reservoir levels, and groundwater levels. All fell to levels below normal by late spring and generally maintained this position throughout 2005, although some regional variations were observed with near normal conditions in southern Illinois in the latter part of the year. 17
32 Inches Soil Moisture (0-40 in. layer) J04 F M A M J J A S O N D J05 F M A M J J A S O N D Figure 3-1. Monthly soil moisture departures within the top 40 inches of soil (inches) from the mean, averaged for all soil moisture sites, January December
33 0-6 inch Soil Layer 6-20 inch Soil Layer inch Soil Layer inch Soil Layer Figure 3-2. Soil moisture expressed as percent of the monthly means for May 1,
34 0-6 inch Soil Layer 6-20 inch Soil Layer inch Soil Layer inch Soil Layer Figure 3-3. Soil moisture expressed as percent of the monthly means for June 1,
35 0-6 inch Soil Layer 6-20 inch Soil Layer inch Soil Layer inch Soil Layer Figure 3-4. Soil moisture expressed as percent of the monthly means for July 1,
36 0-6 inch Soil Layer 6-20 inch Soil Layer inch Soil Layer inch Soil Layer Figure 3-5. Soil moisture expressed as percent of the monthly means for August 1,
37 0-6 inch Soil Layer 6-20 inch Soil Layer inch Soil Layer inch Soil Layer Figure 3-6. Soil moisture expressed as percent of the monthly means for September 1,
38 Water fraction by volume Inches Mar 05 Apr May Jun Jul Aug Sep Oct Nov Dec Jan 06 Figure 3-7. Hourly soil moisture at 6 levels under sod at DeKalb, Illinois, March-December
39 Feet Groundwater Level J04 F M A M J J A S O N D J05 F M A M J J A S O N D Figure 3-8. Shallow groundwater-level deviation (feet) from the period-of-record mean, averaged for 17 stations from the WARM network, January December Streamflow Percent of Median J04 F M A M J J A S O N D J05 F M A M J J A S O N D Figure 3-9. Streamline expressed as percent of the period-of-record median averaged for 26 Illinois gaging stations from the USGS network, January December
40 Chapter 4. Regional Analysis of the 2005 Drought Michael Palecki and Steven D. Hilberg Introduction The development and evolution of drought in Illinois occurred in the context of the Midwest region and the United States. At the beginning of 2005, drought was not a concern in the central United States, while much of the western United States was enduring a severe multi-year drought. However, heavy precipitation during the winter alleviated much of the drought in the West, and the same weather systems brought copious precipitation to Illinois and the Midwest. Thus, there were virtually no abnormally dry areas in the Midwest even after the dry month of March The U.S. Drought Monitor (USDM) is a map product produced weekly by a consortium of federal agencies for the purpose of representing the drought status across the country (Svoboda et al., 2002). The current map can be accessed at and a link to an archive of these maps is also on the same page. It was not until April 12, 2005 that some abnormal dryness was apparent in the region on the USDM map, beginning where Michigan, Indiana, and Ohio converge (Figure 4-1, April 12). As represented on the USDM maps (Figure 4-1), abnormal dryness spread during April, and by May 10, abnormal dryness was widespread across the central Midwest (yellow on the USDM map), with some moderate drought (light brown on the USDM map) present near Lake Michigan (Figure 4-1, May 10). At that point, drought development accelerated, leading to the establishment of moderate drought in Illinois by the end of May (Figure 4-1, May 24). In mid-june moderate drought extended all the way from the Upper Peninsula of Michigan to the Gulf Coast of Texas (Figure 4-1, June 21), creating a fairly narrow but extensive band of drought that bisected Illinois from north to south. Some areas of severe drought (brown on the USDM map) were present in central-north Illinois and Texas through Arkansas into southern Missouri. Drought amelioration occurred during June in the Ohio River valley, especially in Indiana where the remnants of Tropical Storm Arlene dropped copious rains (Figure 4-1, June 21). But the core drought area from northern Illinois to Arkansas received little relief. Thus, by July 5, 2005, dryness and warmth intensified drought to extreme levels (red on the USDM map, Figure 4-1). An extreme drought is expected to occur only 2-5 percent of the time and is therefore a rare event. The coverage of extreme drought reached its greatest extent in the Midwest during early August 2005 (Figure 4-1, August 9). Despite some drought amelioration in southeastern Missouri, southern Illinois, and the Ohio River valley due to the remnants of Hurricane Dennis passing through in mid-july, a wide band of extreme drought extended from southeastern Wisconsin to central Missouri, and then resumed further south in Arkansas and Texas. Considerable regional recovery due to convective rains and Hurricane Katrina remnants occurred in August, and marked improvements were observed through eastern Illinois and the Ohio River valley in September from Hurricane Rita remnants. By October, a gap in the previously continuous drought band had formed in Missouri, with extreme drought holding on in northern Illinois, and only a small area of severe drought in Texas (Figure 4-1, October 11). However, the improvement ended there, and severe to extreme drought was maintained through the end of 2005 in Illinois and Iowa, while a drought of historic proportions developed in the southern portion of the drought band in Arkansas, Oklahoma, and Texas (Figure 4-1, December 27). In the remainder of this chapter, the precipitation anomalies responsible for the evolution of regional drought and the resulting soil moisture deficits will be examined. 26
41 Precipitation on a Large Scale In examining the total precipitation anomaly for 2005, the western United States, the Southeast, and the Northeast were wet, while central U.S. regions received well below normal rain totals. The large annual deficits occurred despite widespread flooding rains that impacted Illinois and the Midwest during January, with January to February precipitation surpluses reaching 4-8 inches over a large area (Figure 4-2a). Excluding January and February and focusing on the period March to December 2005, negative precipitation anomalies reached more than 15 inches in the northern Illinois drought area, and more than 21 inches in the south-central U.S. drought region (Texas, Oklahoma, Arkansas, and Louisiana). Most of the overall precipitation deficit in northern Illinois was achieved during spring (Figure 4-2b) and summer (Figure 4-2c). Drought in the south-central U.S. region eased during the summer, but greatly intensified during the last four months of the year (Figure 4-2d). A large portion of the rain that fell in the Ohio River valley, southern Illinois, southeastern Missouri, and points south and east of this arc resulted from the four tropical systems (detailed in Chapter 6). Otherwise, the drought region would have extended much further to the east. Focusing on the Midwest, monthly precipitation percentage-of-normal maps show a shifting pattern from month to month (Figure 4-3), with only the northern portion of Illinois being well below normal in almost every month from March to November During the spring months, areas receiving less than percent of normal precipitation (orange in Figure 4-3) were quite extensive from southern Missouri to southern Michigan, including much of Illinois. In June, there was a substantial flow of moisture into weather systems in the western Midwest, and remnants of Tropical Storm Arlene advected copious moisture into western Kentucky, Indiana, and lower Michigan, leaving only Illinois significantly below normal in precipitation. In fact, in the precipitation maps for July, August, and September, the paths of tropical systems are also quite apparent: Hurricane Dennis moisture was largely responsible for the above normal swath from southeastern Missouri to southern Michigan in the July precipitation percent-of-normal map; Hurricane Katrina contributed greatly to a wide swath of 200 percent of normal precipitation for August through the Ohio River valley; and Hurricane Rita left a similar swath a bit further north across Missouri, Illinois, Indiana, and Ohio on the September map (Figure 4-3). Other substantial outbreaks of convective precipitation used Gulf moisture but were not associated with a tropical storm, including storms drenching much of Missouri in August, and active weather systems moving through the northern Midwest in September, October, and November. This resulted in considerable drought amelioration north and east of Illinois and through Missouri but largely missed the core drought area in northern Illinois. A comparison of weekly cumulative precipitation deficits between the northwestern Illinois climate division (CD 1) and the southeastern Missouri climate division (CD 5) illustrates the lack of recovery in the former versus substantial recovery in the latter. In northwestern Illinois (Figure 4-4a), precipitation anomalies were negative, causing the cumulative deficit to rapidly increase to nearly 9 inches by the end of June. The southeastern Missouri precipitation deficit (Figure 4-4b) reached 8 inches by this time too. Both divisions were characterized by severe to extreme drought status on July 5 (Figure 4-1). The evolution was quite different following this date. As southeastern Missouri received precipitation from Hurricane Dennis in July, convective outbreaks and Hurricane Katrina in August, and Hurricane Rita in September, the cumulative deficit was reduced to only about 3 inches by early October. A few wet weeks in late November allowed this area to recover from a dry October, although deficits increased again toward the end of the year. In northwestern Illinois, the precipitation deficit accumulation paused in July and August, but no recovery was evident. Deficits worsened from late August to late October, and 27
42 maintained their lowest level until the end of the year. Therefore, northwestern Illinois remained in extreme drought status through the end of the year. Integrated Drought Measure: Modeled Soil Moisture during 2005 Computer models of soil moisture integrate data on the antecedent moisture conditions, precipitation deficits, and air temperature anomalies to provide an estimate of short to intermediate time scale drought status during the growing season. In a sense, modeled soil moisture is a measure of potential impacts on crops due to climate anomalies. Such models are useful for examining conditions on a multistate scale because there are no regional or national networks of soil moisture observations. The particular model illustrated here is a simple bucket soil moisture model (Huang et al., 1996) produced daily by the Climate Prediction Center (CPC). During its development, this model was verified by comparison with soil moisture observations made in Illinois during the period The model was found to simulate well the soil moisture climatology and interannual variability in Illinois. Current maps can be found at At the end of January 2005, soil moisture levels were well above normal across the future drought region from Texas to Michigan (Figure 4-5a). After a normal February and very dry March and April, however, a tremendous decline in soil moisture levels afflicted the same region, leaving western and northern portions of the Midwest with below normal soil moisture levels (Figure 4-5b). This is actually not harmful for crops at this time of year, and, in fact, provides dry and firm surfaces for farm tractors, facilitating crop planting. As dryness persisted into May, though, concern rose regarding soil moisture reserves for summer crop growth in Missouri and Illinois. Soil moisture levels declined over a vast central U.S. region leading to a broad area of dry soils from Texas and Louisiana to Wisconsin and Michigan. This time period corresponds to the establishment of abnormally dry status over most of the central United States on the USDM map (Figure 4-1). A combination of existing soil moisture at lower levels and some timely rains, however, allowed reasonable germination and early development of row crops that could send roots down faster than the soil layers were drying. Crops planted later did not fare as well. In June, above normal temperatures and below normal precipitation over Illinois and eastern Missouri further dried soils in this area. To the west, convective storms brought considerable rain and relieved drought conditions, moistening soils west of the drought axis. While precipitation from Tropical Storm Arlene reduced deficits over Indiana, soil moisture deficits continued to intensify in Illinois, eastern Missouri, and points south during June (Figure 4-5c). Crops had very serious problems in Missouri, where soils do not hold as much plant-available water as in Illinois and Iowa, and more quickly reached the wilting point. Nonirrigated poor or sandy soils in Illinois had similar crop problems. In July, drought conditions reached their nadir in northern Illinois, even as improvements were evident elsewhere. For example, soil moisture in northern Illinois and southeastern Missouri started the month at a similar level of deficit, but tremendous improvement occurred in the latter area due to the remnants of Hurricane Dennis for several days around the southern tip of Illinois. By the end of July, the driest soils of Illinois had been cut off from the driest soils in the Arkansas-Louisiana-Texas region, and the two drought centers would remain separated through the end of Even more improvement in central United States soil moisture was evident during August. Substantial convective outbreaks brought large amounts of rain from the Texas Panhandle through Missouri, and remnants of Hurricane Katrina saturated soils along the Mississippi River into the southern Midwest 28
43 (Figure 4-6a). Despite the August dryness in northern Illinois, soybeans did achieve near-normal yields due to some timely rains and very deep soil moisture not accounted for in the CPC model. However, Lake Michigan water levels began to decline to a point lower than the previous year. The band of driest soils expanded from northern Illinois into southern Iowa during September (Figure 4-6b). There were modest improvements in southern and east-central Illinois soils due to the remnants of Hurricane Rita. During August and September, dryness was intensifying in the Mid-Atlantic region even as conditions improved in Illinois. This period of East Coast soil dryness, however, was quite short lived. As tropical systems and coastal extratropical cyclones brought enormous flooding rains to the area during October, soil moisture anomalies were reversed, especially in the Northeast. On the other hand, moisture was blocked again from entering the central U.S. region resulting in very rapid soil moisture deficit increases in the southern drought area. Soils remained dry in northern Illinois and Iowa during late fall and early winter, when soil moisture recharge is very important for preparing the soil for the next growing season. The soil moisture deficit remained stable in the Illinois-Iowa region through the end of the year (Figure 4-6c), while drying intensified in the south-central U.S. region. Soil moisture deficits increased greatly in Texas, Oklahoma, and Arkansas from the end of October to mid-january 2006 (Figure 4-6c), reaching the first percentile (1 in chance) in a wide area. The soils of Missouri dried again, with drought expanding into the state from both the southwest and the northeast. Most of Kentucky missed both Hurricanes Katrina and Rita, and consequently was also much drier at the end of Integrated Drought Measure: Pasture Conditions during 2005 While most of the states in the Midwest were affected by the drought to some degree, Illinois and Missouri felt the brunt of the drought both in terms of the areal extent and severity. A time series representing general growing conditions was constructed using weekly pasture condition as a proxy. The pasture condition data were collected from the United States Department of Agriculture Weekly Weather and Crop Bulletins. These reports are statewide estimates of the condition of crops in five categories: Very Poor, Poor, Fair, Good, and Excellent. In Illinois, approximately 17.5 percent of the total land area is rural grassland, with the highest percentage in the northern and west-central portions of the state. This is also the region of Illinois where drought was most severe. Evolution and progress of the drought from mid-may through the end of September are given as the percentages of pasture in very poor (VP) and poor (P) conditions (Figure 4-7). Pasture conditions declined gradually in Illinois, with the 35 percent VP/P level not reached until about the last week of June (Figure 4-7a). Pasture conditions in Missouri declined more rapidly during May, rising from only 9 percent VP/P to 35 percent VP/P by the end of the first week in June (Figure 4-7b). Both Missouri and Illinois had abundant winter season precipitation in , and both states received similar levels of precipitation during March and April 2005 (58 percent of normal in Illinois, 61 percent of normal in Missouri.). Average temperatures were also very similar during this period. The reason for the more rapid decline in pasture conditions in Missouri versus Illinois is not clear but could be due to the differences in soil types. Pasture conditions in both states steadily worsened until mid-august, reaching 83 percent VP/P in both Illinois and Missouri during the week ending August 14. There was some slight improvement in Illinois pasture conditions the last week of July due to heavy rain associated with a slow-moving cold front in the heart of the drought-affected area. In Missouri, drought intensity and extent as depicted by 29
44 the U.S. Drought Monitor peaked on August 9 (Figure 4-1), and from this point on pasture conditions began to improve in both states through the end of the month. Pasture improvements continued in Illinois through the first week in September, largely as a result of rain from Hurricane Katrina in the southeastern third of the state. Heavy thunderstorms (not associated with any tropical systems) brought more relief to western and central Missouri the last week of August. Pasture conditions briefly worsened in both states with the report ending September 11 due to lack of rain the first 10 days of the month. Dry, sunny conditions and low moisture reserves were reflected in an increase of 15 percent in VP/P coverage in Illinois, while the Missouri increase was only 4 percent. With the onset of fall weather favorable for cool season grasses, and the occurrence of near-normal rainfall in September, pasture conditions steadily improved through early October. Summary The drought zone in Illinois was a core area of a much larger regional drought in While northern Illinois was one of the driest areas, considerable drought was felt at various times all the way from Canada to the Gulf of Mexico, though the drought was never widespread in an east-west dimension. At the end of 2005, severe and extreme drought affected a region of the Corn Belt centered on northern Illinois and southern Iowa, and also afflicted a much larger area of Texas, Oklahoma, Arkansas, and southwestern Missouri. The soil moisture levels were not only low in the modeled surface layers but also were greatly depleted in lower subsoil layers. 30


45 April 12, 2005 Valid 8 a.m. EDT May 10, 2005 Valid 8 a.m. EDT May 24, 2005 Valid 8 a.m. EDT June 21, 2005 Valid 8 a.m. EDT July 5, 2005 Valid 8 a.m. EDT August 9, 2005 Valid 8 a.m. EDT August 30, 2005 Valid 8 a.m. EDT October 11, 2005 Valid 8 a.m. EDT December 27, 2005 Valid 7 a.m. EST Figure 4-1. Evolution of 2005 U.S. Drought Monitor status in the central United States 31
 Total Precipitation Departure from Mean in Inches June 1, 2005 to August 31, 2005 d)total")
 from the 1971-2000 mean during 2005 in the United States: a) January-February; b) March-May; c)")
46 a) Total Precipitation Departure from Mean in Inches January 1, 2005 to February 28, 2005 b) Total Precipitation Departure from Mean in Inches March 1, 2005 to May 31, 2005 c) Total Precipitation Departure from Mean in Inches June 1, 2005 to August 31, 2005 d)total Precipitation Departure from Mean in Inches September 1, 2005 to December 31, 2005 Figure 4-2. Precipitation departures (inches) from the mean during 2005 in the United States: a) January-February; b) March-May; c) June-August; and d) September-December 32


 for the Midwest,")
47 Total Precipitation Percent of Mean March 1, 2005 to March 31, 2005 Total Precipitation Percent of Mean April 1, 2005 to April 30, 2005 Total Precipitation Percent of Mean May 1, 2005 to May 31, 2005 Total Precipitation Percent of Mean June 1, 2005 to June 30, 2005 Total Precipitation Percent of Mean July 1, 2005 to July 31, 2005 Total Precipitation Percent of Mean August 1, 2005 to August 31, 2005 Total Precipitation Percent of Mean September 1, 2005 to September 30, 2005 Total Precipitation Percent of Mean October 1, 2005 to October 31, 2005 Total Precipitation Percent of Mean November 1, 2005 to November 30, 2005 Figure 4-3. Monthly precipitation (percent of the mean) for the Midwest, March-November
48 a) Illinois Division 1 0 Cumulative Precipitation Departure (in) M A M J J A S O N D 2005 b) Missouri Division 5 0 Cumulative Precipitation Departure (in) M A M J J A S O N D 2005 Figure 4-4. Weekly cumulative precipitation departures (inches) from the mean in Illinois climate division 1 (northwest Illinois) and Missouri climate division 2 (southeast Missouri) 34
 Calculated Soil Moisture Anomaly (mm)")
 June 30, 2005 Figure 4-5.")
 maps: a) January 30, 2005; b) April 30, 2005;")
49 a) Calculated Soil Moisture Anomaly (mm) January 30, 2005 b) Calculated Soil Moisture Anomaly (mm) April 30, 2005 c) Calculated Soil Moisture Anomaly (mm) June 30, 2005 Figure 4-5. Climate Prediction Center Soil Moisture Anomaly (mm) maps: a) January 30, 2005; b) April 30, 2005; and c) June 30,
 Calculated Soil Moisture Anomaly (mm)")
 December 31, 2005 Figure 4-6.")
 August 31, 2005; b) September 30, 2005; and")
50 a) Calculated Soil Moisture Anomaly (mm) August 31, 2005 b) Calculated Soil Moisture Anomaly (mm) September 30, 2005 c) Calculated Soil Moisture Anomaly (mm) December 31, 2005 Figure 4-6. Climate Prediction Center Soil Moisture Anomaly (mm) maps: a) August 31, 2005; b) September 30, 2005; and c) December 31,
51 a) Illinois 2005 Pasture Conditions Poor Very Poor 70 Percent /15 5/22 5/29 6/5 6/12 6/19 6/26 7/3 7/10 7/17 7/24 7/31 8/7 8/14 8/21 8/28 9/4 9/11 9/18 9/25 10/2 b) Missouri 2005 Pasture Conditions Poor 90 Very Poor Percent /15 5/22 5/29 6/5 6/12 6/19 6/26 7/3 7/10 7/17 7/24 7/31 8/7 8/14 8/21 8/28 9/4 9/11 9/18 9/25 10/2 Week Ending Figure 4-7. Percent of pasture acreage in poor or very poor condition: a) Illinois; and b) Missouri 37
52 Chapter 5. Continental and Hemispheric Circulation Patterns Kenneth E. Kunkel, Michael Palecki, and Steven D. Hilberg Introduction The major sources of water vapor for warm-season precipitation processes in the central United States are the Gulf of Mexico and adjacent North Atlantic Ocean. A principal feature of the atmospheric circulation in this region is a semi-permanent high-pressure system over the subtropical North Atlantic, sometimes called the Bermuda High. Clockwise circulation around the high-pressure center brings moisture northward into the central United States on the western side of this feature. During spring, the western limb of the Bermuda High moves over the southeastern United States and eastern Gulf of Mexico. The Bermuda High is strongest in late spring and summer. The accompanying flow of moisture northward around the western edge of the high is often unstable or conditionally unstable and prone to convective activity, accounting for generally abundant growing season precipitation in the central and eastern United States. Circulation Patterns in 2005 During both spring and summer 2005, the Bermuda High was weaker than normal, leading to reduced atmospheric flow across the coast of the Gulf of Mexico. During spring, the subtropical high center was on the far eastern side of the Atlantic (Figure 5-1a), shifted to the east compared to average conditions, and was much weaker than normal (Figure 5-1b). Examination of flow patterns at a pressure level of 8 hpa (located at an altitude of approximately 5,000 feet) is quite revealing. During normal spring conditions (Figure 5-2a), the 8-hPa flow above Illinois is on the northern and western edges of a plume of moist air coming north from the western Gulf region and turning eastward over the Midwest. In 2005 (Figure 5-2b), the low-level flow pattern (wind direction) was normal, but wind speeds were weaker than normal, a usual circulation feature associated with dry springs in Illinois. A composite map of the 8-hPa flow departures from the five driest springs between 19 and 2004 (1956, 1971, 1987, 1988, and 1992) displays anomalous flow in the direction opposite to normal flow (Figure 5-2c), indicating that a reduction in moist air inflow from the south occurs consistently in dry springs and a feature that was very prominent in 2005 (Figure 5-2d). During a typical summer, the Bermuda High shifts northward and becomes stronger than during spring. The high-pressure center in 2005 (Figure 5-3a), while no longer spatially shifted compared to normal, was still somewhat weaker than the long-term mean pattern (Figure 5-3b). Long-term mean flow at 8 hpa (Figure 5-4a) is highlighted by an even stronger northerly flow over Texas curving into northern Illinois and the Great Lakes region. There was strong flow over Texas in 2005 (Figure 5-4b), but close examination indicates that this flow penetrated further northward than normal before curving east, a common feature to many of the driest summers in Illinois. A composite anomaly pattern from the five driest summers in Illinois between 19 and 2004 (1966, 1976, 1984, 1988, and 1991) shows enhanced northerly flow through the Great Plains and into Canada (Figure 5-4c), with vectors opposite to the normal flow over Illinois, demonstrating weakening flow of air from the Gulf moisture source. This was even more prominent in 2005 (Figure 5-4d), when anticylconic flow around the Bermuda High was much weaker than normal. By contrast, precipitation was above normal in the northern Great Plains and Minnesota. Further south and east of Illinois, precipitation was generally near to above normal, mostly due to substantial rainfall from several tropical systems (see Chapter 6). Were it not for that rainfall, the area of rainfall deficits would have included much of the eastern Corn Belt. 38
53 During spring 2005, anomalies in the height of the 0-hPa pressure level (approximately 18,000 feet; Figure 5-5a) were configured very similarly to the composite pattern of the five driest springs (Figure 5-5c), but were stronger, especially in eastern North America. These height anomalies were part of a persistent negative North Atlantic Oscillation regime and positive Pacific/North American pattern. This combination results in a northwesterly jet stream flow over the Midwest, reducing chances of strong moisture advection into Illinois. By summer, a mid-tropospheric high-pressure anomaly was located over the northeastern United States and southeastern Canada (Figure 5-5b), where the surface air was 4-7ºF above the mean for the season due to the anomalous circulation. In most of the five driest summers, the lack of precipitation in Illinois was associated with drought over a broader central U.S. region. When soil moisture is depleted after a drought has persisted for several weeks or more, a greater (lesser) fraction of solar radiation is used to heat the air (to evaporate soil moisture), causing greater warming of the air column. Upper air high-pressure ridges are a reflection of warm temperatures in the entire air column below the ridge, and excess heating of the air at the surface can contribute to development of a high-pressure ridge anomaly over the Great Plains and Canada that further suppresses precipitation (Figure 5-5d). In 2005, however, soil moisture in the Great Plains was adequate through the summer growing season. Therefore, this land-surface feedback mechanism was likely not strong. Possible Causes It is usually difficult to definitively identify causal factors for circulation features. However, sea surface temperatures (SSTs) were generally above normal in the North Atlantic during both spring and summer 2005, particularly in subtropical and subpolar regions (Figures 5-6a and 5-6b). This likely had two effects on the warm season circulation. First, the strength of the Bermuda High results, in part, from Atlantic SSTs that are relatively cooler than land masses to the east and west during late spring, summer, and early fall (Griffiths and Driscoll, 1982). During 2005, SSTs above normal directly may have contributed to the weaker-than-normal Bermuda High. Second, a necessary (but not sufficient) condition for tropical storm and hurricane formation is warm SSTs. Anomalously warm SSTs in the subtropical Atlantic almost certainly contributed to the unusually long and active nature of the 2005 hurricane season. These tropical storms and hurricanes ameliorated dry conditions in parts of Illinois (see Chapter 6) and did much more across areas south and east of Illinois by preventing formation of widespread drought that potentially could have provided regional feedbacks strong enough to promote upper-level ridging. The SST anomalies (Figures 5-6c and 5-6d) for the five driest springs (1925, 1930, 1934, 1936, and 1971) and five driest summers in Illinois between 1900 and 2004 (1930, 1933, 1936, 1988, and 1991) display much less subtropical warming in the Atlantic, and actually show cool La Niña conditions in the eastern tropical Pacific. Because the 2005 drought started with weak El Niño conditions that lasted into late spring before becoming neutral, most dry years used in the composite represented a different dynamic forcing component from the Pacific Ocean sector. Little drought recovery occurred in fall, as October was very dry, and September and November precipitation was near average for the state. The summer 0-hPa level positive anomaly in southeastern Canada expanded westward and southward through the Midwest during September and October (Figure 5-7a). The lower atmospheric flow continued to circumvent Illinois to the west and north (Figure 5-7b), making precipitation more common in Minnesota and Wisconsin but keeping Illinois generally dry. Major deviations from this pattern occurred in early and late September, when remnants of Hurricanes Katrina and Rita passed over southeastern Illinois and accounted for much of the precipitation that fell during September and October. Atmospheric flow patterns that had persisted since spring finally 39
54 changed in November when 0-hPa-level anomalies became negative north of the Great Lakes (Figure 5-7c). This change, combined with positive anomalies in the southwestern United States, reflected a more west-to-east circulation, bringing Pacific low-pressure centers through Illinois and leading to more normal precipitation in northwestern Illinois, the extreme drought area. The change in circulation may have been associated with the onset of a La Niña event, marked by rapidly cooling SSTs in the eastern tropical Pacific (Figure 5-7d). Summary Observed precipitation deficits are consistent with observed weaker-than-normal low-level flow from the Gulf of Mexico and Atlantic Ocean. The drought zone formed at the western edge of the main path through which moisture usually arrives from the south. Upper level flow also was weaker and more northwesterly than normal over Illinois, reducing the number of surface low-pressure centers and upper level disturbances moving through the state. Areal coverage of large precipitation deficits was restricted by fortuitous passage of remnants of four tropical systems south and east of Illinois. Warm SSTs in the North Atlantic may have contributed both to the weaker northward flow and the occurrence of tropical storms and hurricanes. Late in 2005, the onset of a La Niña event in the tropical Pacific led to establishment of a more zonal flow in November that brought more frequent low-pressure centers to Illinois. 40

 2005; and b) 1968-1996.")
55 a) 2005 Mean March-May Sea Level Pressure b) Mean March-May Sea Level Pressure Figure 5-1. Mean March-April-May sea level pressure (hpa) based on the NCEP/NCAR reanalysis: a) 2005; and b) Source: NOAA Climate Diagnostic Center, Boulder, CO. 41
 Anomaly for")
 based on the")
 composite anomaly for the five driest springs between 19 and")

56 a) March-May Long-Term Mean b) March-May 2005 c) Composite Anomaly for the 5 Driest Springs between 19 and 2004 d) Anomaly for Spring 2005 Figure 5-2. March-April-May 8 hpa level vector winds (m/s) based on the NCEP/NCAR reanalysis: a) long-term mean; b) 2005 mean; and c) composite anomaly for the five driest springs between 19 and 2004: 1956, 1971, 1987, 1988, and 1992; and d) anomaly for spring Source: NOAA Climate Diagnostic Center, Boulder, CO. Note that the color code in c) and d) is different than in a) and b). 42

 2005; and b) 1968-1996.")
57 a) Mean June - August 2005 b) Mean June-August Figure 5-3. Mean June-July-August sea level pressure (hpa) based on the NCAR/NCEP reanalysis: a) 2005; and b) Source: NOAA Climate Diagnostic Center, Boulder, CO. 43
")
 from the NCEP/NCAR")


58 a) June-August Long-Term Mean b) June-August 2005 Mean c) Composite Anomaly for the 5 Driest Summers between 19 and 2004 d) June-August Anomaly for Summer 2005 Figure 5-4. June-July-August 8 hpa level vector winds (m/s) from the NCEP/NCAR reanalysis: a) long-term mean; b) 2005 mean; c) composite anomaly for the five driest summers between 19 and 2004: 1966, 1976, 1984, 1988, and 1991; and d) anomaly for summer Source: NOAA Climate Diagnostic Center, Boulder, CO. Note that the color code in c) and d) is different than in a) and b). 44
 June-August Composite Anomaly for")
 from")


59 a) March-May 2005 b) June-August 2005 c) March-May Composite Anomaly for the 5 Driest Springs between 19 and 2004 d) June-August Composite Anomaly for the 5 Driest Summers between 19 and 2004 Figure hpa level geopotential height anomalies from the mean (gpm) from the NCEP/NCAR reanalysis: a) March-May 2005; b) June-August 2005; c) composite anomaly for the five driest springs between 19 and 2004: 1956, 1971, 1987, 1988 and 1992; and d) composite anomaly for the five driest summers between 19 and 2004:1966, 1976, 1984, 1988, and Source: NOAA Climate Diagnostic Center, Boulder, CO. 45
 June-August Composite")
: a)")


60 a) March-May 2005 b) June-August 2005 c) March-May Composite Anomalies for the 5 driest Springs between 1990 and 2004 b) June-August Composite Anomalies for the 5 driest Summers between 1990 and 2004 Figure 5-6. Sea surface temperature anomalies from the mean ( C): a) March-May 2005; b) June-August 2005; c) composite anomaly for the five driest springs between 1990 and 2004: 1925, 1930, 1934, 1936, and 1971; and d) composite anomaly for the five driest summers between 1990 and 2004: 1930, 1933, 1936, 1988, and Source: NOAA Climate Diagnostic Center, Boulder, CO. 46
 November 2005 0 hpa")

; b) September-October 2005 mean 8 hpa level vector")
; and d) November 2005 sea surface temperature")
61 a) September-October hpa Level Height Anomalies b) September-October hpa Level Vector Winds c) November hpa Level Height Anomalies d) November 2005 Sea Surface Temperature Anomalies Figure 5-7. Autumn circulation conditions: a) September-October hpa level height anomalies (gpm); b) September-October 2005 mean 8 hpa level vector winds (m/s); c) November hpa level height anomalies from the mean (gpm); and d) November 2005 sea surface temperature anomalies from the mean ( C). Source: NOAA Climate Diagnostic Center, Boulder, CO. 47
62 Chapter 6. The Role of Tropical Systems James R. Angel Introduction One of the outstanding climatic aspects of the 2005 drought was the role of tropical storms in alleviating the drought across southern and central Illinois. Tropical storms have been known to bring beneficial rains to drought-stricken areas, typically along the Gulf and East Coasts. Sugg (1968) documented nine such cases from 1928 to 1963, using the Palmer Drought Severity Index to identify areas in drought. The most significant example was the pair of Hurricanes Diane and Connie, only a week apart in 1955, which produced rains over 80,000 square miles considered to be in drought status along the East Coast. More recently, Hurricane Floyd produced heavy rainfall along the East Coast in September 1999, causing widespread flooding and abruptly ending a drought emergency in New Jersey (Robinson, 2000). Larson et al. (2005) examined the climatology of land-falling tropical cyclones in the United States and Mexico and demonstrated that a significant portion of the mean annual precipitation along the Gulf and East Coasts comes from tropical cyclones. On average, a small contribution (less than 5 percent) extended as far north as extreme southern Illinois. This chapter examines four tropical storms (Arlene, Dennis, Katrina, and Rita) that passed through Illinois during the 2005 growing season. The precipitation pattern and synoptic features of each storm are reviewed. The aggregated precipitation pattern from the four storms and its impact on the 2005 drought are discussed. Data and Methodology Three data sources were used in this study. Gridded precipitation data came from the Midwestern Climate Information System or MICIS (Kunkel et al., 1990) of the Midwestern Regional Climate Center, based on data from the U.S. cooperative observer network. Daily weather maps were obtained from the National Weather Service (2005). Tropical cyclone tracks from the Atlantic and Northeast Pacific Tropical Cyclone HURDAT dataset from the National Hurricane Center (Neumann et al., 1999) cover the period This last dataset contains both tropical storms and tropical depressions, but not remnant lows. For the 2005 season, dates when the tropical systems passed through Illinois were determined from the National Hurricane Center tracks. Rainfall amounts from those days then were accumulated separately from the rest of the growing season. Finally, maps of total rainfall from all sources, the total rainfall from tropical storms, and the total rainfall without tropical storms were determined for the growing season. Historical counts of tropical cyclones passing near Illinois were determined by identifying systems that passed north of 35ºN latitude and between 85º and 93ºW longitude. These latitude and longitude criteria were determined based on the tracks of the four storm systems in Reconstructing the actual rainfall contribution of a storm system is challenging when using daily data. Because the data are a combination of morning, afternoon, and midnight observations from different stations, it was decided to include data not only from the dates when the tropical system passed through Illinois but also from the day after to include any morning observations after the event. In many cases, tropical systems moving through the Midwest can cover areas hundreds of miles wide and interact with existing synoptic features, such as a passing cold front. As a result, it is not always possible to identify rainfall exclusively from tropical systems. 48
63 Results and Discussion There were four tropical systems of interest in Rainfall from those storms fell in Illinois on June (Tropical Storm Arlene), on July (Hurricane Dennis), on August (Hurricane Katrina), and on September (Hurricane Rita). Figure 6-1 shows their tracks. All four struck the Gulf Coast and then moved up the Mississippi and Ohio River valleys. Examination of previous records reveals that one or more tropical storms do occasionally pass through Illinois: two storms each in 8 years (1901, 1906, 1916, 1948, 1949, 19, 1960, and 1985) and one storm each in 18 years since 1851 (1879, 1891, 1893, 1898, 1909, 1912, 1923, 1933, 1940, 1942, 1947, 1953, 1955, 1970, 1986, 1988, 2001, and 2002). The 1940s, the most active decade, had seven storms passing through Illinois. Two decades, the 19s and 1980s, had four storms in each decade. Only in 2005 were four storms reported in one year, the maximum seen in the historical record, a rarity made even more impressive by a total of just three tropical systems passing through Illinois between 1956 and There are several important features regarding the timing of the four 2005 events. The four events occurred at intervals of 4 to 6 weeks during the growing season, thus benefiting crop growth and minimizing the threat from flooding. Tropical Storm Arlene and Hurricane Dennis occurred relatively early in the tropical storm season and arrived at critical times in the growing season for Illinois. For example, Hurricane Dennis arrived in mid-july just as many cornfields were beginning the silking and tasseling stage when precipitation is particularly critical. The first tropical system to pass through Illinois in the 2005 growing season was Tropical Storm Arlene in June Like the other three systems affecting Illinois that season, the storm moved up through the Gulf of Mexico, following first the Mississippi River valley and then the Ohio River valley. As Figure 6-2 shows, rain in Illinois was confined largely to the southern part of the state along the Wabash River valley. Amounts of 1 to 2 inches were common in this area, with a peak at Mount Carmel of 4.28 inches. The surface weather map for June 12, 2005 (Figure 6-3) showed that a cold front located to the west in Missouri and Iowa did not appear to interact with the passing tropical system. Therefore, it can be concluded that the rainfall on June was almost exclusively from Tropical Storm Arlene. The second tropical system, a category 4 hurricane, was Hurricane Dennis in July After causing damage along the Gulf Coast, it moved inland and weakened to a tropical depression before reaching Illinois. The surface weather map for July 12, 2005 (Figure 6-4) shows no pre-existing synoptic features in the Midwest to steer this storm. As a result, Hurricane Dennis meandered over Illinois for several days (July 11-13) before dissipating. Once again, timely rains greater than 1.5 inches were produced over southern Illinois (Figure 6-5), including a peak of 5.03 inches at Cairo. Even central Illinois received up to 2 inches of much needed rain. As with Tropical Storm Arlene, little or no rain fell in northern Illinois. The third tropical system over Illinois was Hurricane Katrina in August While causing massive damage and more than 1800 deaths along the Gulf Coast, the system brought rain and no severe weather to Illinois. Of the four tropical systems, this one brought the least rain to Illinois and that rainfall was confined largely to southeastern Illinois. Amounts of about an inch were common in that area, southwestern and central Illinois received about 0.25 inches, and northern Illinois received no rainfall (Figure 6-6). The surface weather map for August 30, 2005 (Figure 6-7) indicated no other rainproducing features in the area so all rainfall on August in Illinois was attributed to Hurricane Katrina. The final tropical storm to affect Illinois was Hurricane Rita in September This storm produced widespread rains across the state (Figure 6-8) with common amounts of 0.5 to 1.5 inches, and up to 2.66 inches at Lebanon on September Unlike prior storms, this one had benefits for 49
64 northern Illinois. The surface weather map for September 25, 2005 (Figure 6-9) indicated the presence of a rain-producing cold front that later moved through northern Illinois. Hurricane Rita may have interacted with this synoptic feature to enhance rainfall across Illinois and is the only one of the four tropical systems from which some rainfall on the chosen dates may have been from other synopticscale features. Rainfall departures of 8 to 11 inches from the mean for March-September occurred across much of northern and west-central Illinois (Figure 6-10). Rainfall departures in southern Illinois were less severe. What was the total rainfall contribution of those four tropical systems? Figure 6-11 shows that the June-September aggregate rainfall ranged from 3 to 8 inches in southern Illinois, 1 to 3 inches in central Illinois, and less than an inch to 2 inches in northern Illinois. Clearly, timely rains from these four storms reduced drought severity in the southern half of the state and in some areas even eliminated drought completely. Figure 6-12 shows March-September rainfall departures minus the rainfall of the four tropical systems. Rainfall departures may have been slightly more severe in northern Illinois, which already had the most impact. The biggest impact could have been in central and southern Illinois, which could have experienced drought conditions almost as severe as those in northern Illinois with rainfall deficits since March 2005 of 7 to 10 inches. Such deficits would have had a significant impact on crop production, pastures, streamflow, water levels in small lakes, and groundwater. Summary Unprecedented passage of four tropical systems (Tropical Storm Arlene, and Hurricanes Dennis, Katrina, and Rita) alleviated drought impacts during the 2005 growing season, particularly in southern and central Illinois. This study used daily rainfall data, daily weather maps, and tropical cyclone track information to determine the extent of rainfall from these four systems. Several circumstances make this situation significant from a climatological perspective. The historical tropical cyclone records indicate that while an occasional tropical system passes through Illinois (during 26 years since 1851), 2005 was the first time for four such systems in one season. Timing of 4 to 6 weeks between events benefited agriculture while minimizing flooding. Tropical Storm Arlene and Hurricane Dennis also occurred relatively early in the growing season when critical moisture was needed. By aggregating rainfall from these four events, it was shown that they provided significant drought relief in southern and central Illinois during the growing season. Aggregated rainfall amounts ranged from nearly 8 inches in far southern Illinois to less than an inch in northern Illinois. Without those four systems, central and southern Illinois could have been in a drought almost as severe as that in northern Illinois with 7-to 10-inch rainfall deficits instead of the observed 1- to 6-inch rainfall deficits.


, Hurricane Katrina (yellow), and")
65 2005 Tropical Storm Tracks Select Tracks Arlene Dennis Katrina Rita Miles Figure 6-1. The storm tracks of all four tropical storms that passed through Illinois in They are in chronological order: Tropical Storm Arlene (white), Hurricane Dennis (blue), Hurricane Katrina (yellow), and Hurricane Rita (red). Source: National Weather Service National Hurricane Center. 51

66 June 11-13, 2005, Rainfall (inches) Figure 6-2. Rainfall (inches) from Tropical Storm Arlene. Figure 6-3. Surface weather map, 7:00 A.M. C.D.T. June 12, Source: National Weather Service National Centers for Environmental Prediction. 52
 2.5 2 1.5 1 0.")
67 Figure 6-4. Surface weather map, 7:00 A.M. C.D.T. July 12, Source: National Weather Service National Centers for Environmental Prediction. July 11-13, 2005, Rainfall (inches) Figure 6-5. Rainfall (inches) from Hurricane Dennis. 53

68 August 30-31, 2005, Rainfall (inches) Figure 6-6. Rainfall (inches) from Hurricane Katrina. Figure 6-7. Surface weather map, 7:00 A.M. C.D.T. August 30, Source: National Weather Service National Centers for Environmental Prediction. 54

69 September 25-26, 2005, Rainfall (inches) Figure 6-8. Rainfall (inches) from Hurricane Rita. Figure 6-9. Surface weather map, 7:00 A.M. C.D.T. September 25, Source: National Weather Service National Centers for Environmental Prediction. 55
70 March-September, 2005, Rainfall Departure (inches) June-Sept 2005 Tropical Systems Rainfall (inches) Figure March-September rainfall departure from the mean (inches). Figure Accumulated contribution of total rainfall (inches) from four tropical systems through Illinois during 2005 growing season. March-September Rainfall without Tropical Systems (inches) Figure March-September rainfall departure from the mean (inches), without four tropical systems that passed through Illinois during 2005 growing season. 56
71 Chapter 7. Societal and Economic Impacts Stanley A. Changnon and H. Vernon Knapp Introduction This chapter focuses on the societal and economic impacts resulting from the drought. Many of these impacts occurred within the agricultural sector, an important part of the state s economy. These impacts produced several policy-related impacts as state leaders sought federal financial assistance for Illinois farmers. Impacts to other sectors of the state s economy were minor. Agricultural Sector Crop Conditions and Yields The decreases in moisture extending throughout the surface and subsurface of the state s hydrologic cycle translated into impacts envisioned to be severe for agriculture, the sector most affected by the 2005 drought. A major drought can affect all aspects of an economy, but a growing-season drought, as that in 2005, normally influences primarily agriculture, with few serious impacts elsewhere in the economy. The dry March-May allowed rapid planting of 94 percent of the corn by May 8, 2005, compared to the average of 78 percent on this date (Illinois Agricultural Statistics Service, May 13, 2005). Soybeans also were 98 percent planted by June 5, 2005, compared to the average of 84 percent. Agricultural Extension assessments of statewide crop conditions during the summer are shown (Table 7-1). The quality of the state s corn crop changed from 49 percent good and 11 percent poor/ very poor in early June to only 12 percent and 61 percent poor/very poor by early August. Very poor corn was reported for only 2 percent of the state s crop in early June, but grew to 29 percent by early August. Status of the soybean crop also shifted dramatically, from 55 percent rated as good to excellent in early June to only 19 percent in early August. The rainfall from Hurricane Dennis that fell on July across the southeastern half of the state (Figure 6-5) was extremely timely for the corn crop. Research has shown that rainfall amounts during the June 30-July 12 period have more positive influence on corn yields than rains at any other time in the growing season (Changnon and Neill, 1968). By early August crop experts reported that any future rain would not help the corn crop but might be of small aid to the soybean yields (Grant, 2005b). Table 7-1. The Status of Illinois Corn and Soybean Crops on Certain Dates during The amount of each crop in each category is expressed in percentages of the total crop in Illinois. Crop Date Excellent Good Fair Poor Very poor Corn June Corn July Corn August Soybeans June Soybeans July Soybeans August
72 Estimates by the U. S. Department of Agriculture (USDA) of Illinois crop yields, as first issued in early July, were 128 bushels/acre for corn and 41 bushels/acre for soybeans. These values declined in the USDA s yield predictions issued in early August to 125 bushels/acre for corn and 39 bushels/acre for soybeans. Interestingly, the USDA s yield estimates issued in early September called for higher yields of both crops, 136 bushels/acre for corn and 41 bushels/acre for soybeans. Many crop experts were surprised by these increases and questioned the USDA estimates. Crop surveys of many Illinois fields in late August found wide differences within many counties: the lowest corn yield was 6.7 bushels/ acre, and the highest was 203 bushels/acre (Grant, 2005a). The drought produced mixed outcomes for yield-reducing crop diseases and insect pests. Dry conditions were favorable for limiting populations of Japanese beetles and aphids. The corn crop was made vulnerable to corn rootworms, and dry soils limited plant uptake of pre-applied herbicides. The drought and lack of rain held off feared infestations of Asian soybean rust and many wheat diseases (Ross, 2005c). Harvest began in September with warm and dry conditions that persisted for three weeks, helping crops to dry. By September 15, 6 percent of the state s corn crop and 8 percent of the soybean crop were harvested. By September 18, 74 percent of the state s corn was mature (National Weather Service, September 20, 2005). By mid-october, 89 percent of the corn crop and 93 percent of the soybean crop were harvested. Many farmers expressed surprise at their higher-than-expected yields (Illinois Agriculture Statistical Service, October 12, 2005). Although rainfall in July, a critical time for corn, was well below average, the timely rainfall from passage of Hurricane Dennis on July helped corn crops in the southern two-thirds of Illinois. The harvested statewide average corn yield was 143 bushels/acre, one bushel above the average but 37 bushels less than record high yields of The harvested statewide average soybean yield was 47 bushels/acre, 5 bushels above the average and the second highest soybean yield on record. The record high set in 2004 for soybeans was bushels/acre. The spatial distribution of 2005 crop yields revealed wide differences across the state. Table 7-2 presents yield statistics for the state s nine crop districts. Corn yields were above average in 5 crop districts with yield averages greater than 10 bushels above average in East, Southwest, and Southeast districts. Corn yields in the Northwest, Northeast, West, and Central districts were below average, but the only major decrease occurred in the Northeast (-14 bushels). Soybean yields (Table 7-3) were above average in all nine districts, and 5 bushels or more above average in the East, East-Southeast, Southwest, and Southeast. Harvested yields of both crops were much higher than expected in most of Illinois. The large difference between the low crop yields predicted during summer, and as identified by the crop surveys, and final yields above average for both crops, raises major questions about the cause. Some experts during the fall credited the timely rains as the critical weather factor behind the high yields, but if they were important, their effect went undetected by the experts during the growing season. The drought did not hurt the state s winter wheat crop and yields averaged 64 bushels/acre, just one bushel below the 2004 record. Summer heat and dryness had detrimental effects on garden crops and pumpkins, and these yields were greatly reduced (Grant, 2005d). Orchard crops also were hurt by the heat, especially in areas where dry conditions prevailed. Peach yields were down 39 percent from those in 2004 (Illinois Agricultural Statistics Service, September 13, 2005). The drought also hurt hay and alfalfa crops, leading to increased prices for livestock feed (Grant, 2005k). 58
73 Table 7-2. Regional Corn Yields in Illinois for 2004, 2005, Averages for , and the Difference between the Average and the 2005 Value. (Illinois Department of Agriculture) Corn NW NE W C E WSW ESE SW SE Average Difference Source: Illinois Agricultural Statistics Service Table 7-3. Regional Soybean Yields in Illinois for 2004, 2005, Averages for , and the Difference between the Average and the 2005 Value. (Illinois Department of Agriculture) Soybeans NW NE W C E WSW ESE SW SE Average Difference Source: Illinois Agricultural Statistics Service Economic Impacts Poor yields in parts of Illinois and good yields elsewhere meant various economic outcomes for Illinois farmers. Many faced low yields and low crop prices. Flow of the Mississippi River was reduced sufficiently by August to affect barges carrying grain. Barge loadings had to be reduced, resulting in higher shipping costs (The News-Gazette, August 11, 2005). Farm costs for energy and shipping went up. Hurricane Katrina did great damage on August 29 not only to grain elevators in the New Orleans area that handles percent of all Illinois grain crops for export, but also to oil production facilities along the Gulf Coast. These two outcomes brought higher grain shipping costs and higher fuel costs for grain drying and harvest. Experts reported that the 2005 crops in Illinois were the most expensive ever (Grant, 2005i) with average costs of $206 per acre for corn and $113 per acre for soybeans. Thus, agricultural experts predicted low yields, low prices, and higher costs would lead many Illinois farmers to store, not sell their crops. What did the drought cost Illinois farmers? In mid-august, the head of the Illinois Farm Bureau estimated that the loss to farmers would be $2 billion, as measured from 2004 incomes when yields set all-time record highs (Shipman, 2005a). Loss estimates issued later were less, with crop experts claiming losses slightly would exceed $1 billion (Biemer, 2005). The USDA stated on September 20 that the drought loss in Illinois would be $1.3 billion (The News-Gazette, September 21, 2005). Given low prices, 2005 production of corn (1.73 billion bushels) and of soybeans (425 million bushels) in Illinois translated into income that totaled $5.626 billion. Assessment of farm incomes for 2005, which incorporated crop expenses, fuel costs, and low crop prices, translated into a statewide 59
74 average value of $38,787 (Grant, 2006). This is less than half the 2004 value of $77,906 and $1,625 less than the average, largely a result of the drought and high costs (Grant, 2005h). Sharp regional differences occurred as a result of the drought s spatial variations. The average 2005 farm income in northeastern Illinois, where the drought was most severe, was only $16,407. Farm incomes in wetter districts with good soils averaged $68,454 (East district) and $65,806 (West-Southwest district). Without the rains from the four tropical storms that each affected large parts of the state, losses would have been much higher. Farmers in the southern half of Illinois greatly benefited from these unusual rains, and their yields were well above average (Table 7-3). Future Impacts Drought impacts had various effects on future agricultural activities. One such potential impact was a lowering of farm land prices (Grant, 2005l). However, farmland prices during 2005 actually increased by 9 to 18 percent, continuing a multi-year trend (Aupperle, D.E., 2006). The drought limited the uptake of nitrogen fertilizer in many fields, and this meant that less fertilizer would need to be applied in Some crop experts felt that successful winter wheat yields in 2005 likely would increase planting of wheat in Greater problems with corn yields than with soybean yields in 2005, plus winter forecasts of relatively higher soybean prices in 2006, may increase planting of soybeans in 2006 and reduce corn acreage. The lower income and tight economic conditions on many farms also would reduce purchases of farm equipment. Sales decreased dramatically during the drought months. By late fall 2005, however, many farmers expressed interest in purchasing new farm equipment in 2006 (Grant, 2005f), attributed to optimism resulting from the higher-than-expected yields in Major seed firms reported no loss of seed corn supplies for Drought impacts and fear of continuation into 2006 led to major winter sales of biotech corn varieties that tend to be drought resistant. Two seed firms reported that their triple trait (stack) corn varieties were completely sold out by December 1 (Grant, 2005j). Government Actions A major activity that developed as the potentially serious impacts of the drought on Illinois crop yields became evident involved government assistance for Illinois farmers. In early July, the Illinois Department of Agriculture began monitoring crop conditions in 51 counties for use in development of a possible disaster declaration. To qualify for federal disaster assistance, a county must have at least 30 percent production losses in one major crop. Farmers were advised to certify their crop acreage by July 15 to qualify for inclusion in a disaster declaration or to obtain federal crop insurance. After its activation by the Governor of Illinois on June 26, the Drought Response Task Force continued to meet during July and August to assess and report on drought status. The Governor also decided in mid-july to request federal disaster assistance, and the federal Farm Service Agency (FSA) began assessing eligible counties. The FSA found that 101 counties qualified for disaster declarations, and the Governor formally requested federal aid in late July. The Illinois Treasurer also initiated a $ million drought relief program to provide low interest farm loans (Shipman, 2005d). By the end of August, the 700 loans made totaled $47 million. Approximately 65 percent of Illinois corn and bean crops had been insured (Ross, 2005b). Assessment in late August revealed that 74,000 Illinois farms had projected drought-related crop losses greater than 30 percent (Ross, 2005a). Illinois members of Congress agreed to push for federal aid for the drought, admitting that aid would be difficult to obtain because the drought problem area was confined largely to only one state, Illinois. Obtaining the desired aid likely would require Congressional extension of the
75 disaster assistance program legislation, slated to terminate on September 1, The advent of Hurricane Katrina on August 29 with huge losses along the Gulf Coast immediately became a national issue that affected the potential for drought assistance for Illinois. As September wore on, Illinois two senators pushed for a drought relief plan to extend the assistance legislation. Illinois members of the House of Representatives offered three bills with different relief plans, revealing a need for a compromise. As the harvest progressed, yields were found to be much higher than expected, particularly in central and southern Illinois, and relief assistance was seen as being needed only for farmers in northern Illinois (Grant, 2005c). Political endeavors to get federal disaster funds for Illinois farmers were on hold during October and November. Some policy experts concluded that Congressional efforts to get federal aid funds ended when the statewide corn and soybean yields above average appeared in early October. In mid-december, Congress was debating dimensions of the $453 billion defense spending bill that contained several other nondefense items, including funds for agricultural relief and for Hurricane Katrina victims. The Senate had inserted $1.6 billion in the defense bill for farm relief resulting from losses due to drought, floods, or hurricanes. The House refused to include the added farm relief funding, insisting that all relief funding ($29 billion) go to victims of Hurricane Katrina (Zuckman, 2005). Illinois two senators argued against the House position, but were told that Illinois key House members went along with President Bush s wishes, not farm relief. House members further claimed that the farm relief efforts of Illinois two senators were only a political ploy being used to thwart other aspects of the defense funding bill. Essentially, federal disaster relief for Illinois farmers had become a political issue. The debate continued into May-June 2006 as Illinois senators sought to get President Bush to approve a disaster aid bill that included $200 million for Illinois farmers struck by the 2005 drought (Grant, 2006). Effects on Agribusinesses The drought and its impacts on crops had further impacts on certain agribusinesses. For example, John Deere, a major producer of farm equipment, reported in August that sales declined by 3.5 percent because of the drought, and the company s stock values fell 11 percent, leading the company to cut production (Miller, 2005). Major seed companies and fertilizer firms, however, reported no impacts from the Illinois-centered drought. The lower flow on the Mississippi River reduced barge loads, which was costly to Illinois farmers and barge companies. One barge firm reported having lost $300,000 due to smaller loads (The News Gazette, August 11, 2005). The outcome for grain elevators was mixed with much grain assigned to storage. Elevator managers who followed the early and mid-summer predictions of greatly reduced grain yields in Illinois held off selling their stored 2004 corn. Then, by September, many corn and soybean yields were average or higher, resulting in surplus corn supplies but only limited storage available. By late October, 97 million tons of corn were stored on the ground outside elevators (Figure 7-1), an outcome of the higher-than-expected yields, rapid harvest, and shipping problems (Grant, 2005g). Energy Sector The drought and its high summer temperatures had impacts on the energy industry. Temperatures above normal created extensive use of air conditioning, increasing incomes of utilities and costs for consumers. Added use of electricity caused utilities to use large amounts of natural gas at their electric generating units. The price of natural gas was high when summer 2005 began, but enhanced use of gas to generate electricity helped drive natural gas prices up even further (The News- Gazette, August 25, 61
76 2005). Coal sales and production also increased to meet the enhanced demand for electricity for air conditioning, thus benefiting several Illinois coal companies. Water Resources Surface water and shallow groundwater supply systems are typically most vulnerable to the impacts of drought. Compared to central and southern Illinois, the region of northern Illinois that was hardest hit by the 2005 drought has relatively abundant and deep groundwater resources that are relatively insensitive to the impacts of drought. The Chicago metropolitan region gets its water from Lake Michigan, and thus its supply was unaffected by the drought, as were the supplies for communities that rely upon deep groundwater. Of the other surface water supplies in the region, most withdraw water from major rivers that historically have proven to have sustainable low flows during drought periods. Some Chicago suburban dwellers dependent on shallow wells for their home supplies experienced supply problems as water levels fell. This led to the digging of new wells at many homes. Many communities in northern Illinois experienced sizable increases in water use during the hot, dry weather in the summer of 2005, with most of the increases related to lawn watering and other outdoor uses of water. Newer neighborhoods that lacked mature landscaping had particularly high levels of water use, with some neighborhoods reporting an increase in average water use of about 300 percent. The overall water use for Rockford swelled to 40 mgd for much of June, up from a normal rate of 25 mgd (Seibert, 2005). Many communities in northeastern Illinois imposed bans against the use of sprinklers and other forms of outdoor watering. In most cases, the restrictions were not imposed because aquifers lacked sufficient water, but that the wells and distribution systems were not designed to provide the substantial increase in water use often leading to low pressure in the outer portions of the distribution system. Increased pumping rates during the 2005 summer led to high water pressure in pipes near the East St. Louis Illinois-American water plant, and which, combined with dryness and hardening of the soil, caused numerous cracks in water mains (Jadhav, 2005). Boil orders were in effect because of concerns with potential contamination of the treated water. Although the precipitation deficit in central Illinois was not as great as in northern Illinois, the region still experienced concerns about the drought s potential impacts on water supply. The cities of Springfield and Decatur took proactive measures to mitigate the potential impacts of the drought by using alternative sources of water to augment their supply reservoirs. Before Lake Springfield had dropped a foot below its normal level, the city had activated the pumping system that withdraws water from the South Fork Sangamon River to replenish the storage in the lake. It is estimated that between June 2005 and February 2006, this auxiliary supply had collectively added more than 3 feet to the water level in the lake (Reynolds, 2006). Even then, as of the end of February 2006, the lake level was 3.3 feet below full pool. In a similar manner, Decatur began pumping water from their well field in DeWitt County to augment the streamflow in the Sangamon River that flows into Lake Decatur. The watershed of Lake Decatur received timely rainfall in fall 2005 such that the lake level returned to full pool in November Low water levels were observed at several smaller public supply reservoirs in central Illinois. Canton Lake was more than 6 feet below full pool by January 2006, with a loss of storage of roughly 40 percent. The two supply reservoirs at Ashland reached 4 and 6 feet below full pool. One of the primary reasons of concern for some small communities (for example, Altamont, Ashland, and Greenfield) is because their reservoirs have an uncertain capacity, as no bathymetric survey has been conducted. 62
77 Despite preliminary concerns, the drought did not develop sufficiently by the spring of 2006 to bring about serious threats of water shortages for any communities. Most of these reservoirs typically can provide water through the course of multi-year droughts. Of the supply reservoirs that were noticeably below normal in 2005, most returned to full capacity (or nearly full) by the end of April There were two known exceptions, these being the community reservoirs at Altamont and Greenfield, which remained 3.5 and 4.5 feet below normal, respectively, heading into the summer of Retail Business Some businesses were winners and others losers as a result of the 2005 drought and associated summer heat wave (Chicago Tribune, August 5, 2005). Winners included companies that install home swimming pools. The heat increased demand for pool installations. Companies that install home irrigation systems also reported increased sales. Firms that dig and develop home wells reported a percent increase in residential well installations in the Chicago suburbs. Hot, dry conditions also led people to water parks for recreation, and attendance at several such parks was up 28 percent over that in past years. Several retail firms reported that the drought and summer heat had hurt sales. Commercial firms that mow grass had reductions due to poor grass growth. Landscaping firms reported a major decline in sales and losses from having to replant recent plant installations that had died from the heat and dryness. Firms that install sod also had low sales, as did companies that seal basements and roofs (The News- Gazette, July 27, 2005). Summary Development of a drought in spring 2005 led to greatly lowered soil moisture levels by early June across large parts of the state. Soil moisture shortages persisted through the summer as below average rainfall continued in northern and western Illinois. This translated into reduced crop yields in those areas. Yields were hurt further by high summer temperatures and plant stress from numerous extremely hot days. Late summer rainfall was near normal in the southeastern half of Illinois because of passage of four tropical storms, resulting in above average yields of corn and soybeans in southern Illinois and parts of central Illinois. Corn yields for Illinois averaged 143 bushels/acre, a bushel more than the average ( ), and 37 bushels less than the record-high 2004 yields. Soybean yields for Illinois were 47 bushels/acre, 5 bushels above average, 3 bushels less than in 2004, and the second highest soybean yield on record. Corn yields in five of the state s nine crop districts (southernmost) were above average, and soybean yields were above average in all crop districts. The difference between in-season yield predictions of crop experts calling for major crop losses from the drought versus the actual high corn and soybean yields in most of the state raised an important question. What factors produced the unexpected positive crop outcomes? Did pre-march wetness that saturated Illinois soils before the drought, May and June dryness that produced deep rooting corn plants, and/or timeliness of the few rains in June and July do more for crops than was recognized by agricultural specialists? Did the drought greatly reduce crop diseases? Has advanced genetic breeding led to seed varieties that are much more productive under moisture and heat stress? Biotech corn varieties developed very deep and complex root systems in 2005 and produced corn yields 10 to 30 bushels/acre greater than standard corn varieties (Grant, 2005j). Have improvements in farming practices also made a big difference in the weather-crop yield relationships? Regardless of the reasons, circumstances in 2005 suggest a need for new definitions of weather-crop yield relationships. 63
78 The 2005 yield outcomes and other external factors translated into incomes below average for Illinois farmers. Income was reduced by low crop prices as most Corn Belt crop yields were average or above, and by added costs for higher fuel prices and shipping costs for harvested crops. Total farm income from Illinois corn and soybeans in 2005 was $5.2 billion. The net income for Illinois farms in 2005 averaged $38,787, 4 percent less than the average and 51 percent less than in 2004 when record-high yields occurred. These near average yields and political issues in Congress kept federal relief funds from being awarded to Illinois farmers. Some economic impacts occurred in other sectors: energy, water resources, and certain retail businesses. These impacts were all minor in comparison with agricultural impacts, however. An important and interesting aspect of the 2005 growing-season drought was the considerable rainfall, mainly in the southern third of the state, from the unusual passages of four tropical storms that produced sufficient rainfall to bring major benefits to that part of Illinois. Consequently, that area enjoyed above average crop yields and no serious public water-supply shortages. 64

79 Figure 7-1. The higher-than-expected yields in 2005 resulted in surpluses and major grain storage problems in Illinois. Millions of bushels of corn are stored outside a Champaign elevator in early November because the numerous storage bins are already filled. 65
Illinois Drought Update, December 1, 2005 DROUGHT RESPONSE TASK FORCE Illinois State Water Survey, Department of Natural Resources
 Illinois Drought Update, December 1, 2005 DROUGHT RESPONSE TASK FORCE Illinois State Water Survey, Department of Natural Resources For more drought information please go to http://www.sws.uiuc.edu/. SUMMARY.
January 25, Summary
 January 25, 2013 Summary Precipitation since the December 17, 2012, Drought Update has been slightly below average in parts of central and northern Illinois and above average in southern Illinois. Soil
Monthly Long Range Weather Commentary Issued: SEPTEMBER 19, 2016 Steven A. Root, CCM, Chief Analytics Officer, Sr. VP,
 Monthly Long Range Weather Commentary Issued: SEPTEMBER 19, 2016 Steven A. Root, CCM, Chief Analytics Officer, Sr. VP, sroot@weatherbank.com SEPTEMBER 2016 Climate Highlights The Month in Review The contiguous
Monthly Long Range Weather Commentary Issued: February 15, 2015 Steven A. Root, CCM, President/CEO
 Monthly Long Range Weather Commentary Issued: February 15, 2015 Steven A. Root, CCM, President/CEO sroot@weatherbank.com JANUARY 2015 Climate Highlights The Month in Review During January, the average
National Wildland Significant Fire Potential Outlook
 National Wildland Significant Fire Potential Outlook National Interagency Fire Center Predictive Services Issued: September, 2007 Wildland Fire Outlook September through December 2007 Significant fire
Monthly Long Range Weather Commentary Issued: APRIL 1, 2015 Steven A. Root, CCM, President/CEO
 Monthly Long Range Weather Commentary Issued: APRIL 1, 2015 Steven A. Root, CCM, President/CEO sroot@weatherbank.com FEBRUARY 2015 Climate Highlights The Month in Review The February contiguous U.S. temperature
Monthly Long Range Weather Commentary Issued: NOVEMBER 16, 2015 Steven A. Root, CCM, Chief Analytics Officer, Sr. VP, sales
 Monthly Long Range Weather Commentary Issued: NOVEMBER 16, 2015 Steven A. Root, CCM, Chief Analytics Officer, Sr. VP, sales sroot@weatherbank.com OCTOBER 2015 Climate Highlights The Month in Review The
Monthly Long Range Weather Commentary Issued: APRIL 18, 2017 Steven A. Root, CCM, Chief Analytics Officer, Sr. VP,
 Monthly Long Range Weather Commentary Issued: APRIL 18, 2017 Steven A. Root, CCM, Chief Analytics Officer, Sr. VP, sroot@weatherbank.com MARCH 2017 Climate Highlights The Month in Review The average contiguous
Monthly Long Range Weather Commentary Issued: May 15, 2014 Steven A. Root, CCM, President/CEO
 Monthly Long Range Weather Commentary Issued: May 15, 2014 Steven A. Root, CCM, President/CEO sroot@weatherbank.com APRIL 2014 REVIEW Climate Highlights The Month in Review The average temperature for
SEPTEMBER 2013 REVIEW
 Monthly Long Range Weather Commentary Issued: October 21, 2013 Steven A. Root, CCM, President/CEO sroot@weatherbank.com SEPTEMBER 2013 REVIEW Climate Highlights The Month in Review The average temperature
Champaign-Urbana 1999 Annual Weather Summary
 Champaign-Urbana 1999 Annual Weather Summary ILLINOIS STATE WATER SURVEY 2204 Griffith Dr. Champaign, IL 61820 wxobsrvr@sws.uiuc.edu Maria Peters, Weather Observer A major snowstorm kicked off the new
Monthly Long Range Weather Commentary Issued: APRIL 25, 2016 Steven A. Root, CCM, Chief Analytics Officer, Sr. VP, sales
 Monthly Long Range Weather Commentary Issued: APRIL 25, 2016 Steven A. Root, CCM, Chief Analytics Officer, Sr. VP, sales sroot@weatherbank.com MARCH 2016 Climate Highlights The Month in Review The March
Monthly Long Range Weather Commentary Issued: July 18, 2014 Steven A. Root, CCM, President/CEO
 Monthly Long Range Weather Commentary Issued: July 18, 2014 Steven A. Root, CCM, President/CEO sroot@weatherbank.com JUNE 2014 REVIEW Climate Highlights The Month in Review The average temperature for
The hydrologic service area (HSA) for this office covers Central Kentucky and South Central Indiana.
 for this office covers Central Kentucky and South Central Indiana.") January 2012 February 13, 2012 An X inside this box indicates that no flooding occurred within this hydrologic service area. January 2012 continued the string of wet months this winter. Rainfall was generally
January 2012 February 13, 2012 An X inside this box indicates that no flooding occurred within this hydrologic service area. January 2012 continued the string of wet months this winter. Rainfall was generally
2012 Growing Season Weather Summary for North Dakota. Adnan Akyüz and Barbara A. Mullins Department of Soil Science October 30, 2012
 2012 Growing Season Weather Summary for North Dakota Adnan Akyüz and Barbara A. Mullins Department of Soil Science October 30, 2012 Introduction The 2012 growing season (the period from April through September)
Tropical Storms Reduced Drought in Illinois in 2005
 Transactions of the Illinois State Academy of Science received 3/31/06 (2006), Volume 99, #3&4, pp. 111-124 accepted 9/17/06 Tropical Storms Reduced Drought in Illinois in 2005 James R. Angel Center for
NATIONAL WEATHER SERVICE
 January 2016 February 9, 2016 This was a dry month across the HSA despite one large and several smaller snowfalls. Most locations ended up 1-2 inches below normal for the month. The driest locations at
2011 National Seasonal Assessment Workshop for the Eastern, Southern, & Southwest Geographic Areas
 2011 National Seasonal Assessment Workshop for the Eastern, Southern, & Southwest Geographic Areas On January 11-13, 2011, wildland fire, weather, and climate met virtually for the ninth annual National
Weather and Climate Summary and Forecast October 2017 Report
 Weather and Climate Summary and Forecast October 2017 Report Gregory V. Jones Linfield College October 4, 2017 Summary: Typical variability in September temperatures with the onset of fall conditions evident
Midwest/Great Plains Climate-Drought Outlook September 20, 2018
 Midwest/Great Plains Climate-Drought Outlook September 20, 2018 Brian Fuchs National Drought Mitigation Center University of Nebraska-Lincoln School of Natural Resources September 20, 2018 General Information
but 2012 was dry Most farmers pulled in a crop
 After a winter that wasn t, conditions late in the year pointed to a return to normal snow and cold conditions Most farmers pulled in a crop but 2012 was dry b y M i k e Wr o b l e w s k i, w e a t h e
Weather and Climate Summary and Forecast Summer 2017
 Weather and Climate Summary and Forecast Summer 2017 Gregory V. Jones Southern Oregon University August 4, 2017 July largely held true to forecast, although it ended with the start of one of the most extreme
2011 Year in Review TORNADOES
 2011 Year in Review The year 2011 had weather events that will be remembered for a long time. Two significant tornado outbreaks in April, widespread damage and power outages from Hurricane Irene in August
Champaign-Urbana 2001 Annual Weather Summary
 Champaign-Urbana 2001 Annual Weather Summary ILLINOIS STATE WATER SURVEY 2204 Griffith Dr. Champaign, IL 61820 wxobsrvr@sws.uiuc.edu Maria Peters, Weather Observer January: After a cold and snowy December,
Monthly Long Range Weather Commentary Issued: SEPTEMBER 19, 2015 Steven A. Root, CCM, Chief Analytics Officer, Sr. VP, sales
 Monthly Long Range Weather Commentary Issued: SEPTEMBER 19, 2015 Steven A. Root, CCM, Chief Analytics Officer, Sr. VP, sales sroot@weatherbank.com AUGUST 2015 Climate Highlights The Month in Review The
Weather and Climate Summary and Forecast January 2019 Report
 Weather and Climate Summary and Forecast January 2019 Report Gregory V. Jones Linfield College January 4, 2019 Summary: December was mild and dry over much of the west, while the east was much warmer than
The Pennsylvania Observer
 The Pennsylvania Observer May 31, 2012 May 2012 - Pennsylvania Weather Recap By: Paul Knight The majority of the fifth month had temperatures averaging well above seasonal levels with two distinct hot
The 1986 Southeast Drought in Historical Perspective
 The Southeast Drought in Historical Perspective Abstract The dry and hot weather in the southeast United States during the first seven months of caused record drought. The agricultural and hydrological
February 10, Mr. Jeff Smith, Chairman Imperial Valley Water Authority E County Road 1000 N Easton, IL Dear Chairman Smith:
 February 1, 1 Mr. Jeff Smith, Chairman Imperial Valley Water Authority 8 E County Road 1 N Easton, IL Dear Chairman Smith: The Illinois State Water Survey (ISWS), under contract to the Imperial Valley
North Central U.S. Climate Summary and Outlook Webinar July 21, 2016
 North Central U.S. Climate Summary and Outlook Webinar July 21, 2016 Stuart Foster State Climatologist for Kentucky Department of Geography and Geology Western Kentucky University Stuart.foster@wku.edu
Champaign-Urbana 1998 Annual Weather Summary
 Champaign-Urbana 1998 Annual Weather Summary ILLINOIS STATE WATER SURVEY Audrey Bryan, Weather Observer 2204 Griffith Dr. Champaign, IL 61820 wxobsrvr@sparc.sws.uiuc.edu The development of the El Nìno
Drought in Southeast Colorado
 Drought in Southeast Colorado Nolan Doesken and Roger Pielke, Sr. Colorado Climate Center Prepared by Tara Green and Odie Bliss http://climate.atmos.colostate.edu 1 Historical Perspective on Drought Tourism
An ENSO-Neutral Winter
 An ENSO-Neutral Winter This issue of the Blue Water Outlook newsletter is devoted towards my thoughts on the long range outlook for winter. You will see that I take a comprehensive approach to this outlook
Chiang Rai Province CC Threat overview AAS1109 Mekong ARCC
 Chiang Rai Province CC Threat overview AAS1109 Mekong ARCC This threat overview relies on projections of future climate change in the Mekong Basin for the period 2045-2069 compared to a baseline of 1980-2005.
NATIONAL HYDROPOWER ASSOCIATION MEETING. December 3, 2008 Birmingham Alabama. Roger McNeil Service Hydrologist NWS Birmingham Alabama
 NATIONAL HYDROPOWER ASSOCIATION MEETING December 3, 2008 Birmingham Alabama Roger McNeil Service Hydrologist NWS Birmingham Alabama There are three commonly described types of Drought: Meteorological drought
Weather and Climate Summary and Forecast January 2018 Report
 Weather and Climate Summary and Forecast January 2018 Report Gregory V. Jones Linfield College January 5, 2018 Summary: A persistent ridge of high pressure over the west in December produced strong inversions
National Wildland Significant Fire Potential Outlook
 National Wildland Significant Fire Potential Outlook National Interagency Fire Center Predictive Services Issued: April 1, 2008 Next Issue: May 1, 2008 Wildland Fire Outlook April 2008 through July 2008
The Colorado Drought of 2002 in Perspective
 The Colorado Drought of 2002 in Perspective Colorado Climate Center Nolan Doesken and Roger Pielke, Sr. Prepared by Tara Green and Odie Bliss http://climate.atmos.colostate.edu Known Characteristics of
U.S. Outlook For October and Winter Thursday, September 19, 2013
 About This report coincides with today s release of the monthly temperature and precipitation outlooks for the U.S. from the Climate Prediction Center (CPC). U.S. CPC October and Winter Outlook The CPC
Minnesota s Climatic Conditions, Outlook, and Impacts on Agriculture. Today. 1. The weather and climate of 2017 to date
 Minnesota s Climatic Conditions, Outlook, and Impacts on Agriculture Kenny Blumenfeld, State Climatology Office Crop Insurance Conference, Sep 13, 2017 Today 1. The weather and climate of 2017 to date
January 2008 Climate Summary
 Joseph Mays (765) 494-6574 Feb 5, 2008 http://www.iclimate.org Summary January 2008 Climate Summary January was a mix bag of conditions, with an oscillatory pattern developing. We experienced phases of
The hydrologic service area (HSA) for this office covers Central Kentucky and South Central Indiana.
 for this office covers Central Kentucky and South Central Indiana.") MONTH YEAR January 2011 February 15, 2011 X An X inside this box indicates that no flooding occurred within this hydrologic service area. January 2011 was drier than normal in all locations in the area.
MONTH YEAR January 2011 February 15, 2011 X An X inside this box indicates that no flooding occurred within this hydrologic service area. January 2011 was drier than normal in all locations in the area.
Weather and Climate Summary and Forecast August 2018 Report
 Weather and Climate Summary and Forecast August 2018 Report Gregory V. Jones Linfield College August 5, 2018 Summary: July 2018 will likely go down as one of the top five warmest July s on record for many
Precipitation. Standardized Precipitation Index. NIDIS Intermountain West Drought Early Warning System September 5, 2017
 9/6/2017 NIDIS Drought and Water Assessment NIDIS Intermountain West Drought Early Warning System September 5, 2017 Precipitation The images above use daily precipitation statistics from NWS COOP, CoCoRaHS,
Weather and Climate Summary and Forecast February 2018 Report
 Weather and Climate Summary and Forecast February 2018 Report Gregory V. Jones Linfield College February 5, 2018 Summary: For the majority of the month of January the persistent ridge of high pressure
Rainfall Observations in the Loxahatchee River Watershed
 Rainfall Observations in the Loxahatchee River Watershed Richard C. Dent Loxahatchee River District September 1997 Introduction Rain is a common occurrence in south Florida, yet its presence or absence
UNITED STATES AND SOUTH AMERICA OUTLOOK (FULL REPORT) Wednesday, April 18, 2018
 Wednesday, April 18, 2018") T-storm Weather Summary Coolness continues over the next week in much of the central U.S., most likely producing the coldest April since 1907 in the Corn Belt, but followed by seasonable to mild weather
T-storm Weather Summary Coolness continues over the next week in much of the central U.S., most likely producing the coldest April since 1907 in the Corn Belt, but followed by seasonable to mild weather
Weather and Climate Summary and Forecast Winter
 Weather and Climate Summary and Forecast Winter 2016-17 Gregory V. Jones Southern Oregon University February 7, 2017 What a difference from last year at this time. Temperatures in January and February
Climate Change Impact on Air Temperature, Daily Temperature Range, Growing Degree Days, and Spring and Fall Frost Dates In Nebraska
 EXTENSION Know how. Know now. Climate Change Impact on Air Temperature, Daily Temperature Range, Growing Degree Days, and Spring and Fall Frost Dates In Nebraska EC715 Kari E. Skaggs, Research Associate
The Climate of Payne County
 The Climate of Payne County Payne County is part of the Central Great Plains in the west, encompassing some of the best agricultural land in Oklahoma. Payne County is also part of the Crosstimbers in the
Above normal temperatures and precipitation continue across the HSA
 NWS Form E-5 (PRES. BY NWS Instruction 10-924) MONTHLY REPORT OF HYDROLOGIC CONDITIONS HYDROLOGIC SERVICE AREA (HSA) MONTH YEAR TO: Hydrologic Information Center, W/OS31 NOAA s National Weather Service
Severe Winter Weather in
 Transactions of the Illinois State Academy of Science received 4/19/10 (2010), Volume 103, #3&4, pp. 131-140 accepted 9/6/10 Severe Winter Weather in 2009-2010 Stanley A. Changnon Changnon Climatologist,
Weather and Climate of the Rogue Valley By Gregory V. Jones, Ph.D., Southern Oregon University
 Weather and Climate of the Rogue Valley By Gregory V. Jones, Ph.D., Southern Oregon University The Rogue Valley region is one of many intermountain valley areas along the west coast of the United States.
Impacts of the April 2013 Mean trough over central North America
 Impacts of the April 2013 Mean trough over central North America By Richard H. Grumm National Weather Service State College, PA Abstract: The mean 500 hpa flow over North America featured a trough over
SOUTHERN CLIMATE MONITOR
 SOUTHERN CLIMATE MONITOR MARCH 2011 VOLUME 1, ISSUE 3 IN THIS ISSUE: Page 2 to 4 Severe Thunderstorm Climatology in the SCIPP Region Page 4 Drought Update Page 5 Southern U.S. Precipitation Summary for
The Weather Wire. Contents: Summer 2018 Outlook. Summer 2018 Outlook Drought Monitor May Summary/Statistics June Preview Rainfall Totals
 The Weather Wire June 2018 Volume 25 Number 6 Contents: Summer 2018 Outlook Drought Monitor May Summary/Statistics June Preview Rainfall Totals Summer 2018 Outlook June 1 st marked the first day of meteorological
2015: A YEAR IN REVIEW F.S. ANSLOW
 2015: A YEAR IN REVIEW F.S. ANSLOW 1 INTRODUCTION Recently, three of the major centres for global climate monitoring determined with high confidence that 2015 was the warmest year on record, globally.
Colorado s 2003 Moisture Outlook
 Colorado s 2003 Moisture Outlook Nolan Doesken and Roger Pielke, Sr. Colorado Climate Center Prepared by Tara Green and Odie Bliss http://climate.atmos.colostate.edu How we got into this drought! Fort
Drought History. for Southeast Oklahoma. Prepared by the South Central Climate Science Center in Norman, Oklahoma
 Drought History for Southeast Oklahoma Prepared by the South Central Climate Science Center in Norman, Oklahoma May 28, 2013 http://southcentralclimate.org/ info@southcentralclimate.org (This page left
Presentation Overview. Southwestern Climate: Past, present and future. Global Energy Balance. What is climate?
 Southwestern Climate: Past, present and future Mike Crimmins Climate Science Extension Specialist Dept. of Soil, Water, & Env. Science & Arizona Cooperative Extension The University of Arizona Presentation
The Pennsylvania Observer
 The Pennsylvania Observer April 2, 2010 March 2010 Pennsylvania Weather Recap Prepared by: Katelyn Johnson March did come in as a lion cub this year. The 1 st proved to be a calm day; however most of Pennsylvania
NIDIS Intermountain West Drought Early Warning System September 4, 2018
 NIDIS Drought and Water Assessment NIDIS Intermountain West Drought Early Warning System September 4, 2018 Precipitation The images above use daily precipitation statistics from NWS COOP, CoCoRaHS, and
Weather and Climate Summary and Forecast Fall/Winter 2016
 Weather and Climate Summary and Forecast Fall/Winter 2016 Gregory V. Jones Southern Oregon University November 5, 2016 After a year where we were seemingly off by a month in terms of temperatures (March
UNITED STATES AND SOUTH AMERICA OUTLOOK (FULL REPORT) Thursday, December 28, 2017
 Thursday, December 28, 2017") T-storm Weather Summary Despite scattered t-storms Sat.-Sun. in central and northern areas in Argentina, more will likely be needed especially in sunflower areas of the southwest. Some t-storms likely
T-storm Weather Summary Despite scattered t-storms Sat.-Sun. in central and northern areas in Argentina, more will likely be needed especially in sunflower areas of the southwest. Some t-storms likely
PH YSIC A L PROPERT IE S TERC.UCDAVIS.EDU
 PH YSIC A L PROPERT IE S 8 Lake surface level Daily since 1900 Lake surface level varies throughout the year. Lake level rises due to high stream inflow, groundwater inflow and precipitation directly onto
Weather and Climate Summary and Forecast Summer into Harvest 2016
 Weather and Climate Summary and Forecast Summer into Harvest 2016 Gregory V. Jones Southern Oregon University September 3, 2016 With school and football season starting a hint of fall is right on time
The Climate of Seminole County
 The Climate of Seminole County Seminole County is part of the Crosstimbers. This region is a transition region from the Central Great Plains to the more irregular terrain of southeastern Oklahoma. Average
2003 Moisture Outlook
 2003 Moisture Outlook Nolan Doesken and Roger Pielke, Sr. Colorado Climate Center Prepared by Tara Green and Odie Bliss http://climate.atmos.colostate.edu Through 1999 Through 1999 Fort Collins Total Water
Weather and Climate Summary and Forecast November 2017 Report
 Weather and Climate Summary and Forecast November 2017 Report Gregory V. Jones Linfield College November 7, 2017 Summary: October was relatively cool and wet north, while warm and very dry south. Dry conditions
The Climate of Texas County
 The Climate of Texas County Texas County is part of the Western High Plains in the north and west and the Southwestern Tablelands in the east. The Western High Plains are characterized by abundant cropland
NWS FORM E-5 U.S. DEPARTMENT OF COMMERCE I HYDRO SERVICE AREA NOAA, NATIONAL WEATHER SERVICE I Indianapolis, IN MONTHLY REPORT
 NWS FORM E-5 U.S. DEPARTMENT OF COMMERCE I HYDRO SERVICE AREA NOAA, NATIONAL WEATHER SERVICE I Indianapolis, IN. 1-------------------- MONTHLY REPORT OF RIVER AND FLOOD CONDITIONSI REPORT FOR I November
The Climate of Marshall County
 The Climate of Marshall County Marshall County is part of the Crosstimbers. This region is a transition region from the Central Great Plains to the more irregular terrain of southeastern Oklahoma. Average
Weather and Climate Risks and Effects on Agriculture
 Weather and Climate Risks and Effects on Agriculture Dr. Eric Snodgrass Official Journal of the Fluid Fertilizer Foundation Vol. 26, No. 2, Issue #100 DOWNLOAD Summary: So, what do we need to watch for?
NIDIS Intermountain West Drought Early Warning System April 18, 2017
 1 of 11 4/18/2017 3:42 PM Precipitation NIDIS Intermountain West Drought Early Warning System April 18, 2017 The images above use daily precipitation statistics from NWS COOP, CoCoRaHS, and CoAgMet stations.
The Pennsylvania Observer
 The Pennsylvania Observer October 1, 2015 September 2015 - Pennsylvania Weather Recap By: Quinn Lease The month of September will be remembered for its above normal temperatures and dry conditions that
UNITED STATES AND SOUTH AMERICA WEATHER ROUNDUP Sunday, December 17, 2017
 T-storm Weather Summary Extreme heat was followed by heavy rain in some key areas of Argentina yesterday. T-storms affect much of the driest Argentina, southern Brazil, and Paraguay through 7 to 10 days,
Weather and Climate Summary and Forecast December 2017 Report
 Weather and Climate Summary and Forecast December 2017 Report Gregory V. Jones Linfield College December 5, 2017 Summary: November was relatively cool and wet from central California throughout most of
Weather and Climate Summary and Forecast Winter
 Weather and Climate Summary and Forecast Winter 2016-17 Gregory V. Jones Southern Oregon University December 5, 2016 Well after an October that felt more like November, we just finished a November that
The Climate of Kiowa County
 The Climate of Kiowa County Kiowa County is part of the Central Great Plains, encompassing some of the best agricultural land in Oklahoma. Average annual precipitation ranges from about 24 inches in northwestern
Highlights of the 2006 Water Year in Colorado
 Highlights of the 2006 Water Year in Colorado Nolan Doesken, State Climatologist Atmospheric Science Department Colorado State University http://ccc.atmos.colostate.edu Presented to 61 st Annual Meeting
NIDIS Intermountain West Drought Early Warning System October 30, 2018
 10/30/2018 NIDIS Drought and Water Assessment NIDIS Intermountain West Drought Early Warning System October 30, 2018 Precipitation The images above use daily precipitation statistics from NWS COOP, CoCoRaHS,
The Climate of Murray County
 The Climate of Murray County Murray County is part of the Crosstimbers. This region is a transition between prairies and the mountains of southeastern Oklahoma. Average annual precipitation ranges from
Champaign-Urbana 2000 Annual Weather Summary
 Champaign-Urbana 2000 Annual Weather Summary ILLINOIS STATE WATER SURVEY 2204 Griffith Dr. Champaign, IL 61820 wxobsrvr@sws.uiuc.edu Maria Peters, Weather Observer January: January started on a mild note,
Weather and Climate Summary and Forecast March 2018 Report
 Weather and Climate Summary and Forecast March 2018 Report Gregory V. Jones Linfield College March 7, 2018 Summary: The ridge pattern that brought drier and warmer conditions from December through most
November 2018 Weather Summary West Central Research and Outreach Center Morris, MN
 November 2018 Weather Summary Lower than normal temperatures occurred for the second month. The mean temperature for November was 22.7 F, which is 7.2 F below the average of 29.9 F (1886-2017). This November
Weather and Climate Summary and Forecast Summer 2016
 Weather and Climate Summary and Forecast Summer 2016 Gregory V. Jones Southern Oregon University August 5, 2016 The month of July saw the continued flip, flop of the western US temperatures. It was warm
PHYSICAL PROPERTIES TAHOE.UCDAVIS.EDU 8
 PHYSICAL PROPERTIES 8 Lake surface level Daily since 1900 Lake surface level varies throughout the year. Lake level rises due to high stream inflow, groundwater inflow, and precipitation directly onto
NIDIS Intermountain West Regional Drought Early Warning System February 7, 2017
 NIDIS Drought and Water Assessment NIDIS Intermountain West Regional Drought Early Warning System February 7, 2017 Precipitation The images above use daily precipitation statistics from NWS COOP, CoCoRaHS,
NIDIS Intermountain West Drought Early Warning System November 21, 2017
 NIDIS Drought and Water Assessment NIDIS Intermountain West Drought Early Warning System November 21, 2017 Precipitation The images above use daily precipitation statistics from NWS COOP, CoCoRaHS, and
Webinar and Weekly Summary February 15th, 2011
 Webinar and Weekly Summary February 15th, 2011 -Assessment of current water conditions - Precipitation Forecast - Recommendations for Drought Monitor Upper Colorado Normal Precipitation Upper Colorado
Climate Variability and El Niño
 Climate Variability and El Niño David F. Zierden Florida State Climatologist Center for Ocean Atmospheric Prediction Studies The Florida State University UF IFAS Extenstion IST January 17, 2017 The El
The Colorado Drought : 2003: A Growing Concern. Roger Pielke, Sr. Colorado Climate Center.
 The Colorado Drought 2001-2003: 2003: A Growing Concern Roger Pielke, Sr. Colorado Climate Center Prepared by Tara Green and Odie Bliss http://climate.atmos.colostate.edu 2 2002 Drought History in Colorado
Variability of Reference Evapotranspiration Across Nebraska
 Know how. Know now. EC733 Variability of Reference Evapotranspiration Across Nebraska Suat Irmak, Extension Soil and Water Resources and Irrigation Specialist Kari E. Skaggs, Research Associate, Biological
The Pennsylvania Observer
 The Pennsylvania Observer January 5, 2009 December 2008 Pennsylvania Weather Recap The final month of 2008 was much wetter than average and a bit colder than normal. In spite of this combination, most
1. TEMPORAL CHANGES IN HEAVY RAINFALL FREQUENCIES IN ILLINOIS
 to users of heavy rainstorm climatology in the design and operation of water control structures. A summary and conclusions pertaining to various phases of the present study are included in Section 8. Point
The Climate of Grady County
 The Climate of Grady County Grady County is part of the Central Great Plains, encompassing some of the best agricultural land in Oklahoma. Average annual precipitation ranges from about 33 inches in northern
The Climate of Bryan County
 The Climate of Bryan County Bryan County is part of the Crosstimbers throughout most of the county. The extreme eastern portions of Bryan County are part of the Cypress Swamp and Forest. Average annual
NIDIS Intermountain West Drought Early Warning System August 8, 2017
 NIDIS Drought and Water Assessment 8/8/17, 4:43 PM NIDIS Intermountain West Drought Early Warning System August 8, 2017 Precipitation The images above use daily precipitation statistics from NWS COOP,
January 2011 Calendar Year Runoff Forecast
 January 2011 Calendar Year Runoff Forecast 2010 Runoff Year Calendar Year 2010 was the third highest year of runoff in the Missouri River Basin above Sioux City with 38.8 MAF, behind 1978 and 1997 which
NIDIS Drought and Water Assessment
 NIDIS Drought and Water Assessment PRECIPITATION The images above use daily precipitation statistics from NWS COOP, CoCoRaHS, and CoAgMet stations. From top to bottom, and left to right: most recent 7-days