CLIMATOLOGICAL REPORT 2002
|
|
|
- Kevin Hodge
- 5 years ago
- Views:
Transcription
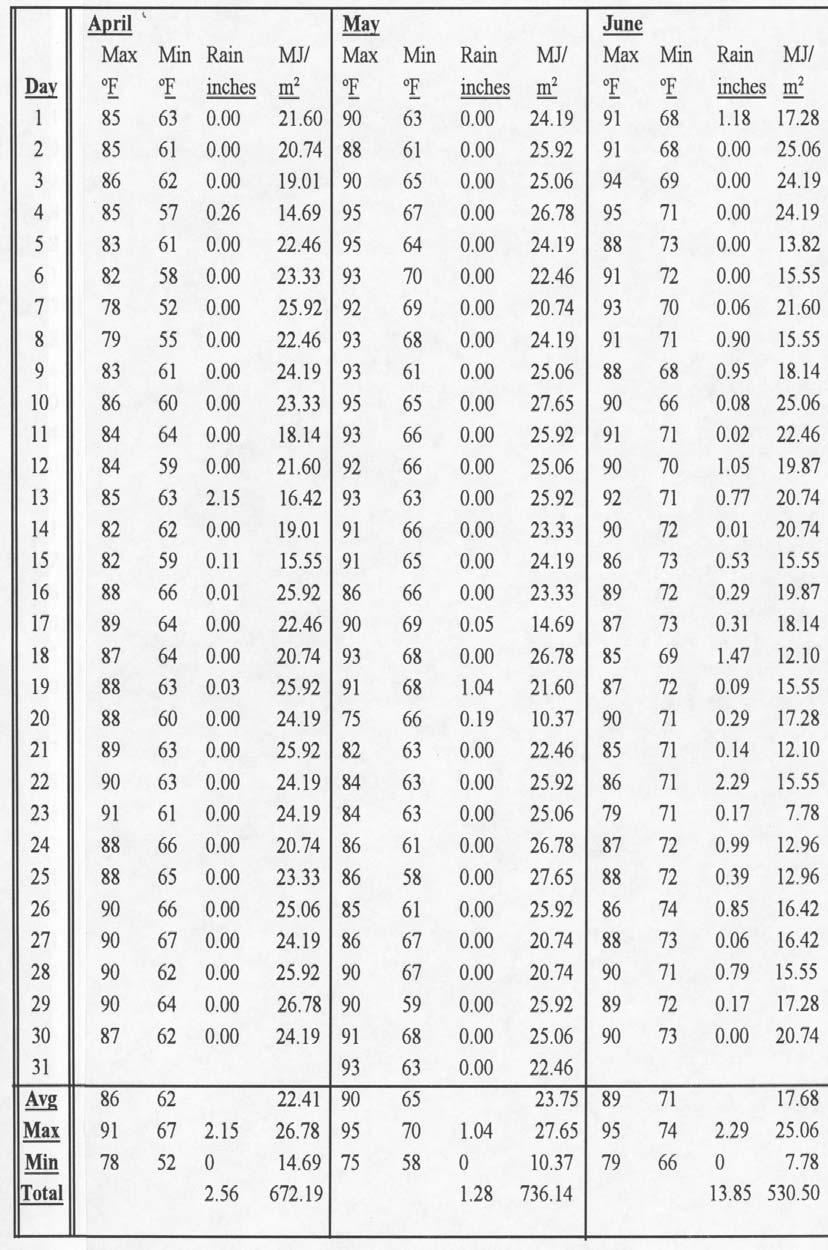
1 Range Cattle Research and Education Center Research Report RC February 2003 CLIMATOLOGICAL REPORT 2002 Range Cattle Research and Education Center R. S. Kalmbacher Professor, IFAS, Range Cattle Research and Education Center, Ona, Florida. Weather conditions strongly influence agricultural operations from planting through harvesting. Knowledge of annual rainfall and temperature cycles along with their extremes help producers determine optimum times to prepare and plant seedbeds, fertilize pastures, apply herbicides, control water, and to supplement cattle on pasture or range. Weather conditions influence germination, forage growth, palatability, and nutritive value. A knowledge of weather cycles and extremes is helpful to a successful cattle operation. This research report presents a summary of rainfall, air temperature, evapotranspiration, and solar radiation for 2002 obtained at the Range Cattle Research and Education Center (REC) Ona, Florida. The center is located 82 o 55' W and 27 o 26' N in south central Florida approximately 45 miles (72 km) east of the Gulf of Mexico and 100 miles (160 km) west of the Atlantic Ocean. Weather observations were collected with a Weather Watch 2000 (Campbell Scientific, Inc). Accuracy of rainfall as measured by the Weather Watch 2000 was checked by comparing with rainfall measured by a US Weather Service standard gauge. Rainfall: Annual rainfall for 2002 was inches, which was inches (29%) greater than the 61-year average of inches (standard deviation inches) (Table 1). The driest year had been 2000 when inches were measured, and the year with the greatest rainfall was 1959 when inches were recorded. Table 1. Summary of rainfall by months. Range Cattle REC, to Maximum Minimum 61-yr Total Diference
2 month month Average from 60-yr average inches* January February March April May June July August September October November December Year total *Inches x 2.54 = cm.

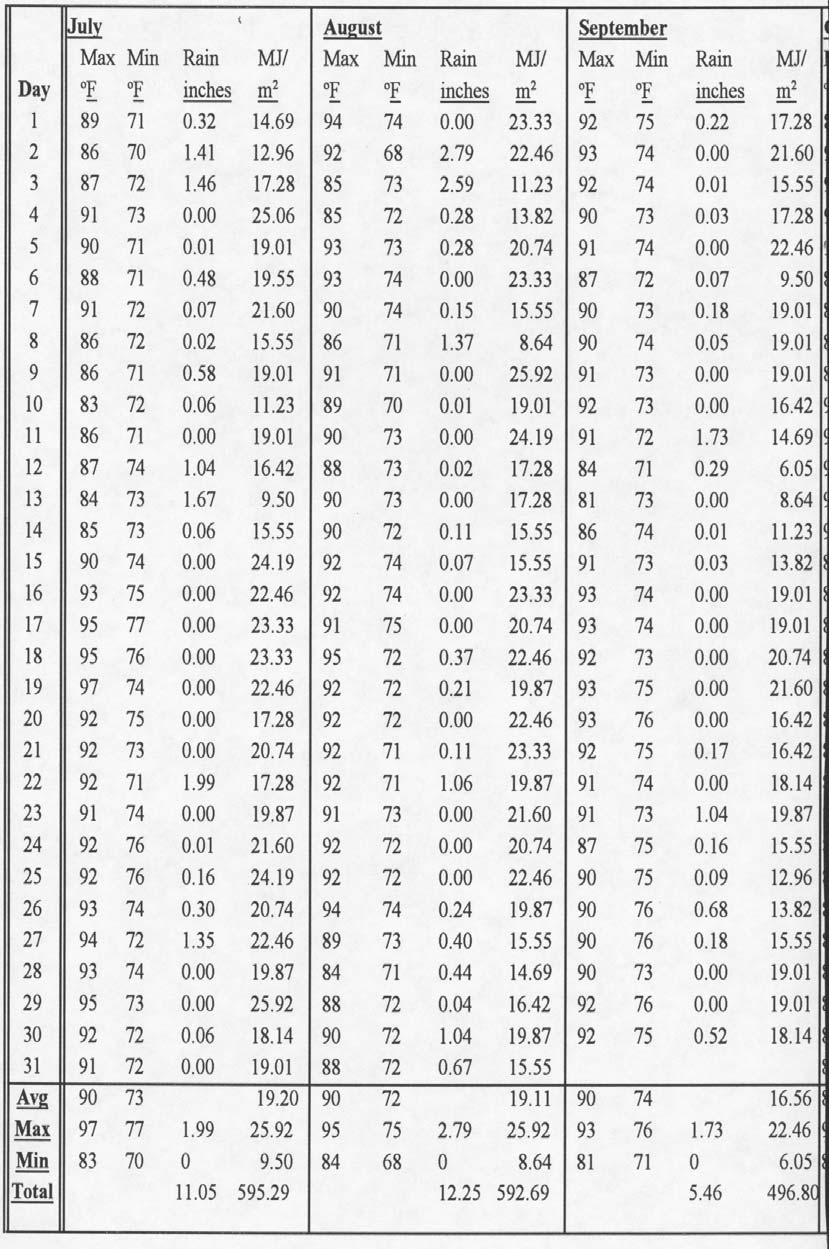
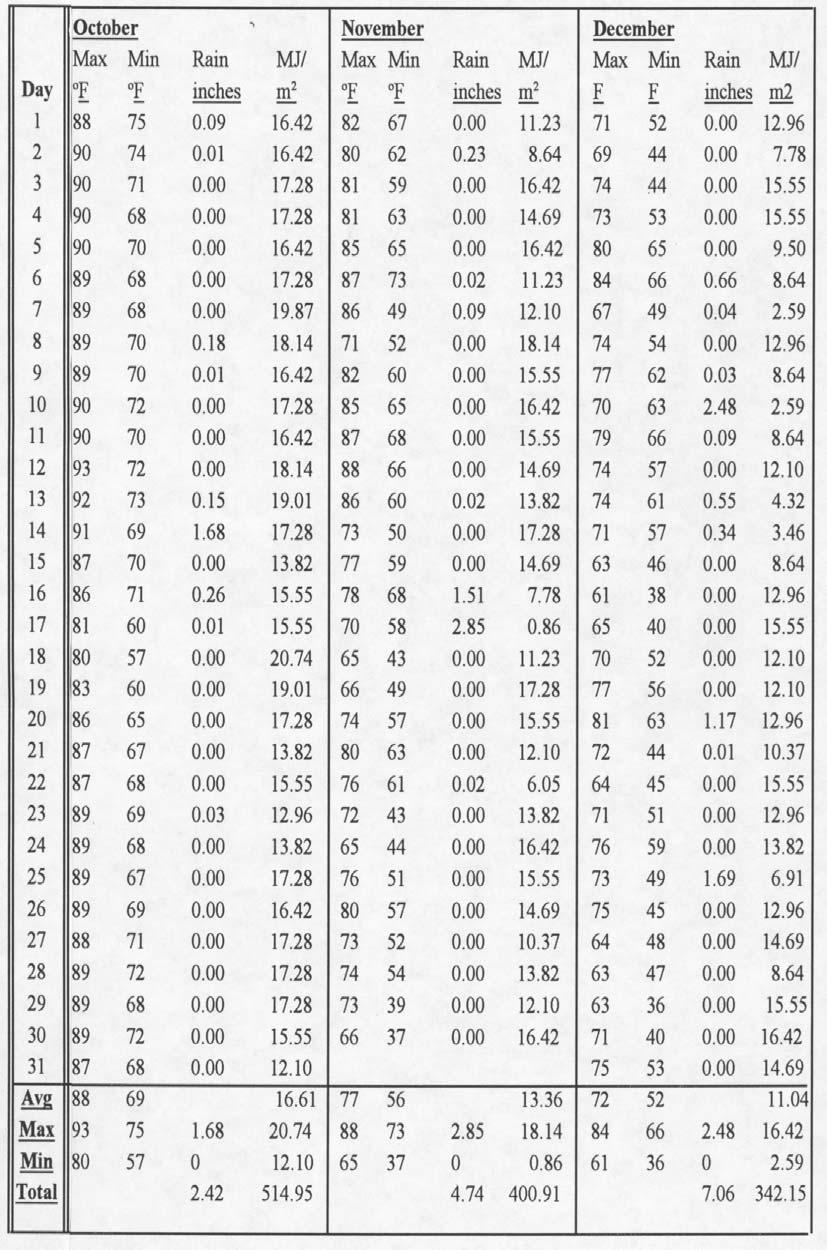
3 Table 2. Weather at Range Cattle REC, (Following four pages)
4
5
6
. The single greatest daily rain event was on 17 November when 2.")
7 Figure 1. Monthly 2002 rainfall at the Range Cattle REC compared to the 61-year mean rainfall at Range Cattle REC. There were 28 occurrences during 2002 when daily rain equaled or exceeded 1 inch and seven events that exceeded 2 inches (Table 2). The single greatest daily rain event was on 17 November when 2.85 inches were recorded. This is noteworthy because November is historically the month with the least rainfall at the Range Cattle REC. Eleven (39%) of the > 1 inch events occurred outside of the June to September rainy season. Above average rain in June to August and November to December resulted in typical flooding of pastures at Ona (Fig.1). Evapo-transpiration Rainfall exceeded evapo-transpiration in 7 months during 2002 (Figure 2). Only in March through May, the typical dry season, did evapo-transpiration exceed rainfall. For the year, rainfall exceeded evapo-transpiration by inches. Historically, pan evaporation and evapo-transpiration have exceed rainfall at the Range Cattle REC.
.")
8 Figure 2. Monthly rainfall compared with evapo-transpiration during Temperature: There were four and six days when daily low-shelter and daily low ground-temperatures, respectively, were at or below 32 F (Table 2). The extreme low temperature for 2002 occurred on 9 January when shelter and ground temperature reached 28 and 25 F, respectively. Scattered frost occurs when ground temperature reaches 34 F. Based on this observation, there were nine incidences of frost (data not shown). In spite of a few cold days, only November had a mean-montly low shelter-temperature near the 59-year mean for that month (Table 3). Mean minimum shelter shelter temperatures for all other months in 2002 exceeded the respective 59-year mean. Overall, mean temperature for 2002 was 2 F higher than the 59-year mean. Table 3. Summary of minimum temperature ( F)* by months, Range Cattle REC, Shelter Temperature Ground Temperature Avg. Avg. Extreme Year Extreme Avg. Extreme January

9 February March April May June July several August S eptember October several November December Avg * C = ( F - 32 ) x Solar Radiation: Daily solar radiation is shown in Table 2, and 2002 total monthly solar radiation can be seen graphically in Figure 3. For interpretation of solar radiation as it pertains to plant growth, 1 MJ results in about 14.3 lb/a of plant dry matter if soil water, temperature, and fertility are not limiting and vegetative cover is complete. Theoretically, enough solar radiation was received in May 2002 (746 MJ) to produce 10,670 lb/a of plant dry matter. Total solar radiation for 2002 was 6259 MJ.
10 Figure 3. Total monthly solar radiation for Freeze hazard: The fall and spring freeze hazards for the Range Cattle REC are shown in Figures 4 and 5, respectively. The fall freeze hazard shows the chance of experiencing the first attainment of a critical temperature before a selected date, while the spring freeze hazard shows the chance of the last attainment of a critical temperature before a critical date. Based on records from 1944 to 1991, these data will not predict what will occur in a given year, but what can be expected over a period of years. In an example using the spring freeze hazard, a frost susceptible crop (assuming 32 F) planted before the 1 st of February would stand a 50% chance of survival (Figure 4). A grower would probably lose five crops over 10 years by planting before the 1 st of February. Figure 4. Fall freeze hazard showing the chance of the first attainment of a given temperature before a selected date.
11 Figure 5. Spring freeze hazard showing the chance of the last attainment of a given temperature before a selected date. Acknowledgments: We gratefully acknowledge data collections by Shirley Searcy, as well as data preparation by Andrea Dunlap.
Range Cattle Research and Education Center January CLIMATOLOGICAL REPORT 2012 Range Cattle Research and Education Center.
 1 Range Cattle Research and Education Center January 2013 Research Report RC-2013-1 CLIMATOLOGICAL REPORT 2012 Range Cattle Research and Education Center Brent Sellers Weather conditions strongly influence
Range Cattle Research and Education Center January CLIMATOLOGICAL REPORT 2016 Range Cattle Research and Education Center.
 1 Range Cattle Research and Education Center January 2017 Research Report RC-2017-1 CLIMATOLOGICAL REPORT 2016 Range Cattle Research and Education Center Brent Sellers Weather conditions strongly influence
November 2018 Weather Summary West Central Research and Outreach Center Morris, MN
 November 2018 Weather Summary Lower than normal temperatures occurred for the second month. The mean temperature for November was 22.7 F, which is 7.2 F below the average of 29.9 F (1886-2017). This November
September 2018 Weather Summary West Central Research and Outreach Center Morris, MN
 September 2018 Weather Summary The mean temperature for September was 60.6 F, which is 1.5 F above the average of 59.1 F (1886-2017). The high temperature for the month was 94 F on September 16 th. The
Climate Change Impact on Air Temperature, Daily Temperature Range, Growing Degree Days, and Spring and Fall Frost Dates In Nebraska
 EXTENSION Know how. Know now. Climate Change Impact on Air Temperature, Daily Temperature Range, Growing Degree Days, and Spring and Fall Frost Dates In Nebraska EC715 Kari E. Skaggs, Research Associate
The Climate of Payne County
 The Climate of Payne County Payne County is part of the Central Great Plains in the west, encompassing some of the best agricultural land in Oklahoma. Payne County is also part of the Crosstimbers in the
The Climate of Marshall County
 The Climate of Marshall County Marshall County is part of the Crosstimbers. This region is a transition region from the Central Great Plains to the more irregular terrain of southeastern Oklahoma. Average
The Climate of Murray County
 The Climate of Murray County Murray County is part of the Crosstimbers. This region is a transition between prairies and the mountains of southeastern Oklahoma. Average annual precipitation ranges from
The Climate of Texas County
 The Climate of Texas County Texas County is part of the Western High Plains in the north and west and the Southwestern Tablelands in the east. The Western High Plains are characterized by abundant cropland
WHEN CAN YOU SEED FALLOW GROUND IN THE FALL? AN HISTORICAL PERSPECTIVE ON FALL RAIN
 WHEN CAN YOU SEED FALLOW GROUND IN THE FALL? AN HISTORICAL PERSPECTIVE ON FALL RAIN Steve Petrie and Karl Rhinhart Abstract Seeding at the optimum time is one key to producing the greatest yield of any
Current Climate Trends and Implications
 Current Climate Trends and Implications Dr. Mark Seeley Professor emeritus Department of Soil, Water, and Climate University of Minnesota St Paul, MN 55108 Crop Insurance Conference September 12, 2018
Chiang Rai Province CC Threat overview AAS1109 Mekong ARCC
 Chiang Rai Province CC Threat overview AAS1109 Mekong ARCC This threat overview relies on projections of future climate change in the Mekong Basin for the period 2045-2069 compared to a baseline of 1980-2005.
Meteorology. Circle the letter that corresponds to the correct answer
 Chapter 3 Worksheet 1 Meteorology Name: Circle the letter that corresponds to the correct answer 1) If the maximum temperature for a particular day is 26 C and the minimum temperature is 14 C, the daily
The Climate of Kiowa County
 The Climate of Kiowa County Kiowa County is part of the Central Great Plains, encompassing some of the best agricultural land in Oklahoma. Average annual precipitation ranges from about 24 inches in northwestern
Champaign-Urbana 2000 Annual Weather Summary
 Champaign-Urbana 2000 Annual Weather Summary ILLINOIS STATE WATER SURVEY 2204 Griffith Dr. Champaign, IL 61820 wxobsrvr@sws.uiuc.edu Maria Peters, Weather Observer January: January started on a mild note,
The Climate of Bryan County
 The Climate of Bryan County Bryan County is part of the Crosstimbers throughout most of the county. The extreme eastern portions of Bryan County are part of the Cypress Swamp and Forest. Average annual
The Climate of Haskell County
 The Climate of Haskell County Haskell County is part of the Hardwood Forest. The Hardwood Forest is characterized by its irregular landscape and the largest lake in Oklahoma, Lake Eufaula. Average annual
SEASONAL RAINFALL FORECAST FOR ZIMBABWE. 28 August 2017 THE ZIMBABWE NATIONAL CLIMATE OUTLOOK FORUM
 2017-18 SEASONAL RAINFALL FORECAST FOR ZIMBABWE METEOROLOGICAL SERVICES DEPARTMENT 28 August 2017 THE ZIMBABWE NATIONAL CLIMATE OUTLOOK FORUM Introduction The Meteorological Services Department of Zimbabwe
Jackson County 2013 Weather Data
 Jackson County 2013 Weather Data 61 Years of Weather Data Recorded at the UF/IFAS Marianna North Florida Research and Education Center Doug Mayo Jackson County Extension Director 1952-2008 Rainfall Data
The Climate of Seminole County
 The Climate of Seminole County Seminole County is part of the Crosstimbers. This region is a transition region from the Central Great Plains to the more irregular terrain of southeastern Oklahoma. Average
2012 Growing Season. Niagara Report. Wayne Heinen
 2012 Growing Season Niagara Report Wayne Heinen Overview The 2012 growing season was a phenomenal one for grapes. Vines entered bud break in good shape following a mild winter. The spring of 2012 was similar
but 2012 was dry Most farmers pulled in a crop
 After a winter that wasn t, conditions late in the year pointed to a return to normal snow and cold conditions Most farmers pulled in a crop but 2012 was dry b y M i k e Wr o b l e w s k i, w e a t h e
The Climate of Grady County
 The Climate of Grady County Grady County is part of the Central Great Plains, encompassing some of the best agricultural land in Oklahoma. Average annual precipitation ranges from about 33 inches in northern
The Climate of Pontotoc County
 The Climate of Pontotoc County Pontotoc County is part of the Crosstimbers. This region is a transition region from the Central Great Plains to the more irregular terrain of southeast Oklahoma. Average
Variability of Reference Evapotranspiration Across Nebraska
 Know how. Know now. EC733 Variability of Reference Evapotranspiration Across Nebraska Suat Irmak, Extension Soil and Water Resources and Irrigation Specialist Kari E. Skaggs, Research Associate, Biological
Table 1. August average temperatures and departures from normal ( F) for selected cities.
 for selected cities.") Climate Summary for Florida August 2016 Prepared by Lydia Stefanova and David Zierden Florida Climate Center, The Florida State University, Tallahassee, Florida Online at: http://climatecenter.fsu.edu/products-services/summaries
Climate Summary for Florida August 2016 Prepared by Lydia Stefanova and David Zierden Florida Climate Center, The Florida State University, Tallahassee, Florida Online at: http://climatecenter.fsu.edu/products-services/summaries
DROUGHT MONITORING BULLETIN
 DROUGHT MONITORING BULLETIN 24 th November 2014 Hot Spot Standardized Precipitation Index for time period from November 2013 to April 2014 was, due to the lack of precipitation for months, in major part
Champaign-Urbana 1999 Annual Weather Summary
 Champaign-Urbana 1999 Annual Weather Summary ILLINOIS STATE WATER SURVEY 2204 Griffith Dr. Champaign, IL 61820 wxobsrvr@sws.uiuc.edu Maria Peters, Weather Observer A major snowstorm kicked off the new
Local Ctimatotogical Data Summary White Hall, Illinois
 SWS Miscellaneous Publication 98-5 STATE OF ILLINOIS DEPARTMENT OF ENERGY AND NATURAL RESOURCES Local Ctimatotogical Data Summary White Hall, Illinois 1901-1990 by Audrey A. Bryan and Wayne Armstrong Illinois
Jackson County 2014 Weather Data
 Jackson County 2014 Weather Data 62 Years of Weather Data Recorded at the UF/IFAS Marianna North Florida Research and Education Center Doug Mayo Jackson County Extension Director 1952-2008 Rainfall Data
Champaign-Urbana 2001 Annual Weather Summary
 Champaign-Urbana 2001 Annual Weather Summary ILLINOIS STATE WATER SURVEY 2204 Griffith Dr. Champaign, IL 61820 wxobsrvr@sws.uiuc.edu Maria Peters, Weather Observer January: After a cold and snowy December,
Changing Hydrology under a Changing Climate for a Coastal Plain Watershed
 Changing Hydrology under a Changing Climate for a Coastal Plain Watershed David Bosch USDA-ARS, Tifton, GA Jeff Arnold ARS Temple, TX and Peter Allen Baylor University, TX SEWRU Objectives 1. Project changes
LOCAL CLIMATOLOGICAL DATA FOR FREEPORT ILLINOIS
 Climatological Summary: LOCAL CLIMATOLOGICAL DATA FOR FREEPORT ILLINOIS 1905-1990 Freeport (Stephenson County) has a temperate continental climate, dominated by maritime tropical air from the Gulf of Mexico
Weather Conditions during the 1992 Growing Season
 Weather Conditions during the 1992 Growing Season Item Type text; Article Authors Brown, P.; Russell, B. Publisher College of Agriculture, University of Arizona (Tucson, AZ) Journal Cotton: A College of
Monthly Long Range Weather Commentary Issued: May 15, 2014 Steven A. Root, CCM, President/CEO
 Monthly Long Range Weather Commentary Issued: May 15, 2014 Steven A. Root, CCM, President/CEO sroot@weatherbank.com APRIL 2014 REVIEW Climate Highlights The Month in Review The average temperature for
Using Temperature and Dew Point to Aid Forecasting Springtime Radiational Frost and/or Freezing Temperatures in the NWS La Crosse Service Area
 Using Temperature and Dew Point to Aid Forecasting Springtime Radiational Frost and/or Freezing Temperatures in the NWS La Crosse Service Area WFO La Crosse Climatology Series #21 The formation of radiational
Climate Outlook through 2100 South Florida Ecological Services Office Vero Beach, FL September 9, 2014
 Climate Outlook through 2100 South Florida Ecological Services Office Vero Beach, FL September 9, 2014 Short Term Drought Map: Short-term (
Climate of Columbus. Aaron Wilson. Byrd Polar & Climate Research Center State Climate Office of Ohio.
 Climate of Columbus Aaron Wilson Byrd Polar & Climate Research Center http://bpcrc.osu.edu/greenteam Overview Historical Climatology Climate Change & Impacts Projected Changes Summary 2 Historical Climatology
A summary of the weather year based on data from the Zumwalt weather station
 ZUMWALT PRAIRIE WEATHER 2016 A summary of the weather year based on data from the Zumwalt weather station Figure 1. An unusual summer storm on July 10, 2016 brought the second-largest precipitation day
Table of Contents. Page
 Eighteen Years (1990 2007) of Climatological Data on NMSU s Corona Range and Livestock Research Center Research Report 761 L. Allen Torell, Kirk C. McDaniel, Shad Cox, Suman Majumdar 1 Agricultural Experiment
An Online Platform for Sustainable Water Management for Ontario Sod Producers
 An Online Platform for Sustainable Water Management for Ontario Sod Producers 2014 Season Update Kyle McFadden January 30, 2015 Overview In 2014, 26 weather stations in four configurations were installed
Average Weather For Coeur d'alene, Idaho, USA
 Average Weather For Coeur d'alene, Idaho, USA Information courtesy of weatherspark.com Location This report describes the typical weather at the Coeur d'alene Air Terminal (Coeur d'alene, Idaho, United
Drought Characterization. Examination of Extreme Precipitation Events
 Drought Characterization Examination of Extreme Precipitation Events Extreme Precipitation Events During the Drought For the drought years (1999-2005) daily precipitation data was analyzed to find extreme
1999 Day Precip Comments 2000 Day Precip Comments 2000 Day Precip Comments July January
 1999 Day Precip Comments 2000 Day Precip Comments 2000 Day Precip Comments July January 11 1.00 22 0.60 0.00 11.15 12 0.25 23 1.55 0.00 18.15 15 0.40 24 0.10 August 6-11 fog hvy-lite 16 0.75 26 0.05 0.00
WHEN IS IT EVER GOING TO RAIN? Table of Average Annual Rainfall and Rainfall For Selected Arizona Cities
 WHEN IS IT EVER GOING TO RAIN? Table of Average Annual Rainfall and 2001-2002 Rainfall For Selected Arizona Cities Phoenix Tucson Flagstaff Avg. 2001-2002 Avg. 2001-2002 Avg. 2001-2002 October 0.7 0.0
January 25, Summary
 January 25, 2013 Summary Precipitation since the December 17, 2012, Drought Update has been slightly below average in parts of central and northern Illinois and above average in southern Illinois. Soil
CHAPTER-11 CLIMATE AND RAINFALL
 CHAPTER-11 CLIMATE AND RAINFALL 2.1 Climate Climate in a narrow sense is usually defined as the "average weather", or more rigorously, as the statistical description in terms of the mean and variability
February 10, Mr. Jeff Smith, Chairman Imperial Valley Water Authority E County Road 1000 N Easton, IL Dear Chairman Smith:
 February 1, 1 Mr. Jeff Smith, Chairman Imperial Valley Water Authority 8 E County Road 1 N Easton, IL Dear Chairman Smith: The Illinois State Water Survey (ISWS), under contract to the Imperial Valley
2008 Growing Season. Niagara Region
 28 Growing Season Niagara Region Weather INnovations Staff November 14, 28 Overview The start of the 28 growing season looked promising. After an extremely dry 27 growing season, soil moisture levels had
Analysis of meteorological measurements made over three rainy seasons in Sinazongwe District, Zambia.
 Analysis of meteorological measurements made over three rainy seasons in Sinazongwe District, Zambia. 1 Hiromitsu Kanno, 2 Hiroyuki Shimono, 3 Takeshi Sakurai, and 4 Taro Yamauchi 1 National Agricultural
Rainfall Observations in the Loxahatchee River Watershed
 Rainfall Observations in the Loxahatchee River Watershed Richard C. Dent Loxahatchee River District September 1997 Introduction Rain is a common occurrence in south Florida, yet its presence or absence
RAINFALL AVERAGES AND SELECTED EXTREMES FOR CENTRAL AND SOUTH FLORIDA. Thomas K. MacVicar
 TECHNICAL PUBLICATION #83-2 March 1983 RAINFALL AVERAGES AND SELECTED EXTREMES FOR CENTRAL AND SOUTH FLORIDA by Thomas K. MacVicar "This public document was promulgated at an annual cost of $136.74, or
REPORT ON SOWING PERIOD AND FLOODING RISKS IN DOUALA, CAMEROON. Cameroon Meteorological Department
 REPORT ON SOWING PERIOD AND FLOODING RISKS IN DOUALA, CAMEROON BY GERVAIS DIDIER YONTCHANG Cameroon Meteorological Department PROJECT WORK FOR PART FULFILMENT OF THE e-siac COURSE (STATISTICS IN APPLIED
Rainfall Distribution in Alabama,
 Progress Report Series No. 84 Agricultural Experiment Station AUBURN UNIVERSITY I, R r I r II It II F 51 1, Y r\ ~ r I rm n Is r ~ ~ ~ t I ~r rr October, 1962 E. V. Smith, Director Auburn, Alabama Rainfall
Geostatistical Analysis of Rainfall Temperature and Evaporation Data of Owerri for Ten Years
 Atmospheric and Climate Sciences, 2012, 2, 196-205 http://dx.doi.org/10.4236/acs.2012.22020 Published Online April 2012 (http://www.scirp.org/journal/acs) Geostatistical Analysis of Rainfall Temperature
2011 Year in Review TORNADOES
 2011 Year in Review The year 2011 had weather events that will be remembered for a long time. Two significant tornado outbreaks in April, widespread damage and power outages from Hurricane Irene in August
NOAA National Centers for Environmental Information State Summaries 149-FL. Observed and Projected Temperature Change
 19-FL FLORIDA Key Messages Under a higher emissions pathway, historically unprecedented warming is projected by the end of the 1st century. Rising temperatures will likely increase the intensity of naturally-occurring
Climate. Annual Temperature (Last 30 Years) January Temperature. July Temperature. Average Precipitation (Last 30 Years)
 January Temperature. July Temperature. Average Precipitation (Last 30 Years)") Climate Annual Temperature (Last 30 Years) Average Annual High Temp. (F)70, (C)21 Average Annual Low Temp. (F)43, (C)6 January Temperature Average January High Temp. (F)48, (C)9 Average January Low Temp.
Climate Annual Temperature (Last 30 Years) Average Annual High Temp. (F)70, (C)21 Average Annual Low Temp. (F)43, (C)6 January Temperature Average January High Temp. (F)48, (C)9 Average January Low Temp.
Plant Water Stress Frequency and Periodicity in Western North Dakota
 Plant Water Stress Frequency and Periodicity in Western North Dakota Llewellyn L. Manske PhD, Sheri Schneider, John A. Urban, and Jeffery J. Kubik Report DREC 10-1077 Range Research Program Staff North
Above normal temperatures and precipitation continue across the HSA
 NWS Form E-5 (PRES. BY NWS Instruction 10-924) MONTHLY REPORT OF HYDROLOGIC CONDITIONS HYDROLOGIC SERVICE AREA (HSA) MONTH YEAR TO: Hydrologic Information Center, W/OS31 NOAA s National Weather Service
CAMARGO RANCH, llc. CRAIG BUFORD BufordResources.com
 CAMARGO RANCH, llc 2897 +/- acre Wheat & Cattle Farm Mangum, greer county, oklahoma CRAIG BUFORD 405-833-9499 BufordResources.com 4101 Perimeter Center Dr., Suite 107 Oklahoma City, OK 73112 405.833.9499
Champaign-Urbana 1998 Annual Weather Summary
 Champaign-Urbana 1998 Annual Weather Summary ILLINOIS STATE WATER SURVEY Audrey Bryan, Weather Observer 2204 Griffith Dr. Champaign, IL 61820 wxobsrvr@sparc.sws.uiuc.edu The development of the El Nìno
The Pennsylvania Observer
 The Pennsylvania Observer April 2, 2010 March 2010 Pennsylvania Weather Recap Prepared by: Katelyn Johnson March did come in as a lion cub this year. The 1 st proved to be a calm day; however most of Pennsylvania
Colorado State University, Fort Collins, CO Weather Station Monthly Summary Report
 Colorado State University, Fort Collins, CO Weather Station Monthly Summary Report Month: December Year: 2017 Temperature: Mean T max was 47.2 F which is 4.4 above the 1981-2010 normal for the month. This
Fire Weather Drivers, Seasonal Outlook and Climate Change. Steven McGibbony, Severe Weather Manager Victoria Region Friday 9 October 2015
 Fire Weather Drivers, Seasonal Outlook and Climate Change Steven McGibbony, Severe Weather Manager Victoria Region Friday 9 October 2015 Outline Weather and Fire Risk Environmental conditions leading to
DEPARTMENT OF EARTH & CLIMATE SCIENCES Name SAN FRANCISCO STATE UNIVERSITY Nov 29, ERTH 360 Test #2 200 pts
 DEPARTMENT OF EARTH & CLIMATE SCIENCES Name SAN FRANCISCO STATE UNIVERSITY Nov 29, 2018 ERTH 360 Test #2 200 pts Each question is worth 4 points. Indicate your BEST CHOICE for each question on the Scantron
Impacts of Climate on the Corn Belt
 Impacts of Climate on the Corn Belt Great Lakes Crop Summit 2015 2015 Evelyn Browning Garriss Conclusions Climate change is not linear. It ebbs and flows. Recent polar volcano eruptions created a cool
Jackson County 2019 Weather Data 68 Years of Weather Data Recorded at the UF/IFAS Marianna North Florida Research and Education Center
 Jackson County 2019 Weather Data 68 Years of Weather Data Recorded at the UF/IFAS Marianna North Florida Research and Education Center Doug Mayo Jackson County Extension Director 1952-2008 Rainfall Data
Monthly Long Range Weather Commentary Issued: February 15, 2015 Steven A. Root, CCM, President/CEO
 Monthly Long Range Weather Commentary Issued: February 15, 2015 Steven A. Root, CCM, President/CEO sroot@weatherbank.com JANUARY 2015 Climate Highlights The Month in Review During January, the average
Memo. I. Executive Summary. II. ALERT Data Source. III. General System-Wide Reporting Summary. Date: January 26, 2009 To: From: Subject:
 Memo Date: January 26, 2009 To: From: Subject: Kevin Stewart Markus Ritsch 2010 Annual Legacy ALERT Data Analysis Summary Report I. Executive Summary The Urban Drainage and Flood Control District (District)
Monthly Long Range Weather Commentary Issued: APRIL 1, 2015 Steven A. Root, CCM, President/CEO
 Monthly Long Range Weather Commentary Issued: APRIL 1, 2015 Steven A. Root, CCM, President/CEO sroot@weatherbank.com FEBRUARY 2015 Climate Highlights The Month in Review The February contiguous U.S. temperature
Probabilistic Decision-Making and Weather Assessment
 5 Student Packet Probabilistic Decision-Making and Weather Assessment Use contents of this packet as you feel appropriate. You are free to copy and use any of the material in this lesson plan. Packet Contents
Climate Outlook through 2100 South Florida Ecological Services Office Vero Beach, FL January 13, 2015
 Climate Outlook through 2100 South Florida Ecological Services Office Vero Beach, FL January 13, 2015 Short Term Drought Map: Short-term (
Illinois Drought Update, December 1, 2005 DROUGHT RESPONSE TASK FORCE Illinois State Water Survey, Department of Natural Resources
 Illinois Drought Update, December 1, 2005 DROUGHT RESPONSE TASK FORCE Illinois State Water Survey, Department of Natural Resources For more drought information please go to http://www.sws.uiuc.edu/. SUMMARY.
MAURITIUS CANE INDUSTRY AUTHORITY MAURITIUS SUGARCANE INDUSTRY RESEARCH INSTITUTE
 MAURITIUS CANE INDUSTRY AUTHORITY MAURITIUS SUGARCANE INDUSTRY RESEARCH INSTITUTE Ref A 1/215 February 216 SUGAR CANE CROP 216 Status: End December 215 1. CLIMATE 1.1 Rainfall (Tables 1a and 1b, Figure
Jackson County 2018 Weather Data 67 Years of Weather Data Recorded at the UF/IFAS Marianna North Florida Research and Education Center
 Jackson County 2018 Weather Data 67 Years of Weather Data Recorded at the UF/IFAS Marianna North Florida Research and Education Center Doug Mayo Jackson County Extension Director 1952-2008 Rainfall Data
Monthly Long Range Weather Commentary Issued: SEPTEMBER 19, 2016 Steven A. Root, CCM, Chief Analytics Officer, Sr. VP,
 Monthly Long Range Weather Commentary Issued: SEPTEMBER 19, 2016 Steven A. Root, CCM, Chief Analytics Officer, Sr. VP, sroot@weatherbank.com SEPTEMBER 2016 Climate Highlights The Month in Review The contiguous
Vermont Soil Climate Analysis Network (SCAN) sites at Lye Brook and Mount Mansfield
 sites at Lye Brook and Mount Mansfield") Vermont Soil Climate Analysis Network (SCAN) sites at Lye Brook and Mount Mansfield 13 Years of Soil Temperature and Soil Moisture Data Collection September 2000 September 2013 Soil Climate Analysis Network
Vermont Soil Climate Analysis Network (SCAN) sites at Lye Brook and Mount Mansfield 13 Years of Soil Temperature and Soil Moisture Data Collection September 2000 September 2013 Soil Climate Analysis Network
Drought History. for the Edwards Plateau of Texas. Prepared by the South Central Climate Science Center in Norman, Oklahoma
 Drought History for the Edwards Plateau of Texas Prepared by the South Central Climate Science Center in Norman, Oklahoma May 28, 2013 http://southcentralclimate.org/ info@southcentralclimate.org (This
Analytical Report. Drought in the Horn of Africa February Executive summary. Geographical context. Likelihood of drought impact (LDI)
") Executive summary The current drought in the Horn of Africa is affecting especially Somalia, among other countries, in particular the central and southern regions, where most population is located. Overall,
Executive summary The current drought in the Horn of Africa is affecting especially Somalia, among other countries, in particular the central and southern regions, where most population is located. Overall,
South & South East Asian Region:
 Issued: 15 th December 2017 Valid Period: January June 2018 South & South East Asian Region: Indonesia Tobacco Regions 1 A] Current conditions: 1] El Niño-Southern Oscillation (ENSO) ENSO Alert System
Drought History. for Southeast Oklahoma. Prepared by the South Central Climate Science Center in Norman, Oklahoma
 Drought History for Southeast Oklahoma Prepared by the South Central Climate Science Center in Norman, Oklahoma May 28, 2013 http://southcentralclimate.org/ info@southcentralclimate.org (This page left
Weather Data for Citrus Irrigation Management 1
 HS950 Weather Data for Citrus Irrigation Management 1 Larry Parsons and Howard Beck 2 Weather is one of the most important factors that affects citrus growth and production. Citrus can be grown in a variety
Drought in Southeast Colorado
 Drought in Southeast Colorado Nolan Doesken and Roger Pielke, Sr. Colorado Climate Center Prepared by Tara Green and Odie Bliss http://climate.atmos.colostate.edu 1 Historical Perspective on Drought Tourism
Here s what a weak El Nino usually brings to the nation with temperatures:
 Time again for my annual Winter Weather Outlook. Here's just a small part of the items I considered this year and how I think they will play out with our winter of 2018-2019. El Nino / La Nina: When looking
Weekly Rainfall Analysis and Markov Chain Model Probability of Dry and Wet Weeks at Varanasi in Uttar Pradesh
 885 Environment & Ecology 32 (3) : 885 890, July September 2014 Website: environmentandecology.com ISSN 0970-0420 Weekly Rainfall Analysis and Markov Chain Model Probability of Dry and Wet Weeks at Varanasi
Presentation Overview. Southwestern Climate: Past, present and future. Global Energy Balance. What is climate?
 Southwestern Climate: Past, present and future Mike Crimmins Climate Science Extension Specialist Dept. of Soil, Water, & Env. Science & Arizona Cooperative Extension The University of Arizona Presentation
Analysis of Historical Pattern of Rainfall in the Western Region of Bangladesh
 24 25 April 214, Asian University for Women, Bangladesh Analysis of Historical Pattern of Rainfall in the Western Region of Bangladesh Md. Tanvir Alam 1*, Tanni Sarker 2 1,2 Department of Civil Engineering,
Monthly Long Range Weather Commentary Issued: NOVEMBER 16, 2015 Steven A. Root, CCM, Chief Analytics Officer, Sr. VP, sales
 Monthly Long Range Weather Commentary Issued: NOVEMBER 16, 2015 Steven A. Root, CCM, Chief Analytics Officer, Sr. VP, sales sroot@weatherbank.com OCTOBER 2015 Climate Highlights The Month in Review The
Rainfall is the major source of water for
 RESEARCH PAPER: Assessment of occurrence and frequency of drought using rainfall data in Coimbatore, India M. MANIKANDAN AND D.TAMILMANI Asian Journal of Environmental Science December, 2011 Vol. 6 Issue
NATIONAL WEATHER SERVICE
 January 2016 February 9, 2016 This was a dry month across the HSA despite one large and several smaller snowfalls. Most locations ended up 1-2 inches below normal for the month. The driest locations at
The agroclimatic resource change in Mongolia
 The agroclimatic resource change in Mongolia Azzaya D, Gantsetseg B, Munkhzul D Institute of Meteorology and Hydrology,Juulchny gudamj-5, Ulaanbaatar-46, Mongolia, 210646, meteoins@magicnet.mn, azzaya23@yahoo.com
Weather and Climate Summary and Forecast October 2017 Report
 Weather and Climate Summary and Forecast October 2017 Report Gregory V. Jones Linfield College October 4, 2017 Summary: Typical variability in September temperatures with the onset of fall conditions evident
Three main areas of work:
 Task 2: Climate Information 1 Task 2: Climate Information Three main areas of work: Collect historical and projected weather and climate data Conduct storm surge and wave modeling, sea-level rise (SLR)
Midwest/Great Plains Climate-Drought Outlook September 20, 2018
 Midwest/Great Plains Climate-Drought Outlook September 20, 2018 Brian Fuchs National Drought Mitigation Center University of Nebraska-Lincoln School of Natural Resources September 20, 2018 General Information
Variability of Crested Wheatgrass Production
 RANGELANDS 1(3), June 199 153 Variability of Crested Wheatgrass Production over 35 Years Lee A. Sharp, Ken Sanders, and Neil Rimbey In the fall of 195, the Burley Idaho District of the Bureau of Land Management,
The ph of Rain Water from the Botanic Gardens
 The ph of Rain Water from the Botanic Gardens By R. A. ROBINSON University of Malaya, Singapore THE HYDROGEN ion concentration of rain water is always very small, typical samples containing from 10. 5
Northwest Outlook October 2016
 Northwest Outlook October 2016 Rainfall Opportunities and Challenges Rainfall over the month of September presented some challenges for the fall harvest while other producers benefitted. Figure 1a shows
National Wildland Significant Fire Potential Outlook
 National Wildland Significant Fire Potential Outlook National Interagency Fire Center Predictive Services Issued: September, 2007 Wildland Fire Outlook September through December 2007 Significant fire
Research Note COMPUTER PROGRAM FOR ESTIMATING CROP EVAPOTRANSPIRATION IN PUERTO RICO 1,2. J. Agric. Univ. P.R. 89(1-2): (2005)
: (2005)") Research Note COMPUTER PROGRAM FOR ESTIMATING CROP EVAPOTRANSPIRATION IN PUERTO RICO 1,2 Eric W. Harmsen 3 and Antonio L. González-Pérez 4 J. Agric. Univ. P.R. 89(1-2):107-113 (2005) Estimates of crop
Research Note COMPUTER PROGRAM FOR ESTIMATING CROP EVAPOTRANSPIRATION IN PUERTO RICO 1,2 Eric W. Harmsen 3 and Antonio L. González-Pérez 4 J. Agric. Univ. P.R. 89(1-2):107-113 (2005) Estimates of crop