2006 Annual Tropical Cyclone Report U.S. Naval Maritime Forecast Center/ Joint Typhoon Warning Center Pearl Harbor, Hawaii
|
|
|
- Melanie Leonard
- 6 years ago
- Views:
Transcription
 as it approaches Wake Island,")
1 Annual Tropical Cyclone Report U.S. Naval Maritime Forecast Center/ Joint Typhoon Warning Center Pearl Harbor, Hawaii Composite MODIS true color image from the Aqua satellite of Super Typhoon C (Ioke) as it approaches Wake Island, taken on August,. Image courtesy of MODIS Rapid Response Team, NASA Goddard Space Flight Center. J. F. O'HARA Captain, United States Navy Commanding Officer ROBERT FALVEY Lieutenant Colonel, United States Air Force Director, Joint Typhoon Warning Center LT Aaron Lana, USN - Editor
2 EDITOR'S NOTE The ATCR has seen additional streamlining of the process due to manning issues from the previous years. Additional changes include introduction of the new Naval Maritime Forecast Center/Joint Typhoon Warning Center logo and a multitude of recoding of website to increase loading speed. Again this year, we are including links to NRL and FNMOC as the sources of imagery for the related systems. We have also removed the pdf versions due to the scaled back nature of the individual system pages. To use the ATCR, expanding menus indicated by plus (+) and minus (-) signs in the frame on the left side of the screen permit easy navigation. Simply click any (+) sign to open a menu another level. Feedback is much appreciated and needed to create a product that will remain valuable in future years. Please the editor at the following link. ATCR Editor LT A. D. Lana, USN Editor, ATCR
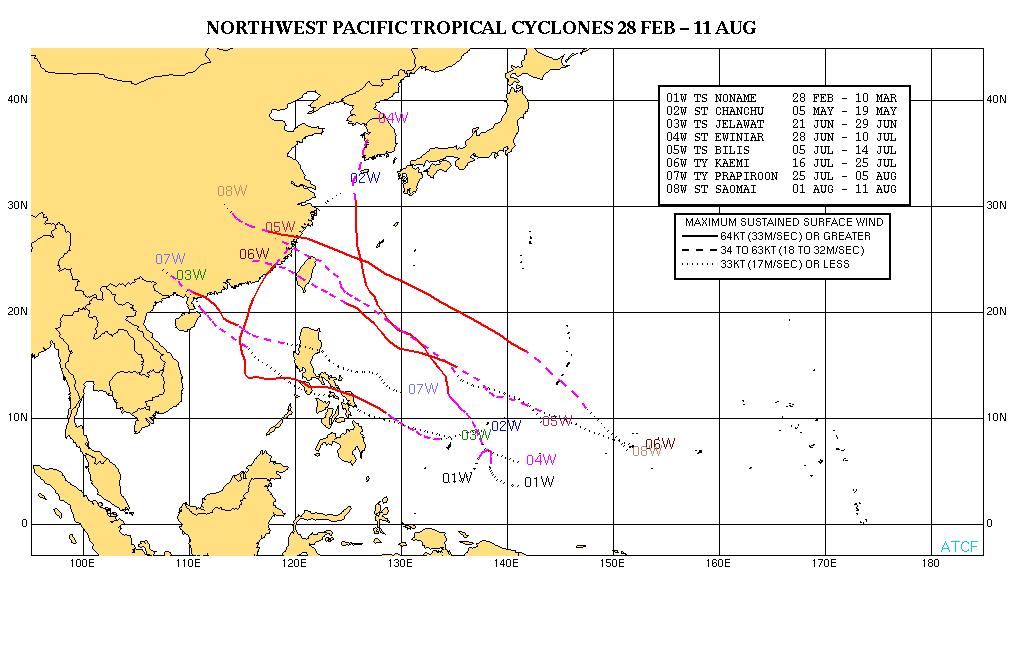
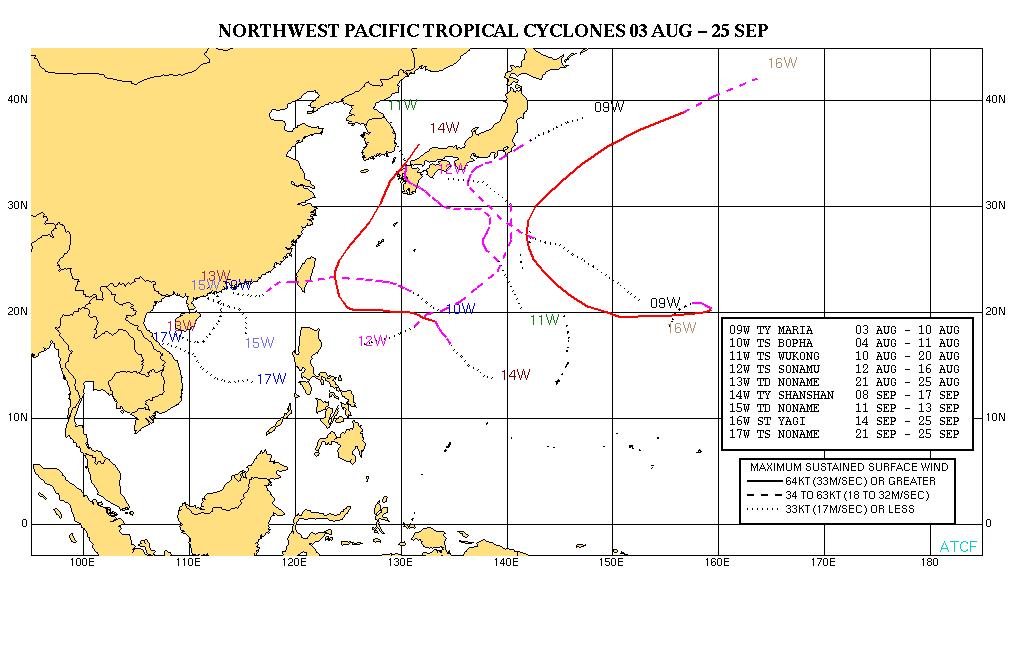
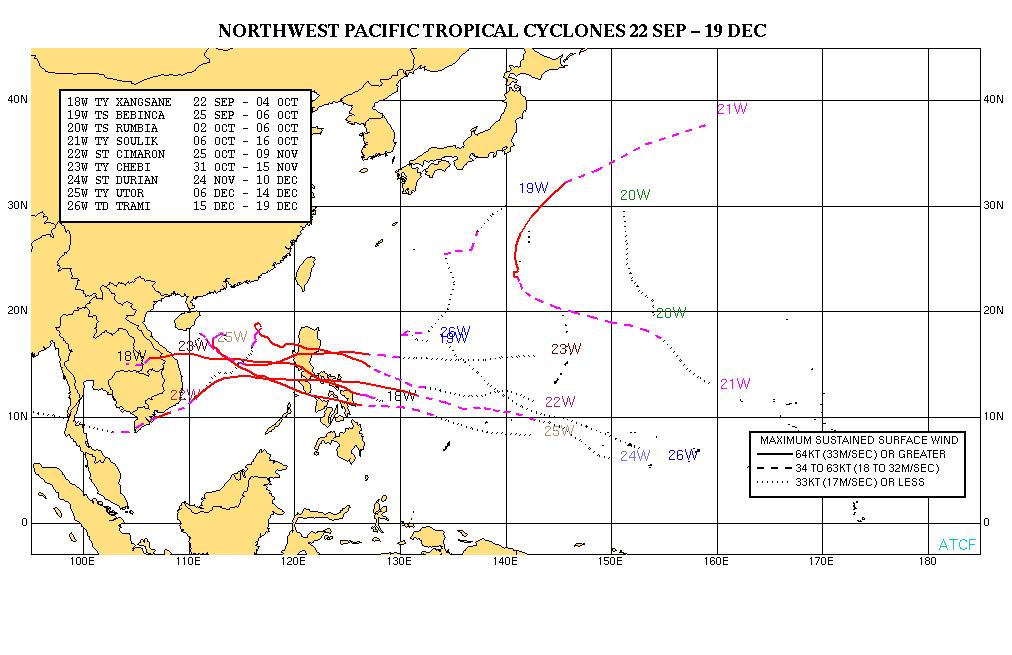
3 . SUMMARY OF WESTERN NORTH PACIFIC AND NORTH INDIAN OCEAN TROPICAL CYCLONES. WESTERN NORTH PACIFIC OCEAN TROPICAL CYCLONES This year's tropical cyclones are listed in Table -. Table - shows the monthly distribution of tropical cyclones for each year since and Table - shows the monthly average occurrence of tropical storms separated into: () typhoons only; and () tropical storms and typhoons. A summary of this year's Tropical Cyclone Formation Alerts is shown in Table -. The annual number of tropical cyclones of tropical storm strength or higher appear in Figure -, while the number of super typhoons are shown in Figure -. Figure - illustrates a monthly breakdown of system formations based on intensity categories. Composites of the tropical cyclone best tracks for the Western North Pacific appear following Figure -. Table - WESTERN NORTH PACIFIC SIGNIFICANT TROPICAL CYCLONES FOR ( JAN - DEC ) TC NAME* PERIOD** WARNINGS ISSUED EST MAX SFC WINDS KTS MSLP (MB)*** TS W - MAR MAR TY W CHANCHU MAY - MAY TS W JELAWAT JUN - JUN STY W EWINIAR JUN - - JUL TS W BILIS JUL - JUL TY W KAEMI JUL - JUL TY W PRAPIROON JUL - AUG STY W SAOMAI AUG - AUG TS W MARIA AUG - AUG TS W BOPHA AUG - AUG TS W WUKONG AUG - AUG TS W SONAMU AUG - AUG TD W - AUG - AUG TY W SHANSHAN AUG - SEP TD W - SEP - SEP STY W YAGI SEP - SEP TS W - SEP - SEP TY W XANGSANE SEP - OCT TS W BEBINCA OCT - OCT TD W RUMBIA OCT - OCT TY W SOULIK OCT - OCT STY W CIMARON OCT - NOV
4 TY W CHEBI NOV - NOV STY W DURIAN NOV - DEC TY W UTOR DEC - DEC TD W TRAMI DEC - DEC STY C IOKE AUG - SEP * As Designated by RSMC Tokyo or CPHC ** Dates are based on the issuance of JTWC warnings on system. *** MSLP Converted from estimated maximum surface winds using Atkinson/Holliday wind-pressure relationship Table - DISTRIBUTION OF WESTERN NORTH PACIFIC TROPICAL CYCLONES FOR - YEAR JAN FEB MAR APR MAY JUN JUL AUG SEP OCT NOV DEC TOTALS
5
6 (-) MEAN CASES The criteria used in TABLE - are as follows: ) If a tropical cyclone was first warned on during the last two days of a particular month and continued into the next month for longer than two days, then that system was attributed to the second month. ) If a tropical cyclone was warned on prior to the last two days of a month, it was attributed to the first month, regardless of how long the system lasted. ) If a tropical cyclone began on the last day of the month and ended on the first day of the next month, that system was attributed to the first month. However, if a tropical cyclone began on the last day of the month and continued into the next month for only two days, then it was attributed to the second month. Table - Legend: Total month/year GTE knots (Typhoon) to knots (Tropical Storm) LTE knots (Tropical Depression) TABLE - WESTERN NORTH PACIFIC TROPICAL CYCLONES TYPHOONS (-) JAN FEB MAR APR MAY JUN JUL AUG SEP OCT NOV DEC TOTALS MEAN CASES TYPHOONS (-) JAN FEB MAR APR MAY JUN JUL AUG SEP OCT NOV DEC TOTALS MEAN CASES TROPICAL STORMS AND TYPHOONS (-) JAN FEB MAR APR MAY JUN JUL AUG SEP OCT NOV DEC TOTALS
7 CASES TROPICAL STORMS AND TYPHOONS (-) JAN FEB MAR APR MAY JUN JUL AUG SEP OCT NOV DEC TOTALS MEAN TABLE - TROPICAL CYCLONE FORMATION ALERTS FOR THE WESTERN NORTH PACIFIC OCEAN FOR - YEAR INITIAL TCFAS TROPICAL CYCLONES WITH TCFAS TOTAL TROPICAL CYCLONES PROBABILITY OF TCFA WITHOUT WARNING* PROBABILITY OF TCFA BEFORE WARNING % % % % % % % % % % % % % % % % % % % % % % % % % % % % % % % % % % % % % % % % % % % % % % % % % % % % % % % % % % % % % % (-) MEAN:....%.% CASES:
8 * Percentage of initial TCFAs not followed by warnings. Figure -. Tropical cyclones of tropical storm or greater intensity in the western North Pacific (-).
9 Figure -. Number of Western North Pacific super typhoons (-).
10 Figure -. Average monthly tropical cyclones of all strengths (-).
11
12
13 . NORTH INDIAN OCEAN TROPICAL CYCLONES This year's North Indian Ocean tropical cyclones are listed in Table -. The monthly distribution of tropical cyclones for each year since is shown in Table -. A composite of the tropical cyclone best tracks for the Northern Indian Ocean appears following Table -. Table - NORTH INDIAN OCEAN SIGNIFICANT TROPICAL CYCLONES FOR ( JAN - DEC ) TC NAME PERIOD WARNINGS ISSUED EST MAX SFC WINDS KTS MSLP (MB)** A - JAN - JAN B MALA APR - APR B - JUL - JUL A MUKDA SEP - SEP B - SEP - SEP B* Total # * B ia a system that developed but was never warned upon. Table - DISTRIBUTION OF NORTH INDIAN OCEAN TROPICAL CYCLONES FOR - YEAR JAN FEB MAR APR MAY JUN JUL AUG SEP OCT NOV DEC TOTALS
14 (-)

15 MEAN CASES The criteria used in TABLE - are as follows: ) If a tropical cyclone was first warned on during the last two days of a particular month and continued into the next month for longer than two days, then that system was attributed to the second month. ) If a tropical cyclone was warned on prior to the last two days of a month, it was attributed to the first month, regardless of how long the system lasted. ) If a tropical cyclone began on the last day of the month and ended on the first day of the next month, that system was attributed to the first month. However, if a tropical cyclone began on the last day of the month and continued into the next month for only two days, then it was attributed to the second month. Table - Legend: Total month/year GTE knots to knots LTE knots
16 TROPICAL STORM (TS) W First Poor: Z MAR First Fair: N/A First TCFA: Z MAR First Warning: Z MAR Last Warning: Z MAR Max Intensity: kts, gusts to kts Total Warnings:


17 TYPHOON (TY) W (CHANCHU) First Poor: Z MAY First Fair: Z MAY First TCFA: Z MAY First Warning: Z MAY Last Warning: Z MAY Max Intensity: kts, gusts to kts Total Warnings:

18 TROPICAL STORM (TS) W (JELAWAT) First Poor: Z JUN First Fair: Z JUN First TCFA: Z JUN First Warning: Z JUN Last Warning: Z JUN Max Intensity: kts, gusts to kts Total Warnings:

19 SUPER TYPHOON (STY) W (EWINIAR) First Poor: N/A First Fair: Z JUN First TCFA: Z JUN First Warning: Z JUN Last Warning: Z JUL Max Intensity: kts, gusts to kts Total Warnings:

20 TROPICAL STORM (TS) W (BILIS) First Poor: N/A First Fair: Z JUL First TCFA: Z JUL First Warning: Z JUL Last Warning: Z JUL Max Intensity: kts, gusts to kts Total Warnings:

21 TYPHOON (TY) W (KAEMI) First Poor: Z JUL First Fair: Z JUL First TCFA: Z JUL First Warning: Z JUL Last Warning: Z JUL Max Intensity: kts, gusts to kts Total Warnings:


22 TYPHOON (TY) W (PRAPIROON) First Poor: Z JUL First Fair: Z JUL First TCFA: Z JUL First Warning: Z JUL Last Warning: Z AUG Max Intensity: kts, gusts to kts Total Warnings:

23 SUPER TYPHOON (STY) W (SAOMAI) First Poor: Z AUG First Fair: Z AUG First TCFA: Z AUG First Warning: Z AUG Last Warning: Z AUG Max Intensity: kts, gusts to kts Total Warnings:

24 TROPICAL STORM (TS) W (MARIA) First Poor: Z AUG First Fair: Z AUG First TCFA: Z AUG First Warning: Z AUG Last Warning: Z AUG Max Intensity: kts, gusts to kts Total Warnings:


25 TROPICAL STORM (TS) W (BOPHA) First Poor: Z AUG First Fair: Z AUG First TCFA: N/A First Warning: Z AUG Last Warning: Z AUG Max Intensity: kts, gusts to kts Total Warnings:


26 TROPICAL STORM (TS) W (WUKONG) First Poor: N/A First Fair: Z AUG First TCFA: Z AUG First Warning: Z AUG Last Warning: Z AUG Max Intensity: kts, gusts to kts Total Warnings:

27 TROPICAL STORM (TS) W (SONAMU) First Poor: Z AUG First Fair: N/A First TCFA: Z AUG First Warning: Z AUG Last Warning: Z AUG Max Intensity: kts, gusts to kts Total Warnings:

28 TROPICAL DEPRESSION (TD) W First Poor: N/A First Fair: Z AUG First TCFA: Z AUG First Warning: Z AUG Last Warning: Z AUG Max Intensity: kts, gusts to kts Total Warnings:


29 TYPHOON (TY) W (SHANSHAN) First Poor: Z SEP First Fair: Z SEP First TCFA: Z SEP First Warning: Z SEP Last Warning: Z SEP Max Intensity: kts, gusts to kts Total Warnings:

30 TROPICAL DEPRESSION (TD) W First Poor: Z SEP First Fair: Z SEP First TCFA: Z SEP First Warning: Z SEP Last Warning: Z SEP Max Intensity: kts, gusts to kts Total Warnings:

31 SUPER TYPHOON (STY) W (YAGI) First Poor: Z SEP First Fair: Z SEP First TCFA: Z SEP First Warning: Z SEP Last Warning: Z SEP Max Intensity: kts, gusts to kts Total Warnings:

32 TROPICAL DEPRESSION (TD) W First Poor: Z SEP First Fair: N/A First TCFA: Z SEP First Warning: Z SEP Last Warning: Z SEP Max Intensity: kts, gusts to kts Total Warnings:


33 TYPHOON (TY) W (XANGSANE) First Poor: N/A First Fair: Z SEP First TCFA: Z SEP First Warning: Z SEP Last Warning: Z OCT Max Intensity: kts, gusts to kts Total Warnings:
34 TROPICAL STORM (TS) W (BEBINCA) First Poor: Z SEP First Fair: Z SEP First TCFA: N/A First Warning: Z OCT Last Warning: Z OCT Max Intensity: kts, gusts to kts Total Warnings:
35 TROPICAL DEPRESSION (TD) W (RUMBIA) First Poor: Z OCT First Fair: Z OCT First TCFA: Z OCT First Warning: Z OCT Last Warning: Z OCT Max Intensity: kts, gusts to kts

36 TYPHOON (TY) W (SOULIK) First Poor: Z OCT First Fair: Z OCT First TCFA: Z OCT First Warning: Z OCT Last Warning: Z OCT Max Intensity: kts, gusts to kts Total Warnings:


37 SUPER TYPHOON (STY) W (CIMARON) First Poor: Z OCT First Fair: Z OCT First TCFA: Z OCT First Warning: Z Last Warning: Z NOV Max Intensity: kts, gusts to kts Total Warnings: *Named by WMO Designated RSMC


38 TYPHOON (TY) W (CHEBI) First Poor: Z NOV First Fair: Z NOV First TCFA: Z NOV First Warning: Z NOV Last Warning: Z NOV Max Intensity: kts, gusts to kts Total Warnings:


39 SUPER TYPHOON (STY) W (DURIAN) First Poor: Z NOV First Fair: Z NOV First TCFA: N/A First Warning: Z NOV Last Warning: Z DEC Max Intensity: kts, gusts to kts Total Warnings:

40 TYPHOON (TY) W (UTOR) First Poor: Z DEC First Fair: Z DEC First TCFA: Z DEC First Warning: Z DEC Last Warning: Z Max Intensity: kts, gusts to kts Total Warnings:
41 TROPICAL DEPRESSION (TD) W (TRAMI) First Poor: Z DEC First Fair: Z DEC First TCFA: N/A First Warning: Z DEC Last Warning: Z Max Intensity: kts, gusts to kts

42 SUPER TYPHOON (STY) C (IOKE) First Poor: CPHC First Fair: CPHC First TCFA: Z AUG First Warning: AUG Last Warning: Z SEP Max Intensity: kts, gusts to kts Total Warnings:

43 TROPICAL CYCLONE (TC) A First Poor: Z JAN First Fair: Z JAN First TCFA: Z JAN First Warning: Z JAN Last Warning: Z JAN Max Intensity: kts, gusts to kts Total Warnings:


44 TROPICAL CYCLONE (TC) B (MALA) First Poor: Z APR First Fair: Z APR First TCFA: N/A First Warning: Z APR Last Warning: Z APR Max Intensity: kts, gusts to kts Total Warnings:

45 TROPICAL CYCLONE (TC) B First Poor: Z JUN First Fair: Z JUL First TCFA: N/A First Warning: Z JUL Last Warning: Z JUL Max Intensity: kts, gusts to kts Total Warnings:


46 TROPICAL CYCLONE (TC) A (MUKDA) First Poor: Z SEP First Fair: Z SEP First TCFA: Z SEP First Warning: Z SEP Last Warning: Z SEP Max Intensity: kts, gusts to kts

47 TROPICAL CYCLONE (TC) B First Poor: Z SEP First Fair: N/A First TCFA: N/A First Warning: Z SEP Last Warning: Z SEP Max Intensity: kts, gusts to kts Total Warnings:

48 TROPICAL CYCLONE (TC) B First Poor: Z OCT First Fair: Z OCT First TCFA: Z OCT First Warning: N/A Last Warning: N/A Max Intensity: kts, gusts to kts Total Warnings: N/A
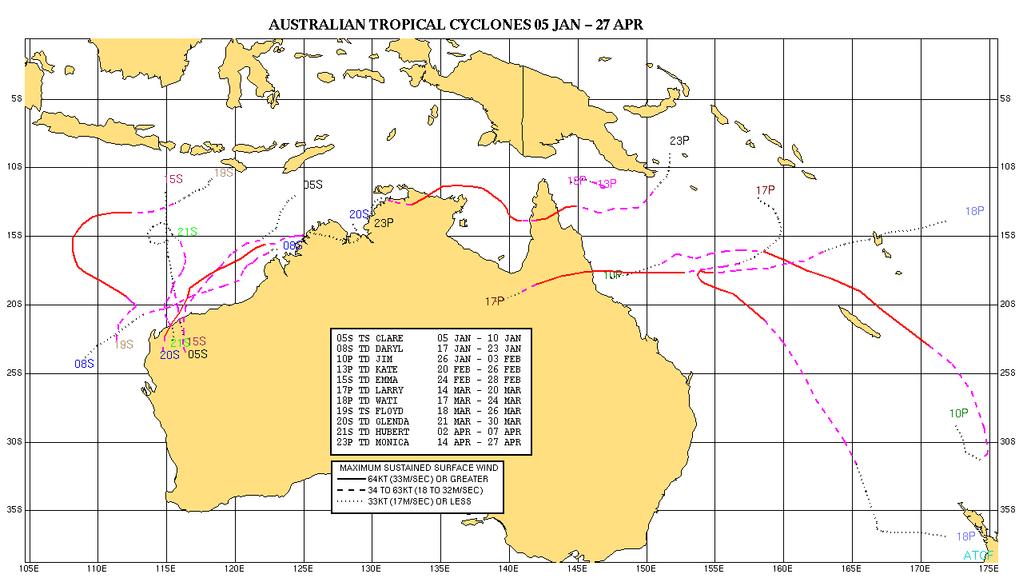
49 . SOUTH PACIFIC AND SOUTH INDIAN OCEAN TROPICAL CYCLONES. GENERAL In accordance with CINCPACINST. (series), Southern Hemisphere tropical cyclones are numbered sequentially from July through June to reflect the Southern Hemisphere tropical season. For warning message delineation, the Southern Hemisphere Area of Responsibility (AOR) is divided into two basins: the South Indian (west of East longitude) and the South Pacific Ocean (east of East longitude). The suffixes "S" (South Indian Ocean) and "P" (South Pacific Ocean) are appended to the tropical cyclone number to differentiate warnings for these basins. For this report, the Southern Hemisphere AOR is broken down into three sub-basins, reflecting primary cyclogenesis areas: South Indian (west of East longitude), Australia ( East longitude to East longitude), and South Pacific (east of East longitude).. SUMMARY Table - lists the significant tropical cyclones during the season and can be compared to the climatological mean presented in Table -. Table - compares this year's tropical cyclone activity in the Southern Hemisphere sub-basins to previous years and climatology. Composites of the tropical cyclone best tracks for the Southern Hemisphere appear following Table -. Table - SOUTHERN HEMISPHERE TROPICAL CYCLONES FOR ( JULY - JUNE ) TC NAME PERIOD WARNINGS ISSUED EST MAX SFC WINDS KTS MSLP (MB)** S - OCT - OCT S - NOV - NOV S BERTIE-ALVIN NOV - NOV
50 S - DEC - DEC S CLARE JAN - JAN P TAM JAN - JAN P URMIL JAN - JAN S DARYL JAN - JAN S BOLOETSE JAN - JAN P JIM JAN - FEB P VAIANU FEB - FEB S - FEB - FEB P KATE FEB - FEB S CARINA FEB - MAR S EMMA FEB - FEB S DIWA MAR - MAR P LARRY MAR - MAR P WATI MAR - MAR S FLOYD MAR - MAR S GLENDA MAR - MAR S HUBERT APR - APR S ELIA APR - APR P MONICA APR - APR Total# **MSLP Converted from estimated maximum surface winds using Atkinson/Holliday wind pressure relationship. Number of warnings issued includes Amended warnings. Table - DISTRIBUTION OF SOUTH PACIFIC AND SOUTH INDIAN OCEAN TROPICAL CYCLONES FOR - YEAR JUL AUG SEP OCT NOV DEC JAN FEB MAR APR MAY JUN TOTALS - AVERAGE*
51 (-) MEAN CASES * (GRAY, ) The criteria used in TABLE - are as follows: ) If a tropical cyclone was first warned on during the last two days of a particular month and continued into the next month for longer than two days, then that system was attributed to the second month. ) If a tropical cyclone was warned on prior to the last two days of a month, it was attributed to the first month, regardless of how long the system lasted. ) If a tropical cyclone began on the last day of the month and ended on the first day of the next month, that system was attributed to the first month. However, if a tropical cyclone began on the last day of the month and continued into the next month for only two days, then it was attributed to the second month. Table - ANNUAL VARIATION OF SOUTHERN HEMISPHERE TROPICAL CYCLONES BY OCEAN BASIN - YEAR SOUTH INDIAN AUSTRALIAN SOUTH PACIFIC (WEST OF E) ( E - E) - AVERAGE* (EAST OF E) TOTAL.... -
52 - MEAN.... CASES *(Gray, )
53
54 TROPICAL CYCLONE (TC) S First Poor: Z OCT First Fair: Z OCT First TCFA: Z OCT First Warning: Z OCT Last Warning: Z OCT Max Intensity: kts, gusts to kts Total Warnings:

55 TROPICAL CYCLONE (TC) S First Poor: Z NOV First Fair: N/A First TCFA: Z NOV First Warning: Z NOV Last Warning: Z NOV Max Intensity: kts, gusts to kts Total Warnings:

56 TROPICAL CYCLONE (TC) S (BERTIE-ALVIN) First Poor: Z NOV First Fair: Z NOV First TCFA: Z NOV First Warning: Z NOV Last Warning: Z NOV Max Intensity: kts, gusts to kts Total Warnings:

57 TROPICAL CYCLONE (TC) S First Poor: Z DEC First Fair: Z DEC First TCFA: N/A First Warning: Z DEC Last Warning: Z DEC Max Intensity: kts, gusts to kts Total Warnings:

58 TROPICAL CYCLONE (TC) S (CLARE) First Poor: N/A First Fair: Z JAN First TCFA: Z JAN First Warning: Z JAN Last Warning: Z JAN Max Intensity: kts, gusts to kts Total Warnings:
59 TROPICAL CYCLONE (TC) P (TAM) First Poor: Z JAN First Fair: Z JAN First TCFA: Z JAN First Warning: Z JAN Last Warning: Z JAN Max Intensity: kts, gusts to kts Total Warnings:
60 TROPICAL CYCLONE (TC) P (URMIL) First Poor: Z JAN First Fair: Z JAN First TCFA: Z JAN First Warning: Z JAN Last Warning: Z JAN Max Intensity: kts, gusts to kts Total Warnings:

61 TROPICAL CYCLONE (TC) S (DARYL) First Poor: Z JAN First Fair: Z JAN First TCFA: Z JAN First Warning: Z JAN Last Warning: Z JAN Max Intensity: kts, gusts to kts Total Warnings:


62 TROPICAL CYCLONE (TC) S (BOLOETSE) First Poor: Z JAN First Fair: Z JAN First TCFA: Z JAN First Warning: Z JAN Last Warning: Z JAN Max Intensity: kts, gusts to kts Total Warnings:


63 TROPICAL CYCLONE (TC) P (JIM) First Poor: Z JAN First Fair: Z JAN First TCFA: Z JAN First Warning: Z JAN Last Warning: Z FEB Max Intensity: kts, gusts to kts Total Warnings:

64 TROPICAL CYCLONE (TC) P (VAIANU) First Poor: Z FEB First Fair: N/A First TCFA: Z FEB First Warning: Z FEB Last Warning: Z FEB Max Intensity: kts, gusts to kts Total Warnings:
65 TROPICAL CYCLONE (TC) S First Poor: Z FEB First Fair: Z FEB First TCFA: Z FEB First Warning: Z FEB Last Warning: Z FEB Max Intensity: kts, gusts to kts Total Warnings:

66 TROPICAL CYCLONE (TC) P (KATE) First Poor: Z FEB First Fair: N/A First TCFA: N/A First Warning: Z FEB Last Warning: Z FEB Max Intensity: kts, gusts to kts Total Warnings:

67 TROPICAL CYCLONE (TC) S (CARINA) First Poor: Z FEB First Fair: Z FEB First TCFA: Z FEB First Warning: Z FEB Last Warning: Z MAR Max Intensity: kts, gusts to kts Total Warnings:

68 TROPICAL CYCLONE (TC) S (EMMA) First Poor: N/A First Fair: Z FEB First TCFA: N/A First Warning: Z FEB Last Warning: Z FEB Max Intensity: kts, gusts to kts Total Warnings:

69 TROPICAL CYCLONE (TC) S (DIWA) First Poor: Z MAR First Fair: Z MAR First TCFA: Z MAR First Warning: Z MAR Last Warning: Z MAR Max Intensity: kts, gusts to kts Total Warnings:

70 TROPICAL CYCLONE (TC) P (LARRY) First Poor: Z MAR First Fair: Z MAR First TCFA: Z MAR First Warning: Z MAR Last Warning: Z MAR Max Intensity: kts, gusts to kts Total Warnings:

71 TROPICAL CYCLONE (TC) P (WATI) First Poor: Z MAR First Fair: Z MAR First TCFA: Z MAR First Warning: Z MAR Last Warning: Z MAR Max Intensity: kts, gusts to kts Total Warnings:


72 TROPICAL CYCLONE (TC) S (FLOYD) First Poor: Z MAR First Fair: Z MAR First TCFA: Z MAR First Warning: Z MAR Last Warning: Z MAR Max Intensity: kts, gusts to kts Total Warnings:


73 TROPICAL CYCLONE (TC) S (GLENDA) First Poor: Z MAR First Fair: Z MAR First TCFA: Z MAR First Warning: Z MAR Last Warning: Z MAR Max Intensity: kts, gusts to kts Total Warnings:

74 TROPICAL CYCLONE (TC) S (HUBERT) First Poor: Z APR First Fair: Z APR First TCFA: Z APR First Warning: Z APR Last Warning: Z APR Max Intensity: kts, gusts to kts Total Warnings:

75 TROPICAL CYCLONE (TC) S (ELIA) First Poor: Z APR First Fair: Z APR First TCFA: N/A First Warning: Z APR Last Warning: Z APR Max Intensity: kts, gusts to kts Total Warnings:


76 TROPICAL CYCLONE (TC) P (MONICA) First Poor: Z APR First Fair: Z APR First TCFA: N/A First Warning: Z APR Last Warning: Z APR Max Intensity: kts, gusts to kts Total Warnings:
77 . TROPICAL CYCLONE FIX DATA SEASON Tables - to - list the number of tropical cyclone center "fixes", or locations, made using satellite (visible, infrared, and microwave), radar, and synoptic data. Fixes made by the DOD tropical cyclone reconnaissance network sites are included in the tables as well as those fixes received from other sources (e.g., Japan Meteorological Agency, Australian Bureau of Meteorology, and U.S. National Weather Service National Environmental Satellite Data and Information Service). Table - lists the total fixes by basin. Table - WESTERN NORTH PACIFIC OCEAN FIX SUMMARY FOR TC Name Satellite Radar Synoptic Total TS W - STY W Chanchu TS W Jelawat STY W Ewiniar TS W Bilis TY W Kaemi TY W Prapiroon STY W Saomai TS W Maria TS W Bopha TS W Wukong TS W Sonamu TD W - TY W Shanshan TD W - STY W yagi TS W - TY W Xangsane TS W Bebinca TS W Rumbia TY W Soulik STY W Cimaron TY W Chebi STY W Durian TY W Utor TD W Trami STY C Ioke
78 Percentage of Total Total.%.%.% Table - NORTHERN INDIAN OCEAN FIX SUMMARY FOR TC Name Satellite Radar Synoptic Total TC A - TC B Mala TC B - TC A Mukda TC B - TC B - Percentage of Total Totals.%.% Table - SOUTH PACIFIC & SOUTH INDIAN FIX SUMMARY FOR TC Name Satellite Radar Synoptic Total TC S - TC S - TC S Bertie-Alvin TC S - TC S Clare TC P Tam TC P Urmil TC S Daryl TC S Boloetse TC P Jim TC P Vaianu TC S - TC P Kate TC S Carina TC S Emma TC S Diwa TC P Larry TC P Wati TC S Floyd TC S Glenda
79 TC S Hubert TC S Elia TC P Monica Precentage of Total Totals.%.%.% Table - FIXES BY OCEANIC BASIN FOR Oceanic Basin Total Fixes Northwest Pacific Northern Indian Ocean Southern Hemisphere Total. SUMMARY OF FORECAST VERIFICATION. ANNUAL FORECAST VERIFICATION
80 Verification of warning positions and intensities at initial, -, -, -, and -hour forecast periods are made against the final best track. The (scalar) track forecast, along-track and cross-track errors (illustrated in -) were calculated for each verifying JTWC forecast. These data, in addition to a detailed summary for each tropical cyclone, are included in this chapter. This section summarizes verification data this year and contrasts it with annual verification statistics from previous years. Figure -. Definition of cross-track error (XTE), along-track error (ATE), and forecast track error (FTE). In this example, the forecast position is ahead of and to the right of the verifying best track position. Therefore, the XTE is positive (to the right of the best track) and the ATE is positive (ahead or faster than the best track). Adapted from Tsui and Miller,... WESTERN NORTH PACIFIC OCEAN Table - includes mean track, along-track and cross-track errors from, when JTWC was founded, until the present. Figure - shows mean track errors and a -year running mean of track errors at -, - and -hours since. Table - MEAN FORECAST TRACK ERRORS (NM) FOR WESTERN NORTH PACIFIC (TROPICAL CYCLONES FROM - YEAR (Notes) TY () TC () -HOUR -HOUR -HOUR CROSS TRACK () ALONG TRACK () TY () TC () CROSS TRACK () ALONG TRACK () TY () TC () CROSS TRACK () ALONG TRACK ()
81 * * * *
82 Averages (-). Track errors were calculated for typhoons when intensities were at least kts at warning times. Cross-track and along-track errors were adopted by the JTWC in. Right angle errors (used prior to ) were recomputed as cross-track errors after-the fact to extend the data base. See Figure - for the definitions of cross-track and along-track.. Mean forecast errors for all warned systems in Northwest Pacific. *Forecast positions north of degrees North latitude were not verified. ** statistics were recalculated to resolve earlier Along and Cross-Track discrepancies. Figure -. Mean track forecast error (nm) and -year running mean for, and hours for Western North Pacific Ocean tropical cyclones from -. Table - MEAN FORECAST TRACK ERRORS (NM) FOR NORTH INDIAN OCEAN (TROPICAL CYCLONES FROM - YEAR (Notes) -HOUR -HOUR -HOUR Cases Track CROSS TRACK ALONG TRACK Cases Track CROSS TRACK ALONG TRACK Cases Track CROSS TRACK ALONG TRACK
83 Averages (-)
84 Figure -. Mean track forecast error (nm) and -year running mean for, and hours for North Indian Ocean Tropical Cyclones from -. Table - MEAN FORECAST TRACK ERRORS (NM) FOR SOUTHERN HEMISPHERE (TROPICAL CYCLONES FROM - YEAR (Notes) -HOUR -HOUR -HOUR Cases Track CROSS TRACK ALONG TRACK Cases Track CROSS TRACK ALONG TRACK Cases Track CROSS TRACK ALONG TRACK Averages (-)
85 Figure -. Mean track forecast error (nm) and -year running mean for, and hours for Southern Hemisphere Ocean Tropical Cyclones from -.. TESTING AND RESULTS A comparison of selected techniques is included in Table - for all Western North Pacific tropical cyclones, Table - for North Indian Ocean tropical cyclones, and Table - for Southern Hemisphere tropical cyclones. For example, in Table - for the homogeneous comparison of the -hour mean forecast error between JTWC and CONW, cases were available. The average forecast error at hours was nm for CONW and nm for JTWC. The difference of nm is shown in the lower right. Due to computational round-off, differences are not always exact. Table - Error Statistics for Selected Objective Techniques Western North Pacific Ocean -HOUR MEAN FORECAST ERROR (NM) JTWC CON W JTWC CONW AFWI AVNI COWI EGRI ECMI GFNI JGSI JTYI NGPI TCLI WBAI -
86 AFWI AVNI COWI EGRI ECMI GFNI JGSI JTYI NGPI TCLI WBAI HOUR MEAN FORECAST ERROR (NM) JTWC CON W AFWI AVNI COWI EGRI JTWC CONW AFWI AVNI COWI EGRI ECMI GFNI JGSI JTYI NGPI TCLI WBAI - - -
87 - - ECMI GFNI JGSI JTYI NGPI TCLI WBAI HOUR MEAN FORECAST ERROR (NM) JTWC CON W AFWI AVNI COWI EGRI JTWC CONW AFWI AVNI COWI EGRI ECMI GFNI JGSI JTYI NGPI TCLI WBAI ECMI GFNI
88 JGSI JTYI NGPI TCLI WBAI - -HOUR MEAN FORECAST ERROR (NM) JTWC CON W AFWI AVNI COWI EGRI JTWC CONW AFWI AVNI COWI EGRI ECMI GFNI JGSI JTYI NGPI TCLI WBAI - ECMI GFNI JGSI
89 JTYI NGPI TCLI WBAI - -HOUR MEAN FORECAST ERROR (NM) JTWC CON W AFWI AVNI COWI EGRI JTWC CONW AFWI AVNI COWI EGRI ECMI GFNI JGSI JTYI NGPI TCLI WBAI ECMI GFNI JGSI
90 JTYI NGPI TCLI - - WBAI - -HOUR MEAN FORECAST ERROR (NM) JTWC CON W AVNI JTWC CONW AVNI COWI EGRI ECMI GFNI JGSI NGPI - COWI EGRI - ECMI GFNI JGSI
91 NGPI HOUR MEAN FORECAST ERROR (NM) JTWC CON W AVNI JTWC CONW AVNI COWI EGRI ECMI GFNI NGPI COWI EGRI ECMI GFNI NGPI Table - Error Statistics for Selected Objective Techniques North Indian Ocean -HOUR MEAN FORECAST ERROR (NM) JTWC CONW AFWI AVNI COWI EGRI ECMI GFNI NGPI TCLI WBAI JTWC
92 CONW - AFWI - AVNI COWI - EGRI ECMI GFNI - NGPI TCLI - WBAI -HOUR MEAN FORECAST ERROR (NM) JTWC CONW AFWI AVNI COWI EGRI ECMI GFNI NGPI TCLI WBAI JTWC CONW - AFWI AVNI COWI - EGRI ECMI GFNI NGPI - TCLI - WBAI
93 -HOUR MEAN FORECAST ERROR (NM) JTWC CONW AFWI AVNI COWI EGRI ECMI GFNI NGPI TCLI WBAI JTWC CONW - AFWI AVNI COWI EGRI - - ECMI GFNI NGPI - TCLI - WBAI -HOUR MEAN FORECAST ERROR (NM) JTWC JTWC CONW AFWI AVNI COWI EGRI ECMI GFNI NGPI TCLI WBAI CONW AFWI AVNI - - COWI EGRI - ECMI
94 GFNI NGPI TCLI - - WBAI -HOUR MEAN FORECAST ERROR (NM) CONW CONW AFWI AVNI EGRI GFNI NGPI TCLI WBAI AFWI AVNI - EGRI GFNI NGPI TCLI - - WBAI -HOUR MEAN FORECAST ERROR (NM) CONW AVNI EGRI CONW AVNI EGRI Table - Error Statistics for Selected Objective Techniques Southern Hemisphere
95 -HOUR MEAN FORECAST ERROR (NM) JTWC JTWC CONW AFWI AVNI EGRI ECMI GFNI NGPI TCLI WBAI CONW - AFWI AVNI - EGRI - ECMI - GFNI - - NGPI - - TCLI WBAI -HOUR MEAN FORECAST ERROR (NM) JTWC JTWC CONW AFWI AVNI EGRI ECMI GFNI NGPI TCLI WBAI CONW - AFWI AVNI - EGRI ECMI GFNI - - NGPI - - TCLI
96 WBAI -HOUR MEAN FORECAST ERROR (NM) JTWC CONW AFWI AVNI EGRI ECMI GFNI NGPI TCLI WBAI JTWC CONW - AFWI AVNI - EGRI ECMI - GFNI - NGPI - TCLI WBAI -HOUR MEAN FORECAST ERROR (NM) JTWC CONW AFWI AVNI EGRI ECMI GFNI NGPI TCLI WBAI JTWC CONW - AFWI AVNI - EGRI ECMI - GFNI - - NGPI
97 - - TCLI WBAI - -HOUR MEAN FORECAST ERROR (NM) JTWC CONW AFWI AVNI EGRI GFNI NGPI TCLI WBAI JTWC CONW - AFWI AVNI - EGRI GFNI - NGPI - TCLI WBAI -HOUR MEAN FORECAST ERROR (NM) CONW AVNI EGRI GFNI NGPI CONW AVNI EGRI GFNI NGPI
98 -HOUR MEAN FORECAST ERROR (NM) CONW AVNI EGRI GFNI NGPI CONW AVNI EGRI GFNI NGPI
Table of Contents. Chapter 1 Operations at the RSMC Tokyo - Typhoon Center in 2006
 Annual Report on the Activities of the RSMC Tokyo - Typhoon Center 20 06 TY SAOMAI (0608) 00 UTC, 10 Aug. 2006 Japan Meteorological lagency Table of Contents Introduction Page Chapter 1 Operations at the
Summary of 2006 NW Pacific Typhoon Season and Verification of Authors Seasonal Forecasts
 Summary of 2006 NW Pacific Typhoon Season and Verification of Authors Seasonal Forecasts Issued: 10th January 2007 by Professor Mark Saunders and Dr Adam Lea Benfield UCL Hazard Research Centre, UCL (University
2008 Annual Tropical Cyclone Report U.S. Naval Maritime Forecast Center/ Joint Typhoon Warning Center Pearl Harbor, Hawaii
 2008 Annual Tropical Cyclone Report U.S. Naval Maritime Forecast Center/ Joint Typhoon Warning Center Pearl Harbor, Hawaii MODIS visible image of Typhoon Rammasun (03W) in the eastern Philippine Sea showing
Verification of the Seasonal Forecast for the 2005/06 Winter
 Verification of the Seasonal Forecast for the 2005/06 Winter Shingo Yamada Tokyo Climate Center Japan Meteorological Agency 2006/11/02 7 th Joint Meeting on EAWM Contents 1. Verification of the Seasonal
Presentation on RSMC Nadi-TCC Activities
 6 th TC RSMC Technical Coordination Meeting, Brisbane, Australia, 2 5 Nov 2009 Presentation on RSMC Nadi-TCC Activities R. Prasad Director RSMC Nadi-TCC NADI TROPICAL CYCLONE CENTRE RSMC NADI - TCC Approved
Predicting Tropical Cyclone Formation and Structure Change
 Predicting Tropical Cyclone Formation and Structure Change Patrick A. Harr Department of Meteorology Naval Postgraduate School Monterey, CA 93943-5114 phone: (831)656-3787 fax: (831)656-3061 email: paharr@nps.navy.mil
Numerical Prediction of Tropical Cyclones (PAGASA Experience)
") Numerical Prediction of Tropical Cyclones (PAGASA Experience) BONIFACIO G. PAJUELAS Philippine Atmospheric, Geophysical and Astronomical Services Administration (PAGASA) Science Garden, Agham Road, Diliman,
Numerical Prediction of Tropical Cyclones (PAGASA Experience) BONIFACIO G. PAJUELAS Philippine Atmospheric, Geophysical and Astronomical Services Administration (PAGASA) Science Garden, Agham Road, Diliman,
JTWC's Use of TRMM in Typhoon Forecast Operations
 Use of TRMM in Typhoon Forecast Operations JTWC's Use of TRMM in Typhoon Forecast Operations Slide 1/24 Use of TRMM in Typhoon Forecast Operations Slide 2/24 Opening Comments The current microwave satellite
Interpretation of Tropical Cyclone Forecast Sensitivity from the Singular Vector Perspective
 NOVEMBER 2009 C H E N E T A L. 3383 Interpretation of Tropical Cyclone Forecast Sensitivity from the Singular Vector Perspective JAN-HUEY CHEN Department of Atmospheric Sciences, National Taiwan University,
The tropical circulation in the Australian/Asian region - May to October 2000
 Aust. Met. Mag. 50 (2001) 137-147 Introduction The tropical circulation in the Australian/Asian region - May to October 2000 Hakeem A. Shaik and Peter W. Bate Regional Office, Bureau of Meteorology, Darwin,
Outline of 4 Lectures
 Outline of 4 Lectures 1. Sept. 17, 2008: TC best track definition and datasets, global distribution of TCs; Review of history of meteorological satellites, introducing different orbits, scanning patterns,
Government of Sultanate of Oman Public Authority of Civil Aviation Directorate General of Meteorology. National Report To
 Government of Sultanate of Oman Public Authority of Civil Aviation Directorate General of Meteorology National Report To Panel on Tropical Cyclones in the Bay of Bengal And Arabian Sea 43rd Session, India
Annual Report on the Activities of the RSMC Tokyo - Typhoon Center 2012
 Annual Report on the Activities of the RSMC Tokyo - Typhoon Center 2012 TY Sanba 00 UTC, 14 September 2012 Japan Meteorological Agency Annual Report on the Activities of the RSMC Tokyo - Typhoon Center
Analysis of Fall Transition Season (Sept-Early Dec) Why has the weather been so violent?
 Why has the weather been so violent?") WEATHER TOPICS Analysis of Fall Transition Season (Sept-Early Dec) 2009 Why has the weather been so violent? As can be seen by the following forecast map, the Fall Transition and early Winter Season of
WEATHER TOPICS Analysis of Fall Transition Season (Sept-Early Dec) 2009 Why has the weather been so violent? As can be seen by the following forecast map, the Fall Transition and early Winter Season of
The Role of PAGASA in Disaster Mitigation
 The Role of PAGASA in Disaster Mitigation Christopher F. Perez 2017 ACTS Workshop on Extreme Weather Forecast and Water Resource Management Hanoi, Vietnam September 26-27, 2017 Tropical Storm AMANG(Mekkhala),
ATCF: LESSONS LEARNED ON TC CONSENSUS FORECASTING. John Knaff, NOAA/NESDIS and Buck Sampson, NRL, Monterey
 ATCF: LESSONS LEARNED ON TC CONSENSUS FORECASTING John Knaff, NOAA/NESDIS and Buck Sampson, NRL, Monterey Definitions TC tropical cyclone Aid individual model forecast Guidance any method that provides
1. Introduction. 2. Verification of the 2010 forecasts. Research Brief 2011/ February 2011
 Research Brief 2011/01 Verification of Forecasts of Tropical Cyclone Activity over the Western North Pacific and Number of Tropical Cyclones Making Landfall in South China and the Korea and Japan region
Summary of 2005/6 Australian-Region Tropical Storm Season and Verification of Authors Seasonal Forecasts
 Summary of 2005/6 Australian-Region Tropical Storm Season and Verification of Authors Seasonal Forecasts Issued: 15th May 2006 by Professor Mark Saunders and Dr Adam Lea Benfield Hazard Research Centre,
Extratropical transition of tropical cyclones: Operational forecasting challenges. Matthew Kucas Joint Typhoon Warning Center Pearl Harbor, HI, USA
 Extratropical transition of tropical cyclones: Operational forecasting challenges Matthew Kucas Joint Typhoon Warning Center Pearl Harbor, HI, USA Outline Motivation for discussion Brief overview of tropical
A Preliminary Climatology of Extratropical Transitions in the Southwest Indian Ocean
 A Preliminary Climatology of Extratropical Transitions in the Southwest Indian Ocean Kyle S. Griffin Department of Atmospheric and Environmental Sciences, University at Albany, State University of New
16 th RAV/TCC Meeting, Solomon Is Misaeli Funaki- RSMC Nadi
 16 th RAV/TCC Meeting, Solomon Is. 2016 Misaeli Funaki- RSMC Nadi 2014/15 seasonal activities reviewed -Climate Indices - MJO..etc - Seasonal Review 2015/16 seasonal activities reviewed -Climate Indices
HURRICANES. Part 1/Group 1 Student Handout Historical Occurrence Study 2. Part 2/Group2 Student Handout Storm Tracking 5
 LEARNING EXPERIENCE 1 STUDENT HANDOUT HURRICANES Developed by Rebecca C. Smyth 1, Matt Morris 2,3 and Kathy Ellins 4 1. Research Scientist Associate, Bureau of Economic Geology, Jackson School of Geosciences,
Annual Report on Activities of the RSMC Tokyo Typhoon Center 2001
 Annual Report on Activities of the RSMC Tokyo Typhoon Center 2001 Japan Meteorological Agency Annual Report 2001 Table of Contents Introduction Page Chapter 1 Operations at the RSMC Tokyo Typhoon Center
Tropical Cyclone Warning System in the Philippines
 Republic of the Philippines Department of Science and Technology PHILIPPINE ATMOSPHERIC GEOPHYSICAL AND ASTRONOMICAL SERVICES ADMINISTRAION (PAGASA) Science Garden Compound, Agham Road, Diliman, Quezon
GAMINGRE 8/1/ of 7
 FYE 09/30/92 JULY 92 0.00 254,550.00 0.00 0 0 0 0 0 0 0 0 0 254,550.00 0.00 0.00 0.00 0.00 254,550.00 AUG 10,616,710.31 5,299.95 845,656.83 84,565.68 61,084.86 23,480.82 339,734.73 135,893.89 67,946.95
7 December 2016 Tokyo Climate Center, Japan Meteorological Agency
 Summary of the 2016 Asian Summer Monsoon 7 December 2016 Tokyo Climate Center, Japan Meteorological Agency This report summarizes the characteristics of the surface climate and atmospheric/oceanographic
WGNE intercomparison of Tropical Cyclone Track forecast, 2007
 WGNE intercomparison of Tropical Cyclone Track forecast, 2007 Chiashi Muroi Numerical Prediction Division Prepared by Hirokatsu Onoda and Takuya Komori (NPD/JMA) History of Project 1991 : It began with
Improvements to, and Verification of, Intraseasonal to Seasonal Prediction of Tropical Cyclogenesis
 Improvements to, and Verification of, Intraseasonal to Seasonal Prediction of Tropical Cyclogenesis David Meyer and Tom Murphree Naval Postgraduate School dwmeyer@nps.edu and murphree@nps.edu 15W (Talas)
On the presence of tropical vortices over the Southeast Asian Sea- Maritime Continent region
 Technical Conference of 50 th Annual Session of Typhoon Committee 2018 On the presence of tropical vortices over the Southeast Asian Sea- Maritime Continent region Nguyen Dang-Quang 1, James Renwick 2,
A Tropical Cyclone with a Very Large Eye
 JANUARY 1999 PICTURES OF THE MONTH 137 A Tropical Cyclone with a Very Large Eye MARK A. LANDER University of Guam, Mangilao, Guam 9 September 1997 and 2 March 1998 1. Introduction The well-defined eye
2016 Hurricane Season Preview
 2016 Hurricane Season Preview Eric Uhlhorn, Ph.D. 1 2 Recap of 2015 Hurricane Season - El Niño played a significant role in activity - Atlantic activity was slightly below normal 11 named storms, 4 hurricanes,
A Synoptic Climatology of Heavy Precipitation Events in California
 A Synoptic Climatology of Heavy Precipitation Events in California Alan Haynes Hydrometeorological Analysis and Support (HAS) Forecaster National Weather Service California-Nevada River Forecast Center
Atmospheric circulation analysis for seasonal forecasting
 Training Seminar on Application of Seasonal Forecast GPV Data to Seasonal Forecast Products 18 21 January 2011 Tokyo, Japan Atmospheric circulation analysis for seasonal forecasting Shotaro Tanaka Climate
Variations of Typhoon Activity in Asia - Global Warming and/or Natural Cycles?
 Variations of Typhoon Activity in Asia - Global Warming and/or Natural Cycles? Johnny Chan Guy Carpenter Asia-Pacific Climate Impact Centre City University of Hong Kong Outline The common perception and
Comparative Study of Dvorak Analysis in the western North Pacific. Naohisa Koide and Shuji Nishimura Forecast Division, Japan Meteorological Agency
 Comparative Study of Dvorak Analysis in the western North Pacific Naohisa Koide and Shuji Nishimura Forecast Division, Japan Meteorological Agency 1. Introduction The United Nations Economic and Social
Ch. 11: Hurricanes. Be able to. Define what hurricane is. Identify the life and death of a hurricane. Identify the ways we track hurricanes.
 Ch. 11: Hurricanes Be able to Define what hurricane is. Identify the life and death of a hurricane. Identify the ways we track hurricanes. What are Hurricanes? Smaller than mid-latitude cyclones. Don t
NAVAL POSTGRADUATE SCHOOL THESIS
 NAVAL POSTGRADUATE SCHOOL MONTEREY, CALIFORNIA THESIS A WEIGHTED CONSENSUS APPROACH TO TROPICAL CYCLONE 96-H AND 120-H TRACK FORECASTING by James R. Hughes March 2007 Thesis Advisor: Second Reader: Russell
ANNOUNCEMENT WMO/ESCAP PANEL ON TROPICAL CYCLONES THIRTY-EIGHTH SESSION NEW DELHI, INDIA
 WMO IMD ESCAP ANNOUNCEMENT THIRTY-EIGHTH SESSION NEW DELHI, INDIA (21-25 February 2011) HISTORICAL BACKGROUND The tropical cyclones are particularly severe in the north Indian Ocean region. The northern
The tropical circulation in the Australian/Asian region November 2006 to April 2007
 Aust. Met. Mag. 56 (2007) 191-202 The tropical circulation in the Australian/Asian region November 2006 to April 2007 Hakeem A. Shaik and Samuel J. Cleland Regional Office, Bureau of Meteorology, Darwin,
I C P A C IGAD Climate Prediction & Applications centre
 s` I C P A C IGAD Climate Prediction & Applications centre Bulletin Issue July 2017 Issue Number: ICPAC/02/303 IGAD Climate Prediction and Applications Centre Monthly Climate Bulletin, June 2017 1. INTRODUCTION
Variations of Typhoon Activity in Asia - Global Warming and/or Natural Cycles?
 Variations of Typhoon Activity in Asia - Global Warming and/or Natural Cycles? Johnny Chan Guy Carpenter Asia-Pacific Climate Impact Centre City University of Hong Kong Tropical Cyclones Affecting the
Life Cycle of Convective Systems over Western Colombia
 Life Cycle of Convective Systems over Western Colombia Meiry Sakamoto Uiversidade de São Paulo, São Paulo, Brazil Colombia Life Cycle of Convective Systems over Western Colombia Convective System (CS)
Comments by William M. Gray (Colorado State University) on the recently published paper in Science by Webster, et al
 on the recently published paper in Science by Webster, et al") Comments by William M. Gray (Colorado State University) on the recently published paper in Science by Webster, et al., titled Changes in tropical cyclone number, duration, and intensity in a warming environment
Comments by William M. Gray (Colorado State University) on the recently published paper in Science by Webster, et al., titled Changes in tropical cyclone number, duration, and intensity in a warming environment
Annual Report on the Activities of the RSMC Tokyo - Typhoon Center 2014
 Annual Report on the Activities of the RSMC Tokyo - Typhoon Center 2014 TY Vongfong 23 UTC, 7 October 2014 Japan Meteorological Agency Annual Report on the Activities of the RSMC Tokyo - Typhoon Center
ARUBA CLIMATOLOGICAL SUMMARY 2017 PRECIPITATION
 ARUBA CLIMATOLOGICAL SUMMARY 2017 PRECIPITATION The total amount of rainfall recorded at Reina Beatrix International Airport for the year 2017 was 391.0 mm. This is 17.1 % below normal ( Figure 1 ). During
Intensity of North Indian Ocean Tropical Cyclones
 Chapter 6 Intensity of North Indian Ocean Tropical Cyclones 6.1 Introduction Intensity of tropical cyclones is dependent on several parameters both thermodynamic and dynamic. It includes thermodynamic
Chiang Rai Province CC Threat overview AAS1109 Mekong ARCC
 Chiang Rai Province CC Threat overview AAS1109 Mekong ARCC This threat overview relies on projections of future climate change in the Mekong Basin for the period 2045-2069 compared to a baseline of 1980-2005.
ARUBA CLIMATOLOGICAL SUMMARY 2014 PRECIPITATION
 ARUBA CLIMATOLOGICAL SUMMARY 2014 PRECIPITATION The total amount of rainfall recorded at Reina Beatrix International Airport for the year 2014 was 309.2 mm. This is 34.4 % below normal ( Figure 1 ). During
Annual Tropical 2013 Cyclone Report 2013
 U.S. Naval Maritime Forecast Center/ Joint Typhoon Warning Center Annual Tropical Pearl Harbor, Cyclone Hawaii Report Annual Tropical 2013 Cyclone Report 2013 ASHLEY D. EVANS Captain, United States Navy
Contributions of Global cloud-resolving model simulations to YOTC
 Contributions of Global cloud-resolving model simulations to YOTC M. Satoh Center for Climate System Research, Univ. of Tokyo Research Institute for Global Change(formery FRCGC), JAMSTEC Courtesy of H.
Application of Satellite analysis in tropical cyclone of CMA
 2 nd International Workshop On Satellite Analysis of Tropical Cyclones (IWSATC-2) Satellite TC Analysis in Operations: Changes since IWSATC-1 17 February 2016 Honolulu, Hawaii, USA Application of Satellite
SMAP Winds. Hurricane Irma Sep 5, AMS 33rd Conference on Hurricanes and Tropical Meteorology Ponte Vedra, Florida, 4/16 4/20, 2018
 Intensity and Size of Strong Tropical Cyclones in 2017 from NASA's SMAP L-Band Radiometer Thomas Meissner, Lucrezia Ricciardulli, Frank Wentz, Remote Sensing Systems, Santa Rosa, USA Charles Sampson, Naval
ICPAC. IGAD Climate Prediction and Applications Centre Monthly Bulletin, May 2017
 s` ICPAC Bulletin Issue June 2017 Issue Number: ICPAC/02/302 IGAD Climate Prediction and Applications Centre Monthly Bulletin, May 2017 For referencing within this bulletin, the Greater Horn of Africa
SH RI Events. Influence From Patterns Of Different Scale
 SH072014 RI Events Influence From Patterns Of Different Scale RI Explanation * Rapid intensification, approximately an increase of 2 Dvorak T-numbers or 30 knots in 24 hours, frequently occurs in JTWC
Hurricane Basics and Preparedness. Jim Weyman Director, Central Pacific Hurricane Center Phone Office:
 Hurricane Basics and Preparedness Jim Weyman Director, Central Pacific Hurricane Center Phone Office: 973-5270 james.weyman@noaa.gov United States Hurricane/Typhoon Centers National Hurricane Center, Miami
Global Climates. Name Date
 Global Climates Name Date No investigation of the atmosphere is complete without examining the global distribution of the major atmospheric elements and the impact that humans have on weather and climate.
SUMMARY OF THE 2011 TYPHOON SEASON
 ECONOMIC AND SOCIAL COMMISSION FOR ASIA AND THE PACIFIC AND WORLD METEOROLOGICAL ORGANIZATION WRD/TC.44/4.1 Add. 2 06 February 2012 Typhoon Committee Forty Fourth Session 06 to 12 February 2012 Hangzhou,
11A.1 PREDICTION OF TROPICAL CYCLONE TRACK FORECAST ERROR FOR HURRICANES KATRINA, RITA, AND WILMA
 11A.1 PREDICTION OF TROPICAL CYCLONE TRACK FORECAST ERROR FOR HURRICANES KATRINA, RITA, AND WILMA James S. Goerss* Naval Research Laboratory, Monterey, California 1. INTRODUCTION Consensus tropical cyclone
Extreme Winds in the Western North Pacific. Søren Ott
 in the Western North Pacific Søren Ott Outline Tropical cyclones and wind turbines Modelling extreme winds Validation Conclusions Cat. 4 tropical cyclone IVAN 15 Sept 2004 at landfall near Luisiana, USA
Outline of 4 Lectures
 Outline of 4 Lectures 1. Sept. 17, 2008: TC best track definition and datasets, global distribution of TCs; Review of history of meteorological satellites, introducing different orbits, scanning patterns,
GEN 3.5 METEOROLOGICAL SERVICES
 AIP GEN 3.5-1 GEN 3.5 METEOROLOGICAL SERVICES 1. RESPONSIBLE SERVICE The meteorological services for civil aviation at Jordan are provided by the Jordanian Meteorological Department. Postal Address: Director
Dust Storm: An Extreme Climate Event in China
 Dust Storm: An Extreme Climate Event in China ZHENG Guoguang China Meteorological Administration Beijing, China, 100081 zgg@cma.gov.cn CONTENTS 1. Climatology of dust storms in China 2. Long-term variation
HIGH-RESOLUTION SATELLITE-DERIVED WIND FIELDS PE (035-71)
") HIGH-RESOLUTION SATELLITE-DERIVED WIND FIELDS PE 0602435 (035-71) Jeffrey D. Hawkins Naval Research Laboratory Monterey, CA 93943-5502 Ph (408) 656-4833/ Fax (408) 656-4769 hawkins@nrlmry.navy.mil LONG-TERM
HIGH-RESOLUTION SATELLITE-DERIVED WIND FIELDS PE 0602435 (035-71) Jeffrey D. Hawkins Naval Research Laboratory Monterey, CA 93943-5502 Ph (408) 656-4833/ Fax (408) 656-4769 hawkins@nrlmry.navy.mil LONG-TERM
COUNTRY REPORT. Jakarta. July, th National Directorate of Meteorology and Geophysics of Timor-Leste (DNMG)
") The Southeastern Asia-Oceania Flash Flood COUNTRY REPORT Jakarta. July, 10-12 th 2017 National Directorate of Meteorology and Geophysics of Timor-Leste (DNMG) Carla Feritas and Crisostimo Lobato Democratic
The Southeastern Asia-Oceania Flash Flood COUNTRY REPORT Jakarta. July, 10-12 th 2017 National Directorate of Meteorology and Geophysics of Timor-Leste (DNMG) Carla Feritas and Crisostimo Lobato Democratic
WELCOME TO THE 2018 RA-IV WORKSHOP ON HURRICANE FORECASTING AND WARNING
 WELCOME TO THE 2018 RA-IV WORKSHOP ON HURRICANE FORECASTING AND WARNING Richard J. Pasch and Daniel P. Brown Senior Hurricane Specialists National Hurricane Center ORIENTATION Use of PCs NHC Facility Workshop
8.1 Attachment 1: Ambient Weather Conditions at Jervoise Bay, Cockburn Sound
 8.1 Attachment 1: Ambient Weather Conditions at Jervoise Bay, Cockburn Sound Cockburn Sound is 20km south of the Perth-Fremantle area and has two features that are unique along Perth s metropolitan coast
NWS Operational Marine and Ocean Forecasting. Overview. Ming Ji. Ocean Prediction Center National Weather Service/NCEP. CIOSS/CoRP
 NWS Operational Marine and Ocean Forecasting Overview Ming Ji Ocean Prediction Center National Weather Service/NCEP CIOSS/CoRP CoRP Symposium Corvallis, OR Aug. 12-13, 13, 2008 Titanic Telegram Marine
Preparation of WC SIGMET Case studies. C.M. Shun Hong Kong Observatory Hong Kong, CHINA
 Preparation of WC SIGMET Case studies C.M. Shun Hong Kong Observatory Hong Kong, CHINA Recap Where to obtain information TCAC Satellite / radar imageries, satellite derived products, NWP When to issue
NOTES AND CORRESPONDENCE. Statistical Postprocessing of NOGAPS Tropical Cyclone Track Forecasts
 1912 MONTHLY WEATHER REVIEW VOLUME 127 NOTES AND CORRESPONDENCE Statistical Postprocessing of NOGAPS Tropical Cyclone Track Forecasts RUSSELL L. ELSBERRY, MARK A. BOOTHE, GREG A. ULSES, AND PATRICK A.
Upgrade of JMA s Typhoon Ensemble Prediction System
 Upgrade of JMA s Typhoon Ensemble Prediction System Masayuki Kyouda Numerical Prediction Division, Japan Meteorological Agency and Masakazu Higaki Office of Marine Prediction, Japan Meteorological Agency
A Climatology of the Extratropical Transition of Tropical Cyclones in the Western North Pacific
 A Climatology of the Extratropical Transition of Tropical Cyclones in the Western North Pacific Naoko KITABATAKE (Meteorological Research Institute / Japan Meteorological Agency) 1 Outline 1. Topic 1:
"STUDY ON THE VARIABILITY OF SOUTHWEST MONSOON RAINFALL AND TROPICAL CYCLONES FOR "
 "STUDY ON THE VARIABILITY OF SOUTHWEST MONSOON RAINFALL AND TROPICAL CYCLONES FOR 2001 2010" ESPERANZA O. CAYANAN, Ph.D. Chief, Climatology & Agrometeorology R & D Section Philippine Atmospheric Geophysical
2017 Year in review: JTWC TC Activity, Forecast Challenges, and Developmental Priorities
 2017 Year in review: JTWC TC Activity, Forecast Challenges, and Developmental Priorities Mean Annual TC Activity????????? Hurricane Forecast Improvement Program Annual Review 8-9 NOV 2017 Brian Strahl,
An Objective Algorithm for the Identification of Convective Tropical Cloud Clusters in Geostationary Infrared Imagery. Why?
 An Objective Algorithm for the Identification of Convective Tropical Cloud Clusters in Geostationary Infrared Imagery By Chip Helms Faculty Advisor: Dr. Chris Hennon Why? Create a database for the tropical
UNDERSTANDING STORM TIDES
 UNDERSTANDING STORM TIDES Run from the water, hide from the wind.. CATEGORY CATEGORY CATEGORY CATEGORY CATEGORY 1 2 3 4 5 WIND 74-95 mph 64-82 knots 96-110 mph 83-95 knots 111-130 mph 96-113 knots 131-155
Assessment of the Impact of El Niño-Southern Oscillation (ENSO) Events on Rainfall Amount in South-Western Nigeria
 Events on Rainfall Amount in South-Western Nigeria") 2016 Pearl Research Journals Journal of Physical Science and Environmental Studies Vol. 2 (2), pp. 23-29, August, 2016 ISSN 2467-8775 Full Length Research Paper http://pearlresearchjournals.org/journals/jpses/index.html
2016 Pearl Research Journals Journal of Physical Science and Environmental Studies Vol. 2 (2), pp. 23-29, August, 2016 ISSN 2467-8775 Full Length Research Paper http://pearlresearchjournals.org/journals/jpses/index.html
I C P A C. IGAD Climate Prediction and Applications Centre Monthly Climate Bulletin, Climate Review for September 2017
 Bulletin Issue October 2017 I C P A C IGAD Climate Prediction and Applications Centre Monthly Climate Bulletin, Climate Review for September 2017 1. INTRODUCTION This bulletin reviews the September 2017
OVERVIEW OF IMPROVED USE OF RS INDICATORS AT INAM. Domingos Mosquito Patricio
 OVERVIEW OF IMPROVED USE OF RS INDICATORS AT INAM Domingos Mosquito Patricio domingos.mosquito@gmail.com Introduction to Mozambique /INAM Introduction to AGRICAB/SPIRITS Objectives Material & Methods Results
Waves and Weather. 1. Where do waves come from? 2. What storms produce good surfing waves? 3. Where do these storms frequently form?
 Waves and Weather 1. Where do waves come from? 2. What storms produce good surfing waves? 3. Where do these storms frequently form? 4. Where are the good areas for receiving swells? Where do waves come
Tropical Cyclone Megh
 Tropical Cyclone Megh 4-10 November 2015 NE Somalia and S Yemen Desert Locust Information Service FAO, Rome www.fao.org/ag/locusts Keith Cressman (Senior Locust Forecasting Officer) 04/11/2015 Tropical
Fiji Islands Weather Summary December 2005 Rainfall Outlook till March 2006
 Volume 5: Issue: 12 Inside this issue: In Brief and Weather Patterns 1 Table in three Months Forecast Verification and Graphs (Nadi, Labasa and Suva) Other Climatic variables and New Records Table 4 2
August Forecast Update for Atlantic Hurricane Activity in 2012
 August Forecast Update for Atlantic Hurricane Activity in 2012 Issued: 6 th August 2012 by Professor Mark Saunders and Dr Adam Lea Dept. of Space and Climate Physics, UCL (University College London), UK
UPDATE OF REGIONAL WEATHER AND SMOKE HAZE (December 2017)
") UPDATE OF REGIONAL WEATHER AND SMOKE HAZE (December 2017) 1. Review of Regional Weather Conditions for November 2017 1.1 In November 2017, Southeast Asia experienced inter-monsoon conditions in the first
UPDATE OF REGIONAL WEATHER AND SMOKE HAZE (December 2017) 1. Review of Regional Weather Conditions for November 2017 1.1 In November 2017, Southeast Asia experienced inter-monsoon conditions in the first
(April 7, 2010, Wednesday) Tropical Storms & Hurricanes Part 2
 Tropical Storms & Hurricanes Part 2") Lecture #17 (April 7, 2010, Wednesday) Tropical Storms & Hurricanes Part 2 Hurricane Katrina August 2005 All tropical cyclone tracks (1945-2006). Hurricane Formation While moving westward, tropical disturbances
Lecture #17 (April 7, 2010, Wednesday) Tropical Storms & Hurricanes Part 2 Hurricane Katrina August 2005 All tropical cyclone tracks (1945-2006). Hurricane Formation While moving westward, tropical disturbances
Tropical Storm List
 Tropical Storm Email List http://tstorms.org/ tropical-storms@tstorms.org Tropical-Storms is a mailing list only for those who are professionally active in either the research or forecasting of tropical
SYSTEM BRIEF DAILY SUMMARY
 SYSTEM BRIEF DAILY SUMMARY * ANNUAL MaxTemp NEL (MWH) Hr Ending Hr Ending LOAD (PEAK HOURS 7:00 AM TO 10:00 PM MON-SAT) ENERGY (MWH) INCREMENTAL COST DAY DATE Civic TOTAL MAXIMUM @Max MINIMUM @Min FACTOR
The Impacts on Extended-Range Predictability of Midlatitude Weather Patterns due to Recurving Tropical Cyclones
 The Impacts on Extended-Range Predictability of Midlatitude Weather Patterns due to Recurving Tropical Cyclones Patrick A. Harr and Heather M. Archambault Naval Postgraduate School, Monterey, CA Hurricane
Yellow Sea Thermohaline and Acoustic Variability
 Yellow Sea Thermohaline and Acoustic Variability Peter C Chu, Carlos J. Cintron Naval Postgraduate School, USA Steve Haeger Naval Oceanographic Office, USA Yellow Sea Bottom Sediment Chart Four Bottom
What is the difference between Weather and Climate?
 What is the difference between Weather and Climate? Objective Many people are confused about the difference between weather and climate. This makes understanding the difference between weather forecasts
Experiments with a Simple Tropical Cyclone Intensity Consensus
 304 W E A T H E R A N D F O R E C A S T I N G VOLUME 23 Experiments with a Simple Tropical Cyclone Intensity Consensus CHARLES R. SAMPSON Naval Research Laboratory, Monterey, California JAMES L. FRANKLIN
Introduction forecast Procedure of National Typhoon Center / KMA
 The 6 th China-Korea Joint Workshop on Tropical Cyclones (26 May-1 June, 2013) Introduction forecast Procedure of National Typhoon Center / KMA Lee, Jae-shin(jaeshin_l@yahoo.com) National Typhoon Center(NTC)
Evaluating a Genesis Potential Index with Community Climate System Model Version 3 (CCSM3) By: Kieran Bhatia
 By: Kieran Bhatia") Evaluating a Genesis Potential Index with Community Climate System Model Version 3 (CCSM3) By: Kieran Bhatia I. Introduction To assess the impact of large-scale environmental conditions on tropical cyclone
Evaluating a Genesis Potential Index with Community Climate System Model Version 3 (CCSM3) By: Kieran Bhatia I. Introduction To assess the impact of large-scale environmental conditions on tropical cyclone
Predicting Tropical Cyclone Genesis
 DISTRIBUTION STATEMENT A. Approved for public release; distribution is unlimited. Predicting Tropical Cyclone Genesis PI: Melinda S. Peng Naval Research Laboratory Monterey CA 93943-5502 Phone: (831) 656-4704
Interpretation of Outputs from Numerical Prediction System
 Interpretation of Outputs from Numerical Prediction System Hiroshi OHNO Tokyo Climate Center (TCC)/ Climate Prediction Division of Japan Meteorological Agency (JMA) Procedure of Seasonal Forecast (1) 1.
Comments on: Increasing destructiveness of tropical cyclones over the past 30 years by Kerry Emanuel, Nature, 31 July 2005, Vol. 436, pp.
 Comments on: Increasing destructiveness of tropical cyclones over the past 30 years by Kerry Emanuel, Nature, 31 July 2005, Vol. 436, pp. 686-688 William M. Gray Department of Atmospheric Science Colorado
Climatography of the United States No
 Climate Division: AK 5 NWS Call Sign: ANC Month (1) Min (2) Month(1) Extremes Lowest (2) Temperature ( F) Lowest Month(1) Degree s (1) Base Temp 65 Heating Cooling 90 Number of s (3) Jan 22.2 9.3 15.8
The Climate of Payne County
 The Climate of Payne County Payne County is part of the Central Great Plains in the west, encompassing some of the best agricultural land in Oklahoma. Payne County is also part of the Crosstimbers in the
Satellite-derived environmental drivers for top predator hotspots
 Satellite-derived environmental drivers for top predator hotspots Peter Miller @PeterM654 South West Marine Ecosystems 2017 21 Apr. 2017, Plymouth University Satellite environmental drivers for hotspots
Activities and Outlook related to Disaster Reduction in CMA
 Activities and Outlook related to Disaster Reduction in CMA WANG Bangzhong China Meteorological Administration March 15-17 2006 ADENDA Situation about MD and related disasters in CHINA Guidance for MD/RD
ALASKA REGION CLIMATE FORECAST BRIEFING. October 27, 2017 Rick Thoman National Weather Service Alaska Region
 ALASKA REGION CLIMATE FORECAST BRIEFING October 27, 2017 Rick Thoman National Weather Service Alaska Region Today Feature of the month: West Pacific Typhoons Climate Forecast Basics Climate System Review