Weather Overnight. Income (I) Running total
|
|
|
- Lynne Horn
- 6 years ago
- Views:
Transcription
1 GAME TABLE :Team Day Inshore Offshore Overnight Income (I) Costs (C) Profit (I-C) Running total GAME TABLE :Team 2 Day Inshore Offshore Overnight Income (I) Costs (C) Profit (I-C) Running total
2 GAME TABLE :Team Day Inshore Offshore Overnight Income (I) Costs (C) Profit (I-C) Running total GAME TABLE :Team Day Inshore Offshore Overnight Income (I) Costs (C) Profit (I-C) Running total
3 GAME TABLE :Team Day Inshore Offshore Overnight Income (I) Costs (C) Profit (I-C) Running total GAME TABLE :Team 6 Day Inshore Offshore Overnight Income (I) Costs (C) Profit (I-C) Running total
4 Risk and Reward (Teacher s notes) These notes are intended to assist the teachers working with groups of students at a table, they give an overview of the lesson and suggestions on how to get the most from the activity. Each table will need: A six sided die One set of student sheets per student Short introduction : One of the aims of the new Core Maths qualifications is to show how mathematics is used almost every day, in work and other aspects of our lives. This activity shows just one situation, there are many more which use exactly the same mathematical ideas. The theme of this activity is risk and reward. It is a game designed to make you think about how you make decisions which involve an element of risk. Mathematicians often use games to investigate how people react in situations and decide on winning strategies. Although it can mean other things, a winning strategy generally means the one which we gain the most from, for example in business this could be the most profitable. The activity will provide opportunities to discuss common misunderstandings such as Gambler s Fallacy, and think about the model and the assumptions, for example: Is it fair to assume that the will always catch a lobster or be washed away in bad weather? Will the probability of good weather increase in summer and decrease in winter? Introducing the game Although it is possible for everyone to play as individuals, playing as pairs makes the task of playing and recording easier and tends to increase discussion when deciding on where to place the. Run through the instructions getting the students to fill in the sheet ready for the first day. (See the students sheet(s) at the end of this document). When everyone has made the decision of where to place their for the first day, roll the die and determine the weather, it is probably better if you do this. Play the game for a short time, aim to allow the students time to experience the process of decision making. (-0 rounds) Some things to look out for whilst playing the game: Are they quite risk averse at the start but gradually take more risks as the game progresses? How do students react after a good round/bad round? Sometimes, after a bad round, students take more risks to try and gain a larger profit on the next round. Sometimes students also take more risks after a good round because they feel they are playing with winnings rather than their own cash. You could discuss the pitfalls of such approaches. Comments like It s been good weather for the last three or four rounds, it s more likely to be bad weather on the next round. Although over a long run the weather should balance out to the expected probabilities this does not
5 Number of days influence individual rounds. Just like when flipping a coin, we expect roughly equal amounts of heads and tails, but on each flip the probability of heads remains ½. Discussing the game Aim to bring out the points mentioned above under some things to look out for. At some point before introducing the weather simulation data the person leading the session will attempt to bring things together. It may be possible for the presenter to quickly collect data from each group and arrive at a figure for each of the number of good days, bad days and hurricanes, in total. The presenter will then introduce the idea of using a computer model to gather data for a year. The presenter will then suggest working with the simulated weather data and work will resume at tables. Then introduce the weather simulation data. Use the first question and the prompt on the student sheet to encourage the students to consider how this data could be used by the lobster pot businesses. Give them time to think and offer suggestions. You are looking to prompt them towards working out the anticipated profits over the course of a year for an offshore and inshore pot. For example using the data in the first diagram on the weather simulation data sheet see below. Simulated For Year Bad Days Good Days Hurricanes There are 69 bad days, 290 good days, and hurricanes, on the 69 bad days an offshore pot will be lost making a loss of 6, or profit of - 6, over the simulated year this would amount to 69 x - 6 which is -. On the 290 good days an offshore pot makes per day making a total of 290 x which is 0. Finally on the days when there is a hurricane a loss of 6, or profit of - 6, is incurred on each of the days making a total loss of 0. If a pot was placed offshore every day for a year then the business would anticipate earning (69 x - 6) + (290 x ) + ( x - 6) = 006
6 The inshore pot makes on a good day, on a bad day and - 6 when there is a hurricane, so for an inshore pot, the profit for year would be (69 x ) + (290 x ) + (x- 6) = 88 In this year placing the pot inshore would have been more profitable. Here are the values for all simulations Year Year 2 Year Year Bad Days Good Days Hurricane Offshore Profit,006,09,60,0 Inshore Profit,8,22,79,8 Finish by considering the final question. Would this strategy win every single round? You are aiming to get them to see that although the earnings over a year tends to be better for the inshore, each individual round is subject to random chance. It is easy to check back and see how many times the offshore were better in the previous gameplay. Ask the students to look back at their game and see. The presenter will at an appropriate point gather the class together to round off the session. If your students have reached this stage please consider the extension below. Extending the task On the Year simulation (7 bad days, 0 good days, and hurricanes) the anticipated earnings from inshore and offshore were almost equal. Challenge the students to find a set of data that make the anticipated earnings from inshore and offshore equal. Is this possible? Is it likely? Are there more than one set of values? Thinking solution As hurricanes affect the income from inshore and offshore in same way, the number of hurricanes can be ignored. For every good day the offshore pot gains an extra 2 over the inshore pot. (ie offshore, inshore ) For every bad day the offshore loses to the inshore pot. (ie offshore - 6, inshore ) This means for every bad day the offshore pot needs. good days to stay on equal terms. Providing that this condition is met the values of both should be the same. The number of hurricanes would be 6 (good days + bad days). For example, 6 good days 08 bad days and one hurricane. Within the constraints of the problem this means the bad days must be an even number, and the combined total of good days and bad days cannot exceed 6, one year.
7 Using algebra a = good days b = bad days and c = hurricanes we need a -6b 6c = a + b 6c a -6b = a + b 2a = b a =.b

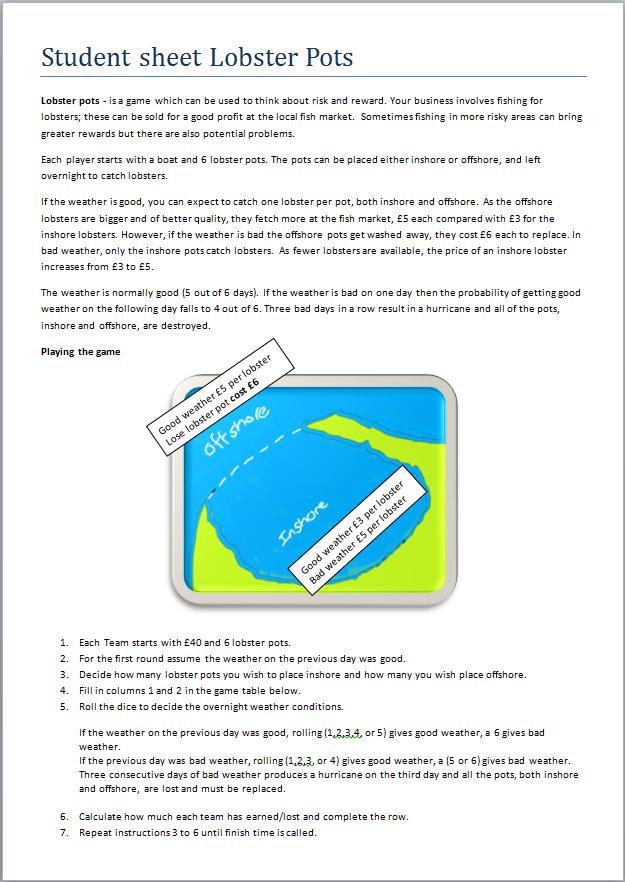
8 Student sheet Lobster Pots Lobster - is a game which can be used to think about risk and reward. Your business involves fishing for lobsters; these can be sold for a good profit at the local fish market. Sometimes fishing in more risky areas can bring greater rewards but there are also potential problems. Each player starts with a boat and 6 lobster. The can be placed either inshore or offshore, and left overnight to catch lobsters. If the weather is good, you can expect to catch one lobster per pot, both inshore and offshore. As the offshore lobsters are bigger and of better quality, they fetch more at the fish market, each compared with for the inshore lobsters. However, if the weather is bad the offshore get washed away, they cost 6 each to replace. In bad weather, only the inshore catch lobsters. As fewer lobsters are available, the price of an inshore lobster increases from to. The weather is normally good ( out of 6 days). If the weather is bad on one day then the probability of getting good weather on the following day falls to out of 6. Three bad days in a row result in a hurricane and all of the, inshore and offshore, are destroyed. Playing the game. Each Team starts with 0 and 6 lobster. 2. For the first round assume the weather on the previous day was good.. Decide how many lobster you wish to place inshore and how many you wish place offshore.. Fill in columns and 2 in the game table below.. Roll the dice to decide the overnight weather conditions. If the weather on the previous day was good, rolling (,2,,, or ) gives good weather, a 6 gives bad weather. If the previous day was bad weather, rolling (,2,, or ) gives good weather, a ( or 6) gives bad weather. Three consecutive days of bad weather produces a hurricane on the third day and all the, both inshore and offshore, are lost and must be replaced. 6. Calculate how much each team has earned/lost and complete the row. 7. Repeat instructions to 6 until finish time is called.
9 GAME TABLE :Team Day Inshore Offshore Overnight Income (I) Costs (C) Profit (I-C) Running total GAME TABLE :Team 2 Day Inshore Offshore Overnight Income (I) Costs (C) Profit (I-C) Running total
10 GAME TABLE :Team Day Inshore Offshore Overnight Income (I) Costs (C) Profit (I-C) Running total GAME TABLE :Team Day Inshore Offshore Overnight Income (I) Costs (C) Profit (I-C) Running total
11 GAME TABLE :Team Day Inshore Offshore Overnight Income (I) Costs (C) Profit (I-C) Running total GAME TABLE :Team 6 Day Inshore Offshore Overnight Income (I) Costs (C) Profit (I-C) Running total
12 Number of days Number of days Number of days Number of days simulation data This weather data was produced by a spreadsheet which simulated playing for 6 days. Simulated For Year Simulated For Year Bad Days Good Days Hurricanes 0 0 Bad Days Good Days Hurricanes Simulated For Year Simulated For Year Bad Days Good Days Hurricanes Bad Days Good Days Hurricanes How could this data be used by the lobster pot players? Use the data to suggest a strategy which could prove successful if the game were played for 6 rounds. Would this strategy win every single round?

13
14 About MEI Registered charity committed to improving mathematics education Independent UK curriculum development body We offer continuing professional development courses, provide specialist tuition for students and work with industry to enhance mathematical skills in the workplace We also pioneer the development of innovative teaching and learning resources

15 Statistical and financial modelling


16 Modelling cycle problem???? problem???? good enough? solution solution PPPP
17 Business Simulation
18 The rules
19 Your data Table Good days Bad days Hurricanes Totals How could this data help you to decide where to place your? Would the data be exactly the same if we played the game again?
20 Text simulation for a year

21 Exam question
22 Financial modelling
23 6.0.0 CPI inflation (%) Jun- Sep- Dec- Apr-2 Jul-2 Oct-2 gallon =. litres Mr Green drove 67 miles on business last year. His car does an average of 2. miles per gallon. Unleaded petrol, per litre (p) Estimate how much Mr Green will spend on petrol for business journeys next year. 0 0 Jun- Sep- Dec- Apr-2 Jul-2 Oct-2
24 Financial modelling - mortgage
25 Student sheet Lobster Pots Lobster - is a game which can be used to think about risk and reward. Your business involves fishing for lobsters; these can be sold for a good profit at the local fish market. Sometimes fishing in more risky areas can bring greater rewards but there are also potential problems. Each player starts with a boat and 6 lobster. The can be placed either inshore or offshore, and left overnight to catch lobsters. If the weather is good, you can expect to catch one lobster per pot, both inshore and offshore. As the offshore lobsters are bigger and of better quality, they fetch more at the fish market, each compared with for the inshore lobsters. However, if the weather is bad the offshore get washed away, they cost 6 each to replace. In bad weather, only the inshore catch lobsters. As fewer lobsters are available, the price of an inshore lobster increases from to. The weather is normally good ( out of 6 days). If the weather is bad on one day then the probability of getting good weather on the following day falls to out of 6. Three bad days in a row result in a hurricane and all of the, inshore and offshore, are destroyed. Playing the game. Each Team starts with 0 and 6 lobster. 2. For the first round assume the weather on the previous day was good.. Decide how many lobster you wish to place inshore and how many you wish place offshore.. Fill in columns and 2 in the game table below.. Roll the dice to decide the overnight weather conditions. If the weather on the previous day was good, rolling (,2,,, or ) gives good weather, a 6 gives bad weather. If the previous day was bad weather, rolling (,2,, or ) gives good weather, a ( or 6) gives bad weather. Three consecutive days of bad weather produces a hurricane on the third day and all the, both inshore and offshore, are lost and must be replaced. 6. Calculate how much each team has earned/lost and complete the row. 7. Repeat instructions to 6 until finish time is called.
26 Number of days Number of days Number of days Number of days simulation data This weather data was produced by a spreadsheet which simulated playing for 6 days. Simulated For Year Simulated For Year Bad Days Good Days Hurricanes 0 0 Bad Days Good Days Hurricanes Simulated For Year Simulated For Year Bad Days Good Days Hurricanes Bad Days Good Days Hurricanes How could this data be used by the lobster pot players? Use the data to suggest a strategy which could prove successful if the game were played for 6 rounds. Would this strategy win every single round?
CIMA Dates and Prices Online Classroom Live September August 2016
 CIMA Dates and Prices Online Classroom Live September 2015 - August 2016 This document provides detail of the programmes that are being offered for the Objective Tests and Integrated Case Study Exams from
Vector and scalar quantities
 Vector and scalar quantities A scalar quantity is defined only by its magnitude (or size) for example: distance, speed, time. It is easy to combine two or more scalar quantities e.g. 2 metres + 3 metres
MEI Conference Preparing to teach motion graphs. Sharon Tripconey.
 MEI Conference 2016 Preparing to teach motion graphs Sharon Tripconey sharon.tripconey@mei.org.uk 1 of 5 Preparing to teach motion graphs June 2016 MEI Kinematics content extracts for reformed Mathematics
CIMA Professional 2018
 CIMA Professional 2018 Interactive Timetable Version 16.25 Information last updated 06/08/18 Please note: Information and dates in this timetable are subject to change. A better way of learning that s
CIMA Professional
 CIMA Professional 201819 Birmingham Interactive Timetable Version 3.1 Information last updated 12/10/18 Please note: Information and dates in this timetable are subject to change. A better way of learning
CIMA Professional
 CIMA Professional 201819 Manchester Interactive Timetable Version 3.1 Information last updated 12/10/18 Please note: Information and dates in this timetable are subject to change. A better way of learning
CIMA Professional 2018
 CIMA Professional 2018 Newcastle Interactive Timetable Version 10.20 Information last updated 12/06/18 Please note: Information and dates in this timetable are subject to change. A better way of learning
From M&Ms to Mathematics, or, How I learned to answer questions and help my kids love math.
 From M&Ms to Mathematics, or, How I learned to answer questions and help my kids love math. Steven J. Miller, Williams College Steven.J.Miller@williams.edu http://web.williams.edu/mathematics/sjmiller/public_html/
Teaching Statistics in the new A level using graphing technology. Cath Moore
 Teaching Statistics in the new A level using graphing technology Cath Moore cath.moore@mei.org.uk Overarching themes and use of technology Paragraph 8 of the Content Document states that 8.The use of technology,
From M&Ms to Mathematics, or, How I learned to answer questions and help my kids love math.
 From M&Ms to Mathematics, or, How I learned to answer questions and help my kids love math. Steven J. Miller, Williams College sjm1@williams.edu, Steven.Miller.MC.96@aya.yale.edu (with Cameron and Kayla
Chapter 14. From Randomness to Probability. Copyright 2012, 2008, 2005 Pearson Education, Inc.
 Chapter 14 From Randomness to Probability Copyright 2012, 2008, 2005 Pearson Education, Inc. Dealing with Random Phenomena A random phenomenon is a situation in which we know what outcomes could happen,
In this activity, students will compare weather data from to determine if there is a warming trend in their community.
 Overview: In this activity, students will compare weather data from 1910-2000 to determine if there is a warming trend in their community. Objectives: The student will: use the Internet to locate scientific
The Conditions are Right
 The Conditions are Right Standards Addressed in this Task MCC9-12.S.CP.2 Understand that two events A and B are independent if the probability of A and B occurring together is the product of their probabilities,
Go to Grade 6 Everyday Mathematics Sample Lesson
 McGraw-Hill makes no representations or warranties as to the accuracy of any information contained in this McGraw-Hill Material, including any warranties of merchantability or fitness for a particular
Computations - Show all your work. (30 pts)
") Math 1012 Final Name: Computations - Show all your work. (30 pts) 1. Fractions. a. 1 7 + 1 5 b. 12 5 5 9 c. 6 8 2 16 d. 1 6 + 2 5 + 3 4 2.a Powers of ten. i. 10 3 10 2 ii. 10 2 10 6 iii. 10 0 iv. (10 5
Math 1012 Final Name: Computations - Show all your work. (30 pts) 1. Fractions. a. 1 7 + 1 5 b. 12 5 5 9 c. 6 8 2 16 d. 1 6 + 2 5 + 3 4 2.a Powers of ten. i. 10 3 10 2 ii. 10 2 10 6 iii. 10 0 iv. (10 5
ACCA Interactive Timetable
 ACCA Interactive Timetable 2018 Professional Version 7.1 Information last updated 15th May 2018 Please note: Information and dates in this timetable are subject to change. A better way of learning that
First Digit Tally Marks Final Count
 Benford Test () Imagine that you are a forensic accountant, presented with the two data sets on this sheet of paper (front and back). Which of the two sets should be investigated further? Why? () () ()
MEI Extra Pure: Groups
 MEI Extra Pure: Groups Claire Baldwin FMSP Central Coordinator claire.baldwin@mei.org.uk True or False activity Sort the cards into two piles by determining whether the statement on each card is true or
ACCA Interactive Timetable
 ACCA Interactive Timetable 2018 Professional Version 4.1 Information last updated 1st May 2018 Please note: Information and dates in this timetable are subject to change. A better way of learning that
ACCA Interactive Timetable
 ACCA Interactive Timetable 2018 Professional Version 6.1 Information last updated 6th June 2018 Please note: Information and dates in this timetable are subject to change. A better way of learning that
ACCA Interactive Timetable
 ACCA Interactive Timetable 2018 Professional Version 5.1 Information last updated 2nd May 2018 Please note: Information and dates in this timetable are subject to change. A better way of learning that
RISKy Business: An In-Depth Look at the Game RISK
 Rose-Hulman Undergraduate Mathematics Journal Volume 3 Issue Article 3 RISKy Business: An In-Depth Look at the Game RISK Sharon Blatt Elon University, slblatt@hotmail.com Follow this and additional works
ACCA Interactive Timetable
 ACCA Interactive Timetable 2018 Professional Version 3.1 Information last updated 1st May 2018 Please note: Information and dates in this timetable are subject to change. A better way of learning that
Vector and scalar quantities
 Vector and scalar quantities A scalar quantity is defined only by its magnitude (or size) for example: distance, speed, time. It is easy to combine two or more scalar quantities e.g. 2 metres + 3 metres
ACCA Interactive Timetable
 ACCA Interactive Timetable 2018 Professional Version 3.1 Information last updated 1st May 2018 Please note: Information and dates in this timetable are subject to change. A better way of learning that
ACCA Interactive Timetable & Fees
 ACCA Interactive Timetable & Fees 2018/19 Professional Version 1.1 Information last updated tember 2018 Please note: Information and dates in this timetable are subject to change. A better way of learning
Using Graphical Calculators in the new A level Maths. Tom Button Simon May
 Using Graphical Calculators in the new A level Maths Tom Button tom.button@mei.org.uk Simon May simon.may@nulc.ac.uk Plot these curves Answers Ofqual guidance for awarding organisations The use of technology,
ACCA Interactive Timetable & Fees
 ACCA Interactive Timetable & Fees 2018/19 Professional Version 1.1 Information last updated tember 2018 Please note: Information and dates in this timetable are subject to change. A better way of learning
Manipulating Radicals
 Lesson 40 Mathematics Assessment Project Formative Assessment Lesson Materials Manipulating Radicals MARS Shell Center University of Nottingham & UC Berkeley Alpha Version Please Note: These materials
Name: Practice Final Exam May 8, 2012
 Math 00 Finite Math Practice Final Exam May 8, 0 Name: Be sure that you have all 7 pages of the test. The exam lasts for hours. The Honor Code is in effect for this examination, including keeping your
Ebook Code: REAU4045. The Earth & Life Science Series. Weather. Science activities for 6 to 9 year olds
 Ebook Code: REAU4045 The Earth & Life Science Series Weather Science activities for 6 to 9 year olds Written by Judy Gabrovec. Ready-Ed Publications - 2005. Published by Ready-Ed Publications (2005) P.O.
ACCA Interactive Timetable & Fees
 ACCA Interactive Timetable & Fees 2018/19 Professional Version 1.1 Information last updated tember 2018 Please note: Information and dates in this timetable are subject to change. A better way of learning
ACCA Interactive Timetable & Fees
 ACCA Interactive Timetable & Fees 2018 Professional Version 4.1 Information last updated 11th September 2018 Please note: Information and dates in this timetable are subject to change. A better way of
ACCA Interactive Timetable & Fees
 ACCA Interactive Timetable & Fees 2018/19 Professional Version 2.1 Information last updated uary 2019 Please note: Information and dates in this timetable are subject to change. A better way of learning
The dean s dilemma. Marsha Jance Indiana University East
 The dean s dilemma Marsha Jance Indiana University East ABSTRACT A case study that focuses on integer linear programming techniques and can be used in an operations management, management science, spreadsheet
ACCA Interactive Timetable & Fees
 ACCA Interactive Timetable & Fees 2018/19 Professional London Version 1.1 Information last updated 3 October 2018 Please note: Information and dates in this timetable are subject to change. A better way
Math 1313 Experiments, Events and Sample Spaces
 Math 1313 Experiments, Events and Sample Spaces At the end of this recording, you should be able to define and use the basic terminology used in defining experiments. Terminology The next main topic in
ACCA Interactive Timetable & Fees
 ACCA Interactive Timetable & Fees 2018/19 Professional Milton Keynes Version 1.1 Information last updated tember 2018 Please note: Information and dates in this timetable are subject to change. A better
MATH STUDENT BOOK. 12th Grade Unit 9
 MATH STUDENT BOOK 12th Grade Unit 9 Unit 9 COUNTING PRINCIPLES MATH 1209 COUNTING PRINCIPLES INTRODUCTION 1. PROBABILITY DEFINITIONS, SAMPLE SPACES, AND PROBABILITY ADDITION OF PROBABILITIES 11 MULTIPLICATION
AQA Statistics 1. Probability. Section 1: Introducing Probability. Notation
 Notes and Examples AQA Statistics 1 Probability Section 1: Introducing Probability These notes contain subsections on Notation The complement of an event Probability of either one event or another Notation
ACCA Interactive Timetable & Fees
 ACCA Interactive Timetable & Fees 2018/19 Professional Version 3.1 Information last updated 1st May 2018 Please note: Information and dates in this timetable are subject to change. A better way of learning
Science Skills Station
 Science Skills Station Objective 1. Graph data to study the relationships between kinetic energy, velocity and mass. 2. Analyze and interpret graphical displays to describe how kinetic energy of an object
ACCA Interactive Timetable
 ACCA Interactive Timetable 2018 Professional Version 9.1 Information last updated 18 July 2018 Please note: Information and dates in this timetable are subject to change. A better way of learning that
Unit 4: Inequalities. Inequality Symbols. Algebraic Inequality. Compound Inequality. Interval Notation
 Section 4.1: Linear Inequalities Section 4.2: Solving Linear Inequalities Section 4.3: Solving Inequalities Applications Section 4.4: Compound Inequalities Section 4.5: Absolute Value Equations and Inequalities
Adding Integers with Different Signs. ESSENTIAL QUESTION How do you add integers with different signs? COMMON CORE. 7.NS.1, 7.NS.
 ? LESSON 1.2 Adding Integers with Different Signs ESSENTIAL QUESTION How do you add integers with different signs? 7.NS.1 Apply and extend previous understandings of addition and subtraction to add and
Chapter 35 out of 37 from Discrete Mathematics for Neophytes: Number Theory, Probability, Algorithms, and Other Stuff by J. M. Cargal.
 35 Mixed Chains In this chapter we learn how to analyze Markov chains that consists of transient and absorbing states. Later we will see that this analysis extends easily to chains with (nonabsorbing)
ACCA Interactive Timetable
 ACCA Interactive Timetable 2018 Professional Version 3.1 Information last updated 1st May 2018 Book Please online note: atinformation and dates in this timetable are subject Or to change. call -enrol A
Chapter 2 - Lessons 1 & 2 Studying Geography, Economics
 Chapter 2 - Lessons 1 & 2 Studying Geography, Economics How does geography influence the way people live? Why do people trade? Why do people form governments? Lesson 1 - How Does Geography Influence the
ACCA Interactive Timetable & Fees
 ACCA Interactive Timetable & Fees 2018/19 Professional Version 2.1 Information last updated 01 November 2018 Please note: Information and dates in this timetable are subject to change. A better way of
MATH 3C: MIDTERM 1 REVIEW. 1. Counting
 MATH 3C: MIDTERM REVIEW JOE HUGHES. Counting. Imagine that a sports betting pool is run in the following way: there are 20 teams, 2 weeks, and each week you pick a team to win. However, you can t pick
ACCA Interactive Timetable & Fees
 ACCA Interactive Timetable & Fees 2018/19 Professional Version 1.1 Information last updated tember 2018 Please note: Information and dates in this timetable are subject to change. A better way of learning
GRADE 1 SUPPLEMENT. Set C3 Geometry: 2-D Shapes Around Us Calendar Pattern. Includes. Skills & Concepts. November Calendar Pattern C3.
 GRADE 1 SUPPLEMENT Set C3 Geometry: 2-D Shapes Around Us Calendar Pattern Includes November Calendar Pattern C3.1 Skills & Concepts H identify, name, and describe 2-D geometric shapes, regardless of orientation,
GRADE 1 SUPPLEMENT. Set C3 Geometry: 2-D Shapes Around Us Calendar Pattern. Includes. Skills & Concepts. November Calendar Pattern C3.
 GRADE 1 SUPPLEMENT Set C3 Geometry: 2-D Shapes Around Us Calendar Pattern Includes November Calendar Pattern C3.1 Skills & Concepts H identify, name, and describe two-dimensional geometric shapes, regardless
Climate Change. Presenter s Script
 General Instructions Presenter s Script You will have 15 minutes to present your activity. When you hear the air horn blow, you will begin your presentation (please do not start presenting until the air
Understanding and Using Variables
 Algebra is a powerful tool for understanding the world. You can represent ideas and relationships using symbols, tables and graphs. In this section you will learn about Understanding and Using Variables
NANYANG TECHNOLOGICAL UNIVERSITY SEMESTER I EXAMINATION MH4702/MAS446/MTH437 Probabilistic Methods in OR
 NANYANG TECHNOLOGICAL UNIVERSITY SEMESTER I EXAMINATION 2013-201 MH702/MAS6/MTH37 Probabilistic Methods in OR December 2013 TIME ALLOWED: 2 HOURS INSTRUCTIONS TO CANDIDATES 1. This examination paper contains
V. RANDOM VARIABLES, PROBABILITY DISTRIBUTIONS, EXPECTED VALUE
 V. RANDOM VARIABLES, PROBABILITY DISTRIBUTIONS, EXPECTED VALUE A game of chance featured at an amusement park is played as follows: You pay $ to play. A penny a nickel are flipped. You win $ if either
1,1 1,2 1,3 1,4 1,5 1,6 2,1 2,2 2,3 2,4 2,5 2,6 3,1 3,2 3,3 3,4 3,5 3,6 4,1 4,2 4,3 4,4 4,5 4,6 5,1 5,2 5,3 5,4 5,5 5,6 6,1 6,2 6,3 6,4 6,5 6,6
 Name: Math 4 ctivity 9(Due by EOC Dec. 6) Dear Instructor or Tutor, These problems are designed to let my students show me what they have learned and what they are capable of doing on their own. Please
South Pacific Form Seven Certificate
 141/1 South Pacific Form Seven Certificate INSTRUCTIONS MATHEMATICS WITH STATISTICS 2015 QUESTION and ANSWER BOOKLET Time allowed: Two and a half hours Write your Student Personal Identification Number
Relationships Between Quantities
 Algebra 1 Relationships Between Quantities Relationships Between Quantities Everyone loves math until there are letters (known as variables) in problems!! Do students complain about reading when they come
These instructions should accompany the OCR resource Intermolecular bonding activity which supports OCR AS and A Level Chemistry B.
 Lesson Element Intermolecular bonding Instructions and answers for teachers These instructions should accompany the OCR resource Intermolecular bonding activity which supports OCR AS and A Level Chemistry
The remains of the course
 Math 10A November 30, 2017 This is the end This is the last week of classes. This is the last class. You may see Kate taking a few photos during this class. When we re through talking, we can line up on
From M&Ms to Mathematics, or, How I learned to answer questions and help my kids love math.
 From M&Ms to Mathematics, or, How I learned to answer questions and help my kids love math. Cameron, Kayla and Steven J. Miller, Williams College sjm1@williams.edu, Steven.Miller.MC.96@aya.yale.edu http://web.williams.edu/mathematics/sjmiller/public_html
Section 7.2 Definition of Probability
 Section 7.2 Definition of Probability Question: Suppose we have an experiment that consists of flipping a fair 2-sided coin and observing if the coin lands on heads or tails? From section 7.1 we should
Grade 8. Functions 8.F.1-3. Student Pages
 THE NEWARK PUBLIC SCHOOLS THE OFFICE OF MATHEMATICS Grade 8 Functions 8.F.1-3 Student Pages 2012 2012 COMMON CORE CORE STATE STATE STANDARDS ALIGNED ALIGNED MODULES Grade 8 - Lesson 1 Introductory Task
STAT 31 Practice Midterm 2 Fall, 2005
 STAT 31 Practice Midterm 2 Fall, 2005 INSTRUCTIONS: BOTH THE BUBBLE SHEET AND THE EXAM WILL BE COLLECTED. YOU MUST PRINT YOUR NAME AND SIGN THE HONOR PLEDGE ON THE BUBBLE SHEET. YOU MUST BUBBLE-IN YOUR
EE6-16 Equivalent Expressions Pages
 EE6-6 Equivalent Expressions Pages 0 STANDARDS 6.EE.A.2, 6.EE.A.3, 6.EE.A. Goals Students will use the area of rectangles and the properties of operations to show that two expressions are equivalent. Vocabulary
Senior Math Circles November 19, 2008 Probability II
 University of Waterloo Faculty of Mathematics Centre for Education in Mathematics and Computing Senior Math Circles November 9, 2008 Probability II Probability Counting There are many situations where
2016 King s College Math Competition. Instructions
 06 King s College Math Competition King s College welcomes you to this year s mathematics competition and to our campus. We wish you success in this competition and in your future studies. Instructions
Mathematics. Standards Plus. Grade COMMON CORE INTERVENTION SAMPLER
 Mathematics Standards Plus COMMON CORE INTERVENTION Grade 7 SAMPLER Standards Plus COMMON CORE INTERVENTION Available for Grades 1-8 Language Arts and Math Standards Plus COMMON CORE INTERVENTION Mathematics
Principles of Mathematics 12
 Principles of Mathematics 12 Examination Booklet Sample 2007/08 Form A DO NOT OPEN ANY EXAMINATION MATERIALS UNTIL INSTRUCTED TO DO SO. FOR FURTHER INSTRUCTIONS REFER TO THE RESPONSE BOOKLET. Contents:
Drama Scheme of Work Murder Mystery
 Drama Scheme of Work Murder Mystery This scheme of work should last for 2-3 lessons. It allows the pupils to be part of and try to solve a murder mystery. Pupils are encouraged to improvise and develop
ACCA Interactive Timetable
 ACCA Interactive Timetable 2018 Professional information last updated uary 2018 v2.1 Please note: Information and dates in this timetable are subject to change. How the 4 exam sittings can work for you
Motivating Questions: How many hurricanes happen in a year? Have the number of hurricanes per year changed over time?
 Hurricanes Over Time Materials For the leader: Projector Whiteboard to project data graph onto For the activity: Graphing paper Markers Globe Copy of data cards Overview Hurricanes occur in the North Atlantic
Math 141:512. Practice Exam 1 (extra credit) Due: February 6, 2019
 Due: February 6, 2019") Math 141:512 Due: February 6, 2019 Practice Exam 1 (extra credit) This is an open book, extra credit practice exam which covers the material that Exam 1 will cover (Sections 1.3, 1.4, 2.1, 2.2, 2.3, 2.4,
Math 141:512 Due: February 6, 2019 Practice Exam 1 (extra credit) This is an open book, extra credit practice exam which covers the material that Exam 1 will cover (Sections 1.3, 1.4, 2.1, 2.2, 2.3, 2.4,
3.6 Curbside Rivalry. A Solidify Understanding Task
 Carlos and Clarita have a brilliant idea for how they will earn money this summer. Since the community in which they live includes many high schools, a couple of universities, and even some professional
ACCA Interactive Timetable
 ACCA Interactive Timetable 2018 Professional information last updated uary 2018 v4 Please note: Information and dates in this timetable are subject to change. How the 4 exam sittings can work for you ACCA
Total=75 min. Materials BLM cut into cards BLM
 Unit 2: Day 4: All together now! Math Learning Goals: Minds On: 15 Identify functions as polynomial functions. Consolidate understanding of properties of functions that include: linear, Action: 50 quadratic,
In Centre, Online Classroom Live and Online Classroom Programme Prices
 In Centre, and Online Classroom Programme Prices In Centre Online Classroom Foundation Certificate Bookkeeping Transactions 430 325 300 Bookkeeping Controls 320 245 225 Elements of Costing 320 245 225
Title of Activity: Let there be Light! Introduction to Ohm's Law and basic series circuits.
 Title of Activity: Let there be Light! Introduction to Ohm's Law and basic series circuits. Concepts Covered: Circuitry is in all of our electronics. This circuits must be asembled in specific ways to
ACCA Interactive Timetable
 ACCA Interactive Timetable 2018 Professional information last updated 4 April 2018 v3.1 Please note: Information and dates in this timetable are subject to change. How the 4 exam sittings can work for
#MEIConf2018. Variable Acceleration. Sharon Tripconey
 @MEIConference #MEIConf2018 #MEIConf2018 Variable Acceleration Sharon Tripconey #MEIConf2018 Kinematics in A level Maths Ref Q1 Q2 Q3 Q4 Q5 Content description [Understand and use the language of kinematics:
Exam III Review Math-132 (Sections 7.1, 7.2, 7.3, 7.4, 7.5, 7.6, 8.1, 8.2, 8.3)
") 1 Exam III Review Math-132 (Sections 7.1, 7.2, 7.3, 7.4, 7.5, 7.6, 8.1, 8.2, 8.3) On this exam, questions may come from any of the following topic areas: - Union and intersection of sets - Complement of
1 Exam III Review Math-132 (Sections 7.1, 7.2, 7.3, 7.4, 7.5, 7.6, 8.1, 8.2, 8.3) On this exam, questions may come from any of the following topic areas: - Union and intersection of sets - Complement of
ECONOMICS TRIPOS PART I. Friday 15 June to 12. Paper 3 QUANTITATIVE METHODS IN ECONOMICS
 ECONOMICS TRIPOS PART I Friday 15 June 2007 9 to 12 Paper 3 QUANTITATIVE METHODS IN ECONOMICS This exam comprises four sections. Sections A and B are on Mathematics; Sections C and D are on Statistics.
16.2 Solving Exponential Equations
 Locker LESSON 16.2 Solving Exponential Equations Texas Math Standards The student is expected to: A2.5.D Solve exponential equations of the form y = ab x where a is a nonzero real number and b is greater
Edexcel GCE Statistics S1 Advanced/Advanced Subsidiary
 physicsandmathstutor.com Centre No. Candidate No. Paper Reference(s) 6683/01 Edexcel GCE Statistics S1 Advanced/Advanced Subsidiary Friday 18 January 2013 Afternoon Time: 1 hour 30 minutes Materials required
Dates and Prices ICAEW - Manchester In Centre Programme Prices
 Dates and Prices ICAEW - Manchester - 2019 In Centre Programme Prices Certificate Level GBP ( ) Intensive Accounting 690 Assurance 615 Law 615 Business, Technology and Finance 615 Mangement Information
ACCA Interactive Timetable
 ACCA Interactive Timetable 2018 Professional information last updated uary 2018 v4.1 Please note: Information and dates in this timetable are subject to change. How the 4 exam sittings can work for you
CS 361: Probability & Statistics
 February 19, 2018 CS 361: Probability & Statistics Random variables Markov s inequality This theorem says that for any random variable X and any value a, we have A random variable is unlikely to have an
Solving Equations by Adding and Subtracting
 SECTION 2.1 Solving Equations by Adding and Subtracting 2.1 OBJECTIVES 1. Determine whether a given number is a solution for an equation 2. Use the addition property to solve equations 3. Determine whether
INEQUALITIES Modeling Linear Inequalities Common Core Standards
 F Inequalities, Lesson 3, Modeling Linear Inequalities (r. 2018) INEQUALITIES Modeling Linear Inequalities Common Core Standards A-CED.1 Create equations and inequalities in one variable and use them to
TIME: 45 minutes. LESSON: Curious About Clouds GRADE: 1 st SUMMARY:
 LESSON: Curious About Clouds GRADE: 1 st TIME: 45 minutes SUMMARY: Students will make observations about the weather and sky, listen to a story about weather and discuss it. Students will go outside and
STAT 516 Midterm Exam 2 Friday, March 7, 2008
 STAT 516 Midterm Exam 2 Friday, March 7, 2008 Name Purdue student ID (10 digits) 1. The testing booklet contains 8 questions. 2. Permitted Texas Instruments calculators: BA-35 BA II Plus BA II Plus Professional
Climate Change: How it impacts Canadians and what we can do to slow it down.
 Climate Change: How it impacts Canadians and what we can do to slow it down. Lesson Overview This lesson takes stock of how climate change has already affected Canadians in geographic, economic, and cultural
Chapter 2: Studying Geography, Economics, and Citizenship
 Chapter 2: Studying Geography, Economics, and Citizenship Lesson 2.1 Studying Geography I. Displaying the Earth s Surface A. A globe of the Earth best shows the sizes of continents and the shapes of landmasses
Teaching S1/S2 statistics using graphing technology
 Teaching S1/S2 statistics using graphing technology CALCULATOR HINTS FOR S1 & 2 STATISTICS - STAT MENU (2) on Casio. It is advised that mean and standard deviation are obtained directly from a calculator.
Mathematics 1104B. Systems of Equations and Inequalities, and Matrices. Study Guide. Text: Mathematics 11. Alexander and Kelly; Addison-Wesley, 1998.
 Adult Basic Education Mathematics Systems of Equations and Inequalities, and Matrices Prerequisites: Mathematics 1104A, Mathematics 1104B Credit Value: 1 Text: Mathematics 11. Alexander and Kelly; Addison-Wesley,
4.4 MONTHLY WEATHER SUMMARY
 4.4 1 4.4 MONTHLY WEATHER SUMMARY OBJECTIVES The students Collect and summarize monthly weather data about local weather conditions including wind speed and direction, rainfall, temperature, humidity (optional),
PRACTICE PROBLEMS FOR EXAM 2
 PRACTICE PROBLEMS FOR EXAM 2 Math 3160Q Fall 2015 Professor Hohn Below is a list of practice questions for Exam 2. Any quiz, homework, or example problem has a chance of being on the exam. For more practice,
Lesson 8: Using If-Then Moves in Solving Equations
 Student Outcomes Students understand and use the addition, subtraction, multiplication, division, and substitution properties of equality to solve word problems leading to equations of the form and where,,