Image of the Month. Good early rains over the summer rainfall region
|
|
|
- Hilary McDaniel
- 6 years ago
- Views:
Transcription


1 I S S U E O C T O B E R I N S T I T U T E F O R S O I L, C L I M A T E A N D W A T E R C O N T E N T S : 1. Rainfall 2 2. Standardized Precipitation Index 4 3. Rainfall Deciles 6 4. Water Balance 7 5. Vegetation Conditions 6. Vegetation Condition Index 7. Vegetation Conditions & Rainfall Fire Watch Agrometeorology 10. Geoinformation Science CRID Contact Details 19 Image of the Month Good early rains over the summer rainfall region The summer rainfall region experienced a good start to the rainy season over a period of about two weeks starting at the end of September. Large areas over the eastern part of the country received rainfall totals of between 50 and 75 mm, reaching 100 mm in places, whilst in excess of 100 mm was recorded over southern KwaZulu-Natal and adjacent parts of the Eastern Cape (see rainfall map below). The first spring thundershowers occurred on 25 September over the eastern interior, aided by the passage of an upper-air trough over the country with an accompanying cold front that caused minimum temperatures to drop as low as -5 C over the central interior on the 27 th. As this weather system moved to the east of the country, a moisture advecting surface ridge started to dominate the circulation over the eastern parts of the country. At the same time a surface trough that extended from the tropics formed over the western part of the country, whilst an upper-air trough approached South Africa. The combination of these systems resulted in a northwest to southeast aligned cloud band that brought the first spring rain to the summer rainfall region during the last few days of September. The surface high to the east of the country was quite persistent and contributed to the formation of another tropically sourced cloud band that formed over South Africa on 3 October as another upper-air trough moved in over the country. This cloud band exited on the 6 th after which a new upper-air trough neared the country that developed into a cut-off low on 9 October the day that severe thunderstorms occurred in the Gauteng region and when two tornados were observed. The cut-off low was situated over KwaZulu-Natal on 10 October and caused significant rainfall and flooding along that coast. 160 th Edition The Agricultural Research Council - Institute for Soil, Climate and Water (ARC-ISCW) collected the data, generated the products and compiled the information contained in this newsletter, as part of the Coarse Resolution Imagery Database (CRID) project that was funded by the Department of Agriculture and Department of Science and Technology at its inception and is currently funded by the Department of Agriculture, Forestry and Fisheries (DAFF).
2 Overview: Normal to above-normal rainfall occurred along the coast and adjacent interior of the southern and eastern coastal belts of the country during September 2017, extending over the Lowveld of Mpumalanga. With the start of spring, convective activity occurred on a few occasions over the central to eastern interior and above-normal rainfall for the month of September was recorded over parts of the western maize producing region. The rest of the country had below-normal rainfall with the severely drought stricken Western Cape, especially the western part of the province, receiving less than half the normal September rainfall. Rainfall over South Africa during the first two weeks of September was very limited. During this time, a few frontal systems that brushed the extreme southwestern part of the country caused some rainfall over the mountainous regions. Temperature wise, the month of September started off with a cold front that moved in over the country, causing low minimum temperatures over the central interior regions where minimums as low as -6 C occurred in some places over the Free State. After a relatively cold first week of September, the following week was characterized by being hot. The third week of the month started off with an upper-air trough that moved in over the country on the 15 th, accompanied by a surface ridging high pressure system. The combination of these weather systems caused widespread rainfall along the southern coastal belt and adjacent interior, moving eastwards along the eastern coastal belt as the upper-air trough progressed eastwards and the surface high pressure system establish itself to the east of the country. Most of the rainfall during September along the southern coastal belt occurred during this event. By the 19 th, a frontal system moved quickly over the southwestern and southern parts of the country, with the ridging high in the wake of the front leading to cloudy conditions east of the escarpment. Another cold front, also accompanied by an upper-air trough, moved in over the country on the 21 st and progressed eastwards over the southwestern and southern parts of South Africa on the 22 nd, with the ridging high pressure system behind the front causing cloudy conditions with rainfall east of the eastern escarpment by the 23 rd. 1. Rainfall Figure 1 Figure 2 P A G E 2 U M L I N D I
 Between the 24 th and 26 th, an upper-air trough accompanied by a frontal wave moved over the country, introducing thunderstorms on the evening of the 25 th over the eastern interior.")

3 I S S U E P A G E 3 (continued from p. 2) Between the 24 th and 26 th, an upper-air trough accompanied by a frontal wave moved over the country, introducing thunderstorms on the evening of the 25 th over the eastern interior. Minimum temperatures dropped notably over the interior on the morning of the 27 th after the passage of the frontal trough. From the 28 th until the end of the month, a surface high pressure system ridging in over the eastern part of the country in combination with a surface trough that developed over the western parts of South Africa aided in the development of thundershowers over the central to eastern parts of the country. Figure 3 Figure 1: The rainfall distribution for the month of September looks quite similar to the August rainfall distribution, except for the thunderstorm activity that occurred over the central and eastern interior at the end of September. Also, the total monthly rainfall over the winter rainfall region was less during September compared to August as the main rainfall season over those areas is now over. Figure 2: Above-normal rainfall occurred over parts of the central and eastern interior as thundershowers occurred during the last few days of September. Some areas along the southern and eastern coastal belts received near-normal to above-normal rainfall that mostly occurred in mid-september during a ridging high pressure system event. Figure 3: Over the past three months, nearnormal to above-normal rainfall occurred over the southern to southeastern coastal belts as well as over some isolated areas in the northeast of the country. The winter rainfall region received mostly below-normal rainfall. Figure 4: Over the mountainous regions in the western part of the Western Cape, the 2017 period received up to 200 mm less rainfall than during the corresponding 2016 period. The eastern coastal belt also received less rainfall during 2017 compared to 2016, with the rainfall deficit up to 200 mm in places. Figure 4 Questions/Comments: EngelbrechtC@arc.agric.za Philip@arc.agric.za
 was developed to monitor the occurrence of droughts from rainfall data. The index quantifies precipitation deficits on different time scales and therefore also drought severity.")
4 2. Standardized Precipitation Index P A G E 4 Standardized Precipitation Index The Standardized Precipitation Index (SPI - McKee et al., 1993) was developed to monitor the occurrence of droughts from rainfall data. The index quantifies precipitation deficits on different time scales and therefore also drought severity. It provides an indication of rainfall conditions per quaternary catchment (in this case) based on the historical distribution of rainfall. REFERENCE: McKee TB, Doesken NJ and Kliest J (1993) The relationship of drought frequency and duration to time scales. In: Proceedings of the 8 th Conference on Applied Climatology, January, Anaheim, CA. American Meteorological Society: Boston, MA; Figure 5 At all the time scales, severe to extreme drought conditions are present over the winter rainfall region, expanding spatially eastwards from the 36-month time scale to the 12-month time scale. Slight relief from the severe to extreme drought is visible over the eastern parts of the Western Cape on the 6-month time scale. Over the eastern parts of the country, severe to extreme drought conditions improve from the longer to the shorter time scales, whilst severe drought conditions are visible from the 6-month time scale over the southern interior. Questions/Comments: EngelbrechtC@arc.agric.za Philip@arc.agric.za Figure Figure 6 5 U M L I N D I

5 I S S U E P A G E 5 Figure 7 Figure 28 Figure 6 Figure 8
6 3. Rainfall Deciles P A G E 6 Deciles are used to express the ranking of rainfall for a specific period in terms of the historical time series. In the map, a value of 5 represents the median value for the time series. A value of 1 refers to the rainfall being as low or lower than experienced in the driest 10% of a particular month historically (even possibly the lowest on record for some areas), while a value of 10 represents rainfall as high as the value recorded only in the wettest 10% of the same period in the past (or even the highest on record). It therefore adds a measure of significance to the rainfall deviation. Figure 9 Figure 9: Compared to historical rainfall totals during the month of September, September 2017 over most of the winter rainfall region compares well with the drier September months. Over some areas along the southern to southeastern coastal belts, the KwaZulu-Natal coast as well as over the central and northeastern interior, September 2017 falls within the wetter September months. Questions/Comments: EngelbrechtC@arc.agric.za Philip@arc.agric.za U M L I N D I

7 4. Water Balance P A G E 7 Solar Radiation Daily solar radiation surfaces are created for South Africa by combining in situ measurements from the ARC-ISCW automatic weather station network with 15- minute data from the Meteosat Second Generation satellite. Figure 10: The lowest solar radiation values occurred over the southern and eastern coastal belts of the country, with increasing values further northwards. The highest values are located over the northern parts of the country, to the south of Botswana. Figure 10 Potential Evapotranspiration Potential evapotranspiration (PET) for a reference crop is calculated at about 450 automatic weather stations of the ARC- ISCW located across South Africa. At these stations hourly measured temperature, humidity, wind and solar radiation values are combined to estimate the PET. Figure 11: Figure 6 The evaporative demand was lowest over the far southern parts of the country extending into southern KwaZulu-Natal. The evaporative demand increased towards the northern parts of the country where values exceeded 4 mm/day. Questions/Comments: EngelbrechtC@arc.agric.za Philip@arc.agric.za Figure 11

8 Vegetation Mapping The Normalized Difference Vegetation Index (NDVI) is computed from the equation: NDVI=(IR-R)/(IR+R) where: IR = Infrared reflectance & R = Red band NDVI images describe the vegetation activity. A decadal NDVI image shows the highest possible greenness values that have been measured during a 10-day period. Vegetated areas will generally yield high values because of their relatively high near infrared reflectance and low visible reflectance. For better interpretation and understanding of the NDVI images, a temporal image difference approach for change detection is used. The Standardized Difference Vegetation Index (SDVI) is the standardized anomaly (according to the specific time of the year) of the NDVI. 5. Vegetation Conditions P A G E 8 Figure 12 Figure 12: The SDVI for September indicates above-normal vegetation activity over most of North West, northern parts of the Northern Cape and southwestern parts of the Western Cape. Isolated areas of KwaZulu-Natal, Limpopo, Mpumalanga and Gauteng show above-normal vegetation. However, dry conditions prevailed in most of the Eastern Cape, Western Cape, Free State and southern parts of the Northern Cape. Figure 13: Vegetation activity is lower over the southern and far western parts of the Northern Cape, greater Karoo region, Free State and Western Cape. Much of the Eastern Cape and southern parts of KwaZulu-Natal also experienced dry conditions. Figure 13 U M L I N D I
 to 1 (higher vegetation activity) with 0 indicating normal/the same vegetation")
9 I S S U E P A G E 9 Vegetation Mapping (continued from p. 8) Interpretation of map legend NDVI values range between 0 and 1. These values are incorporated in the legend of the difference maps, ranging from - 1 (lower vegetation activity) to 1 (higher vegetation activity) with 0 indicating normal/the same vegetation activity or no significant difference between the images. Cumulative NDVI maps: Two cumulative NDVI datasets have been created for drought monitoring purposes: Winter: January to December Summer: July to June Figure 14 Figure 14: Vegetation activity for September was lower along the west and south coast, western parts of the Eastern Cape and southern parts of the Northern Cape. However, the KwaZulu-Natal coast experienced an increase in vegetation activity. Figure 15: Cumulative vegetation activity was above average in North West, Gauteng, Free State, Limpopo, Mpumalanga and northern parts of the Northern Cape. The southwestern parts of the country continue to experience potential drought conditions. Questions/Comments: MashabaZ@arc.agric.za Figure 15


10 6. Vegetation Condition Index P A G E 10 Vegetation Condition Index (VCI) The VCI is an indicator of the vigour of the vegetation cover as a function of the NDVI minimum and maximum encountered for a specific pixel and for a specific period, calculated over many years. The VCI normalizes the NDVI according to its changeability over many years and results in a consistent index for various land cover types. It is an effort to split the short-term weather-related signal from the long-term climatological signal as reflected by the vegetation. The VCI is a better indicator of water stress than the NDVI. Figure 16 Figure 16: The VCI map for September indicates below-normal vegetation activity over the northern parts of the Western Cape. Abovenormal vegetation conditions are visible in the southwestern parts. Figure 17: The VCI map for September indicates below-normal vegetation activity over the northeastern and northwestern areas of KwaZulu-Natal. Figure 17 U M L I N D I


11 I S S U E P A G E 11 Figure 18: The VCI map for September indicates below-normal vegetation activity over the interior and western parts of the Free State. Figure 18 Figure 19: The VCI map for September indicates below-normal vegetation activity over the southern parts of the Northern Cape. Questions/Comments: MashabaZ@arc.agric.za Figure 19

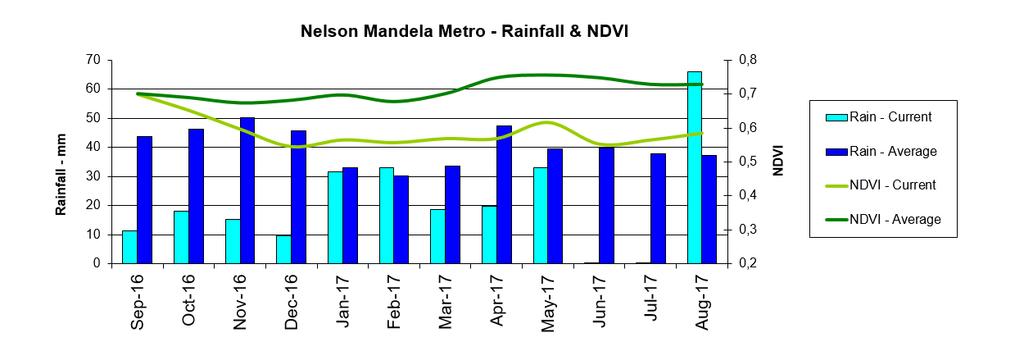
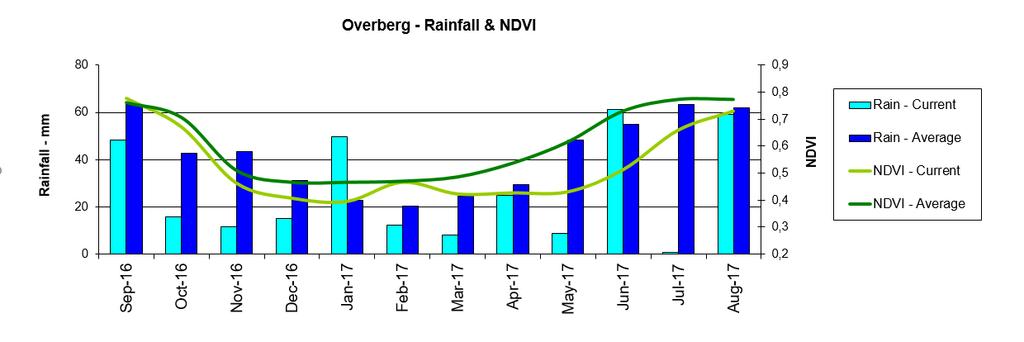
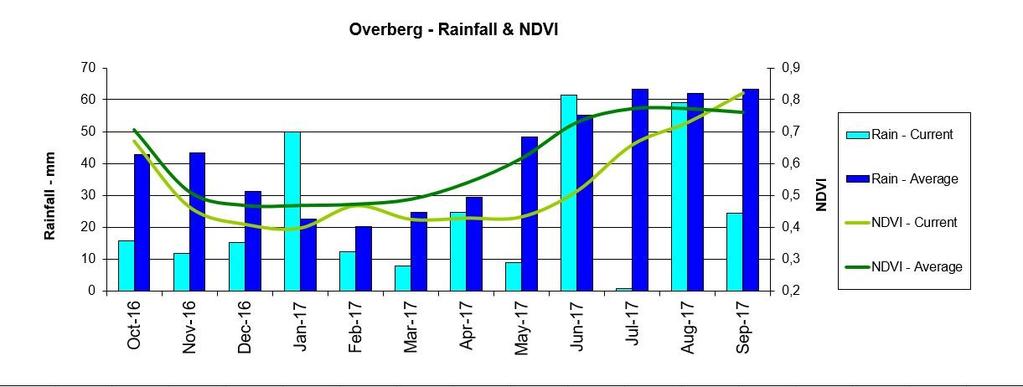
12 7. Vegetation Conditions & Rainfall P A G E 12 Figure 20 NDVI and Rainfall Graphs Figure 20: Orientation map showing the areas of interest for September The district colour matches the border of the corresponding graph. Questions/Comments: MashabaZ@arc.agric.za / FergusonJ@arc.agric.za Figures 21-25: Indicate areas with higher cumulative vegetation activity for the last year. Figures 26-30: Indicate areas with lower cumulative vegetation activity for the last year Siyanda - Rainfall & NDVI Rainfall - mm NDVI Rain_current Rain - Average NDVI - Current NDVI - Average Sep-16 Oct-16 Nov-16 Dec-16 Jan-17 Feb-17 Mar-17 Apr-17 May-17 Jun-17 Jul-17 Aug-17 Figure 21 U M L I N D I

13 I S S U E P A G E Northern Free State - Rainfall & NDVI 0, , ,7 Rain - Current Rainfall - mm ,6 0,5 NDVI Rain - Average 60 0,4 NDVI - Current ,3 NDVI - Average 0 0,2 Oct-16 Nov-16 Dec-16 Jan-17 Feb-17 Mar-17 Apr-17 May-17 Jun-17 Jul-17 Aug-17 Sep-17 Figure 22 Figure 23 Figure 24 U M L I N D I


14 P A G E 14 Figure 25 Figure 26 Figure 27 U M L I N D I


15 I S S U E P A G E 15 Figure 28 Figure Figure Figure 29 Figure 29 Figure 30
 Active fire pixels detected from 1-30 September 2017 Forest and vegetation fires have temperatures in the range of 500 K (Kelvin)")
16 P A G E Fire Watch P A G E 16 Active Fires (Provided when data is available) Active fire pixels detected from 1-30 September 2017 Forest and vegetation fires have temperatures in the range of 500 K (Kelvin) to 1000 K. According to Wien s Displacement Law, the peak emission of radiance for blackbody surfaces of such temperatures is at around 4 μm. For an ambient temperature of 290 K, the peak of radiance emission is located at approximately 11 μm. Active fire detection algorithms from remote sensing use this behaviour to detect hot spot fires. Caption describing Figure 31: The picture graph shows or graphic. the total number of active fires detected during the month of September per province. Fire activity was higher in the Eastern Cape, Free State, Northern Cape, Limpopo, Western Cape and KwaZulu-Natal compared to the average during the same period for the last 17 years. Total Average Figure 31 Figure 32: The map shows the location of active fires detected between 1-30 September Figure 32

17 P A G E 17 P A G E 17 Total Active fire pixels detected from 1 January - 30 September Figure 33: The graph shows the total number of active fires detected from 1 January - 30 September 2017 per province. Fire activity was higher in all provinces compared to the average during the same period for the last 17 years Average 0 Figure 33 Figure 34: The map shows the location of active fires detected between 1 January - 30 September Figure 34 Questions/Comments: MaakeR@arc.agric.za

18 P A G E 18
19 The Coarse Resolution Imagery Database (CRID) NOAA AVHRR The ARC-ISCW has an archive of daily NOAA AVHRR data dating from 1985 to This database includes all 5 bands as well as the Normalized Difference Vegetation Index (NDVI), Active Fire and Land Surface Temperature (LST) images. The NOAA data are used, for example, for crop production and grazing capacity estimation. MODIS MODIS data is distributed by the Land Processes Distributed Active Archive Center (LP DAAC), located at the U.S. Geological Survey's EROS Data Center. The MODIS sensor is more advanced than NOAA with regard to its high spatial (250 m 2 to 1 km 2 ) and spectral resolution. The ARC-ISCW has an archive of MODIS (version 4 and 5) data. MODIS v4 from 2000 to 2006 MODIS v5 from 2000 to present Datasets include: MOD09 (Surface Reflectance) MOD11 (Land Surface Temperature) MOD13 (Vegetation Products) MOD14 (Active Fire) MOD15 (Leaf Area Index & Fraction of Photosynthetically Active Radiation MOD17 (Gross Primary Productivity) MCD43 (Albedo & Nadir Reflectance) MCD45 (Burn Scar) Coverage for version 5 includes South Africa, Namibia, Botswana, Zimbabwe and Mozambique. More information: VGT4AFRICA and GEOSUCCESS SPOT NDVI data is provided courtesy of the VEGETATION Programme and the VGT4AFRICA project. The European Commission jointly developed the VEGE- TATION Programme. The VGT4AFRICA project disseminates VEGETATION products in Africa through GEONETCast. ARC-ISCW has an archive of VEGE- TATION data dating from 1998 to the present. Other products distributed through VGT4AFRICA and GEOSUC- CESS include Net Primary Productivity, Normalized Difference Wetness Index and Dry Matter Productivity data. Meteosat Second Generation (MSG) The ARC-ISCW has an operational MSG receiving station. Data from April 2005 to the present have been archived. MSG produces data with a 15- minute temporal resolution for the entire African continent. Over South Africa the spatial resolution of the data is in the order of 3 km. The ARC-ISCW investigated the potential for the development of products for application in agriculture. NDVI, LST and cloud cover products were some of the initial products derived from the MSG SEVIRI data. Other products derived from MSG used weather station data, including air temperature, humidity and solar radiation. Rainfall maps Solar Radiation and Evapotranspiration maps Combined inputs from 450 automatic weather stations from the ARC-ISCW weather station network, 270 automatic rainfall recording stations from the SAWS, satellite rainfall estimates from the Famine Early Warning System Network: earlywarning.usgs.gov and long-term average climate surfaces developed at the ARC-ISCW. Combined inputs from 450 automatic weather stations from the ARC-ISCW weather station network. Data from the METEOSAT Second Generation (MSG) 3 satellite via GEONETCAST: DataDelivery/EUMETCast/GEONETCast/index.html. The operational Coarse Resolution Imagery Database (CRID) project of ARC-ISCW is funded by the National Department of Agriculture, Forestry and Fisheries. Development of the monitoring system was made possible at its inception through LEAD funding from the Department of Science and Technology. For further information please contact the following: Adolph Nyamugama , NyamugamaA@arc.agric.za Adri Laas , AdriL@arc.agric.za Institute for Soil, Climate and Water To subscribe to the newsletter, please submit a request to: NyamugamaA@arc.agric.za What does Umlindi mean? UMLINDI is the Zulu word for the watchman. Private Bag X79, Pretoria 0001, South Africa 600 Belvedere Street, Arcadia, Pretoria, South Africa Disclaimer: The ARC-ISCW and its collaborators have obtained data from sources believed to be reliable and have made every reasonable effort to ensure accuracy of the data. The ARC-ISCW and its collaborators cannot assume responsibility for errors and omissions in the data nor in the documentation accompanying them. The ARC-ISCW and its collaborators will not be held responsible for any consequence from the use or misuse of the data by any organization or individual.
Images of the Month. Mostly dry conditions during the peak winter months over the Western Cape
 I S S U E 2 0 1 7-0 9 1 8 S E P T E M B E R 2 0 1 7 I N S T I T U T E F O R S O I L, C L I M A T E A N D W A T E R C O N T E N T S : 1. Rainfall 2 2. Standardized Precipitation Index 159 th Edition 4 3.
Images of the Month. Welcome early June rains after a very dry autumn in the Western Cape
 I S S U E 2 0 1 7-0 6 1 6 J U N E 2 0 1 7 I N S T I T U T E F O R S O I L, C L I M A T E A N D W A T E R C O N T E N T S : 1. Rainfall 2 2. Standardized Precipitation Index 4 3. Rainfall Deciles 6 4. Water
Image of the Month. A hot and dry start to 2018
 I S S U E 2 1 8-1 2 4 J A N U A R Y 2 1 8 I N S T I T U T E F O R S O I L, C L I M A T E A N D W A T E R C O N T E N T S : 1. Rainfall 2 2. Standardized Precipitation Index 4 3. Rainfall Deciles 6 4. Water
Image of the Month. Widespread rain brings relief from the dry conditions in the northeast
 I S S U E 2 0 1 9-0 2 1 9 F E B R U A R Y 2 0 1 9 I N S T I T U T E F O R S O I L, C L I M A T E A N D W A T E R C O N T E N T S : 1. Rainfall 2 2. Standardized Precipitation Index 4 3. Rainfall Deciles
Images of the Month. Hot and dry conditions over. April
 I S S U E 2 1 7-5 1 5 M A Y 2 1 7 I N S T I T U T E F O R S O I L, C L I M A T E A N D W A T E R C O N T E N T S : 1. Rainfall 2 2. Standardized Precipitation Index 4 3. Rainfall Deciles 6 4. Water Balance
Images of the Month. Above-normal rainfall and vegetation recovery over much of the summer rainfall region in January. (SPI) map.
 map.") I S S U E INSTITUTE FOR SOIL, CLIMATE AND WATER 2 2. Standardized Precipitation Index 4 3. Rainfall Deciles 6 4. Water Balance 7 5. Vegetation Conditions 8 6. Vegetation Condition Index 1 7. Vegetation
I S S U E INSTITUTE FOR SOIL, CLIMATE AND WATER 2 2. Standardized Precipitation Index 4 3. Rainfall Deciles 6 4. Water Balance 7 5. Vegetation Conditions 8 6. Vegetation Condition Index 1 7. Vegetation
(Source:
 I S S U E 2 0 1 8-1 2 1 7 D E C E M B E R 2 0 1 8 I N S T I T U T E F O R S O I L, C L I M A T E A N D W A T E R C O N T E N T S : 1. Rainfall 2 2. Standardized Precipitation Index 4 3. Rainfall Deciles
Images of the Month INSTITUTE FOR SOIL, CLIMATE AND WATER. First widespread significant rain over winter rainfall region arrives by early June
 I S S U E 2 0 1 5-0 6 1 2 J U N E 2 0 1 5 INSTITUTE FOR SOIL, CLIMATE AND WATER CONTENTS: 1. Rainfall 2 2. Standardized Precipitation Index 132 nd Edition 4 3. Rainfall Deciles 6 4. Water Balance 7 5.
Images of the Month. March relatively cool at night over the central parts. Return of wet conditions to the interior
 I S S U E 1. Rainfall 2 2. Standardized Precipitation Index 4 3. Rainfall Deciles 6 4. Water Balance 7 5. Vegetation Conditions 8 6. Vegetation Condition Index 1 7. Vegetation Conditions & Rainfall 12
Images of the Month. Early spring rain over many areas INSTITUTE FOR SOIL, CLIMATE AND WATER CONTENTS:
 I S S U E 2 0 1 5-0 9 1 4 S E P T E M B E R 2 0 1 5 INSTITUTE FOR SOIL, CLIMATE AND WATER CONTENTS: 1. Rainfall 2 2. Standardized Precipitation Index 135 th Edition 4 3. Rainfall Deciles 6 4. Water Balance
(Source:
 I S S U E 2 0 1 8-1 1 1 6 N O V E M B E R 2 0 1 8 I N S T I T U T E F O R S O I L, C L I M A T E A N D W A T E R C O N T E N T S : 1. Rainfall 2 2. Standardized Precipitation Index 4 3. Rainfall Deciles
Image of the Month. The Knysna fires viewed from space
 I S S U E INSTITUTE FOR SOIL, CLIMATE AND WATER CONTENTS: 1. Rainfall 2 2. Standardized Precipitation Index 4 3. Rainfall Deciles 6 4. Water Balance 7 5. Vegetation Conditions 8 6. Vegetation Condition
the watchman Images of the Month - Focus on the Free State Latest vegetation conditions as deduced from SPOT VEGETATION data
 I N S T I T U T E F O R S O I L, C L I M A T E A N D W A T E R the watchman I S S U E 2 9 3 S E P T E M B E R 2 0 0 7 Latest vegetation conditions as deduced from SPOT VEGETATION data Rainfall for August
By: J Malherbe, R Kuschke
 2015-10-27 By: J Malherbe, R Kuschke Contents Summary...2 Overview of expected conditions over South Africa during the next few days...3 Significant weather events (27 October 2 November)...3 Conditions
Monthly Overview Rainfall
 Monthly Overview The month of November can be described as having had two parts. The first half of the month was categorised by regular severe weather warnings with large thunderstorms occurring over large
Monthly overview. Rainfall
 Monthly overview 1-10 August 2018 The month started off with light showers over the Western Cape. A large cold front made landfall around the 5th of the month. This front was responsible for good rainfall
Monthly Overview. Rainfall
 Monthly Overview Rainfall during August occurred mainly over the Western and Eastern Cape provinces, and KwaZulu- Natal. Rain in these provinces were regularly accompanied by cold fronts as they made landfall
Monthly Overview. Rainfall
 Monthly Overview October started off with the first summer thunderstorms over large parts of the summer rainfall region. Many areas reported 10 mm and more during the first 10 days of the month. Some noticeable
Seasonal Weather Forecast Talk Show on Capricorn FM and North West FM
 Seasonal Weather Forecast Talk Show on Capricorn FM and North West FM Categories of Weather Forecast Nowcast (0-6 hours) DETERMINISTIC Short-term (1-7 days) DETERMINISTIC Medium-term (up to 30 days) DETERMINISTIC/PROBABILISTIC
OVERVIEW OF IMPROVED USE OF RS INDICATORS AT INAM. Domingos Mosquito Patricio
 OVERVIEW OF IMPROVED USE OF RS INDICATORS AT INAM Domingos Mosquito Patricio domingos.mosquito@gmail.com Introduction to Mozambique /INAM Introduction to AGRICAB/SPIRITS Objectives Material & Methods Results
Chiang Rai Province CC Threat overview AAS1109 Mekong ARCC
 Chiang Rai Province CC Threat overview AAS1109 Mekong ARCC This threat overview relies on projections of future climate change in the Mekong Basin for the period 2045-2069 compared to a baseline of 1980-2005.
By: J Malherbe, R Kuschke
 2015-04-14 By: J Malherbe, R Kuschke Contents Summary... 2 Overview of conditions during the previous weeks over South Africa:... 3 Rainfall... 3 Rainfall: January-March 2015 compared to January-March
Monthly overview. Rainfall
 Monthly overview 1 to 10 April 2018 Widespread rainfall continued to fall over most parts of the summer rainfall region during this period. Unseasonably good rain fell over the eastern half of the Northern
BOTSWANA AGROMETEOROLOGICAL MONTHLY
 Depart. Of Meteorological Services Agro-met Office P.O. Box 10100, Gaborone Tel: 3612200 Fax: 3956282/140 Corner Maaloso- Metsimothaba Road Gaborone Village Highlights: Very wet to extremely wet conditions
National Wildland Significant Fire Potential Outlook
 National Wildland Significant Fire Potential Outlook National Interagency Fire Center Predictive Services Issued: September, 2007 Wildland Fire Outlook September through December 2007 Significant fire
UPDATE OF REGIONAL WEATHER AND SMOKE HAZE (December 2017)
") UPDATE OF REGIONAL WEATHER AND SMOKE HAZE (December 2017) 1. Review of Regional Weather Conditions for November 2017 1.1 In November 2017, Southeast Asia experienced inter-monsoon conditions in the first
UPDATE OF REGIONAL WEATHER AND SMOKE HAZE (December 2017) 1. Review of Regional Weather Conditions for November 2017 1.1 In November 2017, Southeast Asia experienced inter-monsoon conditions in the first
The Climate of Murray County
 The Climate of Murray County Murray County is part of the Crosstimbers. This region is a transition between prairies and the mountains of southeastern Oklahoma. Average annual precipitation ranges from
Monthly Long Range Weather Commentary Issued: February 15, 2015 Steven A. Root, CCM, President/CEO
 Monthly Long Range Weather Commentary Issued: February 15, 2015 Steven A. Root, CCM, President/CEO sroot@weatherbank.com JANUARY 2015 Climate Highlights The Month in Review During January, the average
Analytical Report. Drought in the Horn of Africa February Executive summary. Geographical context. Likelihood of drought impact (LDI)
") Executive summary The current drought in the Horn of Africa is affecting especially Somalia, among other countries, in particular the central and southern regions, where most population is located. Overall,
Executive summary The current drought in the Horn of Africa is affecting especially Somalia, among other countries, in particular the central and southern regions, where most population is located. Overall,
The Climate of Payne County
 The Climate of Payne County Payne County is part of the Central Great Plains in the west, encompassing some of the best agricultural land in Oklahoma. Payne County is also part of the Crosstimbers in the
Minnesota s Climatic Conditions, Outlook, and Impacts on Agriculture. Today. 1. The weather and climate of 2017 to date
 Minnesota s Climatic Conditions, Outlook, and Impacts on Agriculture Kenny Blumenfeld, State Climatology Office Crop Insurance Conference, Sep 13, 2017 Today 1. The weather and climate of 2017 to date
MSG FOR NOWCASTING - EXPERIENCES OVER SOUTHERN AFRICA
 MSG FOR NOWCASTING - EXPERIENCES OVER SOUTHERN AFRICA Estelle de Coning and Marianne König South African Weather Service, Private Bag X097, Pretoria 0001, South Africa EUMETSAT, Am Kavalleriesand 31, D-64295
The Climate of Marshall County
 The Climate of Marshall County Marshall County is part of the Crosstimbers. This region is a transition region from the Central Great Plains to the more irregular terrain of southeastern Oklahoma. Average
The Climate of Bryan County
 The Climate of Bryan County Bryan County is part of the Crosstimbers throughout most of the county. The extreme eastern portions of Bryan County are part of the Cypress Swamp and Forest. Average annual
but 2012 was dry Most farmers pulled in a crop
 After a winter that wasn t, conditions late in the year pointed to a return to normal snow and cold conditions Most farmers pulled in a crop but 2012 was dry b y M i k e Wr o b l e w s k i, w e a t h e
Presentation Overview. Southwestern Climate: Past, present and future. Global Energy Balance. What is climate?
 Southwestern Climate: Past, present and future Mike Crimmins Climate Science Extension Specialist Dept. of Soil, Water, & Env. Science & Arizona Cooperative Extension The University of Arizona Presentation
Monthly Long Range Weather Commentary Issued: SEPTEMBER 19, 2016 Steven A. Root, CCM, Chief Analytics Officer, Sr. VP,
 Monthly Long Range Weather Commentary Issued: SEPTEMBER 19, 2016 Steven A. Root, CCM, Chief Analytics Officer, Sr. VP, sroot@weatherbank.com SEPTEMBER 2016 Climate Highlights The Month in Review The contiguous
The Climate of Kiowa County
 The Climate of Kiowa County Kiowa County is part of the Central Great Plains, encompassing some of the best agricultural land in Oklahoma. Average annual precipitation ranges from about 24 inches in northwestern
SEPTEMBER 2013 REVIEW
 Monthly Long Range Weather Commentary Issued: October 21, 2013 Steven A. Root, CCM, President/CEO sroot@weatherbank.com SEPTEMBER 2013 REVIEW Climate Highlights The Month in Review The average temperature
Monthly Overview. Rainfall
 Monthly Overview Weather news during February 2017 was dominated by the arrival of Tropical Cyclone Dineo, the first cyclone to make landfall over southern Africa since cyclone Eline in February 2000.
Monthly overview. Rainfall
 Monthly overview 1-10 May 2018 During the first ten days of May, dry conditions were experienced across the country. Temperatures dropped to below 10 C over the southern half of the country for the first
The Climate of Texas County
 The Climate of Texas County Texas County is part of the Western High Plains in the north and west and the Southwestern Tablelands in the east. The Western High Plains are characterized by abundant cropland
Monthly Long Range Weather Commentary Issued: APRIL 25, 2016 Steven A. Root, CCM, Chief Analytics Officer, Sr. VP, sales
 Monthly Long Range Weather Commentary Issued: APRIL 25, 2016 Steven A. Root, CCM, Chief Analytics Officer, Sr. VP, sales sroot@weatherbank.com MARCH 2016 Climate Highlights The Month in Review The March
NIDIS Intermountain West Drought Early Warning System July 18, 2017
 NIDIS Drought and Water Assessment NIDIS Intermountain West Drought Early Warning System July 18, 2017 Precipitation The images above use daily precipitation statistics from NWS COOP, CoCoRaHS, and CoAgMet
DROUGHT ASSESSMENT USING SATELLITE DERIVED METEOROLOGICAL PARAMETERS AND NDVI IN POTOHAR REGION
 DROUGHT ASSESSMENT USING SATELLITE DERIVED METEOROLOGICAL PARAMETERS AND NDVI IN POTOHAR REGION Researcher: Saad-ul-Haque Supervisor: Dr. Badar Ghauri Department of RS & GISc Institute of Space Technology
The Climate of Seminole County
 The Climate of Seminole County Seminole County is part of the Crosstimbers. This region is a transition region from the Central Great Plains to the more irregular terrain of southeastern Oklahoma. Average
El Nino: Outlook VAM-WFP HQ September 2018
 El Nino: Outlook 2018 VAM-WFP HQ September 2018 El Nino Outlook September 2018 2015-16 El Nino Peak Possible evolution of an El Nino indicator (Pacific sea surface temperature anomaly) generated by a diverse
Monthly Long Range Weather Commentary Issued: APRIL 18, 2017 Steven A. Root, CCM, Chief Analytics Officer, Sr. VP,
 Monthly Long Range Weather Commentary Issued: APRIL 18, 2017 Steven A. Root, CCM, Chief Analytics Officer, Sr. VP, sroot@weatherbank.com MARCH 2017 Climate Highlights The Month in Review The average contiguous
REMOTELY SENSED INFORMATION FOR CROP MONITORING AND FOOD SECURITY
 LEARNING OBJECTIVES Lesson 4 Methods and Analysis 2: Rainfall and NDVI Seasonal Graphs At the end of the lesson, you will be able to: understand seasonal graphs for rainfall and NDVI; describe the concept
Drought in Southeast Colorado
 Drought in Southeast Colorado Nolan Doesken and Roger Pielke, Sr. Colorado Climate Center Prepared by Tara Green and Odie Bliss http://climate.atmos.colostate.edu 1 Historical Perspective on Drought Tourism
Champaign-Urbana 1999 Annual Weather Summary
 Champaign-Urbana 1999 Annual Weather Summary ILLINOIS STATE WATER SURVEY 2204 Griffith Dr. Champaign, IL 61820 wxobsrvr@sws.uiuc.edu Maria Peters, Weather Observer A major snowstorm kicked off the new
Analysis of meteorological measurements made over three rainy seasons in Sinazongwe District, Zambia.
 Analysis of meteorological measurements made over three rainy seasons in Sinazongwe District, Zambia. 1 Hiromitsu Kanno, 2 Hiroyuki Shimono, 3 Takeshi Sakurai, and 4 Taro Yamauchi 1 National Agricultural
Changing Hydrology under a Changing Climate for a Coastal Plain Watershed
 Changing Hydrology under a Changing Climate for a Coastal Plain Watershed David Bosch USDA-ARS, Tifton, GA Jeff Arnold ARS Temple, TX and Peter Allen Baylor University, TX SEWRU Objectives 1. Project changes
DROUGHT MONITORING BULLETIN
 DROUGHT MONITORING BULLETIN 24 th November 2014 Hot Spot Standardized Precipitation Index for time period from November 2013 to April 2014 was, due to the lack of precipitation for months, in major part
Weather and Climate Summary and Forecast August 2018 Report
 Weather and Climate Summary and Forecast August 2018 Report Gregory V. Jones Linfield College August 5, 2018 Summary: July 2018 will likely go down as one of the top five warmest July s on record for many
The Climate of Grady County
 The Climate of Grady County Grady County is part of the Central Great Plains, encompassing some of the best agricultural land in Oklahoma. Average annual precipitation ranges from about 33 inches in northern
The Climate of Haskell County
 The Climate of Haskell County Haskell County is part of the Hardwood Forest. The Hardwood Forest is characterized by its irregular landscape and the largest lake in Oklahoma, Lake Eufaula. Average annual
Montana Drought & Climate
 Montana Drought & Climate MARCH 219 MONITORING AND FORECASTING FOR AGRICULTURE PRODUCERS A SERVICE OF THE MONTANA CLIMATE OFFICE IN THIS ISSUE IN BRIEF PAGE 2 REFERENCE In a Word PAGE 3 REVIEW Winter 219:
Monthly Long Range Weather Commentary Issued: APRIL 1, 2015 Steven A. Root, CCM, President/CEO
 Monthly Long Range Weather Commentary Issued: APRIL 1, 2015 Steven A. Root, CCM, President/CEO sroot@weatherbank.com FEBRUARY 2015 Climate Highlights The Month in Review The February contiguous U.S. temperature
ASSESSMENT OF DIFFERENT WATER STRESS INDICATORS BASED ON EUMETSAT LSA SAF PRODUCTS FOR DROUGHT MONITORING IN EUROPE
 ASSESSMENT OF DIFFERENT WATER STRESS INDICATORS BASED ON EUMETSAT LSA SAF PRODUCTS FOR DROUGHT MONITORING IN EUROPE G. Sepulcre Canto, A. Singleton, J. Vogt European Commission, DG Joint Research Centre,
Seasonal Climate Watch February to June 2018
 Seasonal Climate Watch February to June 2018 Date issued: Jan 26, 2018 1. Overview The El Niño-Southern Oscillation (ENSO) is expected to remain in a weak La Niña phase through to early autumn (Feb-Mar-Apr).
Monthly Long Range Weather Commentary Issued: July 18, 2014 Steven A. Root, CCM, President/CEO
 Monthly Long Range Weather Commentary Issued: July 18, 2014 Steven A. Root, CCM, President/CEO sroot@weatherbank.com JUNE 2014 REVIEW Climate Highlights The Month in Review The average temperature for
The Climate of Pontotoc County
 The Climate of Pontotoc County Pontotoc County is part of the Crosstimbers. This region is a transition region from the Central Great Plains to the more irregular terrain of southeast Oklahoma. Average
Rainfall Observations in the Loxahatchee River Watershed
 Rainfall Observations in the Loxahatchee River Watershed Richard C. Dent Loxahatchee River District September 1997 Introduction Rain is a common occurrence in south Florida, yet its presence or absence
Precipitation. Standardized Precipitation Index. NIDIS Intermountain West Drought Early Warning System September 5, 2017
 9/6/2017 NIDIS Drought and Water Assessment NIDIS Intermountain West Drought Early Warning System September 5, 2017 Precipitation The images above use daily precipitation statistics from NWS COOP, CoCoRaHS,
Seasonal Climate Watch July to November 2018
 Seasonal Climate Watch July to November 2018 Date issued: Jun 25, 2018 1. Overview The El Niño-Southern Oscillation (ENSO) is now in a neutral phase and is expected to rise towards an El Niño phase through
Zambia. General Climate. Recent Climate Trends. UNDP Climate Change Country Profiles. Temperature. C. McSweeney 1, M. New 1,2 and G.
 UNDP Climate Change Country Profiles Zambia C. McSweeney 1, M. New 1,2 and G. Lizcano 1 1. School of Geography and Environment, University of Oxford. 2. Tyndall Centre for Climate Change Research http://country-profiles.geog.ox.ac.uk
NIDIS Intermountain West Regional Drought Early Warning System February 7, 2017
 NIDIS Drought and Water Assessment NIDIS Intermountain West Regional Drought Early Warning System February 7, 2017 Precipitation The images above use daily precipitation statistics from NWS COOP, CoCoRaHS,
Fire Weather Drivers, Seasonal Outlook and Climate Change. Steven McGibbony, Severe Weather Manager Victoria Region Friday 9 October 2015
 Fire Weather Drivers, Seasonal Outlook and Climate Change Steven McGibbony, Severe Weather Manager Victoria Region Friday 9 October 2015 Outline Weather and Fire Risk Environmental conditions leading to
NIDIS Intermountain West Drought Early Warning System October 17, 2017
 NIDIS Drought and Water Assessment NIDIS Intermountain West Drought Early Warning System October 17, 2017 Precipitation The images above use daily precipitation statistics from NWS COOP, CoCoRaHS, and
Variability of Reference Evapotranspiration Across Nebraska
 Know how. Know now. EC733 Variability of Reference Evapotranspiration Across Nebraska Suat Irmak, Extension Soil and Water Resources and Irrigation Specialist Kari E. Skaggs, Research Associate, Biological
Weather Report 04 April 2018
 Weather Report 04 April 2018 South Africa - Weather Alternating periods of rain and sunshine will evolve across South Africa during the coming week. Moisture totals through next Tuesday morning will range
NIDIS Intermountain West Drought Early Warning System September 4, 2018
 NIDIS Drought and Water Assessment NIDIS Intermountain West Drought Early Warning System September 4, 2018 Precipitation The images above use daily precipitation statistics from NWS COOP, CoCoRaHS, and
2003 Water Year Wrap-Up and Look Ahead
 2003 Water Year Wrap-Up and Look Ahead Nolan Doesken Colorado Climate Center Prepared by Odie Bliss http://ccc.atmos.colostate.edu Colorado Average Annual Precipitation Map South Platte Average Precipitation
The USWB Class A Evaporation Pan. Section 13.2 A-PAN EQUIVALENT REFERENCE POTENTIAL EVAPORATION R.E. Schulze and M. Maharaj
 Section 13.2 A-PAN EQUIVALENT REFERENCE POTENTIAL EVAPORATION R.E. Schulze and M. Maharaj Background to Mapping A-Pan Equivalent Reference Potential Evaporation Over South Africa For the two to three decades
Drought News August 2014
 European Drought Observatory (EDO) Drought News August 2014 (Based on data until the end of July) http://edo.jrc.ec.europa.eu August 2014 EDO (http://edo.jrc.ec.europa.eu) Page 2 of 8 EDO Drought News
Geostatistical Analysis of Rainfall Temperature and Evaporation Data of Owerri for Ten Years
 Atmospheric and Climate Sciences, 2012, 2, 196-205 http://dx.doi.org/10.4236/acs.2012.22020 Published Online April 2012 (http://www.scirp.org/journal/acs) Geostatistical Analysis of Rainfall Temperature
Drought Bulletin for the Greater Horn of Africa: Situation in June 2011
 Drought Bulletin for the Greater Horn of Africa: Situation in June 2011 Preliminary Analysis of data from the African Drought Observatory (ADO) SUMMARY The analyses of different meteorological and remote
Monthly Long Range Weather Commentary Issued: SEPTEMBER 19, 2015 Steven A. Root, CCM, Chief Analytics Officer, Sr. VP, sales
 Monthly Long Range Weather Commentary Issued: SEPTEMBER 19, 2015 Steven A. Root, CCM, Chief Analytics Officer, Sr. VP, sales sroot@weatherbank.com AUGUST 2015 Climate Highlights The Month in Review The
Southern Africa Growing Season : Recovery Hampered by Floods and Drought?
 Southern Africa Growing Season 2016-2017: Recovery Hampered by Floods and Drought? HIGHLIGHTS Good performance of the current growing season (October 2016 - April 2017) is badly needed for Southern Africa
I C P A C. IGAD Climate Prediction and Applications Centre Monthly Climate Bulletin, Climate Review for September 2017
 Bulletin Issue October 2017 I C P A C IGAD Climate Prediction and Applications Centre Monthly Climate Bulletin, Climate Review for September 2017 1. INTRODUCTION This bulletin reviews the September 2017
Agricultural Science Climatology Semester 2, Anne Green / Richard Thompson
 Agricultural Science Climatology Semester 2, 2006 Anne Green / Richard Thompson http://www.physics.usyd.edu.au/ag/agschome.htm Course Coordinator: Mike Wheatland Course Goals Evaluate & interpret information,
Weather and Climate of the Rogue Valley By Gregory V. Jones, Ph.D., Southern Oregon University
 Weather and Climate of the Rogue Valley By Gregory V. Jones, Ph.D., Southern Oregon University The Rogue Valley region is one of many intermountain valley areas along the west coast of the United States.
Seasonal Climate Watch November 2017 to March 2018
 Seasonal Climate Watch November 2017 to March 2018 Date issued: Oct 26, 2017 1. Overview The El Niño Southern Oscillation (ENSO) continues to develop towards a La Niña state, and is expected to be in at
I C P A C IGAD Climate Prediction & Applications centre
 s` I C P A C IGAD Climate Prediction & Applications centre Bulletin Issue July 2017 Issue Number: ICPAC/02/303 IGAD Climate Prediction and Applications Centre Monthly Climate Bulletin, June 2017 1. INTRODUCTION
Drought Assessment Using GIS and Remote Sensing in Amman-Zarqa Basin, Jordan
 Drought Assessment Using GIS and Remote Sensing in Amman-Zarqa Basin, Jordan Nezar Hammouri 1) and Ali El-Naqa 2) 1) Assistant Professor, Faculty of Natural Resources and Environment, Hashemite University,
Analysis of Historical Pattern of Rainfall in the Western Region of Bangladesh
 24 25 April 214, Asian University for Women, Bangladesh Analysis of Historical Pattern of Rainfall in the Western Region of Bangladesh Md. Tanvir Alam 1*, Tanni Sarker 2 1,2 Department of Civil Engineering,
DEPARTMENT OF EARTH & CLIMATE SCIENCES Name SAN FRANCISCO STATE UNIVERSITY Nov 29, ERTH 360 Test #2 200 pts
 DEPARTMENT OF EARTH & CLIMATE SCIENCES Name SAN FRANCISCO STATE UNIVERSITY Nov 29, 2018 ERTH 360 Test #2 200 pts Each question is worth 4 points. Indicate your BEST CHOICE for each question on the Scantron
Champaign-Urbana 2001 Annual Weather Summary
 Champaign-Urbana 2001 Annual Weather Summary ILLINOIS STATE WATER SURVEY 2204 Griffith Dr. Champaign, IL 61820 wxobsrvr@sws.uiuc.edu Maria Peters, Weather Observer January: After a cold and snowy December,
Analysis of Rainfall and Other Weather Parameters under Climatic Variability of Parbhani ( )
") International Journal of Current Microbiology and Applied Sciences ISSN: 2319-7706 Volume 7 Number 06 (2018) Journal homepage: http://www.ijcmas.com Original Research Article https://doi.org/10.20546/ijcmas.2018.706.295
International Journal of Current Microbiology and Applied Sciences ISSN: 2319-7706 Volume 7 Number 06 (2018) Journal homepage: http://www.ijcmas.com Original Research Article https://doi.org/10.20546/ijcmas.2018.706.295
DROUGHT INDICES BEING USED FOR THE GREATER HORN OF AFRICA (GHA)
") DROUGHT INDICES BEING USED FOR THE GREATER HORN OF AFRICA (GHA) Christopher Oludhe IGAD Climate Prediction and Applications Centre (ICPAC) Inter-Regional Workshop on Indices and Early Warning Systems for
DROUGHT INDICES BEING USED FOR THE GREATER HORN OF AFRICA (GHA) Christopher Oludhe IGAD Climate Prediction and Applications Centre (ICPAC) Inter-Regional Workshop on Indices and Early Warning Systems for
A SUMMARY OF RAINFALL AT THE CARNARVON EXPERIMENT STATION,
 A SUMMARY OF RAINFALL AT THE CARNARVON EXPERIMENT STATION, 1931-213 J.C.O. Du Toit 1#, L. van den Berg 1 & T.G. O Connor 2 1 Grootfontein Agricultural Development Institute, Private Bag X529, Middelburg
Midwest and Great Plains Climate and Drought Update
 Midwest and Great Plains Climate and Drought Update June 20,2013 Laura Edwards Climate Field Specialist Laura.edwards@sdstate.edu 605-626-2870 2012 Board of Regents, South Dakota State University General
Crop monitoring in Europe
 Online version Issued: 19 December r JRC MARS Bulletin Vol 24 No 12 JRC MARS Bulletin Crop monitoring in Europe December 2016 Delayed hardening in large parts of Europe Cold air intrusion expected after
Colorado s 2003 Moisture Outlook
 Colorado s 2003 Moisture Outlook Nolan Doesken and Roger Pielke, Sr. Colorado Climate Center Prepared by Tara Green and Odie Bliss http://climate.atmos.colostate.edu How we got into this drought! Fort
2012 Growing Season Weather Summary for North Dakota. Adnan Akyüz and Barbara A. Mullins Department of Soil Science October 30, 2012
 2012 Growing Season Weather Summary for North Dakota Adnan Akyüz and Barbara A. Mullins Department of Soil Science October 30, 2012 Introduction The 2012 growing season (the period from April through September)
2016 Meteorology Summary
 2016 Meteorology Summary New Jersey Department of Environmental Protection AIR POLLUTION AND METEOROLOGY Meteorology plays an important role in the distribution of pollution throughout the troposphere,
January 25, Summary
 January 25, 2013 Summary Precipitation since the December 17, 2012, Drought Update has been slightly below average in parts of central and northern Illinois and above average in southern Illinois. Soil
Monthly Long Range Weather Commentary Issued: NOVEMBER 16, 2015 Steven A. Root, CCM, Chief Analytics Officer, Sr. VP, sales
 Monthly Long Range Weather Commentary Issued: NOVEMBER 16, 2015 Steven A. Root, CCM, Chief Analytics Officer, Sr. VP, sales sroot@weatherbank.com OCTOBER 2015 Climate Highlights The Month in Review The
Weather and climate outlooks for crop estimates
 Weather and climate outlooks for crop estimates CELC meeting 2016-04-21 ARC ISCW Observed weather data Modeled weather data Short-range forecasts Seasonal forecasts Climate change scenario data Introduction