Faisal S. Syed, Shahbaz M.,Nadia R.,Siraj I. K., M. Adnan Abid, M. Ashfaq, F. Giorgi, J. Pal, X. Bi
|
|
|
- Lee Benson
- 6 years ago
- Views:
Transcription
1 ICTP NCP International Conference on Global Change November, 2006, Islamabad Climate Change Studies over South Asia Region Using Regional Climate Model RegCM3 (Preliminary Results) Faisal S. Syed, Shahbaz M.,Nadia R.,Siraj I. K., M. Adnan Abid, M. Ashfaq, F. Giorgi, J. Pal, X. Bi Global Change Impact Studies Centre / Pakistan Meteorological Department Islamabad
2 What are Scenarios? Scenarios are one of the main tools for assessment of future developments in complex systems and are used to determine how conditions may change in the future. A scenario can be defined as a coherent and internally consistent description of a possible future state of the world. it represents one of any number of possible futures, which can be used to provide data for impacts and adaptation studies A2 Storyline and Scenario Family: The A2 storyline and scenario family describes a very heterogeneous world. The underlying theme is self-reliance and preservation of local identities. Fertility patterns across regions converge very slowly, which results in continuously increasing global population. Economic development is primarily regionally oriented and per capita economic growth and technological change are more fragmented and slower than in other storylines.
3 The most common and widely accepted method of scenario construction involves the use of the output of Global Climate Models (GCMs). GCMs are mathematical representations of the large-scale physical processes of the Earth-atmosphere-ocean system that provide a complete and internally consistent view of future climate change The Global Circulation Models (GCMs) provide information about on global scale, typically in grid sizes of 300km x 300km. Whereas the grid size of a Regional Climate Model (RCM) output is typically to 50km x 50km; a 10 times better resolution than that of GCM
4 Design of Climate Change Experiments RegCM3 Driving Data ECHAM ( Max Planck Institute of Meteorology, Germany), FVGCM ( National Aeronautics and Space Administration, USA) Resolution 50 Km Output Data 6 Hourly Model Domain South Asia (Lat 5N to 50N, Lon 55E to 100E) Scenario Analysis Domain A2 Pakistan (Divided into two Sub-regions) Data Set Base Period Future Period ECHAM (30 years) FVGCM (30 years) ERA40 (Reanalysis data) (30years) , (30+30 =60 years) (30 years) NIL
5 Validation of the Model RegCM3
6 Experiments for Validation of Convective Schemes RegCM3 Simulations for winter and Summer (Total 16 Experiments) Summer (JJAS) (8 Experiments) Winter (DJFM) (8 Experiments) Dry Year (1987) (4 Expts) Wet Year (1992) (4 Expts) Dry Year (1985) (4 Expts) Wet Year (1991) (4 Expts)


7 Topography Domain Parameters No. of Grid Points in y direction: 95 No. of Grid Points in x direction: 100 No. of Vertical Levels: 18 Grid Point Separation in Km: 50 Central Latitude: 24.0 Central Longitude: 79.0 Map Projection: ROTMER Boundary Conditions: ERA40 SST: GISST Land Use
 1987 1992 Observed RegCM3 Observed RegCM3")
8 Grell Convective Scheme, Arakawa - Schubert Closure (JJAS ) Precipitation (mm/day) Observed RegCM3 Observed RegCM3 Temperature (C)
 1987 1992 Observed RegCM3 Observed RegCM3")
9 Grell Convective Scheme, Fritsch - Chappell Closure (JJAS ) Precipitation (mm/day) Observed RegCM3 Observed RegCM3 Temperature (C)
 Precipitation")

10 Anthes - Kuo Convective Scheme (JJAS ) Precipitation (mm/day) Observed RegCM3 Observed RegCM3 Temperature (C)


11 Emanuel Convective Scheme (JJAS ) Precipitation (mm/day) Observed RegCM3 Observed RegCM3 Temperature (C)


12 Selected Regions of Pakistan BOX A Northern Pakistan Southern Pakistan BOX B
13 PDFs of Temperature (Box A and Box B)

14 Correlation Maps Temperature Base ( ) RMSE Maps
15 Correlation Maps Precipitation Base ( ) RMSE Maps
16 Summary of Precipitation and Temperature over Selected Regions PRECIPITATION (Monthly) TEMPERATURE (Monthly) CORR RMSE (mm/d) ERA40 % diff (mm/d) (model-cru)/cru *100 BOX A BOX B ECHAM BOX A BOX A BOX B BOX A CORR RMSE ( C) ERA ECHAM 6.27 Diff ( C) (model-cru) BOX B BOX B FVGCM FVGCM BOX A BOX A BOX B BOX B
17 25 20 Scatter Plot of Temperature ( C) BOX-A, ERA40 y = x R 2 = Scatter Plot of Precipitation (mm/d) BOX-A, ERA40 y = 0.519x R 2 = CRU 10 5 CRU ERA40 MODEL 35 Scatter Plot of Temperature ( C) BOX-B, ERA40 5 Scatter Plot of Precipitation (mm/d) BOX-B, ERA40 30 y = x R 2 = y = x R 2 = CRU CRU MODEL MODEL
18 Scatter Plot of Temperature ( C) BOX-A, ECHAM y = 0.998x R 2 = Scatter Plot of Precipitation (mm/d) BOX-A, ECHAM y = 0.789x R 2 = CRU 10 5 CRU MODEL MODEL Scatter Plot of Temperature ( C) BOX-B, ECHAM y = x R 2 = Scatter Plot of Precipitation (mm/d) BOX-B, ECHAM y = x R 2 = CRU 20 CRU MODEL MODEL
19 25 Scatter Plot of Temperature ( C) BOX-A, FVGCM y = x Scatter Plot of Precipitation (mm/d) BOX-A, FVGCM y = 0.425x R 2 = R 2 = CRU 10 5 CRU MODEL MODEL Scatter Plot of Temperature ( C) BOX-B, FVGCM y = x R 2 = Scatter Plot of Precipitation (mm/d) BOX-B, FVGCM y = x R 2 = CRU 20 CRU MODEL MODEL
20 Annual Cycle of Temperature Selected Regions of Pakistan ECHAM Annual Cycle of Precipitation (BOX A) ECHAM Annual Cycle of Temperature (BOX A) ECHAM Precipitation (mm/d) Temperature ( C) JAN FEB MAR APR MAY JUN JUL AUG SEP OCT NOV DEC -10 JAN FEB MAR APR MAY JUN JUL AUG SEP OCT NOV DEC Months Months ECHAM CRU ECHAM CRU Annual Cycle of Precipitation (BOX B) ECHAM Annual Cycle of Temperature (BOX B) ECHAM Precipitation (mm/d) Temperature ( C) JAN FEB MAR APR MAY JUN JUL AUG SEP OCT NOV DEC 5 JAN FEB MAR APR MAY JUN JUL AUG SEP OCT NOV DEC Months Months ECHAM CRU ECHAM CRU
21 Annual Cycle of Temperature Selected Regions of Pakistan FVGCM Annual Cycle of Precipitation (BOX A) FVGCM Annual Cycle of Temperature (BOX A) FVGCM Precipitation (mm/d) Temperature ( C) JAN FEB MAR APR MAY JUN JUL AUG SEP OCT NOV DEC -10 JAN FEB MAR APR MAY JUN JUL AUG SEP OCT NOV DEC Months Months FVGCM CRU FVGCM CRU Annual Cycle of Precipitation (BOX B) FVGCM Annual Cycle of Temperature (BOX B) FVGCM Precipitation (mm/d) JAN FEB MAR APR MAY JUN JUL AUG SEP OCT NOV DEC Temperature ( C) JAN FEB MAR APR MAY JUN JUL AUG SEP OCT NOV DEC Months Months FVGCM CRU FVGCM CRU
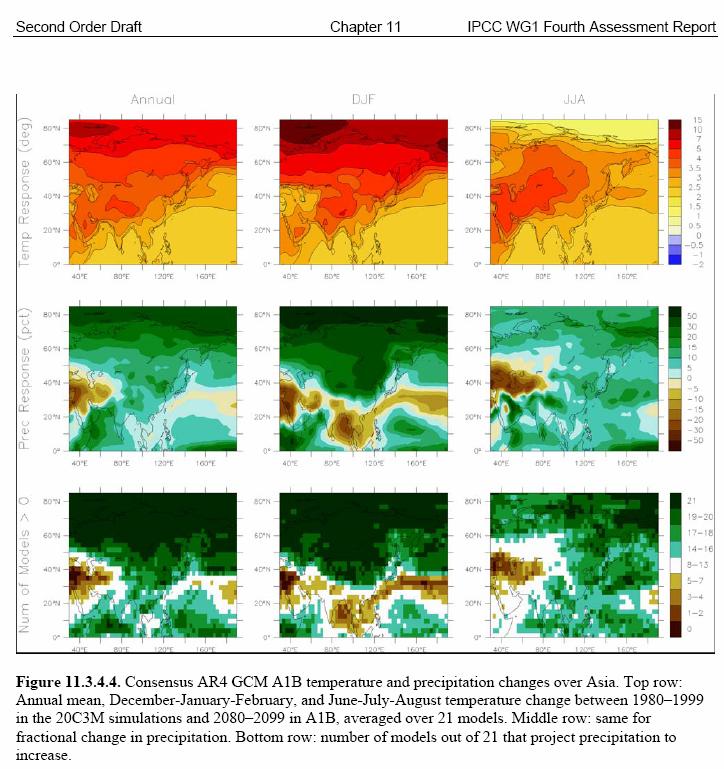
22 Climate Change - Annual
23 Temperature Change ( C ) F1 =2050s F2 =2080s ECHAM - F1 ECHAM - F2 FVGCM - F2
24 Absolute Change in Precipitation (mm/day) ECHAM - F1 ECHAM - F2 FVGCM - F2 F1 =2050s F2 =2080s Percentage Change in Precipitation (%) ECHAM - F1 ECHAM - F2 FVGCM - F2
25 Climate Change - Summer
 ECHAM - F1 ECHAM - F2 FVGCM -")
26 Temperature Change ( C ) F1 =2050s F2 =2080s Summer (JJAS) ECHAM - F1 ECHAM - F2 FVGCM - F2
 ECHAM - F1 ECHAM - F2")
27 Absolute Change in Precipitation (mm/day) ECHAM - F1 ECHAM - F2 FVGCM - F2 F1 =2050s F2 =2080s Percentage Change in Precipitation (%) ECHAM - F1 ECHAM - F2 FVGCM - F2
28 Climate Change - Winter
29 Temperature Change ( C ) F1 =2050s F2 =2080s Winter (DJFM) ECHAM - F1 ECHAM - F2 FVGCM - F2
 ECHAM - F1 ECHAM - F2")
30 Absolute Change in Precipitation (mm/day) ECHAM - F1 ECHAM - F2 FVGCM - F2 F1 =2050s F2 =2080s Percentage Change in Precipitation (%) ECHAM - F1 ECHAM - F2 FVGCM - F2
31 Climate Change - Summary of Precipitation and Temperature Changes over Selected Regions PRECIPITATION (mm/d) % Change TEMPERATURE ( C) Change (ECHAM, ) (ECHAM, ) Annual Summer (JJAS) Winter (DJFM) BOX A BOX B BOX A BOX B Annual Summer (JJAS) Winter (DJFM) (ECHAM, ) (ECHAM, ) BOX A BOX B BOX A BOX B (FVGCM, ) (FVGCM, ) BOX A BOX A BOX B BOX B
32 Climate Change - Annual Cycle of Temperature over Selected Regions of Pakistan ECHAM Annual Cycle of Temperature (BOX A) ECHAM Annual Cycle of Precipitation (BOX A) ECHAM 20 4 Temperature ( C) Precipitation (mm/d) JAN FEB MAR APR MAY JUN JUL AUG SEP OCT NOV DEC 1 JAN FEB MAR APR MAY JUN JUL AUG SEP OCT NOV DEC Months Months BASE FUTURE ( ) BASE FUTURE ( ) Annual Cycle of Temperature (BOX B) ECHAM Annual Cycle of Precipitation (BOX B) ECHAM Temperature ( C) Precipitation (mm/d) JAN FEB MAR APR MAY JUN JUL AUG SEP OCT NOV DEC 0 JAN FEB MAR APR MAY JUN JUL AUG SEP OCT NOV DEC Months Months BASE FUTURE ( ) BASE FUTURE ( )
33 Climate Change - Annual Cycle of Temperature over Selected Regions of Pakistan FVGCM Annual Cycle of Temperature (BOX A) FVGCM Annual Cycle of Precipitation (BOX A) FVGCM Temperature ( C) Precipitation (mm/d) JAN FEB MAR APR MAY JUN JUL AUG SEP OCT NOV DEC 0.5 JAN FEB MAR APR MAY JUN JUL AUG SEP OCT NOV DEC Months Months BASE FUTURE ( ) BASE FUTURE ( ) Annual Cycle of Temperature (BOX B) FVGCM Annual Cycle of Precipitation (BOX B) FVGCM Temperature ( C) Precipitation (mm/d) JAN FEB MAR APR MAY JUN JUL AUG SEP OCT NOV DEC 0 JAN FEB MAR APR MAY JUN JUL AUG SEP OCT NOV DEC Months Months BASE FUTURE ( ) BASE FUTURE ( )
34
35 Acknowledgement We are thankful to Earth System Physics Group (ESP), of Abdus Salam International Centre for Theoretical Physics (ICTP), Trieste Italy for Providing the GCMs Data and Technical Support.
36
37
38
39
40
performance EARTH SCIENCE & CLIMATE CHANGE Mujtaba Hassan PhD Scholar Tsinghua University Beijing, P.R. C
 Temperature and precipitation climatology assessment over South Asia using the Regional Climate Model (RegCM4.3): An evaluation of model performance Mujtaba Hassan PhD Scholar Tsinghua University Beijing,
Regional Climate Change Modeling: An Application Over The Caspian Sea Basin. N. Elguindi and F. Giorgi The Abdus Salam ICTP, Trieste Italy
 Regional Climate Change Modeling: An Application Over The Caspian Sea Basin N. Elguindi and F. Giorgi The Abdus Salam ICTP, Trieste Italy Outline I. Background and historical information on the Caspian
Temperature and rainfall changes over East Africa from multi-gcm forced RegCM projections
 Temperature and rainfall changes over East Africa from multi-gcm forced RegCM projections Gulilat Tefera Diro and Adrian Tompkins - Earth System Physics Section International Centre for Theoretical Physics
GAMINGRE 8/1/ of 7
 FYE 09/30/92 JULY 92 0.00 254,550.00 0.00 0 0 0 0 0 0 0 0 0 254,550.00 0.00 0.00 0.00 0.00 254,550.00 AUG 10,616,710.31 5,299.95 845,656.83 84,565.68 61,084.86 23,480.82 339,734.73 135,893.89 67,946.95
Climate Change Scenarios for Nepal based on Regional Climate Model RegCM3
 FINAL Climate Change Scenarios for Nepal based on Regional Climate Model RegCM3 Jagadishwor Karmacharya, Archana Shrestha, Rupak Rajbhandari, Madan L. Shrestha July, 2007 Department of Hydrology and Meteorology
Global Climates. Name Date
 Global Climates Name Date No investigation of the atmosphere is complete without examining the global distribution of the major atmospheric elements and the impact that humans have on weather and climate.
Chiang Rai Province CC Threat overview AAS1109 Mekong ARCC
 Chiang Rai Province CC Threat overview AAS1109 Mekong ARCC This threat overview relies on projections of future climate change in the Mekong Basin for the period 2045-2069 compared to a baseline of 1980-2005.
Simulation of Air Quality Using RegCM Model
 Simulation of Air Quality Using RegCM Model The Regional Climate Model (RegCM) The Regional Climate Model (RegCM) is one of the RCMs that was originally developed at the National Center for Atmospheric
particular regional weather extremes
 SUPPLEMENTARY INFORMATION DOI: 1.138/NCLIMATE2271 Amplified mid-latitude planetary waves favour particular regional weather extremes particular regional weather extremes James A Screen and Ian Simmonds
Supplementary appendix
 Supplementary appendix This appendix formed part of the original submission and has been peer reviewed. We post it as supplied by the authors. Supplement to: Lowe R, Stewart-Ibarra AM, Petrova D, et al.
BMKG Research on Air sea interaction modeling for YMC
 BMKG Research on Air sea interaction modeling for YMC Prof. Edvin Aldrian Director for Research and Development - BMKG First Scientific and Planning Workshop on Year of Maritime Continent, Singapore 27-3
CORDEX Simulations for South Asia
 WCRP CORDEX South Asia Planning Meeting 25-26 February 2012 Indian Institute of Tropical Meteorology (IITM) Pune, India CORDEX Simulations for South Asia J. Sanjay Centre for Climate Change Research (CCCR)
Sierra Weather and Climate Update
 Sierra Weather and Climate Update 2014-15 Kelly Redmond Western Regional Climate Center Desert Research Institute Reno Nevada Yosemite Hydroclimate Workshop Yosemite Valley, 2015 October 8-9 Percent of
Changing Hydrology under a Changing Climate for a Coastal Plain Watershed
 Changing Hydrology under a Changing Climate for a Coastal Plain Watershed David Bosch USDA-ARS, Tifton, GA Jeff Arnold ARS Temple, TX and Peter Allen Baylor University, TX SEWRU Objectives 1. Project changes
United States Climate
 25-1 Alabama Annual Average Temperature Data Source: http://www.wrcc.dri.edu/cgi-bin/divplot1_form.pl?0106 25-2 How does climate vary as we traverse the U.S. along 40 N? 25-3 Average Temperature Along
Consistent changes in twenty-first century daily precipitation from regional climate simulations for Korea using two convection parameterizations
 Click Here for Full Article GEOPHYSICAL RESEARCH LETTERS, VOL. 35, L14706, doi:10.1029/2008gl034126, 2008 Consistent changes in twenty-first century daily precipitation from regional climate simulations
Impacts of climate change on flooding in the river Meuse
 Impacts of climate change on flooding in the river Meuse Martijn Booij University of Twente,, The Netherlands m.j.booij booij@utwente.nlnl 2003 in the Meuse basin Model appropriateness Appropriate model
I C P A C. IGAD Climate Prediction and Applications Centre Monthly Climate Bulletin, Climate Review for September 2017
 Bulletin Issue October 2017 I C P A C IGAD Climate Prediction and Applications Centre Monthly Climate Bulletin, Climate Review for September 2017 1. INTRODUCTION This bulletin reviews the September 2017
Impact of Climate Change on Water Availability in the Near East
 GLOWA Jordan River Impact of Climate Change on Water Availability in the Near East H. Kunstmann, P. Suppan, A. Heckl Forschungszentrum Karlsruhe, IMK-IFU S. Krichak, P. Alpert, C. Price Tel Aviv University
Atmospheric circulation analysis for seasonal forecasting
 Training Seminar on Application of Seasonal Forecast GPV Data to Seasonal Forecast Products 18 21 January 2011 Tokyo, Japan Atmospheric circulation analysis for seasonal forecasting Shotaro Tanaka Climate
Changes of Terrestrial Water Storage in River Basins of China Projected by RegCM4
 ATMOSPHERIC AND OCEANIC SCIENCE LETTERS, 2013, VOL. 6, NO. 3, 154 160 Changes of Terrestrial Water Storage in River Basins of China Projected by RegCM4 ZOU Jing 1,2, XIE Zheng-Hui 1, QIN Pei-Hua 1, MA
Climate Modeling: From the global to the regional scale
 Climate Modeling: From the global to the regional scale Filippo Giorgi Abdus Salam ICTP, Trieste, Italy ESA summer school on Earth System Monitoring and Modeling Frascati, Italy, 31 July 11 August 2006
Regents Earth Science Unit 7: Water Cycle and Climate
 Regents Earth Science Unit 7: Water Cycle and Climate Name Section Coastal and Continental Temperature Ranges Lab # Introduction: There are large variations in average monthly temperatures among cities
Rainfall and temperature scenarios for Bangladesh for the middle of 21st century using RegCM
 Rainfall and temperature scenarios for Bangladesh for the middle of 21st century using RegCM Md Mizanur Rahman 1,, Md Nazrul Islam 2, Ahsan Uddin Ahmed 3 and FGeorgi 4 1 SAARC Meteorological Research Centre,
Assessment of Temperature Scenarios for Chhattisgarh by using RegCM
 ISSN 2395-1621 Assessment of Temperature Scenarios for Chhattisgarh by using RegCM #1 Kanchan Baudha, #2 L. K. Sharma #1 Dr. C. V. Raman University Kota, (CG) 1 kanchangajbhiye@gmail.com #2 National Institute
Preliminary intercomparison results for NARCCAP, other RCMs, and statistical downscaling over southern Quebec
 Preliminary intercomparison results for NARCCAP, other RCMs, and statistical downscaling over southern Quebec Philippe Gachon Research Scientist Adaptation & Impacts Research Division, Atmospheric Science
WHEN IS IT EVER GOING TO RAIN? Table of Average Annual Rainfall and Rainfall For Selected Arizona Cities
 WHEN IS IT EVER GOING TO RAIN? Table of Average Annual Rainfall and 2001-2002 Rainfall For Selected Arizona Cities Phoenix Tucson Flagstaff Avg. 2001-2002 Avg. 2001-2002 Avg. 2001-2002 October 0.7 0.0
PYROGEOGRAPHY OF THE IBERIAN PENINSULA
 PYROGEOGRAPHY OF THE IBERIAN PENINSULA Teresa J. Calado (1), Carlos C. DaCamara (1), Sílvia A. Nunes (1), Sofia L. Ermida (1) and Isabel F. Trigo (1,2) (1) Instituto Dom Luiz, Universidade de Lisboa, Lisboa,
Effects Of Aerosols On Indian Summer Monsoon Rainfall During El Niño
 International Workshop on Atmospheric Composition and the Asian Summer Monsoon Bangkok 8th-10th June 2015 Effects Of On Indian Summer Monsoon Rainfall During El Niño Suvarna Fadnavis, CHAITRI ROY, Ashok
Average temperature ( F) World Climate Zones. very cold all year with permanent ice and snow. very cold winters, cold summers, and little rain or snow
 World Climate Zones. very cold all year with permanent ice and snow. very cold winters, cold summers, and little rain or snow") P r e v i e w Look carefully at the climagraph of Mumbai, India. What is the wettest month (or months) in Mumbai? What is the driest month (or months) in Mumbai? What effects might this city s climate
P r e v i e w Look carefully at the climagraph of Mumbai, India. What is the wettest month (or months) in Mumbai? What is the driest month (or months) in Mumbai? What effects might this city s climate
Evidence for Weakening of Indian Summer Monsoon and SA CORDEX Results from RegCM
 Evidence for Weakening of Indian Summer Monsoon and SA CORDEX Results from RegCM S K Dash Centre for Atmospheric Sciences Indian Institute of Technology Delhi Based on a paper entitled Projected Seasonal
The Climate of Oregon Climate Zone 5 High Plateau
 105 E55 Unbound issue i". 9 13oes not circulate CZe Special Report 917 May 1993 The Climate of Oregon Climate Zone 5 Property of OREGON STATE UNIVERSITY Library Serials Corvallis, OR 97331-4503 Agricultural
I C P A C. IGAD Climate Prediction and Applications Centre Monthly Climate Bulletin, Climate Review for April 2018
 No. ICPAC/02/312 Bulletin Issue May 2018 I C P A C IGAD Climate Prediction and Applications Centre Monthly Climate Bulletin, Climate Review for April 2018 1. INTRODUCTION This bulletin reviews the April
Climate Change Impact Assessment on Long Term Water Budget for Maitland Catchment in Southern Ontario
 215 SWAT CONFERENCE, PURDUE Climate Change Impact Assessment on Long Term Water Budget for Maitland Catchment in Southern Ontario By Vinod Chilkoti Aakash Bagchi Tirupati Bolisetti Ram Balachandar Contents
The Arctic Energy Budget
 The Arctic Energy Budget The global heat engine [courtesy Kevin Trenberth, NCAR]. Differential solar heating between low and high latitudes gives rise to a circulation of the atmosphere and ocean that
YACT (Yet Another Climate Tool)? The SPI Explorer
? The SPI Explorer") YACT (Yet Another Climate Tool)? The SPI Explorer Mike Crimmins Assoc. Professor/Extension Specialist Dept. of Soil, Water, & Environmental Science The University of Arizona Yes, another climate tool for
YACT (Yet Another Climate Tool)? The SPI Explorer Mike Crimmins Assoc. Professor/Extension Specialist Dept. of Soil, Water, & Environmental Science The University of Arizona Yes, another climate tool for
APPLICATIONS OF DOWNSCALING: HYDROLOGY AND WATER RESOURCES EXAMPLES
 APPLICATIONS OF DOWNSCALING: HYDROLOGY AND WATER RESOURCES EXAMPLES Dennis P. Lettenmaier Department of Civil and Environmental Engineering For presentation at Workshop on Regional Climate Research NCAR
Dynamics of summer monsoon active phases and onset over Pakistan
 Dynamics of summer monsoon active phases and onset over Pakistan F. S. Syed 1, J. H. Yoo 2, H. Körnich 3, F. Kucharski 2 and M. Latif 1 1) Department of Meteorology, COMSATS Institute of Information Technology,
SPECIMEN. Date Morning/Afternoon. A Level Geography H481/01 Physical systems Sample Question Paper. Time allowed: 1 hour 30 minutes PMT
 Oxford Cambridge and RSA A Level Geography H481/01 Physical systems Sample Question Paper Date Morning/Afternoon Time allowed: 1 hour 30 minutes You must have: the Resource Booklet the OCR 12-page Answer
ICPAC. IGAD Climate Prediction and Applications Centre Monthly Bulletin, May 2017
 s` ICPAC Bulletin Issue June 2017 Issue Number: ICPAC/02/302 IGAD Climate Prediction and Applications Centre Monthly Bulletin, May 2017 For referencing within this bulletin, the Greater Horn of Africa
SYSTEM BRIEF DAILY SUMMARY
 SYSTEM BRIEF DAILY SUMMARY * ANNUAL MaxTemp NEL (MWH) Hr Ending Hr Ending LOAD (PEAK HOURS 7:00 AM TO 10:00 PM MON-SAT) ENERGY (MWH) INCREMENTAL COST DAY DATE Civic TOTAL MAXIMUM @Max MINIMUM @Min FACTOR
Introduction to Climate ~ Part I ~
 2015/11/16 TCC Seminar JMA Introduction to Climate ~ Part I ~ Shuhei MAEDA (MRI/JMA) Climate Research Department Meteorological Research Institute (MRI/JMA) 1 Outline of the lecture 1. Climate System (
JMA s Seasonal Prediction of South Asian Climate for Summer 2018
 JMA s Seasonal Prediction of South Asian Climate for Summer 2018 Atsushi Minami Tokyo Climate Center (TCC) Japan Meteorological Agency (JMA) Contents Outline of JMA s Seasonal Ensemble Prediction System
IMPACT OF CLIMATE CHANGE ON RAINFALL INTENSITY IN BANGLADESH
 IMPACT OF CLIMATE CHANGE ON RAINFALL INTENSITY IN BANGLADESH Sonia Binte Murshed 1 *, AKM Saiful Islam 2 and M.Shah Alam Khan 3 1 Lecturer, IWFM, BUET, Dhaka-1000, Email: sonia@iwfm.buet.ac.bd 2 Associtae
IAP Dynamical Seasonal Prediction System and its applications
 WCRP Workshop on Seasonal Prediction 4-7 June 2007, Barcelona, Spain IAP Dynamical Seasonal Prediction System and its applications Zhaohui LIN Zhou Guangqing Chen Hong Qin Zhengkun Zeng Qingcun Institute
2016 Meteorology Summary
 2016 Meteorology Summary New Jersey Department of Environmental Protection AIR POLLUTION AND METEOROLOGY Meteorology plays an important role in the distribution of pollution throughout the troposphere,
Analysis of TRMM Precipitation Radar Measurements over Iraq
 International Journal of Scientific and Research Publications, Volume 6, Issue 12, December 2016 1 Analysis of TRMM Precipitation Radar Measurements over Iraq Munya F. Al-Zuhairi, Kais J. AL-Jumaily, Ali
1. INTRODUCTION 2. HIGHLIGHTS
 Bulletin Issue January 2017 Issue Number: ICPAC/03/44 IGAD Climate Prediction and Applications Centre Seasonal Bulletin, Review for October to December (OND) Season 2016 For referencing within this bulletin,
Climatic and Ecological Conditions in the Klamath Basin of Southern Oregon and Northern California: Projections for the Future
 Climatic and Ecological Conditions in the Klamath Basin of Southern Oregon and Northern California: Projections for the Future A Collaborative Effort by: CLIMATE LEADERSHIP INITIATIVE INSTITUTE FOR A SUSTAINABLE
UPPLEMENT A COMPARISON OF THE EARLY TWENTY-FIRST CENTURY DROUGHT IN THE UNITED STATES TO THE 1930S AND 1950S DROUGHT EPISODES
 UPPLEMENT A COMPARISON OF THE EARLY TWENTY-FIRST CENTURY DROUGHT IN THE UNITED STATES TO THE 1930S AND 1950S DROUGHT EPISODES Richard R. Heim Jr. This document is a supplement to A Comparison of the Early
Early Period Reanalysis of Ocean Winds and Waves
 Early Period Reanalysis of Ocean Winds and Waves Andrew T. Cox and Vincent J. Cardone Oceanweather Inc. Cos Cob, CT Val R. Swail Climate Research Branch, Meteorological Service of Canada Downsview, Ontario,
Climate Change Impact Assessment on Indian Water Resources. Ashvin Gosain, Sandhya Rao, Debajit Basu Ray
 Climate Change Impact Assessment on Indian Water Resources Ashvin Gosain, Sandhya Rao, Debajit Basu Ray Objectives of the Study To quantify the impact of the climate change on the water resources of the
Aquarius Data Release V2.0 Validation Analysis Gary Lagerloef, Aquarius Principal Investigator H. Kao, ESR And Aquarius Cal/Val Team
 Aquarius Data Release V2.0 Validation Analysis Gary Lagerloef, Aquarius Principal Investigator H. Kao, ESR And Aquarius Cal/Val Team Analysis period: Sep 2011-Dec 2012 SMOS-Aquarius Workshop 15-17 April
Future Weather in Toronto and the GTA
 Future Weather in Toronto and the GTA Due to Climate Change Electrical Sector Meeting, Nov. 23 rd, 2011 Christopher Ll. Morgan, PhD Toronto Environment Office Contents 2 Introduction (Why We Did What We
CAVE CLIMATE COMPARISON ACTIVITY BETWEEN THE SURFACE AND THE CAVERN
 CAVE CLIMATE COMPARISON ACTIVITY BETWEEN THE SURFACE AND THE CAVERN Created by Ray Bowers For the Virtual Center for the Environment (VCE) A part of the Institute of Natural Resources Analysis and Management
SYSTEM BRIEF DAILY SUMMARY
 SYSTEM BRIEF DAILY SUMMARY * ANNUAL MaxTemp NEL (MWH) Hr Ending Hr Ending LOAD (PEAK HOURS 7:00 AM TO 10:00 PM MON-SAT) ENERGY (MWH) INCREMENTAL COST DAY DATE Civic TOTAL MAXIMUM @Max MINIMUM @Min FACTOR
SEACLID/CORDEX Southeast Asia: A Regional Initiative to Provide Regional Climate Change Information and Capacity Building
 SEACLID/CORDEX Southeast Asia: A Regional Initiative to Provide Regional Climate Change Information and Capacity Building Liew Ju Neng SEACLID/CORDEX Southeast Asia School of Environment and Natural Sciences
Climate and Regional Sustainability
 Climate and Regional Sustainability Anond Snidvongs Southeast Asia START Regional Center Chulalongkorn University Bangkok, Thailand Topics Southeast Asia, a monsoon influenced region Global-regional climate
Physical Features of Monsoon Asia. 192 Unit 7 Teachers Curriculum Institute 60 N 130 E 140 E 150 E 60 E 50 N 160 E 40 N 30 N 150 E.
 50 N 60 E 70 E 80 E 90 E 100 E 60 N 110 E 120 E 130 E 140 E 150 E 50 N 160 E 40 N 40 N 30 N 60 E 30 N 150 E Tropic of Cancer 20 N Tropic of Cancer 20 N 10 N 10 N 0 Equator 0 Equator 10 S 10 S 0 500 1,000
On the presence of tropical vortices over the Southeast Asian Sea- Maritime Continent region
 Technical Conference of 50 th Annual Session of Typhoon Committee 2018 On the presence of tropical vortices over the Southeast Asian Sea- Maritime Continent region Nguyen Dang-Quang 1, James Renwick 2,
I C P A C IGAD Climate Prediction & Applications centre
 s` I C P A C IGAD Climate Prediction & Applications centre Bulletin Issue July 2017 Issue Number: ICPAC/02/303 IGAD Climate Prediction and Applications Centre Monthly Climate Bulletin, June 2017 1. INTRODUCTION
DROUGHT IN MAINLAND PORTUGAL
 DROUGHT IN MAINLAND Ministério da Ciência, Tecnologia e Ensino Superior Instituto de Meteorologia, I. P. Rua C Aeroporto de Lisboa Tel.: (351) 21 844 7000 e-mail:informacoes@meteo.pt 1749-077 Lisboa Portugal
AMMA Conference 28 November-2 December, 2005 Dakar, Senegal. Multiyear Streamflow and Rainfall In the Ankobra River, Ghana
 AMMA Conference 28 November-2 December, 2005 Dakar, Senegal Multiyear Streamflow and Rainfall In the Ankobra River, Ghana 1961-2003 Michael M. Tanu, Karen I. Mohr, and Anantha R. Aiyyer Department of Earth
Climate change outlook over the Mediterranean from the science respective
 Climate change outlook over the Mediterranean from the science respective Ashraf Zakey(1), F. Giorgi(2) (1) The Egyptian Meteorological Authority (2) The International Center for Theoretical Physics (ICTP)-Italy
Changes in spatial distribution of chub mackerel under climate change: the case study using Japanese purse seine fisheries data in the East China Sea
 Changes in spatial distribution of chub mackerel under climate change: the case study using Japanese purse seine fisheries data in the East China Sea Tohya Yasuda, Ryuji Yukami, Seiji Ohshimo Seikai National
Seasonal Climate Outlook for South Asia (June to September) Issued in May 2014
 Issued in May 2014") Ministry of Earth Sciences Earth System Science Organization India Meteorological Department WMO Regional Climate Centre (Demonstration Phase) Pune, India Seasonal Climate Outlook for South Asia (June
Ministry of Earth Sciences Earth System Science Organization India Meteorological Department WMO Regional Climate Centre (Demonstration Phase) Pune, India Seasonal Climate Outlook for South Asia (June
CORDEX South Asia: Overview and Performance of Regional Climate Models
 Seventh ICTP Workshop on THE THEORY AND USE OF REGIONAL CLIMATE MODELS 12-23 May 2014 Miramare, Trieste, Italy CORDEX South Asia: Overview and Performance of Regional Climate Models J. Sanjay Centre for
MONITORING THE EFFECTS OF CLIMATE CHANGE ON SPRINGS, SEEPS AND OTHER WATER NATIONAL PRESERVE
 MONITORING THE EFFECTS OF CLIMATE CHANGE ON SPRINGS, SEEPS AND OTHER WATER RESOURCES IN THE MOJAVE NATIONAL PRESERVE Boris Poff and Debra Hughson Mojave National Preserve, California CLIMATE CHANGE Predictions
Application of the Ems-Wrf Model in Dekadal Rainfall Prediction over the Gha Region Franklin J. Opijah 1, Joseph N. Mutemi 1, Laban A.
 Application of the Ems-Wrf Model in Dekadal Rainfall Prediction over the Gha Region Franklin J. Opijah 1, Joseph N. Mutemi 1, Laban A. Ogallo 2 1 University of Nairobi; 2 IGAD Climate Prediction and Applications
Seasonal Climate Watch June to October 2018
 Seasonal Climate Watch June to October 2018 Date issued: May 28, 2018 1. Overview The El Niño-Southern Oscillation (ENSO) has now moved into the neutral phase and is expected to rise towards an El Niño
What is the difference between Weather and Climate?
 What is the difference between Weather and Climate? Objective Many people are confused about the difference between weather and climate. This makes understanding the difference between weather forecasts
Seasonal Climate Watch April to August 2018
 Seasonal Climate Watch April to August 2018 Date issued: Mar 23, 2018 1. Overview The El Niño-Southern Oscillation (ENSO) is expected to weaken from a moderate La Niña phase to a neutral phase through
Climate Variability in South Asia
 Climate Variability in South Asia V. Niranjan, M. Dinesh Kumar, and Nitin Bassi Institute for Resource Analysis and Policy Contents Introduction Rainfall variability in South Asia Temporal variability
GLACIER AND SNOWMELT MODELLING USING SWAT: GANGA BASIN CASE STUDY. INRM Consultants Pvt. Ltd.
 GLACIER AND SNOWMELT MODELLING USING SWAT: GANGA BASIN CASE STUDY INRM Consultants Pvt. Ltd. Introduction Snowmelt Runoff contribution in the Himalayan Rivers Estimation of Average contribution of Snowmelt
Probabilistic predictions of monsoon rainfall with the ECMWF Monthly and Seasonal Forecast Systems
 Probabilistic predictions of monsoon rainfall with the ECMWF Monthly and Seasonal Forecast Systems Franco Molteni, Frederic Vitart, Tim Stockdale, Laura Ferranti, Magdalena Balmaseda European Centre for
Introduction. Observed Local Trends. Temperature Rainfall Tropical Cyclones. Projections for the Philippines. Temperature Rainfall
 PAGASA-DOST ntroduction Observed Local Trends Temperature Rainfall Tropical Cyclones Projections for the Philippines Temperature Rainfall Climate Change ssue ncreased use of fossil fuel Global Warming
REGIONAL CLIMATE SIMULATION OVER ASIA UNDER THE GLOBAL WARMING NESTED IN THE CCSR/NIES AGCM
 REGIONAL CLIMATE SIMULATION OVER ASIA UNDER THE GLOBAL WARMING NESTED IN THE CCSR/NIES AGCM KOJI DAIRAKU Atmospheric Environment Division, National Institute for Environmental Studies, 16-2 Onogawa Tsukuba,
The Australian Summer Monsoon
 The Australian Summer Monsoon Aurel Moise, Josephine Brown, Huqiang Zhang, Matt Wheeler and Rob Colman Australian Bureau of Meteorology Presentation to WMO IWM-IV, Singapore, November 2017 Outline Australian
Decadal Changes of Rainfall and Temperature Extremes over the different Agro Economical Zones (AEZ) of Bangladesh
 of Bangladesh") Decadal Changes of Rainfall and Temperature Extremes over the different Agro Economical Zones (AEZ) of Bangladesh Professor A.K.M. Saiful Islam Md. Alfi Hasan Institute of Water and Flood Management Bangladesh
Decadal Changes of Rainfall and Temperature Extremes over the different Agro Economical Zones (AEZ) of Bangladesh Professor A.K.M. Saiful Islam Md. Alfi Hasan Institute of Water and Flood Management Bangladesh
2003 Water Year Wrap-Up and Look Ahead
 2003 Water Year Wrap-Up and Look Ahead Nolan Doesken Colorado Climate Center Prepared by Odie Bliss http://ccc.atmos.colostate.edu Colorado Average Annual Precipitation Map South Platte Average Precipitation
Climatography of the United States No
 Climate Division: CA 6 NWS Call Sign: 1L2 N Lon: 118 3W Month (1) Min (2) Month(1) Extremes Lowest (2) Temperature ( F) Lowest Month(1) Degree s (1) Base Temp 65 Heating Cooling 1 Number of s (3) Jan 63.7
Climatography of the United States No
 Climate Division: AK 5 NWS Call Sign: ANC Month (1) Min (2) Month(1) Extremes Lowest (2) Temperature ( F) Lowest Month(1) Degree s (1) Base Temp 65 Heating Cooling 90 Number of s (3) Jan 22.2 9.3 15.8
Variability of Reference Evapotranspiration Across Nebraska
 Know how. Know now. EC733 Variability of Reference Evapotranspiration Across Nebraska Suat Irmak, Extension Soil and Water Resources and Irrigation Specialist Kari E. Skaggs, Research Associate, Biological
Climate change impact on precipitation for the Amazon and La Plata basins
 Climate change impact on precipitation for the Amazon and La Plata basins Marta Llopart Erika Coppola, Filippo Giorgi, Rosmeri da Rocha, Santiago Cuadra Amazon Basin (AMZ) is on of the most important watershed
The PRECIS Regional Climate Model
 The PRECIS Regional Climate Model General overview (1) The regional climate model (RCM) within PRECIS is a model of the atmosphere and land surface, of limited area and high resolution and locatable over
Constructing a typical meteorological year -TMY for Voinesti fruit trees region and the effects of global warming on the orchard ecosystem
 Constructing a typical meteorological year -TMY for Voinesti fruit trees region and the effects of global warming on the orchard ecosystem ARMEANU ILEANA*, STĂNICĂ FLORIN**, PETREHUS VIOREL*** *University
Regional climate modelling using CCAM: simulations for CORDEX
 Regional climate modelling using CCAM: simulations for CORDEX John McGregor, Jack Katzfey, Kim Nguyen and Marcus Thatcher CSIRO Marine and Atmospheric Research Aspendale, Melbourne Pune 16 October 2012
TRENDS AND CHANGE IN CLIMATE OVER THE VOLTA RIVER BASIN
 TRENDS AND CHANGE IN CLIMATE OVER THE VOLTA RIVER BASIN VOLTRES PROJECT WORK PACKAGE 1a: CLIMATE KEY RESULTS E. Obuobie, H.E. Andersen, C. Asante-Sasu, M. Osei-owusu 11/9/217 OBJECTIVES Analyse long term
Will a warmer world change Queensland s rainfall?
 Will a warmer world change Queensland s rainfall? Nicholas P. Klingaman National Centre for Atmospheric Science-Climate Walker Institute for Climate System Research University of Reading The Walker-QCCCE
Climatography of the United States No
 Climate Division: ND 8 NWS Call Sign: BIS Month (1) Min (2) Month(1) Extremes Lowest (2) Temperature ( F) Lowest Month(1) Degree s (1) Base Temp 65 Heating Cooling 100 Number of s (3) Jan 21.1 -.6 10.2
S e a s o n a l F o r e c a s t i n g f o r t h e E u r o p e a n e n e r g y s e c t o r
 S e a s o n a l F o r e c a s t i n g f o r t h e E u r o p e a n e n e r g y s e c t o r C3S European Climatic Energy Mixes (ECEM) Webinar 18 th Oct 2017 Philip Bett, Met Office Hadley Centre S e a s
Climatography of the United States No
 Climate Division: CA 5 NWS Call Sign: Elevation: 6 Feet Lat: 37 Month (1) Min (2) Month(1) Extremes Lowest (2) Temperature ( F) Lowest Month(1) Degree s (1) Base Temp 65 Heating Cooling 1 Number of s (3)
Climatography of the United States No
 Climate Division: CA 4 NWS Call Sign: Elevation: 2 Feet Lat: 37 Month (1) Min (2) Month(1) Extremes Lowest (2) Temperature ( F) Lowest Month(1) Degree s (1) Base Temp 65 Heating Cooling 1 Number of s (3)
Climatography of the United States No
 Climate Division: CA 4 NWS Call Sign: Elevation: 13 Feet Lat: 36 Month (1) Min (2) Month(1) Extremes Lowest (2) Temperature ( F) Lowest Month(1) Degree s (1) Base Temp 65 Heating Cooling 1 Number of s
Climatography of the United States No
 Climate Division: CA 5 NWS Call Sign: Elevation: 1,14 Feet Lat: 36 Month (1) Min (2) Month(1) Extremes Lowest (2) Temperature ( F) Lowest Month(1) Degree s (1) Base Temp 65 Heating Cooling 1 Number of
ENSO Outlook by JMA. Hiroyuki Sugimoto. El Niño Monitoring and Prediction Group Climate Prediction Division Japan Meteorological Agency
 ENSO Outlook by JMA Hiroyuki Sugimoto El Niño Monitoring and Prediction Group Climate Prediction Division Outline 1. ENSO impacts on the climate 2. Current Conditions 3. Prediction by JMA/MRI-CGCM 4. Summary
Future extreme precipitation events in the Southwestern US: climate change and natural modes of variability
 Future extreme precipitation events in the Southwestern US: climate change and natural modes of variability Francina Dominguez Erick Rivera Fernandez Hsin-I Chang Christopher Castro AGU 2010 Fall Meeting
Stratospheric sulfate geoengineering has limited efficacy and increases tropospheric burdens
 Stratospheric sulfate geoengineering has limited efficacy and increases tropospheric burdens Jason English PhD Candidate Laboratory for Atmospheric and Space Physics, and Department of Atmospheric and
Stratospheric sulfate geoengineering has limited efficacy and increases tropospheric sulfate burdens
 Stratospheric sulfate geoengineering has limited efficacy and increases tropospheric sulfate burdens Jason English PhD Candidate Laboratory for Atmospheric and Space Physics, and Department of Atmospheric
SC-WACCM! and! Problems with Specifying the Ozone Hole
 SC-WACCM! and! Problems with Specifying the Ozone Hole R. Neely III, K. Smith2, D. Marsh,L. Polvani2 NCAR, 2Columbia Thanks to: Mike Mills, Francis Vitt and Sean Santos Motivation To design a stratosphere-resolving