Exploring Climate Influences
|
|
|
- Walter Edwards
- 6 years ago
- Views:
Transcription


1 Exploring Climate Influences
2 Purpose Students are able to identify the influence of latitude, elevation, proximity to water and physical features on their local climate by analyzing 30 years of monthly temperature and precipitation data. Overview Students examine the characteristics of the earth s tropical, temperate and polar zones by analyzing 30 years of monthly temperature and precipitation patterns in pre-selected cities around the world. In their investigation, students observe temperature and precipitation patterns associated with changes in latitude, elevation, proximity to water and physical features. Students summarize their investigations by describing how latitude, elevation, physical features and proximity to water affect their local climate. Student Outcomes Students will be able to: Interpret a graph of 30 year temperature and precipitation data; Identify physical factors that influence temperature and precipitation patterns; Compare temperature and precipitation patterns on a regional basis; Define the climate of a given region. Science Concepts Physical Sciences Heat energy is transferred by conduction, convection and radiation. Heat moves from warmer to colder objects. Sun is a major source of energy for changes on the Earth s surface. Earth and Space Sciences Weather changes from day to day and over the seasons. Seasons result from variations in solar Insolation resulting from the tilt of the Earth s rotation axis. Solar isolation drives atmospheric and ocean circulation. Scientific Inquiry Abilities Comparing graphs and analyzing data to determine the effects of latitude, elevation, physical features and proximity to water. Drawing conclusions about which factors can influence climate Generating questions and developing hypotheses Designing and conducting an investigation Develop explanations and predictions using evidence. Recognize and analyze alternative explanations. Communicating conclusions to others Time: 1 class period (@ 50 minutes) Level: Intermediate, Advanced Materials and Tools Exploring the Influence of Climate map of the world handout Exploring the Influence of Climate world city data handouts 1
3 The Essential Principles of Climate Literacy Connections 1 : The Sun is the primary source of energy for Earth 's climate system. While sunlight energizes the Earth's climate system, seasonal cycles, orbital cycles and other variables effect the energy balance on the Earth' surface. Learn more about teaching about the Sun's energy 2 : Climate is regulated by complex interactions among components of the Earth system. The natural Greenhouse Effect, regional geography, the oceans, the atmosphere and biota all exert controls over parts of the climate system. Feedbacks between different parts of the earth system can either amplify or mitigate changes in the climate. Learn more about teaching the components of climate system 4 : Climate varies over space and time through both natural and man-made processes. While weather is variable on short time scales, the Earth's overall climate also varies over longer time intervals. Natural processes that influence changes in climate do not account for recent increases of greenhouse gases, temperatures and sea level rise. Learn more about teaching climate variability 5: Our understanding of the climate system is improved through observations, theoretical studies, and modeling. Changes in the climate system are recorded by observations, direct measurements, and the geologic record. Computer models can be used to reconstruct past climates, project future climate scenarios, and guide decisions. Learn more about teaching with this principle Preparation Copies of the Exploring the Influences of Climate handouts Assemble necessary data and information for students to explore their community (atlas, latitude, climate zone, elevation, approximate proximity to water) Prerequisites Students should understand that Insolation levels vary with latitude, and that latitude has a powerful influence in determining seasonal conditions and the annual patterns of environmental and climatic parameters such as precipitation and temperature. For a more complete discussion, refer to The Seasonal Picture: Why Are There Seasons? in the Introduction to Earth As a System Investigation. Crosswalks to Other GLOBE Learning Activities See Earth as a System Investigation: Using Graphs to Show Connections for another graphing exercise in which students construct graphs of air, soil, and water temperatures. Student graphs are then interpreted and interconnections explored. 2

 (Image 1) (Image 2) Displaying Data: To display City Data, select the city by clicking on it on the map display.")

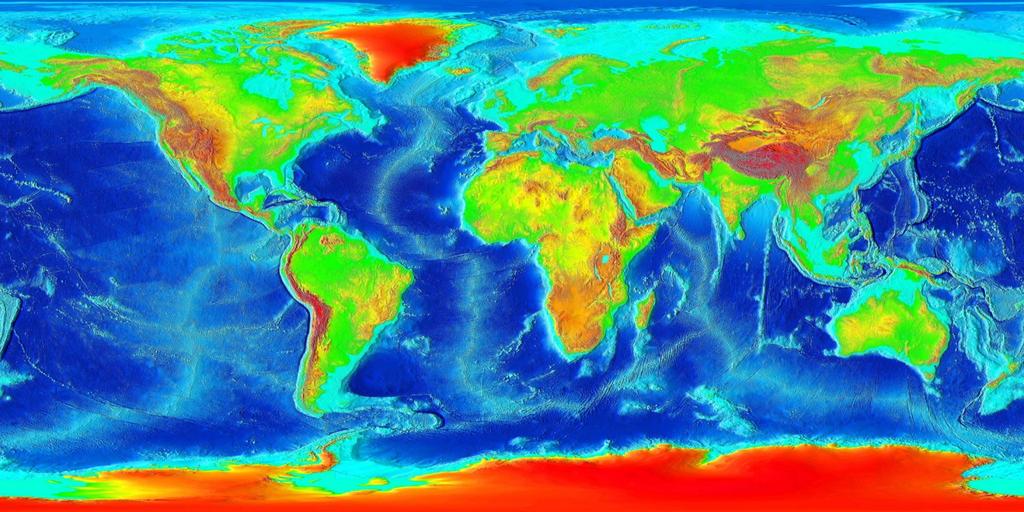
4 Exploring Climate Influences Activity using the Google Earth Plug-In To provide a unique interactive experience with this activity use the Google Earth Plug-In located on the pilot page at Getting Started: Each Investigation has been grouped so users can isolate cities unique to each Investigation. Investigations can be found below the plug-in and displayed by checking the box on the left. (Image 1) (Image 1) (Image 2) Displaying Data: To display City Data, select the city by clicking on it on the map display. To download the city data, select the format, Excel or CSV, below the graph. (Image 2) To enlarge the graph in a new web page, simply Click on the graph. To return to the map display close the new page. (Image 3) (Image 3) (Image 4) Displaying Global Climate Zones: An additional teaching tool that displays significant lines of latitude, 0, 30 N, 30 S, 60 N, 60 S and Tropical, Temperate and Polar Climate Zones can be displayed by selecting Global Climate Zones. (Image 4) 3
5 What To Do And How To Do It Setting the Stage: 15 minutes 1. Set the stage for the lesson by asking students to name the locations that they believe to be the hottest and coldest on earth. Briefly compare their choices and the reasoning behind them. 2. Distribute the Exploring the Influence of Climate map of the world handout. Working in pairs or small groups, students should identify what they believe to be the three hottest and coldest cities in July. 3. After several minutes, each group should share their list with the rest of the class. Record a tally of the cities mentioned as each group reports. Based on the tally, circle the three cities that were listed most often. 4. Explain to students that they will be given the opportunity to explore some of the influences on climate using temperature and precipitation data from a set of pre-selected cities around the world. As they complete the investigations, they will have an opportunity to check their answers on the student handout map and reconsider them in view of what they have learned. Investigating Physical Influences on Climate: 10 minutes for each of 4 investigations 5. Distribute the Influences of Climate Activity and the accompanying world city data and have students begin with Investigation 1 and continue through Investigation 4 recording their answers on the answer sheet. Wrap-up: 10 minutes 6. When students have finished each investigation, lead a class discussion that summarizes the conclusions they have reached. Be sure to address the influence of each of the following, latitude, elevation, proximity to water and physical features. After students have had an opportunity to share their conclusions, discuss the similarities and differences among the ideas presented. Allow students to questions each other and clarify confusing or contradictory statements. 7. Ask the class, how many students, after completing each Investigation changed their list of 3 hottest and 3 coldest city answers on their world map? 4


6 NAME Date Exploring the Influence of Climate Outline map of the world Three hottest cities in July: Three coldest cities in July: Student handout 5
7 6
8 Investigation 1: Investigate the influence of latitude on climate The influence of latitude on climate is part of the earth-sun relationship. During the earth s annual revolution around the sun, the sun s direct rays fall upon the planet in a regular pattern. The pattern can be correlated with zones of latitude to describe climate zones. Within each latitude zone, the climate follows general patterns. 1) Make a prediction about how monthly temperature and precipitation change as latitude increases. 2) Complete the table below using Exploring the Influence of Climate world city data handouts Lowest Global Climate Proximity to City Latitude Elevation Coldest Month Temperature Zone Water ( C) Hottest Month Highest Temperature ( C) Temperature Range over 12 months Tokyo, Japan Sydney, Australia Cape Town, South Africa Anchorage, United States Riyadh, Saudi Arabia 3) After viewing your world map as well as the results from the tables above, write a statement about how the monthly temperature and precipitation change as latitude increases. 7
9 Test your statement 4) Complete the tables below using the Exploring the Influence of Climate world city data handouts City Latitude Global Climate Zone Elevation Proximity to Water Coldest Month Lowest Temperature ( C) Hottest Month Highest Temperature ( C) Temperature Range over 12 months Reykjavik, Iceland Cairo, Egypt Ottawa, Canada Dar es Salaam, Tanzania Santiago, Chile 5) Do the results from the tables above confirm or dispute your statement made in #3 above? Explain. 8
10 Investigation 2: Investigate the influence of elevation on climate Due to the relationship between the elevation of a place and its temperature, changes in elevation can affect the environment as much as changes in latitude. In this investigation you will investigate the relationship between elevation and climate. 1) Make a prediction about how monthly temperature and precipitation change as elevation increases. 2) Complete the table below using the Exploring the Influence of Climate world city data handouts. City Santo Domingo, Dominican Republic Miami, USA Panama City, Panama Manila, Philippines Bangkok, Thailand Addis Ababa, Ethiopia Bangalore, India Mexico City, Mexico Quito, Ecuador Latitude 3) After viewing the world map, and the results from the chart above, what do these cities have in common in terms of their location on earth? 4) After viewing each cities data, describe what these cities have in common as to their temperature and precipitation patterns? 5) Which cities are different from the others? How are they different? 9
11 6) Since all of these cities are located in the tropical climate zone, what other factor could explain the difference in their temperature and precipitation patterns? 7) Complete the table below using the Exploring the Influence of Climate world city data handouts. City Santo Domingo, Dominican Republic Miami, USA Panama City, Panama Manila, Philippines Bangkok, Thailand Addis Ababa, Ethiopia Bangalore, India Mexico City, Mexico Quito, Ecuador Elevation 8) Based on your observations of climate in the tropical climate zone and the information in the table above, create a statement about the influences of elevation on temperature. 9) How did your predictions form Question 1 above, compare to your observations and the data in the tables above showed? 10
12 Investigation 3: Investigate the influence of proximity to water on climate Climate varies dramatically depending on the amount of precipitation as well as the proximity to water in an environment. Ocean currents affect climate in the coastal lands along which they flow. Cold ocean currents cool the lands they pass while warm ocean currents bring warmer temperatures. Therefore, the size of a continent affects both the temperature range and the amount of moisture in the interior. The larger the continent, the further away the ocean and the larger the difference between summer and winter. In this investigation you will investigate the relationship between proximity to water and climate. 1) Make a prediction about how monthly temperature and precipitation change as you move further away from a large body of water. 2) Complete the table below using the Exploring the Influence of Climate world city data handouts. City Latitude Elevation Proximity to Water London, England Amsterdam, Netherlands Berlin, Germany Warsaw, Poland Kiev, Ukraine 3) After viewing your world map as well as the results from the chart above, what do these cities have in common regarding their location on earth and elevation? 4) After viewing each cities temperature data, complete the table below. City London, England Amsterdam, Netherlands Berlin, Germany Warsaw, Poland Kiev, Ukraine Coldest mean monthly temperature Approximate mean yearly temperature 11
13 5) After viewing each cities temperature and precipitation data, which cities have the mildest winter temperatures? (winter in the northern hemisphere is considered to be from December through February) 6) What happens to the winter temperatures as you move from London to Kiev? 7) Based on observations of climate of several cities with similar latitude, create a statement about the influence of proximity to water, or distance from it, on patterns of temperature. 8) How did your predictions from Question 1 above, reflect what your observations and the data in the table showed? Revisit your initial observations 1) After conducting Investigations 1 through 3, revisit your initial answers on the world map of the 3 hottest and coldest cities in July. Make any changes to your answers if needed. 12
14 Investigation 4: Investigate the influence of physical features on your community The surface features of the earth, such as bodies of water and mountains can influence the climate of a location. The climates of two locations at the same latitude can be very different, depending on the presence or absence of certain landforms. For example, large bodies of water are slower to heat and cool than land. As a result, water temperatures are more uniform and constant than land temperatures due to the high specific heat of water. Mountain ranges also influence precipitation and affect climate. Air is cooled when winds blow over a body of water and are pushed upward over a mountain range, resulting in the release of moisture in the form of precipitation. This precipitation falls in the form of rain and snow on the more on the windward side of the mountain, the side of the mountain facing the wind. After the precipitation is released, winds become warmer and drier as they descend on the opposite or leeward side of the mountain. This is called a rain shadow. This rain shadow effect often causes dry areas and even deserts to develop on the leeward sides of mountain ranges. 1) Using a map sketch an aerial view of your community reaching out 250 Km in all directions in the area below. 13
15 2) With the help of your teacher, complete the following information for your community. City Latitude Global Climate Zone Elevation Proximity to Water 3) Based upon all of the work that you have done previously, what do you believe to be the most significant influences on climate where you live? Provide an explanation supporting your statement. Explore Further: Create a Climograph for your Location Use the following instructions to download 30 year precipitation and temperature data for the area where you live to create a climograph. Using the investigations 1 through 4 compare your local data to the city data provide to explore the influence of each of the following, latitude, elevation, proximity to water and physical features. 1. Create a hypothesis about the primary influence of climate on their area in which you live. 2. If you were to conduct a research investigation about the primary influence of your local climate, what data would you want to collect to confirm your hypothesis 14
16 15
17 Finding and Formatting Temperature, Precipitation & Location Data for Student Research Find the Latitude and Longitude of a Study Site (city) Use the MY NASA Data Lat / Long Tool to locate your location anywhere on earth Pan and zoom the map to find your location and double click to show your latitude and longitude. Precipitation Data Set 1) Open the Intermediate Edition of the Live Access Server (LAS) 2) Click Water link, then Monthly Precipitation (CMAP). (Click Next) 3) Enter the following parameters Select view: Time series Select output: ASCII file (text file) Select region: Of Study Site Location Enter Latitude and Longitude: to the right of the map. Select time range: below the map 4) All other values should remain on default Select Next 5) When data opens in a new window, right click (Your ASCII file) and select (save link as) to save your data as a text file. 6) Data Variable: Average Monthly Rate of Precipitation (measured in mm/day) Temperature Data Set 1) Open the NOAA NNDC Climate Data Server 2) Select your Region or Country (Click Continue) 3) Select your State or Region if needed (Click Continue) 4) Select the desired weather station (Click Continue Select time range: All other values should remain on default (Click Continue) 5) When data opens in a new window, right click (Your txt file) and select (save link as) to save your data. 6) Data Variable: Mean temperature for the day (measured in degrees Fahrenheit) 16
18 Opening MY NASA DATA & NOAA Data in Excel 1) After downloading data from MY NAA Data & NOAA Web Sites, Open a new Excel spreadsheet 2) Click on the Data Menu, select From Text. A Browse window should open. Select the text file corresponding to the downloaded Data set that you would like to view. 3) Follow the Text Import Wizard; These Data sets are either tab or space delimited. The wizard should detect this structure. Simply click Next several times then select Finish, and put the data in the existing worksheet. 4) Repeat Process for second data set if needed 5) Analyze your data set using Excel tools Setting up Climatograms for Precipitation Data in Excel 1. After downloading your data set into a Excel Spreadsheet 2. Place the initials of each month in Column A 3. Place the amount of precipitation for each month in Column B 4. Highlight all values in Columns A and B 5. Click on the Insert Tab on the Toolbar above 6. Select the Line Chart drop down menu. Select Line Graph 7. Select the Chart Layout you would like from the Toolbar above 8. Label the Chart Title Total Precipitation, city name, year 9. Label the y-axis Precipitation (cm) Setting up Climatograms for Temperature Data in Excel 1. After downloading your data set into a Excel Spreadsheet 2. Follow these steps to Convert Degrees Fahrenheit to Degrees Celsius Click on Row D, to highlight the entire row Right Click and select Insert, to Insert a new row In that new row, Select the cell to the left of the first numeric temperature data Insert the following formula into the cell and select return =(E2-32)*(5/9) Next, select that same cell, Mouse over the lower right corner of the cell Drag the cell down to end of your data. 3. Highlight all values in Columns C and D 4. Click on the Insert Tab on the Toolbar above 5. Select the Column Chart drop down menu. 6. Select the Chart Layout you would like from the Toolbar above 7. Label the Chart Title Average Temperature, city name, year 8. Label the y-axis Temperature (C) 17
19 30 year ( ) mean air temperature (C) & total precipitation (mm) (Source: NNDC) 30 year ( ) mean air temperature (C) & total precipitation (mm) (Source: NNDC) Addis Ababa, Ethiopia Latitude: 9.14 N Longitude: E Elevation: 2,355 meters Climate Zone: Tropical Zone Proximity to 663 kilometers Amsterdam, Netherlands Latitude: N Longitude: 4.53 E Elevation: 2 meters Climate Zone: Temperate Zone Proximity to Water: Located on Water 18
20 30 year ( ) mean air temperature (C) & total precipitation (mm) (Source: NNDC) 30 year ( ) mean air temperature (C) & total precipitation (mm) (Source: NNDC) Anchorage, Alaska USA Latitude: N Longitude: W Elevation: 31 meters Climate Zone: Polar Zone Proximity to Water: Located on Water Bangalore, India Latitude: N Longitude: E Elevation: 920 meters Climate Zone: Tropical Zone Proximity to 300 kilometers 19

21 year ( ) mean air temperature (C) & total precipitation (mm) (Source: NNDC) 30 year ( ) mean air temperature (C) & total precipitation (mm) (Source: NNDC) Bangkok, Thailand Latitude: N Longitude: E Elevation: 2 meters Climate Zone: Tropical Zone Proximity to Water: Located on Water Berlin, Germany Latitude: N Longitude: E Elevation: 35 meters Climate Zone: Temperate Zone Proximity to 500 kilometers 20
22 30 year ( ) mean air temperature (C) & total precipitation (mm) (Source: NNDC) 30 year ( ) mean air temperature (C) & total precipitation (mm) (Source: NNDC) Cairo, Egypt Latitude: N Longitude: E Elevation: 23 meters Climate Zone: Temperate Zone Proximity to Water: Located on Water Cape Town, South Africa Latitude: N Longitude: E Elevation: 7 meters Climate Zone: Temperate Zone Proximity to Water: Located on Water 21
23 30 year ( ) mean air temperature (C) & total precipitation (mm) (Source: NNDC) 30 year ( ) mean air temperature (C) & total precipitation (mm) (Source: NNDC) Dar es Salaam, Tanzania Latitude: S Longitude: E Elevation: 55 meters Climate Zone: Tropical Zone Proximity to Water: Located on Water Kiev, Ukraine Latitude: N Longitude: E Elevation: 179 meters Climate Zone: Temperate Zone Proximity to 1,600 kilometers 22
24 30 year ( ) mean air temperature (C) & total precipitation (mm) (Source: NNDC) 30 year ( ) mean air temperature (C) & total precipitation (mm) (Source: NNDC) London, England Latitude: N Longitude: W Elevation: 24 meters Climate Zone: Temperate Zone Proximity to 70 kilometers Mexico City, Mexico Latitude: N Longitude: W Elevation: 2,260 meters Climate Zone: Tropical Zone Proximity to 250 kilometers 23
 & total precipitation (mm) (Source: NNDC) Manila, Philippians Latitude: 14.")

25 year ( ) mean air temperature (C) & total precipitation (mm) (Source: NNDC) 30 year ( ) mean air temperature (C) & total precipitation (mm) (Source: NNDC) Manila, Philippians Latitude: N Longitude: E Elevation: 16 meters Climate Zone: Tropical Zone Proximity to Water: Located on Water Miami, Florida USA Latitude: N Longitude: W Elevation: 2 meters Climate Zone: Tropical Zone Proximity to Water: Located on Water 24

26 30 year ( ) mean air temperature (C) & total precipitation (mm) (Source: NNDC) 30 year ( ) mean air temperature (C) & total precipitation (mm) (Source: NNDC) Ottawa, Canada Latitude: N Longitude: W Elevation: 70 meters Climate Zone: Temperate Zone Proximity to 300 kilometers Panama City, Panama Latitude: N Longitude: W Elevation: 2 meters Climate Zone: Tropical Zone Proximity to Water: Located on Water 25
27 30 year ( ) mean air temperature (C) & total precipitation (mm) (Source: NNDC) 30 year ( ) mean air temperature (C) & total precipitation (mm) (Source: NNDC) Quito, Ecuador Latitude: S Longitude: W Elevation: 2,850 meters Climate Zone: Tropical Zone Proximity to 200 kilometers Reykjavik, Iceland Latitude: N Longitude: W Elevation: 16 meters Climate Zone: Polar Zone Proximity to Water: Located on Water 26
28 30 year ( ) mean air temperature (C) & total precipitation (mm) (Source: NNDC) 30 year ( ) mean air temperature (C) & total precipitation (mm) (Source: NNDC) Riyadh, Saudi Arabia Latitude: N Longitude: E Elevation: 618 meters Climate Zone: Tropical Zone Proximity to 500 kilometers Santiago, Chile Latitude: S Longitude: W Elevation: 520 meters Climate Zone: Temperate Zone Proximity to 100 kilometers 27

29 30 year ( ) mean air temperature (C) & total precipitation (mm) (Source: NNDC) 30 year ( ) mean air temperature (C) & total precipitation (mm) (Source: NNDC) Santo Domingo, Dominican Republic Latitude: N Longitude: W Elevation: 14 meters Climate Zone: Tropical Zone Proximity to Water: Located on Water Sydney, Australia Latitude: S Longitude: E Elevation: 1 meters Climate Zone: Temperate Zone Proximity to Water: Located on Water 28

30 30 year ( ) mean air temperature (C) & total precipitation (mm) (Source: NNDC) 30 year ( ) mean air temperature (C) & total precipitation (mm) (Source: NNDC) Tokyo, Japan Latitude: N Longitude: E Elevation: 40 meters Climate Zone: Temperate Zone Proximity to 50 kilometers Warsaw, Poland Latitude: N Longitude: E Elevation: 95 meters Climate Zone: Temperate Zone Proximity to 900 kilometers 29
31 Exploring Climate Influences Answer Sheet
32 Investigation 1: Investigate the influence of latitude on climate The influence of latitude on climate is part of the earth-sun relationship. During the earth s annual revolution around the sun, the sun s direct rays fall upon the planet in a regular pattern. The pattern can be correlated with zones of latitude to describe climate zones. Within each latitude zone, the climate follows general patterns. 1) Make a prediction about how monthly temperature and precipitation change as latitude increases. Students answers will vary, temperature decreases as latitude increases, temperature warms as you near the equator. 2) Complete the table below using Exploring the Influence of Climate world city data handouts Lowest Global Climate Proximity to City Latitude Elevation Coldest Month Temperature Zone Water ( C) Hottest Month Highest Temperature ( C) Temperature Range over 12 months Tokyo, Japan N Temperate 40 Km January 6 C August 27 C 6 to 27 Sydney, Australia Cape Town, South Africa Anchorage, United States Riyadh, Saudi Arabia S Temperate 1 m On water January 26 C April 30 C 26 to S Temperate 7 m On water July 12 C January 21 C 12 to N Polar 31 m On water January -9 C July 15 C -9 to N Tropical 618 Km January 14 C July 36 C 14 to 36 3) After viewing your world map as well as the results from the tables above, write a statement about how the monthly temperature and precipitation change as latitude increases. Student answers should reflect Question 1 above providing evidence from the table above for Tokyo, Sydney, Cape Town, Anchorage or Riyadh. 1
33 Test your statement 4) Complete the tables below using the Exploring the Influence of Climate world city data handouts City Reykjavik, Iceland Latitude Global Climate Zone Elevation Proximity to Water Coldest Month Lowest Temperature ( C) Hottest Month Highest Temperature ( C) Temperature Range over 12 months N Polar 16 m On water January 0 C July 11 C 0 to 11 Cairo, Egypt N Temperate 23 m On water January 14 C July 28 C 14 to 28 Ottawa, Canada Dar es Salaam, Tanzania N Temperate 70 Km January -9 C July 20 C -9 to S Tropical 55 m On water July 23 C January 28 C 23 to 28 Santiago, Chile S Temperate 520 Km July 13 C January 27 C 13 to 27 5) Do the results from the tables above confirm or dispute your statement made in #3 above? Explain. Students answers will vary, temperatures cool from tropical to temperate to polar climate zones. 2
34 Investigation 2: Investigate the influence of elevation on climate Due to the relationship between the elevation of a place and its temperature, changes in elevation can affect the environment as much as changes in latitude. In this investigation you will investigate the relationship between elevation and climate. 1) Make a prediction about how monthly temperature and precipitation change as elevation increases. Student answers will vary, as elevation increases temperature decreases 2) Complete the table below using the Exploring the Influence of Climate world city data handouts. City Santo Domingo, Dominican Republic Miami, USA Panama City, Panama Manila, Philippines Bangkok, Thailand Addis Ababa, Ethiopia Bangalore, India Mexico City, Mexico Quito, Ecuador Latitude N N N N N N N N S 3) After viewing the world map, and the results from the chart above, what do these cities have in common in terms of their location on earth? Each city listed above is in or just outside of the Northern Hemisphere and is located in the tropical climate zone between the equator and 30 degrees. 4) After viewing each cities data, describe what these cities have in common as to their temperature and precipitation patterns? Student answers will vary, each city has consistent monthly temperatures with little variation between a summer and winter. Precipitation patterns reflect seasonal change. 5) Which cities are different from the others? How are they different? Addis Ababa, Mexico City and Quito all have significantly lower monthly temperatures than the other cities listed. 3
35 6) Since all of these cities are located in the tropical climate zone, what other factor could explain the difference in their temperature and precipitation patterns? Student answers will vary, all cities are located in a close proximity to water, elevation could be the factor that explains different temperature patterns. 7) Complete the table below using the Exploring the Influence of Climate world city data handouts. City Santo Domingo, Dominican Republic Miami, USA Panama City, Panama Manila, Philippines Bangkok, Thailand Addis Ababa, Ethiopia Bangalore, India Mexico City, Mexico Quito, Ecuador Elevation 14 meters 2 meters 2 meters 16 meters 2 meters 2,355 meters 920 meters 2,260 meters 2,280 meters 8) Based on your observations of climate in the tropical climate zone and the information in the table above, create a statement about the influences of elevation on temperature. Elevation is the main factor that causes Addis Ababa, Mexico City and Quito to have cooler climates. Elevation can affect climate as much as changes in latitude. 9) How did your predictions form Question 1 above, compare to your observations and the data in the tables above showed? Student answers will vary 4
36 Investigation 3: Investigate the influence of proximity to water on climate Climate varies dramatically depending on the amount of precipitation as well as the proximity to water in an environment. Ocean currents affect climate in the coastal lands along which they flow. Cold ocean currents cool the lands they pass while warm ocean currents bring warmer temperatures. Therefore, the size of a continent affects both the temperature range and the amount of moisture in the interior. The larger the continent, the further away the ocean and the larger the difference between summer and winter. In this investigation you will investigate the relationship between proximity to water and climate. 1) Make a prediction about how monthly temperature and precipitation change as you move further away from a large body of water. Student answers will vary 2) Complete the table below using the Exploring the Influence of Climate world city data handouts. City Latitude Elevation Proximity to Water London, England N 24 Km Amsterdam, Netherlands N 2 meters On water Berlin, Germany N 35 Km Warsaw, Poland N 95 Km Kiev, Ukraine N 179 meters 1,600 Km 3) After viewing your world map as well as the results from the chart above, what do these cities have in common regarding their location on earth and elevation? Each of the cities above are located near 50 degrees north and in the Temperate Climate Zone. Each city is also located near sea level, no significant elevation. 4) After viewing each cities temperature data, complete the table below. City Coldest mean monthly temperature Approximate mean yearly temperature London, England 5 C 11 C Amsterdam, Netherlands 3 C 10 C Berlin, Germany 1 C 8 C Warsaw, Poland -2 C 8 C Kiev, Ukraine -5 C 7 C 5
37 5) After viewing each cities temperature and precipitation data, which cities have the mildest winter temperatures? (winter in the northern hemisphere is considered to be from December through February) London and Amsterdam have the mildest winter temperatures. 6) What happens to the winter temperatures as you move from London to Kiev? London and Amsterdam have the mildest winter temperatures and as you move further from the ocean the winters are more severe. Kiev experiences the most severe winters. 7) Based on observations of climate of several cities with similar latitude, create a statement about the influence of proximity to water, or distance from it, on patterns of temperature. Statements should reflect that as you move further from the ocean the winters are more severe. 8) How did your predictions from Question 1 above, reflect what your observations and the data in the table showed? Student answers will vary Revisit your initial observations 1) After conducting Investigations 1 through 3, revisit your initial answers on the world map of the 3 hottest and coldest cities in July. Make any changes to your answers if needed. 6
38 Investigation 4: Investigate the influence of physical features on your community The surface features of the earth, such as bodies of water and mountains can influence the climate of a location. The climates of two locations at the same latitude can be very different, depending on the presence or absence of certain landforms. For example, large bodies of water are slower to heat and cool than land. As a result, water temperatures are more uniform and constant than land temperatures due to the high specific heat of water. Mountain ranges also influence precipitation and affect climate. Air is cooled when winds blow over a body of water and are pushed upward over a mountain range, resulting in the release of moisture in the form of precipitation. This precipitation falls in the form of rain and snow on the more on the windward side of the mountain, the side of the mountain facing the wind. After the precipitation is released, winds become warmer and drier as they descend on the opposite or leeward side of the mountain. This is called a rain shadow. This rain shadow effect often causes dry areas and even deserts to develop on the leeward sides of mountain ranges. 1) Using a map sketch an aerial view of your community reaching out 250 Km in all directions in the area below. Student should use an atlas to sketch their local community using examples similar to those below for mountains, oceans, lakes, rivers, deserts, forest and cities. 7
39 2) With the help of your teacher, complete the following information for your community. Refer to an encyclopedia, geography text book or online source such as City Latitude Global Climate Zone Elevation Proximity to Water 3) Based upon all of the work that you have done previously, what do you believe to be the most significant influences on climate where you live? Provide an explanation supporting your statement. Student should refer to each Investigation while defending their answer Explore Further: Create a Climograph for your Location Use the following instructions to download 30 year precipitation and temperature data for the area where you live to create a climograph. Using the investigations 1 through 4 compare your local data to the city data provide to explore the influence of each of the following, latitude, elevation, proximity to water and physical features. 1. Create a hypothesis about the primary influence of climate on their area in which you live. 2. If you were to conduct a research investigation about the primary influence of your local climate, what data would you want to collect to confirm your hypothesis 8
Polar Climate Zone. Temperate Climate Zone. Tropical Climate Zone. Temperate Climate Zone. Polar Climate Zone. 1st. 3 hottest cities 3 coldest cities
 Exploring the Influences on Climate Part 1: Predictions and Background 1.) Based on the map below, record what you predict to be the 3 hottest and coldest cities in the month of July. Polar Climate Zone
Investigating Factors that Influence Climate
 Investigating Factors that Influence Climate Description In this lesson* students investigate the climate of a particular latitude and longitude in North America by collecting real data from My NASA Data
Name Date. What s the weather like today? Watch the beginning of the video Basics of geography- climate.
 FACTORS THAT INFLUENCE CLIMATE worksheet 1 STARTER Look at the weather symbols and answer: What s the weather like today? WHAT S CLIMATE? Watch the beginning of the video Basics of geography- climate.
Adopt a Drifter Lesson Plan by Mary Cook, Middle School Science Teacher, Ahlf Jr. High School, Searcy, Arkansas
 Adopt a Drifter Lesson Plan by Mary Cook, Middle School Science Teacher, Ahlf Jr. High School, Searcy, Arkansas Do Ocean Surface Currents Influence Climate? Objectives Students will construct climographs
1 What Is Climate? TAKE A LOOK 2. Explain Why do areas near the equator tend to have high temperatures?
 CHAPTER 17 1 What Is Climate? SECTION Climate BEFORE YOU READ After you read this section, you should be able to answer these questions: What is climate? What factors affect climate? How do climates differ
World Geography Chapter 3
 World Geography Chapter 3 Section 1 A. Introduction a. Weather b. Climate c. Both weather and climate are influenced by i. direct sunlight. ii. iii. iv. the features of the earth s surface. B. The Greenhouse
1 What Is Climate? TAKE A LOOK 2. Explain Why do areas near the equator tend to have high temperatures?
 CHAPTER 17 1 What Is Climate? SECTION Climate BEFORE YOU READ After you read this section, you should be able to answer these questions: What is climate? What factors affect climate? How do climates differ
4.3 Climate (6.3.3) Explore this Phenomena. The same sun shines on the entire Earth. Explain why these two areas have such different climates.
 Explore this Phenomena. The same sun shines on the entire Earth. Explain why these two areas have such different climates.") Explore this Phenomena The same sun shines on the entire Earth. 4.3 Climate (6.3.3) Explain why these two areas have such different climates. 89 6.3.3 Climate Develop and use a model to show how unequal
Explore this Phenomena The same sun shines on the entire Earth. 4.3 Climate (6.3.3) Explain why these two areas have such different climates. 89 6.3.3 Climate Develop and use a model to show how unequal
Factors that Affect Climate
 Factors that Affect Climate What is climate? Climate is the average weather conditions over a long period of time Includes average temperatures and precipitation, wind patterns, humidity, air pressure
World geography 3200/3202 Unit 2 review
 World geography 3200/3202 Unit 2 review 1. Does this statement use the terms revolve & rotate correctly? "Saturn revolves on its axis while several moons rotate around it." 2. Does this statement use the
Climate Regions. Combining Climate Graphs and Köppen s Classification
 Lab 15 Climate Regions Combining knowledge of the global patterns behind the major climatic controls, this lab will teach students how to construct climate graphs and then allow them to explore patterns
L.O Students will learn about factors that influences the environment
 Name L.O Students will learn about factors that influences the environment Date 1. At the present time, glaciers occur mostly in areas of A) high latitude or high altitude B) low latitude or low altitude
What factors affect climate? Dr. Michael J Passow
 What factors affect climate? Dr. Michael J Passow Energy from the Sun (mostly light and heat) radiates to Earth SUN 150 x 10 6 km (92 x 10 6 mi) EARTH Challenge: If the speed of light is 300,000 km/sec,
Studying Topography, Orographic Rainfall, and Ecosystems (STORE)
") Studying Topography, Orographic Rainfall, and Ecosystems (STORE) Introduction Basic Lesson 3: Using Microsoft Excel to Analyze Weather Data: Topography and Temperature This lesson uses NCDC data to compare
Studying Topography, Orographic Rainfall, and Ecosystems (STORE) Introduction Basic Lesson 3: Using Microsoft Excel to Analyze Weather Data: Topography and Temperature This lesson uses NCDC data to compare
March 11, A CCP Weather and Climate.notebook. Weather & Climate BEFORE YOU TEACH LESSON
 BEFORE YOU TEACH LESSON 1 Before You Teach Before You Read Reading Passage After You Read SMART Response Printable Reading Passage 2 Before You Read Reading Passage As a class, brainstorm the meanings
Earth Science Lesson Plan Quarter 2, Week 6, Day 1
 Earth Science Lesson Plan Quarter 2, Week 6, Day 1 1 Outcomes for Today Standard Focus: Earth Sciences 5.f students know the interaction of wind patterns, ocean currents, and mountain ranges results in
Investigation IV: Seasonal Precipitation and Seasonal Surface Runoff in the US
 Investigation IV: Seasonal Precipitation and Seasonal Surface Runoff in the US Purpose Students will consider the seasonality of precipitation and surface runoff and think about how the time of year can
In this activity, students will compare weather data from to determine if there is a warming trend in their community.
 Overview: In this activity, students will compare weather data from 1910-2000 to determine if there is a warming trend in their community. Objectives: The student will: use the Internet to locate scientific
Weather Atmospheric condition in one place during a limited period of time Climate Weather patterns that an area typically experiences over a long
 Weather Atmospheric condition in one place during a limited period of time Climate Weather patterns that an area typically experiences over a long period of time Many factors influence weather & climate
Contents. Section 1: Climate Factors. Section 2: Climate Types. Section 3: Climate Effects
 Contents Section 1: Climate Factors 1. Weather or Climate?.... 2 2. Elements of Climate.... 4 3. Factors Affecting Climate.... 10 4. Comparing Climates.... 15 5. Quiz 1.... 20 Section 2: Climate Types
Name Class Date. 2. What is the average weather condition in an area over a long period of time called? a. winter b. temperature c. climate d.
 Skills Worksheet Directed Reading B Section: What Is Climate? CLIMATE VS. WEATHER 1. What kind of conditions vary from day to day? a. climate b. weather c. latitude d. biome 2. What is the average weather
Climate and Biomes. Adapted by T.Brunetto from: Developed by Steven Taylor Wichmanowski based in part on Pearson Environmental Science by Jay Withgott
 Climate and Biomes Adapted by T.Brunetto from: Developed by Steven Taylor Wichmanowski based in part on Pearson Environmental Science by Jay Withgott Remember that an ecosystem consists of all the biotic
Latitude & Longitude. Worksheets & activities to teach latitude & longitude. Includes notes, activities, review & all answer keys. 11 pages!
 Latitude & Longitude Worksheets & activities to teach latitude & longitude. Includes notes, activities, review & all answer keys. 11 pages! Lines of Latitude & Longitude Name: Lines of latitude and longitude
Factors that Affect Climate
 Factors that Affect Climate What is climate? Climate is the average weather conditions over a long period of time Includes average temperatures and precipitation, wind patterns, humidity, air pressure
Energy Systems, Structures and Processes Essential Standard: Analyze patterns of global climate change over time Learning Objective: Differentiate
 Energy Systems, Structures and Processes Essential Standard: Analyze patterns of global climate change over time Learning Objective: Differentiate between weather and climate Global Climate Focus Question
Ocean Boundary Currents Guiding Question: How do western boundary currents influence climate and ocean productivity?
 Name: Date: TEACHER VERSION: Suggested Student Responses Included Ocean Boundary Currents Guiding Question: How do western boundary currents influence climate and ocean productivity? Introduction The circulation
Weather Atmospheric condition in one place during a limited period of time Climate Weather patterns that an area typically experiences over a long
 Weather Atmospheric condition in one place during a limited period of time Climate Weather patterns that an area typically experiences over a long period of time Many factors influence weather & climate
INTERNATIONAL INDIAN SCHOOL, RIYADH HALF YEARLY
 INTERNATIONAL INDIAN SCHOOL, RIYADH HALF YEARLY 2018-19 STD V Fill in the blanks: WORKSHEET LESSON - 1 KNOW YOUR PLANET SOCIAL STUDIES 1 A book containing maps is called an _ 2 A Flemish map maker, collection
Meteorology. Circle the letter that corresponds to the correct answer
 Chapter 3 Worksheet 1 Meteorology Name: Circle the letter that corresponds to the correct answer 1) If the maximum temperature for a particular day is 26 C and the minimum temperature is 14 C, the daily
Prentice Hall EARTH SCIENCE
 Prentice Hall EARTH SCIENCE Tarbuck Lutgens Chapter 21 Climate 21.1 Factors That Affect Climate Factors That Affect Climate Latitude As latitude increases, the intensity of solar energy decreases. The
GEOGRAPHY EYA NOTES. Weather. atmosphere. Weather and climate
 GEOGRAPHY EYA NOTES Weather and climate Weather The condition of the atmosphere at a specific place over a relatively short period of time Climate The atmospheric conditions of a specific place over a
Prentice Hall EARTH SCIENCE
 Prentice Hall EARTH SCIENCE Tarbuck Lutgens Chapter 21 Climate 21.1 Factors That Affect Climate Factors That Affect Climate Latitude As latitude increases, the intensity of solar energy decreases. The
CORE CONCEPTS WEATHER AND CLIMATE
 CORE CONCEPTS WEATHER AND CLIMATE Key Prior Knowledge (from the 5 th Grade Matter and Energy Units) Thermal energy can be transported through radiation, conduction, and convection. The transfer of enough
Hurricanes. Where's the Really Bad Weather 1. What: Rotating wind/rain storm Winds from 75 to 200 mph As big as 600 miles wide
 Where's the Really Bad Weather 1 Hurricanes What: Rotating wind/rain storm Winds from 75 to 200 mph As big as 600 miles wide Where: Start over oceans, fizzle out over land Investigation 1 What is Weather?
LAB J - WORLD CLIMATE ZONES
 Introduction LAB J - WORLD CLIMATE ZONES The objective of this lab is to familiarize the student with the various climates around the world and the climate controls that influence these climates. Students
7 th Grade Science. Class Objectives: Students will be able to.. Do Now
 7 th Grade Science Unit: Global Warming Mini Unit Lesson: GW 3_ Climate Factors Name: Date: Monday, October 17, 2016 Homeroom: Class Objectives: Students will be able to.. SWBAT distinguish which factor
Which graph best shows the relationship between intensity of insolation and position on the Earth's surface? A) B) C) D)
 B) C) D)") 1. The hottest climates on Earth are located near the Equator because this region A) is usually closest to the Sun B) reflects the greatest amount of insolation C) receives the most hours of daylight D)
1. The hottest climates on Earth are located near the Equator because this region A) is usually closest to the Sun B) reflects the greatest amount of insolation C) receives the most hours of daylight D)
1 What Is Climate? TAKE A LOOK 2. Explain Why do areas near the equator tend to have high temperatures?
 CHAPTER 3 1 What Is Climate? SECTION Climate BEFORE YOU READ After you read this section, you should be able to answer these questions: What is climate? What factors affect climate? How do climates differ
2. Would you expect convection in a lake? Why or why not?
 NAME: PERIOD: DATE: ENTRY NUMBER: REVIEW FOR WEATHER AND CLIMATE TEST 1. Describe 3 types of heat transfer. Give an example of each. 2. Would you expect convection in a lake? Why or why not? 3. What part
Worksheet: The Climate in Numbers and Graphs
 Worksheet: The Climate in Numbers and Graphs Purpose of this activity You will determine the climatic conditions of a city using a graphical tool called a climate chart. It represents the long-term climatic
School Name Team # International Academy East Meteorology Test Graphs, Pictures, and Diagrams Diagram #1
 School Name Team # International Academy East Meteorology Test Graphs, Pictures, and Diagrams Diagram #1 Use the map above, and the locations marked A-F, to answer the following questions. 1. The center
SHAPING OUR FUTURE: THE CLIMATE CHALLENGE KS3 LESSON 1 TEACHER GUIDE HOW IS OUR CLIMATE CHANGING?
 SHAPING OUR FUTURE: THE CLIMATE CHALLENGE KS3 LESSON 1 TEACHER GUIDE HOW IS OUR CLIMATE CHANGING? KS3 LESSON 1 TEACHER GUIDE HOW IS OUR CLIMATE CHANGING? Learning objective: To understand, through the
4 Changes in Climate. TAKE A LOOK 2. Explain Why is more land exposed during glacial periods than at other times?
 Name Class CHAPTER 3 Date Climate 4 Changes in Climate SECTION National Science Education Standards BEFORE YOU READ After you read this section, you should be able to answer these questions: ES 1k, 2a
Third Grade Math and Science DBQ Weather and Climate/Representing and Interpreting Charts and Data - Teacher s Guide
 Third Grade Math and Science DBQ Weather and Climate/Representing and Interpreting Charts and Data - Teacher s Guide A document based question (DBQ) is an authentic assessment where students interact with
2. Identify each of the following statements as a reference to weather or climate.
 World Geography 3200/3202 Unit 2 Questions Name: Read Pages 54-55 1. Explain the difference between Weather and Climate. 2. Identify each of the following statements as a reference to weather or climate.
Factors That Affect Climate
 Factors That Affect Climate Factors That Affect Climate Latitude As latitude (horizontal lines) increases, the intensity of solar energy decreases. The tropical zone is between the tropic of Cancer and
Chapter 3 Packet. and causes seasons Earth tilted at 23.5 / 365 1/4 days = one year or revolution
 Name Chapter 3 Packet Sequence Section 1 Seasons and Weather : and causes seasons Earth tilted at 23.5 / 365 1/4 days = one year or revolution solstice - begins summer in N. hemisphere, longest day winter
Lab Activity: Climate Variables
 Name: Date: Period: Water and Climate The Physical Setting: Earth Science Lab Activity: Climate Variables INTRODUCTION:! The state of the atmosphere continually changes over time in response to the uneven
Lesson Overview. Climate. Lesson Overview. 4.1 Climate
 Lesson Overview 4.1 THINK ABOUT IT When you think about climate, you might think of dramatic headlines: Hurricane Katrina floods New Orleans! or Drought parches the Southeast! But big storms and seasonal
Hudson River Estuary Climate Change Lesson Project. Grades 5-8 Teacher s Packet. Lesson 3. Climate Change in My City
 Grades 5-8 Teacher s Packet Lesson 3 Climate Change in My City Teacher s Packet 2 Climate Change in My City NYS Intermediate Level Science Standard 1: Analysis, Inquiry and Design/Scientific Inquiry S1.3
Latitude & Longitude Study Guide
 Latitude & Longitude Study Guide Name: Date: Section: Label the important Latitude lines on the diagram below. Include the degree measurements The equator is located at zero degrees latitude. The equator
Seasons and Angle of Insolation
 Computer Seasons and Angle of Insolation 29 (Adapted from Exp 29 Seasons and Angle of Insolation from the Earth Science with Vernier lab manual.) Have you ever wondered why temperatures are cooler in the
Seasons, Global Wind and Climate Study Guide
 Seasons, Global Wind and Climate Study Guide Seasons 1. Know what is responsible for the change in seasons on Earth. 2. Be able to determine seasons in the northern and southern hemispheres given the position
Location Latitude Longitude Durham, NH
 Name: Date: Weather to Climate Investigation: Snow **These are example answers using the Durham, NH dataset. Answers from students using Boise and Little Rock datasets will differ. Guiding Questions: What
Weather Systems Study Guide:
 Weather Systems Study Guide: 1. Draw a diagram of Earth s water cycle and label each part. 2. Explain how the water cycle works. 3. What happens in the troposphere and stratosphere? Atmosphere Level What
DOWNLOAD PDF READING CLIMATE MAPS
 Chapter 1 : Template:Climate chart/how to read a climate chart - Wikipedia Maps don't just tell you which way to go they can tell you practically everything about an area of land, even the weather. Learn
Name: Climate Date: EI Niño Conditions
 Name: Date: Base your answers to questions 1 and 2 on the maps and the passage below. The maps show differences in trade wind strength, ocean current direction, and water temperature associated with air-pressure
Climate.tgt, Version: 1 1
 Name: Key Concepts Choose the letter of the best answer. (5 points each) 1. 2. 3. 4. 5. 6. 7. 8. 9. 10. Date: A city located in the middle of North America experiences extreme temperature changes during
RR#5 - Free Response
 Base your answers to questions 1 through 3 on the data table below and on your knowledge of Earth Science. The table shows the area, in million square kilometers, of the Arctic Ocean covered by ice from
Seasons and Ecliptic Simulator
 Overview: In this lesson, students access an online simulator to aid in understanding the relationship between seasons and Earth s tilt and the day/night cycle caused by Earth s rotation. Objectives: The
C1: From Weather to Climate Looking at Air Temperature Data
 C1: From Weather to Climate Looking at Air Temperature Data Purpose Students will work with short- and longterm air temperature data in order to better understand the differences between weather and climate.
Recommended Grade Level: 8 Earth/Environmental Science Weather vs. Climate
 Lab Activity Title: Climate Factors Past and Present Recommended Grade Level: 8 Discipline: Earth/Environmental Science Topic: Weather vs. Climate Time Requirements: 90 minutes Submitted by: Karen McCabe
Name Per Date Earth Science Climate & Insolation Test
 Name Per Date Earth Science Climate & Insolation Test 1) Which graph best represents the general relationship between latitude and average surface temperature? 2) The diagram below shows the apparent path
Weather to Climate Investigation: Maximum Temperature
 Name: Date: Guiding Questions: Weather to Climate Investigation: Maximum Temperature What are the historical and current weather patterns or events for a location in the United States? What are the long-term
Investigating Weather and Climate with Google Earth Teacher Guide
 Google Earth Weather and Climate Teacher Guide In this activity, students will use Google Earth to explore global temperature changes. They will: 1. Use Google Earth to determine how the temperature of
Climate. What is climate? STUDY GUIDE FOR CONTENT MASTERY. Name Class Date
 Climate SECTION 14.1 What is climate? In your textbook, read about climate and different types of climate data. Put a check ( ) next to the types of data that describe climate. 1. annual wind speed 4.
Name Period Date. Analyzing Climographs
 Name Period Date Analyzing Climographs Climographs: It is often helpful to plot two different types of data on the same graph. For example, a climograph is a single graph that charts both the average temperature
Climate Zones FACT-FILE. What s the difference between weather and climate? Is latitude important?
 FACT-FILE What s the difference between weather and climate? Climate is average weather. Meteorologists (scientists who study weather) work out what the average is by using information about temperature
Bell Work. REVIEW: Our Planet Earth Page 29 Document A & B Questions
 9.12.16 Bell Work REVIEW: Our Planet Earth Page 29 Document A & B Questions Intro to Climate & Weather https://www.youtube.com/watch?v=vhgyoa70q7y Weather vs. Climate Video Climate & Weather 3.1 Weather
UNST 232 Mentor Section Assignment 5 Historical Climate Data
 UNST 232 Mentor Section Assignment 5 Historical Climate Data 1 introduction Informally, we can define climate as the typical weather experienced in a particular region. More rigorously, it is the statistical
Global Climate Change
 Global Climate Change Overview: Students will learn about global climate change, what causes global warming, and scientific projections about climate change in the near future. Levels V-VI Grades 9-12
Investigating Weather with Google Earth Student Guide
 Investigating Weather with Google Earth Student Guide In this activity, you will use Google Earth to explore some factors that affect weather. You will: 1. Determine how different factors affect a location
CLIMATE. SECTION 14.1 Defining Climate
 Date Period Name CLIMATE SECTION.1 Defining Climate In your textbook, read about climate and different types of climate data. Put a check ( ) next to the types of data that describe climate. 1. annual
LAB 19. Lab 19. Differences in Regional Climate: Why Do Two Cities Located at the Same Latitude and Near a Body of Water Have Such Different Climates?
 Lab Handout Lab 19. Differences in Regional Climate: Why Do Two Cities Located at the Same Latitude and Near a Body of Water Have Such Different Climates? Introduction Weather describes the current atmospheric
LAB MODULE 5: GLOBAL TEMPERATURE PATTERNS
 LAB MODULE 5: GLOBAL TEMPERATURE PATTERNS Note: Please refer to the GETTING STARTED lab module to learn how to maneuver through and answer the lab questions using the Google Earth ( KEY TERMS You should
Energy and Seasons A B1. 9. Which graph best represents the general relationship between latitude and average surface temperature?
 Energy and Seasons A B1 1. Which type of surface absorbs the greatest amount of electromagnetic energy from the Sun? (1) smooth, shiny, and light colored (2) smooth, shiny, and dark colored (3) rough,
Name Period Part I: INVESTIGATING OCEAN CURRENTS: PLOTTING BUOY DATA
 Name Period Part I: INVESTIGATING OCEAN CURRENTS: PLOTTING BUOY DATA INTRODUCTION: Ocean currents are like huge rivers in the sea. They carry drifting organisms, vital dissolved chemical nutrients and
Natural Causes of Climate. 3B Day 2
 Natural Causes of Climate 3B Day 2 Critical Content 3B: Investigate how daily weather over time determines climate patterns in a given region 2C: Recall the difference between weather and climate Describe
Activity 2.2: Recognizing Change (Observation vs. Inference)
") Activity 2.2: Recognizing Change (Observation vs. Inference) Teacher Notes: Evidence for Climate Change PowerPoint Slide 1 Slide 2 Introduction Image 1 (Namib Desert, Namibia) The sun is on the horizon
Activity 2.2: Recognizing Change (Observation vs. Inference) Teacher Notes: Evidence for Climate Change PowerPoint Slide 1 Slide 2 Introduction Image 1 (Namib Desert, Namibia) The sun is on the horizon
Temperature Changes OBJECTIVES PREPARATION SCHEDULE MATERIALS. The students. For each student. For each team of two. For the class
 activity 3 Temperature Changes OBJECTIVES Students observe changes in air temperature and discover the role of the Sun in heating Earth. The students measure and record outdoor air temperature at three
Chapter 1 Section 2. Land, Water, and Climate
 Chapter 1 Section 2 Land, Water, and Climate Vocabulary 1. Landforms- natural features of the Earth s land surface 2. Elevation- height above sea level 3. Relief- changes in height 4. Core- most inner
Weather and Climate A B1
 Weather and Climate A B1 1. What causes the Coriolis effect? (1) Earth s tilt on its axis (2) the spin of Earth on its axis (3) the orbital motion of the Moon around Earth (4) the orbital motion of Earth
Arctic Climate Connections Activity 3 Exploring Arctic Climate Data
 Arctic Climate Connections Activity 3 Exploring Arctic Climate Data Part A. Understanding Albedo Albedo is the ratio of incoming solar radiation that is reflected back into space. Albedo is expressed as
SEASONAL AND DAILY TEMPERATURES
 1 2 3 4 5 6 7 8 9 10 11 12 SEASONAL AND DAILY TEMPERATURES Chapter 3 Earth revolves in elliptical path around sun every 365 days. Earth rotates counterclockwise or eastward every 24 hours. Earth closest
Climates are described by the same conditions used to describe
 58 The Causes of Climate R EA D I N G Climates are described by the same conditions used to describe weather, such as temperature, precipitation, and wind. You now know that oceans have an important effect
1 Our Dynamic Climate Guiding Question: What factors determine Earth s climate?
 LESSON 1 Our Dynamic Climate Guiding Question: What factors determine Earth s climate? Describe factors that affect how the sun warms Earth. Discuss the role of wind patterns in determining climate. Explain
TILT, DAYLIGHT AND SEASONS WORKSHEET
 TILT, DAYLIGHT AND SEASONS WORKSHEET Activity Description: Students will use a data table to make a graph for the length of day and average high temperature in Utah. They will then answer questions based
3. The map below shows an eastern portion of North America. Points A and B represent locations on the eastern shoreline.
 1. Most tornadoes in the Northern Hemisphere are best described as violently rotating columns of air surrounded by A) clockwise surface winds moving toward the columns B) clockwise surface winds moving
Lesson 3 Latitude is Everything
 Latitude is Everything Essential Question: How does latitude affect the Amount of Solar Energy an Area Receives and that Area s Climate? Objective: Students will be able to explain how the sun s energy
Page 1. Name:
 Name: 1) What is the primary reason New York State is warmer in July than in February? A) The altitude of the noon Sun is greater in February. B) The insolation in New York is greater in July. C) The Earth
Lecture Outlines PowerPoint. Chapter 20 Earth Science 11e Tarbuck/Lutgens
 Lecture Outlines PowerPoint Chapter 20 Earth Science 11e Tarbuck/Lutgens 2006 Pearson Prentice Hall This work is protected by United States copyright laws and is provided solely for the use of instructors
Geography Class 6 Chapters 3 and
 CHAPTER 3 MOTIONS OF THE EARTH The Earth is always travelling in Space. That makes each person on Earth, a Space Traveller. No one feels the movement of the Earth because humans are too tiny when compared
The Atmosphere. Importance of our. 4 Layers of the Atmosphere. Introduction to atmosphere, weather, and climate. What makes up the atmosphere?
 The Atmosphere Introduction to atmosphere, weather, and climate Where is the atmosphere? Everywhere! Completely surrounds Earth February 20, 2010 What makes up the atmosphere? Argon Inert gas 1% Variable
Module 7, Lesson 1 Water world
 Module 7, Lesson 1 Water world Imagine that the year is 2100. Scientists have determined that the rapidly warming climate of the earth will cause the ice sheets of Antarctica to break apart and melt at
Map Skills Lesson 1. Materials: maps, pencils, Lesson 1 Worksheet, strips of paper, grid paper
 Map Skills Lesson 1 Use cardinal directions, map grids, scales, and titles to locate places on a map. Interpret a map using information from its title, compass rose, scale, and legend. Vocabulary: map,
Why the Earth has seasons. Why the Earth has seasons 1/20/11
 Chapter 3 Earth revolves in elliptical path around sun every 365 days. Earth rotates counterclockwise or eastward every 24 hours. Earth closest to Sun (147 million km) in January, farthest from Sun (152
SES 123 Global and Regional Energy Lab Worksheet
 SES 123 Global and Regional Energy Lab Worksheet In this laboratory exercise, you used the NOAA Reanalysis site to explore global land temperatures, including spatial and temporal variations. Understanding
L.O: THE ANGLE OF INSOLATION ANGLE INSOLATION: THE ANGLE SUNLIGHT HITS THE EARTH
 L.O: THE ANGLE OF INSOLATION ANGLE INSOLATION: THE ANGLE SUNLIGHT HITS THE EARTH 1. The graph below shows air temperatures on a clear summer day from 7 a.m. to 12 noon at two locations, one in Florida
16 Global Climate. Learning Goals. Summary. After studying this chapter, students should be able to:
 16 Global Climate Learning Goals After studying this chapter, students should be able to: 1. associate the world s six major vegetation biomes to climate (pp. 406 408); 2. describe methods for classifying
Appendix B Lesson 1: What Is Weather Exit Ticket
 Appendix B Lesson 1: What Is Weather Exit Ticket Name Date Period What is Weather? Exit Ticket List 3 things that you learned during the demonstrations today. What are two questions that you still have?