UNITED STATES AND SOUTH AMERICA SNAPSHOT REPORT Thursday, December 21, 2017
|
|
|
- Stephen Berry
- 6 years ago
- Views:
Transcription
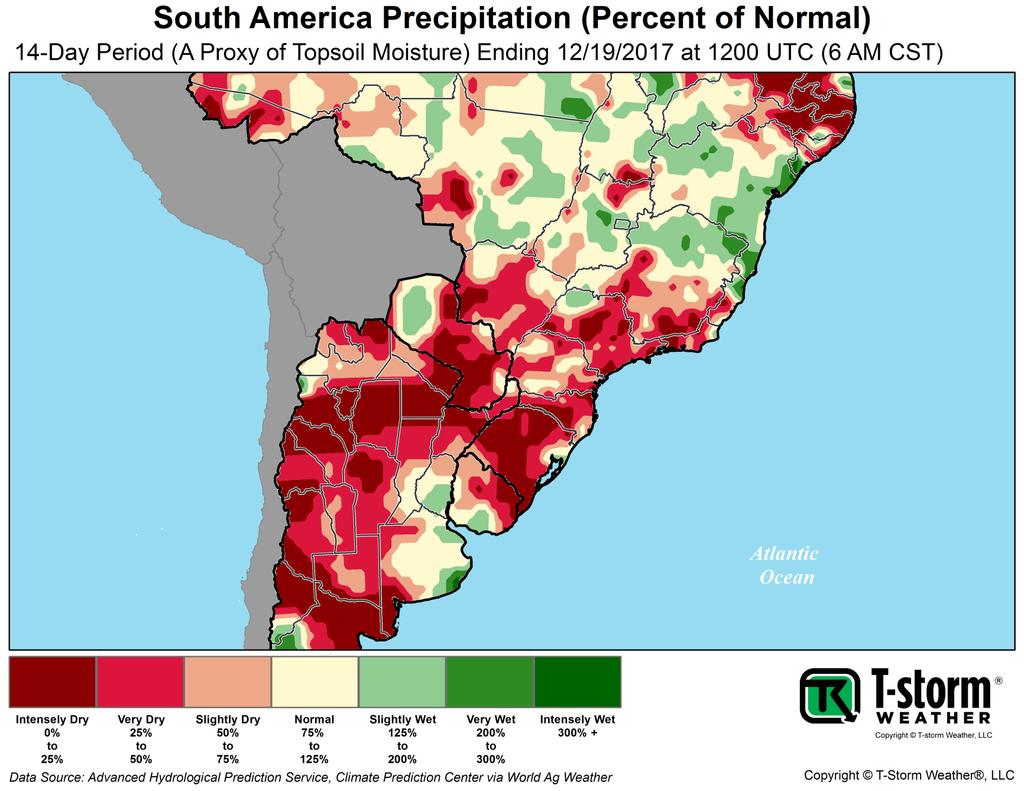
1 T-storm Weather Summary A small but key corn and soybean area in western Argentina was wetter than expected overnight. T-storms affect varying areas of South America at varying times into January, but above-normal rainfall is only likely in southern Brazil (and Paraguay); near- or below-normal rainfall probable elsewhere. Southern Brazil needs this rain because it accounts for the primary reason that 66% and 51% of Brazil's first-crop corn and soybean production were drier than normal over the last two weeks (as of Tuesday). Otherwise, U.S. cattle and HRW wheat turn sharply colder, and the low potential for a winter storm persists in the central U.S. next week. T-storm Weather Highlights A small but heavy overnight t-storm cluster affected key corn and soybean area in Cordoba and Santa Fe. No change: scattered t-storms dot Argentina through Fri.-Sat., followed by five to seven days of dry weather. No change: scattered t-storms return to Argentina late next week or weekend (within Dec Jan. 3). No change: frequent t-storms produce above-normal rainfall in driest areas of southern Brazil and Paraguay. NO change: northern areas of Brazil will be drier than normal over the next week, then turn wetter. No change: some burnback or winterkill remain plausible in South Dakota Monday morning. Model Notes None. Page Description South America Discussion United States Discussion Today's Normal Crop Phase Table Supporting Pages 1

, triggering scattered t-storms with 0.50 to 1.50 most probable. ~2.")
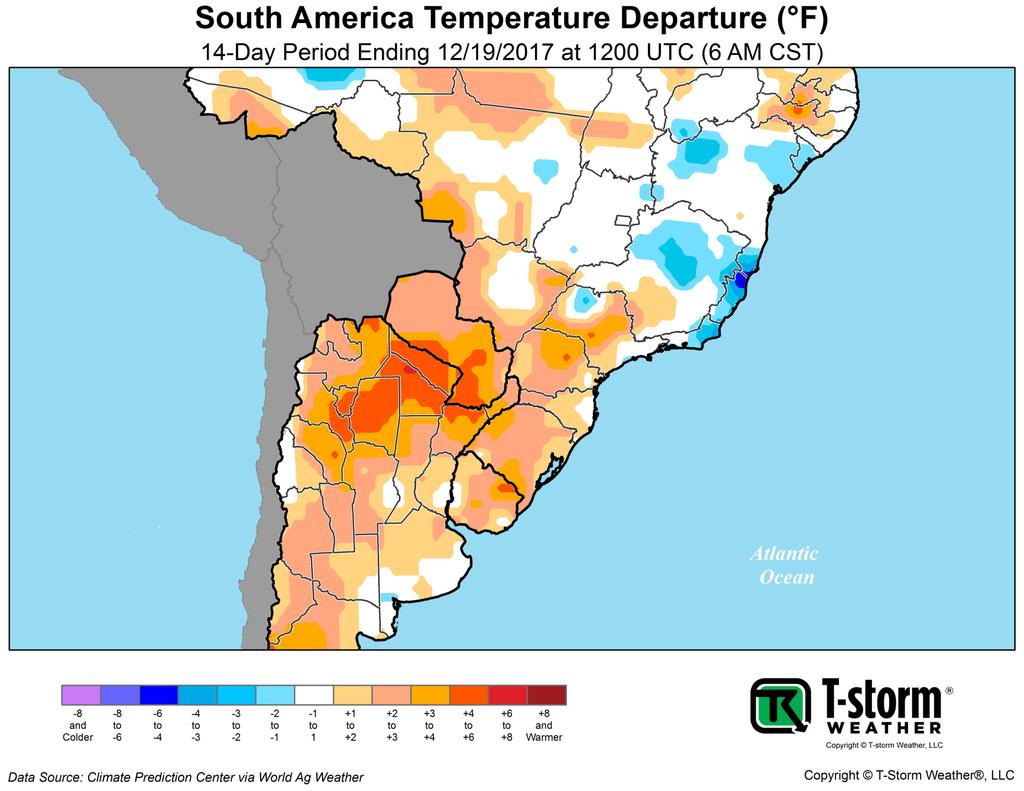
2 SOUTH AMERICA DISCUSSION Weather Outlook In Argentina, scattered t-storms continue through Fri.-Sat. as a cool front approaches and dissipates. Except for a small but important pocket of heavy rain from ongoing t-storms in parts of Cordoba and Santa Fe, only scattered 0.50 to 1.00 amounts are likely due to limited humidity. Five to seven days of dry and seasonable weather follow as surface-level high pressure passes. Thereafter, another system is likely to pass next weekend and / or the early the following week (within Dec Jan. 3), triggering scattered t-storms with 0.50 to 1.50 most probable. ~2.00 is normal of the next two weeks, indicating additional rainfall may be needed in early January especially in Buenos Aires. Southern Brazil and Paraguay will be the primary beneficiary of the weather pattern as numerous cool fronts sweep northward and dissipate over the next 10 to 14 days, triggering t-storms and resulting in generalized rainfall of 3.00 to 5.00 ; best chances are each day through Sat.-Sun., then at varying times from next week forward. Normal rainfall is ~2.25 for the period, indicating topsoil and subsoil dryness will improve through early January. Northern areas of Brazil will be considerably drier than normal over the next week as upper-level high pressure only allows widely-scattered t-storms to form, most notably leaving Bahia and / or Minas Gerais fairly dry for this time of year. That said, a stormy period follows from late next week forward as the upper-level high relaxes and allows cool fronts to sweep into the region and trigger t-storms, ultimately producing 2.00 to 4.00 of rain over Dec Jan. 4, but likely leaving some crops drier than normal for the upcoming two-week period because ~4.50 is normal through then. Recent Weather A heavy t-storm cluster developed in southwest Arg. overnight, bringing more rain than was expected to La Pampa and southwest Cordoba (~1.00 to ~2.00 ), which includes a concentrated grain and oilseed area. Some t-storms also dotted southern Brazil where temperatures were unseasonably cool. Crop and Soil Moisture Discussion T-storms having been improving topsoil moisture in Argentina in recent days, but more were needed as of Tue. morning (and some occurred) because ~60% of first-crop corn and soybean production had been drier than normal over the last 14 days, and ~85% over the last 30 days. Brazil was not as nearly as dry, but limited rainfall in recent weeks in central and southern areas was increasing dryness with 53% and 46% of each crop having been drier than normal over the period. Argentina Brazil Proportion of National Production By Region Argentina Corn (1 st ) Corn (2 nd ) Soy. Sunflower Wheat Central 54% 56% 13% 36% North 13% 8% 13% 4% South 31% 36% 74% 59% Brazil Region Center-West 13% 66% 49% 2% Northeast 11% 4% 8% 0% South 43% 23% 33% 95% Southeast 30% 5% 6% 4% Data sources: Argentina Ministry of Ag., Livestock and Fish. (2010/ /15), Brazilian Institute of Geography and Statistics ( ) Click here to review detailed crop production maps for Argentina and Brazil. 2

3 UNITED STATES DISCUSSION Central U.S. Weather Outlook Unseasonable mildness breaks from northwest to southeast through Sat. as the first in a series of Arctic cold fronts blast southward. Temperatures turn progressively colder through early next week, leading to the potential for some burnback or winterkill in snow-free areas of the northern Plains as minimums fall into the -0s and -10s, most notably in South Dakota where ~6% of U.S. HRW wheat is produced. The temperature forecast turns complex from the middle of next week forward as Arctic air lingers and a large system interact to the west. The exact setup is unclear, but regardless of exactly how the system unfolds, a change to seasonable and mild weather is least likely; a continuation of below-normal temperatures is most likely across a wide area through the end of the year with maximums mostly in the 10s, 20s, and 30s, and minimums in the -0s, +0s, and +10s. Some pockets of light snow fall as the colder pattern assembles over the next several days, but a winter storm does not affect cattle and HRW wheat with best chances within the northern half of the Plains and northwest two-thirds of the Corn Belt. The atmospheric setup becomes conducive to a large winter storm in the central or eastern U.S. from the middle of next week forward as a large system develops to the west, but dependent on the southern extent of Arctic air. The exact setup will not be resolved for several days, but the highest overall chance for a notable storm is in the Corn Belt, Delta, and / or points east; lowest chances are in cattle and HRW wheat areas of the Plains where precipitation is most likely to remain limited. Recent Weather Mild weather continued in cattle and HRW wheat areas of the central and southern Plains yesterday, while a swath of heavy snow affected North Dakota and Montana. Crop and Soil Moisture Overview The central and southern Plains were unusually dry over the last 60 days with little or no precipitation having fallen, leaving 83% of HRW wheat drier than normal. Central and Eastern United States Proportion of National Production By Region Region Corn Soy. HRW Wheat SRW Wheat Spring Wheat Corn Belt 63% 61% 2% 47% 13% Delta 5% 11% 0% 25% 0% Plains Central 17% 12% 56% 0% 0% North 8% 10% 18% 0% 73% South 2% 0% 22% 0% 0% East / Southeast 5% 5% 0% 28% 0% Other 0% 0% 0% 13% Data source: USDA ( ) Click here to review our county-level corn, soybean, and wheat production maps over
4 TODAY'S NORMAL CROP PHASE Argentina Brazil United States Crop Normal Crop Normal Crop Normal Crop Crop Crop Phase Phase Phase Corn, Early-Planted Corn, Late-Planted Silking Planting Corn, First Crop Corn, Second Crop Silking / Filling Out of Season Corn Out of Season Soybeans, First Crop Soybeans, Second Crop Vegetative Out of Season Soybeans, Northern Areas Soybeans, Southern Areas Flowering Flowering Soybeans Out of Season Sunflowers Veg. / Rep. / Maturing Spring Wheat Out of Season Winter Wheat Harvesting Winter Wheat Out of Season Source: Various USDA website sources Hard Red Winter Wheat Soft Red Winter Wheat Dormant Dormant 4
5 The South America section begins on the next page 5
6 CORN (CROP #1) PERIOD (SOIL PROXY) LAST 7 DAYS (HIGH TOPSOIL) LAST 14 DAYS (TOPSOIL) LAST 30 DAYS (SUBSOIL) LAST 60 DAYS (DEEP SUBSOIL) LAST 90 DAYS (AG. DROUGHT) PRECIPITATION (PERCENT OF NORMAL), WEIGHTED BY ARGENTINA CROP PRODUCTION 2014/ /17 COUNTY-LEVEL PRODUCTION WEIGHTED BY A PRECIPITATION GRID, 33% VALID TWO DAYS AGO (12/19/17) AT 6 AM CST (1200 UTC) 60% 68% 15% 86% 52% 35% 30% 13% 5% 1% 1% CORN (CROP #2) LAST 7 DAYS (HIGH TOPSOIL) LAST 14 DAYS (TOPSOIL) LAST 30 DAYS (SUBSOIL) LAST 60 DAYS (DEEP SUBSOIL) LAST 90 DAYS (AG. DROUGHT) 78% 7% 16% 88% 11% 1% 89% 11% 0% 64% 36% 0% SOYBEANS LAST 7 DAYS (HIGH TOPSOIL) LAST 14 DAYS (TOPSOIL) LAST 30 DAYS (SUBSOIL) LAST 60 DAYS (DEEP SUBSOIL) LAST 90 DAYS (AG. DROUGHT) 44% 13% 43% 64% 33% 4% 83% 16% 1% 68% 31% 1% SUNFLOWER WINTER WHEAT LAST 7 DAYS (HIGH TOPSOIL) LAST 14 DAYS (TOPSOIL) LAST 30 DAYS (SUBSOIL) LAST 60 DAYS (DEEP SUBSOIL) LAST 90 DAYS (AG. DROUGHT) LAST 7 DAYS (HIGH TOPSOIL) LAST 14 DAYS (TOPSOIL) LAST 30 DAYS (SUBSOIL) LAST 60 DAYS (DEEP SUBSOIL) LAST 90 DAYS (AG. DROUGHT) 36% 56% 41% DROUG % SUBSOI DRY (less than 75% of average) WET (more than 125% of average) 21% 39% % 6% % % 4% NORMAL (75% to 125% of average) Data is developed with a proprietary geographic information system analysis of Argentina M inistry of Agriculture department-level crop production data weighted by precipitation grids from the Climate Prediction Center and World Ag Weather. Production data is averaged for each county over the last three years to develop weights and includes at least 99% of production each year. Corn Crop #1 is defined as total corn planted prior to December (production data was weighted by approximate planted area via Weekly Grain Reports from the Buenos Aires Grain Exchange over the last three years); Corn Crop #2 is total corn planted in December or later. "Dry", "Normal", and "Wet" are crops that received less than 75%, 75% - 125%, and more than 125% of its average precipitation. 63% 90% 56% 14% 54% 27% 40% 30% 1% 10% 9% 10% 4% 6
7 CORN (CROP #1) PERIOD LAST 7 DAYS LAST 14 DAYS LAST 30 DAYS LAST 60 DAYS LAST 90 DAYS PRECIPITATION (PERCENT OF NORMAL), WEIGHTED BY BRAZIL CROP PRODUCTION 2013/ /16 COUNTY-LEVEL PRODUCTION WEIGHTED BY A PRECIPITATION GRID, 22% VALID TWO DAYS AGO (12/19/17) AT 6 AM CST (1200 UTC) 53% 66% 77% 60% 40% 25% 11% 17% 12% 10% 7% CORN (CROP #2) LAST 7 DAYS LAST 14 DAYS LAST 30 DAYS LAST 60 DAYS LAST 90 DAYS 66% 20% 14% 50% 36% 14% 40% 54% 6% 15% 56% 29% SOYBEANS SUGAR LAST 7 DAYS LAST 14 DAYS LAST 30 DAYS LAST 60 DAYS LAST 90 DAYS LAST 7 DAYS LAST 14 DAYS LAST 30 DAYS LAST 60 DAYS LAST 90 DAYS 65% 21% 13% 51% 35% 14% 46% 48% 6% 21% 57% 22% 88% 5% 8% DROUG % % 11% SUBSOI 45% 31% % 17% 60% 23% DRY (less than 75% of average) WET (more than 125% of average) NORMAL (75% to 125% of average) Data is developed with a proprietary Geographic Information System analysis of Brazil Institute of Geography and Statistics municipality-level crop production data weighted by precipitation grids from the Climate Prediction Center and World Ag Weather. Production data is averaged for each county over the last three years to develop weights and include at least 99%, 98%, and 97% of corn, soybean, and sugar production. "Dry", "Normal", and "Wet" are crops that received less than 75%, 75% - 125%, and more than 125% of its average precipitation. 7
8 8
9 9


10 Yesterday s Minimum Temperature Yesterday s Maximum Temperature 10
11 The United States section begins on the next page 11

12 UNITED STATES AND SOUTH AMERICA Chart not available today 12

13 Yesterday s Minimum Temperature Yesterday s Maximum Temperature 13
14 WINTER WHEAT (HARD RED) WINTER WHEAT (SOFT RED) PERIOD (SOIL PROXY) LAST 7 DAYS (HIGH TOPSOIL) LAST 14 DAYS (TOPSOIL) LAST 30 DAYS (SUBSOIL) LAST 60 DAYS (DEEP SUBSOIL) LAST 90 DAYS (AG. DROUGHT) LAST 180 DAYS (DROUGHT) LAST 7 DAYS (HIGH TOPSOIL) LAST 14 DAYS (TOPSOIL) LAST 30 DAYS (SUBSOIL) LAST 60 DAYS (DEEP SUBSOIL) LAST 90 DAYS (AG. DROUGHT) LAST 180 DAYS (DROUGHT) PRECIPITATION (PERCENT OF NORMAL), WEIGHTED BY U.S. PRODUCTION COUNTY-LEVEL PRODUCTION WEIGHTED BY 4-KM 2 PRECIPITATION GRIDS, AS OF YESTERDAY AT 7 AM CDT (1200 UTC) 15% 22% 66% 17% 17% DROUG % % 1% SUBSOI 50% 39% % DRY (less than 75% of average) WET (more than 125% of average) NORMAL (75% to 125% of average) Data is developed with a proprietary geographic information system analysis of USDA county-level crop production data weighted by 4-km by 4-km precipitation grids. Production data is averaged for each county over the last five years to develop weights and included at least 99% of production each year. HRW wheat is defined as winter wheat in and adjacent the Plains; SRW wheat is defined as winter wheat along and east of the Mississippi River. "Dry", "Normal", and "Wet" are crops that received less than 75%, 75% - 125%, and more than 125% of its average precipitation. 71% 80% 82% 83% 44% 63% 15% 57% 77% TEMPERATURE DEPARTURE ( F), WEIGHTED BY U.S. CROP PRODUCTION FIVE-YEAR AVERAGE COUNTY- AND DISTRICT-LEVEL PRODUCTION WEIGHTED BY THE CONTOURED MEAN OF THE 1) 6-HOUR MINIMUM ENDING AT 7 AM CENTRAL TIME, AND 2) 6-HOUR MAXIMUM ENDING AT 7 PM CENTRAL TIME, COMPARED TO THE CROP-WEIGHTED NORMAL FOR THE DAY 77% 9% 36% 6% 35% 8% 8% 9% 20% 22% 14% 15% 11% 9% 7% 8% --- DEPARTURE FROM 30-YEAR NORMAL DEPARTURE FROM LAST YEAR --- YESTERDAY YESTERDAY HRW WHEAT LAST 7 DAYS LAST 7 DAYS LAST 14 DAYS LAST 14 DAYS LAST 30 DAYS LAST 30 DAYS LAST 60 DAYS LAST 60 DAYS DECEMBER DECEMBER SRW WHEAT YESTERDAY YESTERDAY LAST 7 DAYS LAST 7 DAYS LAST 14 DAYS LAST 14 DAYS LAST 30 DAYS LAST 30 DAYS LAST 60 DAYS LAST 60 DAYS DECEMBER DECEMBER Data is developed with a proprietary geographic information system analysis of United States Department of Agriculture county-level crop production data weighted by contoured daily temperature from the National Oceanic and Atmospheric Administration, and maximum and minimum temperature normals from PRISM Climate Group, Oregon State University, Production data is averaged for each U.S. county over the last five years to develop weights and includes at least 99% of production each year. HRW wheat is defined as winter wheat in and adjacent the Plains; PNW wheat is winter wheat in ID, OR, WA; SRW wheat is defined as winter wheat along and east of the M ississippi River. 14

15 UNITED STATES AND SOUTH AMERICA 15
UNITED STATES AND SOUTH AMERICA SNAPSHOT REPORT Wednesday, December 20, 2017
 T-storm Weather Summary T-storms affect all growing areas of South America at one time or another over the next two weeks, but abovenormal rainfall is only likely for corn and soybeans in southern Brazil
UNITED STATES AND SOUTH AMERICA OUTLOOK (FULL REPORT) Thursday, December 28, 2017
 Thursday, December 28, 2017") T-storm Weather Summary Despite scattered t-storms Sat.-Sun. in central and northern areas in Argentina, more will likely be needed especially in sunflower areas of the southwest. Some t-storms likely
T-storm Weather Summary Despite scattered t-storms Sat.-Sun. in central and northern areas in Argentina, more will likely be needed especially in sunflower areas of the southwest. Some t-storms likely
UNITED STATES AND SOUTH AMERICA WEATHER ROUNDUP Sunday, December 17, 2017
 T-storm Weather Summary Extreme heat was followed by heavy rain in some key areas of Argentina yesterday. T-storms affect much of the driest Argentina, southern Brazil, and Paraguay through 7 to 10 days,
UNITED STATES AND SOUTH AMERICA OUTLOOK (FULL REPORT) Tuesday, December 19, 2017
 Tuesday, December 19, 2017") T-storm Weather Summary A series of cool fronts move across South America over the next 10 to 14 days, breaking drying across much of Argentina, southern Brazil, and Paraguay. That said, in Argentina,
T-storm Weather Summary A series of cool fronts move across South America over the next 10 to 14 days, breaking drying across much of Argentina, southern Brazil, and Paraguay. That said, in Argentina,
UNITED STATES AND SOUTH AMERICA OUTLOOK (FULL REPORT) Wednesday, April 18, 2018
 Wednesday, April 18, 2018") T-storm Weather Summary Coolness continues over the next week in much of the central U.S., most likely producing the coldest April since 1907 in the Corn Belt, but followed by seasonable to mild weather
T-storm Weather Summary Coolness continues over the next week in much of the central U.S., most likely producing the coldest April since 1907 in the Corn Belt, but followed by seasonable to mild weather
CropCast Corn and Soybean Report Kenny Miller Monday, March 13, 2017
 Accumulated Rainfall (inches) Accumulated GDDs Temperature ( F)/Wind Speed (mph) Precipitation (inches) CropCast Corn and Soybean Report Kenny Miller Monday, March 13, 2017 Peoria, IL Regional Forecast
CropCast Corn and Soybean Report Kenny Miller Tuesday, March 14, 2017
 Accumulated Rainfall (inches) Accumulated GDDs Temperature ( F)/Wind Speed (mph) Precipitation (inches) CropCast Corn and Soybean Report Kenny Miller Tuesday, March 14, 2017 Peoria, IL Regional Forecast
CropCast Corn and Soybean Report Kenny Miller Friday, March 17, 2017
 Accumulated Rainfall (inches) Accumulated GDDs Temperature ( F)/Wind Speed (mph) Precipitation (inches) CropCast Corn and Soybean Report Kenny Miller Friday, March 17, 2017 Peoria, IL Regional Forecast
CropCast Corn and Soybean Report Kyle Tapley Monday, March 20, 2017
 Accumulated Rainfall (inches) Accumulated GDDs Temperature ( F)/Wind Speed (mph) Precipitation (inches) CropCast Corn and Soybean Report Kyle Tapley Monday, March 20, 2017 Peoria, IL Regional Forecast
CropCast Daily Agro-Highlights Don Keeney Monday, April 25, 2016
 VHI Image Date: Apr 21, 2016 USA Wheat Corn Soybeans Vegetative Health Index Map and Crop Condition Tendency EUROPE Wheat Rapeseed FSU Wheat CHINA Wheat Rapeseed ARGENTINA Corn Soybeans BRAZIL Corn Soybeans
Weather Report 30 November 2017
 Weather Report 30 November 2017 South Africa - Weather The frequent precipitation pattern will continue for portions of eastern and central South Africa during the coming week. Moisture totals through
Weather Report 04 April 2018
 Weather Report 04 April 2018 South Africa - Weather Alternating periods of rain and sunshine will evolve across South Africa during the coming week. Moisture totals through next Tuesday morning will range
Weather Report 29 November 2017
 Weather Report 29 November 2017 South Africa - Weather The erratic rain pattern will continue for portions of eastern and central India during the coming week. Moisture totals through next Tuesday morning
Limited Showers Over the Next 10 Day Improves Harvest Conditions for the East but Wettest Areas in S. NSW Likely Remain Slow; Favorable W.
 Australia Limited Showers Over the Next 10 Day Improves Harvest Conditions for the East but Wettest Areas in S. NSW Likely Remain Slow; Favorable W. Harvest Australian Wheat/Canola A few light showers
Weather Report 31 January 2018
 Weather Report 31 January 2018 South Africa - Weather The erratic rain pattern will continue on a frequent basis for the eastern half of South Africa during the coming week. Moisture totals through next
MARKET WIRE. Jason Vollmer (701) Trygg Olson (701) Nick Smith (701) Adam Allmaras (701)
 Trygg Olson (701) Nick Smith (701) Adam Allmaras (701)") MARKET WIRE Quick Notes: New news in the corn market is limited. Markets continue to see spillover from Friday s USDA report. Carryout was unchanged in Friday s report and exports continue to remain sluggish.
MARKET WIRE Quick Notes: New news in the corn market is limited. Markets continue to see spillover from Friday s USDA report. Carryout was unchanged in Friday s report and exports continue to remain sluggish.
Weather Report 05 January 2018
 Weather Report 05 January 2018 South Africa - Weather Crop conditions will remain generally favorable across eastern South Africa during the next two weeks. Net drying will gradually reduce soil moisture,
CropCast Daily Agro-Highlights Don Keeney Friday, April 22, 2016
 VHI Image Date: Apr 14, 2016 USA Wheat Corn Soybeans Vegetative Health Index Map and Crop Condition Tendency EUROPE Wheat Rapeseed FSU Wheat CHINA Wheat Rapeseed ARGENTINA Corn Soybeans BRAZIL Corn Soybeans
Weather and Climate Summary and Forecast December 2017 Report
 Weather and Climate Summary and Forecast December 2017 Report Gregory V. Jones Linfield College December 5, 2017 Summary: November was relatively cool and wet from central California throughout most of
WeatherManager Weekly
 Issue 288 July 14, 2016 WeatherManager Weekly Industries We Serve Agriculture Energy/Utilities Construction Transportation Retail Our Weather Protection Products Standard Temperature Products Lowest Daily
CropCast Daily Agri-Highlights Don Keeney Monday, July 25, 2016
 VHI Image Date: July 15, 2016 USA Corn Soybeans Vegetative Health Index Map and Crop Condition Tendency EUROPE Corn BLACK SEA INDIA Soybeans Groundnuts CHINA Corn Soybeans ARGENTINA BRAZIL Safrinha Corn
Weather and Climate Summary and Forecast February 2018 Report
 Weather and Climate Summary and Forecast February 2018 Report Gregory V. Jones Linfield College February 5, 2018 Summary: For the majority of the month of January the persistent ridge of high pressure
Weekly Market Report 05 December 2018
 Weekly Market Report 05 December 2018 USD/ZAR Exchange rate: The Rand is currently quoted at R13.83 per US Dollar, 10 cents stronger in the last week. The Rand manged to break the support of the descending
Weather and Climate Summary and Forecast Winter
 Weather and Climate Summary and Forecast Winter 2016-17 Gregory V. Jones Southern Oregon University February 7, 2017 What a difference from last year at this time. Temperatures in January and February
SUNDAY WEATHER SUMMARY
 SUNDAY WEATHER SUMMARY Weather Headlines Unseasonably mild weather will prevail in most of the central and eastern U.S. for the first part of this week. After a brief intrusion of seasonably cold weather
Weekly Weather Briefing. NWS Albuquerque. Tuesday Soaker. NWS Albuquerque August 25, Weekly Weather Briefing
 Weekly Weather Briefing Weekly Weather Briefing Tuesday Soaker August 25, 2014 August 2014 vs. 2013 Precipitation Percent of Average August 1-24, 2014 August 2013 Weekly Weather Briefing ABQ **Preliminary**
The Canadian Agriculture Weather Prognosticator
 TO SUBSCRIBE CALL 913-383-1161 OR WRITE TO WORLDWEHER@BIZKC.RR.COM The Canadian Agriculture Weather Prognosticator Volume VIII, Issue XIIII http://www.worldweather.cc November 3, 2016 Canada Crop Weather
Weather and Climate Summary and Forecast January 2018 Report
 Weather and Climate Summary and Forecast January 2018 Report Gregory V. Jones Linfield College January 5, 2018 Summary: A persistent ridge of high pressure over the west in December produced strong inversions
U.S. Outlook For October and Winter Thursday, September 19, 2013
 About This report coincides with today s release of the monthly temperature and precipitation outlooks for the U.S. from the Climate Prediction Center (CPC). U.S. CPC October and Winter Outlook The CPC
Weather and Climate Risks and Effects on Agriculture
 Weather and Climate Risks and Effects on Agriculture Dr. Eric Snodgrass Official Journal of the Fluid Fertilizer Foundation Vol. 26, No. 2, Issue #100 DOWNLOAD Summary: So, what do we need to watch for?
Weather and Climate Summary and Forecast March 2019 Report
 Weather and Climate Summary and Forecast March 2019 Report Gregory V. Jones Linfield College March 2, 2019 Summary: Dramatic flip from a mild winter to a top five coldest February on record in many locations
Weather and Climate Summary and Forecast March 2018 Report
 Weather and Climate Summary and Forecast March 2018 Report Gregory V. Jones Linfield College March 7, 2018 Summary: The ridge pattern that brought drier and warmer conditions from December through most
Weather and Climate Summary and Forecast Fall/Winter 2016
 Weather and Climate Summary and Forecast Fall/Winter 2016 Gregory V. Jones Southern Oregon University November 5, 2016 After a year where we were seemingly off by a month in terms of temperatures (March
Northwest Outlook October 2016
 Northwest Outlook October 2016 Rainfall Opportunities and Challenges Rainfall over the month of September presented some challenges for the fall harvest while other producers benefitted. Figure 1a shows
2012 Growing Season Weather Summary for North Dakota. Adnan Akyüz and Barbara A. Mullins Department of Soil Science October 30, 2012
 2012 Growing Season Weather Summary for North Dakota Adnan Akyüz and Barbara A. Mullins Department of Soil Science October 30, 2012 Introduction The 2012 growing season (the period from April through September)
Weather and Climate Summary and Forecast Winter
 Weather and Climate Summary and Forecast Winter 2016-17 Gregory V. Jones Southern Oregon University December 5, 2016 Well after an October that felt more like November, we just finished a November that
Weather Outlook: 2015 Growing Season
 Weather Outlook: 2015 Growing Season Leon F. Osborne Chester Fritz Distinguished Professor Regional Weather Information Center University of North Dakota Grand Forks, North Dakota Why Should We Be Concerned?
Weather and Climate Summary and Forecast November 2017 Report
 Weather and Climate Summary and Forecast November 2017 Report Gregory V. Jones Linfield College November 7, 2017 Summary: October was relatively cool and wet north, while warm and very dry south. Dry conditions
Weekly Market Report 25 July 2018
 Weekly Market Report 25 July 2018 USD/ZAR Exchange rate: The Rand is currently quoted at R13.28 per US Dollar, 3 cents stronger in than last week. The Rand weakend initially as expected but managed to
Weather and Climate Summary and Forecast October 2017 Report
 Weather and Climate Summary and Forecast October 2017 Report Gregory V. Jones Linfield College October 4, 2017 Summary: Typical variability in September temperatures with the onset of fall conditions evident
MDA WEATHER SERVICES AG WEATHER OUTLOOK. Kyle Tapley-Senior Agricultural Meteorologist May 22, 2014 Chicago, IL
 MDA WEATHER SERVICES AG WEATHER OUTLOOK Kyle Tapley-Senior Agricultural Meteorologist May 22, 2014 Chicago, IL GLOBAL GRAIN NORTH AMERICA 2014 Agenda Spring Recap North America Forecast El Niño Discussion
January 2006 Climate Summary
 Ashley Brooks (765) 494-6574 Feb 9, 2006 http://www.iclimate.org January 1-3 January 2006 Climate Summary Unseasonably warm conditions welcomed in the New Year with highs in the 40s across the northern
Midwest and Great Plains Climate- Drought Outlook 16 April 2015
 Midwest and Great Plains Climate- Drought Outlook 16 April 2015 Dr. Dennis Todey State Climatologist South Dakota State Univ. dennis.todey@sdstate.edu 605-688-5141 Photo taken Feb 19, 2013 Wildfire Wind
Weather and Climate Summary and Forecast January 2019 Report
 Weather and Climate Summary and Forecast January 2019 Report Gregory V. Jones Linfield College January 4, 2019 Summary: December was mild and dry over much of the west, while the east was much warmer than
Weather and Climate Summary and Forecast Summer into Harvest 2016
 Weather and Climate Summary and Forecast Summer into Harvest 2016 Gregory V. Jones Southern Oregon University September 3, 2016 With school and football season starting a hint of fall is right on time
WeatherManager Weekly
 Issue 222 March 26, 2015 Welcome to this week s WeatherManager, your weekly journal for ideas and developments in the weather risk market, brought to you by eweatherrisk. Articles talk about the expanding
Crop / Weather Update
 Crop / Weather Update This is our last for the 2018 planting, growing and harvesting seasons. USDA will publish their Crop Progress Report again in April 2019, and we will continue our coverage sometime
Weather and Climate Summary and Forecast October 2018 Report
 Weather and Climate Summary and Forecast October 2018 Report Gregory V. Jones Linfield College October 4, 2018 Summary: Much of Washington, Oregon, coastal California and the Bay Area and delta region
2018 mid-winter ag weather update
 E-book Bryce Anderson s 2018 mid-winter ag weather update Table of contents Contributing weather patterns... 3 About the author An updated mid-winter forecast... 4 Early expectations for the growing season...
Weather and Climate Summary and Forecast April 2018 Report
 Weather and Climate Summary and Forecast April 2018 Report Gregory V. Jones Linfield College April 4, 2018 Summary: A near Miracle March played out bringing cooler and wetter conditions to the majority
Weather and Climate Summary and Forecast Summer 2017
 Weather and Climate Summary and Forecast Summer 2017 Gregory V. Jones Southern Oregon University August 4, 2017 July largely held true to forecast, although it ended with the start of one of the most extreme
Flood Risk Assessment
 Flood Risk Assessment February 14, 2008 Larry Schick Army Corps of Engineers Seattle District Meteorologist General Assessment As promised, La Nina caused an active winter with above to much above normal
National Wildland Significant Fire Potential Outlook
 National Wildland Significant Fire Potential Outlook National Interagency Fire Center Predictive Services Issued: September, 2007 Wildland Fire Outlook September through December 2007 Significant fire
November 2012 Climate Summary
 Ken Scheeringa and Kayla Hudson Dec 6, 2012 (765) 494-8105 http://www.iclimate.org November 2012 Climate Summary Month Summary November was one of those rare weather months in Indiana when not much happened:
September 2018 Weather Summary West Central Research and Outreach Center Morris, MN
 September 2018 Weather Summary The mean temperature for September was 60.6 F, which is 1.5 F above the average of 59.1 F (1886-2017). The high temperature for the month was 94 F on September 16 th. The
TFS WEATHER BRIEF. Monday, March 25
 TFS WEATHER BRIEF Monday, March 25 Review: The leading edge of cooler and drier air was pushing through Central and East TX this morning. A few lingering thunderstorms were in progress south of I-20 in
January 25, Summary
 January 25, 2013 Summary Precipitation since the December 17, 2012, Drought Update has been slightly below average in parts of central and northern Illinois and above average in southern Illinois. Soil
4) At the end of this presentation we have an operator that will organize the Q & A s.
 At the end of this presentation we have an operator that will organize the Q & A s.") Hello and welcome to the next in a series of Missouri Basin specific climate outlook Webinars 2011-2012. My name is Dennis Todey and I am the State Climatologist for the State of South Dakota. We are taking
Hello and welcome to the next in a series of Missouri Basin specific climate outlook Webinars 2011-2012. My name is Dennis Todey and I am the State Climatologist for the State of South Dakota. We are taking
Midwest and Great Plains Climate and Drought Update
 Midwest and Great Plains Climate and Drought Update June 20,2013 Laura Edwards Climate Field Specialist Laura.edwards@sdstate.edu 605-626-2870 2012 Board of Regents, South Dakota State University General
An ENSO-Neutral Winter
 An ENSO-Neutral Winter This issue of the Blue Water Outlook newsletter is devoted towards my thoughts on the long range outlook for winter. You will see that I take a comprehensive approach to this outlook
MIDDAY WEATHER SUMMARY
 MIDDAY WEATHER SUMMARY Weather Headlines TS Cindy will move inland tonight or early tomorrow morning near the Texas/Louisiana border. The latest GFS model run is cooler late in the 6-10 and early in the
November 2018 Weather Summary West Central Research and Outreach Center Morris, MN
 November 2018 Weather Summary Lower than normal temperatures occurred for the second month. The mean temperature for November was 22.7 F, which is 7.2 F below the average of 29.9 F (1886-2017). This November
Monthly Long Range Weather Commentary Issued: February 15, 2015 Steven A. Root, CCM, President/CEO
 Monthly Long Range Weather Commentary Issued: February 15, 2015 Steven A. Root, CCM, President/CEO sroot@weatherbank.com JANUARY 2015 Climate Highlights The Month in Review During January, the average
Sunday Weather Briefing for September 9, 2018
 GENERAL OVERVIEW (significant forecast changes in red) Sunday Weather Briefing for September 9, 2018 Rains finish today in the far eastern Corn Belt with dry conditions across the region for the work-week
Monthly Long Range Weather Commentary Issued: July 18, 2014 Steven A. Root, CCM, President/CEO
 Monthly Long Range Weather Commentary Issued: July 18, 2014 Steven A. Root, CCM, President/CEO sroot@weatherbank.com JUNE 2014 REVIEW Climate Highlights The Month in Review The average temperature for
The Pennsylvania Observer
 The Pennsylvania Observer April 2, 2009 March 2009 Pennsylvania Weather Recap Prepared by Curt Harpster For the month of March the saying, In like a lion and out like a lamb really fit the pattern quite
California 120 Day Precipitation Outlook Issued Tom Dunklee Global Climate Center
 California 120 Day Precipitation Outlook Issued 11-01-2008 Tom Dunklee Global Climate Center This is my second updated outlook for precipitation patterns and amounts for the next 4 s of the current rainy
Precipitation. Standardized Precipitation Index. NIDIS Intermountain West Drought Early Warning System September 5, 2017
 9/6/2017 NIDIS Drought and Water Assessment NIDIS Intermountain West Drought Early Warning System September 5, 2017 Precipitation The images above use daily precipitation statistics from NWS COOP, CoCoRaHS,
NIDIS Drought and Water Assessment
 NIDIS Drought and Water Assessment PRECIPITATION The images above use daily precipitation statistics from NWS COOP, CoCoRaHS, and CoAgMet stations. From top to bottom, and left to right: most recent 7-days
Crop / Weather Update
 Crop / Weather Update Corn Crop Condition Percent of Acreage Rated Good or Excellent 85 80 75 70 65 60 55 50 45 As of September 9, USDA rates the crop at 68% good to excellent. The rating is up one point
NIDIS Intermountain West Drought Early Warning System January 16, 2018
 NIDIS Drought and Water Assessment NIDIS Intermountain West Drought Early Warning System January 16, 2018 Precipitation The images above use daily precipitation statistics from NWS COOP, CoCoRaHS, and
Crop / Weather Update
 Crop / Weather Update We would like to welcome you to another season of Doane s Weekly Crop Weather Update Progress Chartbook. The goal is to provide a quick visual overview of a number of the key gauges
Monthly Long Range Weather Commentary Issued: NOVEMBER 16, 2015 Steven A. Root, CCM, Chief Analytics Officer, Sr. VP, sales
 Monthly Long Range Weather Commentary Issued: NOVEMBER 16, 2015 Steven A. Root, CCM, Chief Analytics Officer, Sr. VP, sales sroot@weatherbank.com OCTOBER 2015 Climate Highlights The Month in Review The
Weather and Climate Summary and Forecast Summer 2016
 Weather and Climate Summary and Forecast Summer 2016 Gregory V. Jones Southern Oregon University June 6, 2016 May 2016 continued the warm trend for portions of the west, while providing some relief for
Weekly Weather Briefing. NWS Albuquerque. Severe Threat Central & East through Tonight, then Drying. NWS Albuquerque September 29, 2014
 Severe Threat Central & East through Tonight, then Drying September 29, 2014 Today s Max Temp Departure from Normal Notable Severe Weather Events in September* September 30, 1998 Los Lunas: 4.5 Hail*
NatGasWeather.com Daily Report
 NatGasWeather.com Daily Report Issue Time: 5:15 am EDT Wednesday, March 22 nd, 2017 1-7 Day Weather Summary (Mar 22-28 th ): A cold blast will sweep across the Great Lakes and eastern US today and Thursday
MORNING WEATHER SUMMARY
 MORNING WEATHER SUMMARY Weather Headlines Hot weather will prevail across the West into next week while another shot of cooler air moves into the eastern US. The 6-10 day period was trended slightly warmer
Weekly Weather Briefing. NWS Albuquerque. Wet, Then Dry, Then Wet. NWS Albuquerque August 4, Weekly Weather Briefing
 Weekly Weather Briefing Weekly Weather Briefing Wet, Then Dry, Then Wet August 4, 2014 Weekly Weather Briefing Most Recent Temperatures Weekly Weather Briefing Today s Max Temp Departure from Normal Weekly
Impacts of Climate on the Corn Belt
 Impacts of Climate on the Corn Belt Great Lakes Crop Summit 2015 2015 Evelyn Browning Garriss Conclusions Climate change is not linear. It ebbs and flows. Recent polar volcano eruptions created a cool
Crop / Weather Update
 Crop / Weather Update Corn Crop Condition Percent of Acreage Rated Good or Excellent 85 80 75 70 65 60 55 50 45 Corn condition this week is the same as the last two weeks in the good/excellent category,
JEFF JOHNSON S Winter Weather Outlook
 JEFF JOHNSON S 2017-2018 Winter Weather Outlook TABLE OF CONTENTS ABOUT THE AUTHOR Components of the seasonal outlook... 2 ENSO state/ocean temperatures... 3 Sub-seasonal outlooks... 4 Forecast models...
Forecasting Challenges
 Forecasting Challenges 2017-18 Alex Tardy- NWS San Diego Alexander.Tardy@noaa.gov CW3E meetings April 2018 Atmospheric Rivers Climate Forecast System by NOAA 100-h fuel moisture all-time low for South
Arizona Climate Summary
 May 2015 Temperature and Precipitation Summary Arizona Climate Summary June 2015 Summary of conditions for May 2015 May 1 st 14 th : May began with high pressure in the west, and May 1 st was dry statewide,
-Assessment of current water conditions. - Precipitation Forecast. - Recommendations for Drought Monitor
 April 27, 2010 -Assessment of current water conditions - Precipitation Forecast - Recommendations for Drought Monitor 7 Day Precipitation 19-25 April 2010 Month-to-Date Precipitation 1-25 April 2010
National Drought Summary August 14, 2018
 National Drought Summary August 14, 2018 The discussion in the Looking Ahead section is a description of what the official national guidance from the National Weather Service (NWS) National Centers for
By: J Malherbe, R Kuschke
 2015-10-27 By: J Malherbe, R Kuschke Contents Summary...2 Overview of expected conditions over South Africa during the next few days...3 Significant weather events (27 October 2 November)...3 Conditions
NIDIS Intermountain West Drought Early Warning System April 18, 2017
 1 of 11 4/18/2017 3:42 PM Precipitation NIDIS Intermountain West Drought Early Warning System April 18, 2017 The images above use daily precipitation statistics from NWS COOP, CoCoRaHS, and CoAgMet stations.
Weather and Climate Summary and Forecast August 2018 Report
 Weather and Climate Summary and Forecast August 2018 Report Gregory V. Jones Linfield College August 5, 2018 Summary: July 2018 will likely go down as one of the top five warmest July s on record for many
National Wildland Significant Fire Potential Outlook
 National Wildland Significant Fire Potential Outlook National Interagency Fire Center Predictive Services Issued: April 1, 2008 Next Issue: May 1, 2008 Wildland Fire Outlook April 2008 through July 2008
Colorado CoCoRaHS. Colorado CoCoRaHS. Because Every Drop Counts! November 2014 Volume 2, Issue 11
 U.S. PRECIPITATION (% OF AVERAGE) LOOKING BACK AT OCTOBER 2014 October was a fairly dry month for much of the nation with the exception of the Pacific Northwest, portions of New England and the Tennessee
NIDIS Intermountain West Drought Early Warning System November 21, 2017
 NIDIS Drought and Water Assessment NIDIS Intermountain West Drought Early Warning System November 21, 2017 Precipitation The images above use daily precipitation statistics from NWS COOP, CoCoRaHS, and
IWT Scenario 2 Integrated Warning Team Workshop National Weather Service Albany, NY October 31, 2014
 IWT Scenario 2 Integrated Warning Team Workshop National Weather Service Albany, NY October 31, 2014 09 10 11 12 13 Scenario 2 Timeline December 9-13 Tue Wed Thu Fri Sat Tue, Dec. 9 @ 5 am 2014 2014 2014
Nebraska experienced a wide
 Issue 1 August 2016 CLIMATE UPDATE A MONTHLY SUMMARY FROM THE neclimate.unl.edu August saw reprieve from dryness, cooler temps Overview Nebraska experienced a wide range of conditions across the state
NIDIS Weekly Climate, Water and Drought Assessment Summary. Upper Colorado River Basin July 31, 2012
 NIDIS Weekly Climate, Water and Drought Assessment Summary Upper Colorado River Basin July 31, 2012 Fig. 1: July month-to-date precipitation in inches. Fig. 2: SNOTEL WYTD precipitation percentiles (50%
PRECIPITATION. Last Week Precipitation:
 2/24/2015 NIDIS Drought and Water Assessment PRECIPITATION The images above use daily precipitation statistics from NWS COOP, CoCoRaHS, and CoAgMet stations. From top to bottom, and left to right: most
Monthly Long Range Weather Commentary Issued: APRIL 18, 2017 Steven A. Root, CCM, Chief Analytics Officer, Sr. VP,
 Monthly Long Range Weather Commentary Issued: APRIL 18, 2017 Steven A. Root, CCM, Chief Analytics Officer, Sr. VP, sroot@weatherbank.com MARCH 2017 Climate Highlights The Month in Review The average contiguous
2015: A YEAR IN REVIEW F.S. ANSLOW
 2015: A YEAR IN REVIEW F.S. ANSLOW 1 INTRODUCTION Recently, three of the major centres for global climate monitoring determined with high confidence that 2015 was the warmest year on record, globally.
Potentially Wet Wed-Fri
 Potentially Wet Wed-Fri August 18, 2014 Last Week s Lightning Trends TUE 8/12 WED 8/13 THU 8/14 FRI 8/15 t SAT 8/16 SUN 8/17 August 1-16 Precipitation Anomaly: 2013 VS. 2014 AUG 1-16, 2013 AUG 1-16, 2014
NWS SERFC Hydrologic Vulnerability Assessment. Monday, March 9 th, 2015 NOAA, National Weather Service Southeast River Forecast Center
 NWS SERFC Hydrologic Vulnerability Assessment Monday, March 9 th, 2015 NOAA, National Weather Service Southeast River Forecast Center Current Weather Map Today s weather map shows a blossoming system in
Crop / Weather Update
 Crop / Weather Update The next will be published November 13, 2018, due to the Veteran s Day holiday on Monday. Corn Harvesting Progress 100% 90% 80% 70% 60% 50% 40% 30% 20% 10% 0% 9/9 9/16 9/23 9/30 10/7