FINANCE & GRAPHS Questions
|
|
|
- Andrea O’Neal’
- 6 years ago
- Views:
Transcription
1 FINANCE & GRAPHS Questions Question 1 (Adapted from Feb / Mar 2012 P2, Question 2.1) The principal of the local school asked Lihle to take over the running of the school tuck shop. He wanted to show Lihle that the annual profit from the tuck shop increases each year. TABLE 1 below shows the profit of the tuck shop for the last five years. TABLE 1: Profit from the school tuck shop over the last five years YEAR PROFIT IN RAND The data in TABLE 1 can be represented as indicated in the graphs below. 1.1 Explain why the two graphs have different shapes. (2) 1.2 Identify and explain which ONE of the two graphs the principal would use to show Lihle that the annual profits have increased. (3) 1.3 Calculate the largest annual percentage increase in profit between 2007 and 2011 (4) Page 1
2 Question 2 (Adapted from Feb / Mar 2012 P2, Question 4) Mrs Nkosi lives in the centre of Pretoria and works in Sandton. She travels to work by car, covering approximately 65 km each way. She works a five-day week and presently a colleague travels with her to work. Mrs Nkosi pays an average of R650,00 per week for petrol. The general maintenance of her car is 35 cents per kilometre. Her colleague pays her R330,00 per week as her contribution towards the travelling costs. Mrs Nkosi has to be at work by 08:15 daily. It takes her between 1½ hours and 2 ½ hours to travel to work, depending on the traffic. 2.1 Determine the latest time that Mrs Nkosi should leave home to ensure that she always arrives at work on time. (2) 2.2 Calculate Mrs Nkosi's total expenses to and from work for a 22-day working month. (6) Mrs Nkosi decides to use the Gautrain to travel between Pretoria and Sandton. (The Gautrain is a rapid rail link between Pretoria and Johannesburg.) Passengers are able to make the trip between Pretoria station and Sandton station in 42 minutes, which includes three 1-minute stops at other stations along the way. 2.3 Calculate the distance, in kilometres, travelled by the Gautrain between Pretoria station and Sandton station if it travels at an average speed of 85,8 km/h. Use the formula: Total Distance Average Speed = Total Time (4) Mrs Nkosi has the option of using the 'Pay-As-You-Go' payment system or using a '35-Day Pass'. The Gautrain fares in rand are given on ANNEXURE A. It would cost her R150,00 per month for petrol to travel from her home to the station and back. Parking at the station would cost R10,00 per day. The Gaubus (shuttle bus service) between Sandton station and her workplace costs R6, How much money would Mrs Nkosi save if she decides to buy a '35-Day Pass' rather than use the 'Pay-As-You-Go' system? (6) 2.5 Determine the difference in total expenses if Mrs Nkosi used a '35-Day Pass' to travel to work for 22 days, rather than using her car. (8) 2.6 Explain, stating at least TWO financial reasons, whether Mrs Nkosi should use the Gautrain to travel to work. (3) Page 2
3 Question 3 (Adapted from Feb / Mar 2012 P2, Question 5) Peggy is the owner of the Tasty Sandwich Company. Her weekly expenses are: Rent R520,00 Water and electricity R390,00 Wages 25% of the total weekly expenses Other R140,00 The cost of the ingredients and packaging is R4,00 per sandwich. 3.1 Calculate her total weekly expenses. (5) 3.2 Write down a formula that Peggy could use to calculate her total costs (in rand) per week for producing x number of sandwiches in the form: Total costs (in rand) per week = (2) 3.3 Peggy's total costs for making sandwiches in one week amounted to R How many sandwiches were made? (4) Peggy uses the following formula to calculate the total production cost (in rand) per sandwich: P = x where P = total production cost (in rand) per sandwich x = number of sandwiches produced per week TABLE 3: Cost of producing one sandwich Number of sandwiches (x) produced per week B Total cost (P) of producing one sandwich (in rand) A , Calculate the missing values A and B. Explain the meaning of each of these calculated values. (5) 3.5 Draw a curved line on to show the relationship between the total cost of producing one sandwich and the number of sandwiches produced per week. (5) 3.6 Peggy calculated that the total cost per sandwich could vary from R6,00 to R29,00. Calculate how many sandwiches she would produce if the total cost per sandwich is: (a) A minimum (1) (b) A maximum (3) Page 3
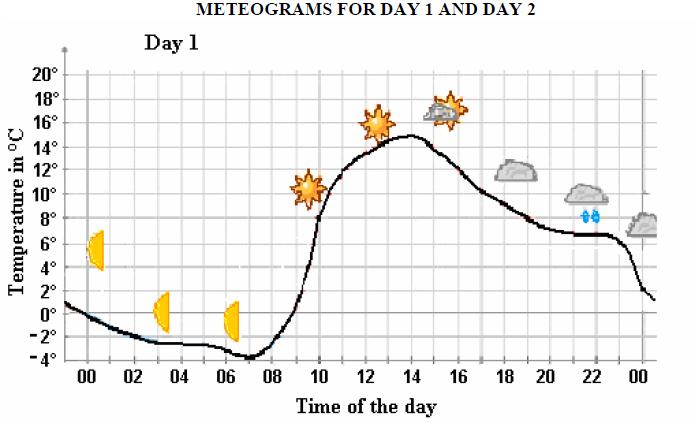
4 Question 4 (Adapted from Feb / Mar 2012 P2, Question 1) Mr Gys and his friends are planning a camping trip. To help them decide when to go camping, they used 24-hour meteograms to see what the weather conditions would be like. (A meteogram is a graph of the predicted weather conditions for a certain period of time. It shows the temperature fluctuations, the cloud conditions and the possibilities of rain.) The meteograms on ANNEXURE B show the predicted weather for two days. Use the meteograms to answer the following questions: 4.1 Give an estimation of the period of time on Day 1 that the predicted temperature will fall below 0 o C. (2) 4.2 Estimate the maximum temperature on Day 2 and the time at which the temperature on Day 2 was at its maximum. (2) 4.3 During which time interval was the predicted temperature on Day 1 lower than the predicted temperature on Day 2? (2) 4.4 Use the range of the temperatures for the two days to determine on which one of the two days you would suggest they should go camping. Explain your answer by showing ALL calculations. (6) Page 4


5 ANNEXURE A ANNEXURE B Page 5
6 Page 6
UNIT 28 Straight Lines: CSEC Revision Test
 UNIT 8 Straight Lines: UNIT 8 Straight Lines ( ). The line segment BC passes through the point A, and has a gradient of. (a) Express the equation of the line segment BC in the form y = mx + c. ( marks)
I. ORDER OF OPERATIONS
 ALGEBRA II HONORS REVIEW PACKET NAME This packet contains all of the material that you should have mastered in Algebra I. You are responsible for reviewing this material over the summer and expect an assessment
MEP Y7 Practice Book B
 8 Quantitative Data 8. Presentation In this section we look at how vertical line diagrams can be used to display discrete quantitative data. (Remember that discrete data can only take specific numerical
1-1 Practice. Patterns and Expressions. Describe each pattern using words. Draw the next figure in each pattern.
 1-1 Practice Patterns and Expressions Describe each pattern using words. Draw the next figure in each pattern. 1. 2. 3. Copy and complete each table. Include a process column. 4. 5. 6. Input Output Input
3. A beam or staircase frame from CSP costs $2.25 for each rod, plus $50 for shipping and handling.
 Pg. 13: #3 3. A beam or staircase frame from CSP costs $2.25 for each rod, plus $50 for shipping and handling. a. Complete the following table to show the costs for beams of different lengths. Beam Length
3) What is the sum of the measures of all of the interior angles of the triangle?
 What is the sum of the measures of all of the interior angles of the triangle?") 1) Define an equilateral triangle. 2) Draw a diagram to illustrate this triangular garden and hose, and label the vertices A, B, C and let segment AD represent the hose. 3) What is the sum of the measures
1) Define an equilateral triangle. 2) Draw a diagram to illustrate this triangular garden and hose, and label the vertices A, B, C and let segment AD represent the hose. 3) What is the sum of the measures
GRADE 11 NOVEMBER 2014 MATHEMATICAL LITERACY P2
 NATIONAL SENIOR CERTIFICATE GRADE 11 NOVEMBER 2014 MATHEMATICAL LITERACY P2 MARKS: 100 TIME: 2 hours *imlit2* This question paper consists of 9 pages including a 1 page annexure. 2 MATHEMATICAL LITERACY
4. The table shows the number of toll booths driven through compared to the cost of using a Toll Tag.
 ALGEBRA 1 Fall 2016 Semester Exam Review Name 1. According to the data shown below, which would be the best prediction of the average cost of a -bedroom house in Georgetown in the year 2018? Year Average
INTRODUCTION TO MATHEMATICAL MODELLING
 306 MATHEMATICS APPENDIX 2 INTRODUCTION TO MATHEMATICAL MODELLING A2.1 Introduction Right from your earlier classes, you have been solving problems related to the real-world around you. For example, you
4306/1F. General Certificate of Secondary Education November MATHEMATICS (SPECIFICATION A) 4306/1F Foundation Tier Paper 1 Non-calculator
 4306/1F Foundation Tier Paper 1 Non-calculator") Surname Other Names For Examiner s Use Centre Number Candidate Number Candidate Signature General Certificate of Secondary Education November 2009 MATHEMATICS (SPECIFICATION A) 4306/1F Foundation Tier
Surname Other Names For Examiner s Use Centre Number Candidate Number Candidate Signature General Certificate of Secondary Education November 2009 MATHEMATICS (SPECIFICATION A) 4306/1F Foundation Tier
Name Class Date. Describe each pattern using words. Draw the next figure in each pattern Input Output
 1-1 Practice Patterns and Expressions Form G Describe each pattern using words. Draw the next figure in each pattern. 1. 2. 3. Copy and complete each table. Include a process column. 4. 5. 6. Input Output
SYSTEMS OF LINEAR EQUATIONS AND INEQUALITIES IN TWO VARIABLES
 5 SYSTEMS OF LINEAR EQUATIONS AND INEQUALITIES IN TWO VARIABLES I. INTRODUCTION AND FOCUS QUESTIONS Have you ever asked yourself how businessmen make profits? How can farmers increase their yield or harvest?
8.2. Solving Equations: ax + b = c, x a + b = c. Explore Equations With Two Operations. Focus on
 . Focus on fter this lesson, you will be able to model problems with linear equations involving two operations solve linear equations with rational numbers using two operations Web Link To learn more about
Name Date Class. Standardized test prep Review of Linear Equations 8 Blue/Green
 Standardized test prep Review of Linear Equations 8 Blue/Green 2013-2014 Name _ Date Class Complete questions at least 1-8. 1. Which point is a solution to the system of equations shown below? a. ( 39,
Houston County School System Mathematics
 Student Name: Teacher Name: Grade: 6th Unit #: 4b Unit Title: Analyzing Quantitative Relationships Approximate Start Date of Unit: January 4 Approximate End Date (and Test Date) of Unit: January 19 I can
NAME DATE PER. REVIEW: FUNCTIONS PART 2
 NAME DATE PER. REVIEW: FUNCTIONS PART 2 Use the following story to answer questions 1 5. Mrs. Anderson bought a package of 500 stickers at the beginning of the school year. She plans to give away 5 stickers
Algebra 1 Fall Review
 Name Algebra 1 Fall Review 2013-2014 Date 1. Write an inequality to best represent the graph shown at right. (A.1.D.) m: b: inequality: 2. Write an inequality to best describe the graph shown at right.
Houston County School System Mathematics
 Student Name: Teacher Name: Grade: 6th Unit #: 4b Unit Title: Analyzing Quantitative Relationships Approximate Start Date of Unit: Approximate End Date (and Test Date) of Unit: The following Statements
Functions and Linear Functions Review
 Class: Date: Functions and Linear Functions Review 1. Fill in the following diagram using the words: Function Rule, Equation, Input, Output, Domain, Range, X value, Y value, Indenpendent variable, and
MATHEMATICS NUMERACY UNIT 1: NON-CALCULATOR INTERMEDIATE TIER
 Surname Centre Number Candidate Number Other Names 0 GCSE NEW 3310U30-1 S17-3310U30-1 MATHEMATICS NUMERACY UNIT 1: NON-CALCULATOR INTERMEDIATE TIER THURSDAY, 25 MAY 2017 MORNING 1 hour 45 minutes ADDITIONAL
GRADE 11 NOVEMBER 2015 MATHEMATICAL LITERACY P2 MEMORANDUM
 NATIONAL SENI CERTIFICATE GRADE 11 NOVEMBER 2015 MATHEMATICAL LITERACY P2 MEMANDUM MARKS: 100 Symbol M MA CA A C S RT/RG/RM F SF J P R Explanation Method Method with accuracy Consistent accuracy Accuracy
Core Focus on Linear Equations Block 5 Review ~ Two-Variable Data
 Core Focus on Linear Equations Block 5 Review ~ Two-Variable Data Name Period Date Part I Selected Response For numbers 1a 1d, circle the type of correlation you would expect the following data sets to
4) Solve for this system using your graphing
 Solve for this system using your graphing") Algebra Unit 5 HW Day 1 SOLVING GRAPHICALLY Graph the following systems: 1) x 2y 12 y 2x 6 2) y x 2 6x 2y 10 ) x y 9 4) Solve for this system using your graphing x calculator. [You will still need to put
Algebra Unit 5 HW Day 1 SOLVING GRAPHICALLY Graph the following systems: 1) x 2y 12 y 2x 6 2) y x 2 6x 2y 10 ) x y 9 4) Solve for this system using your graphing x calculator. [You will still need to put
Geometric Sequences and Series
 12-2 OBJECTIVES Find the nth term and geometric means of a geometric sequence. Find the sum of n terms of a geometric series. Geometric Sequences and Series ACCOUNTING Bertha Blackwell is an accountant
Math 4 SN Systems Word Problems Practice
 Math 4 SN Systems Word Problems Practice Name : 1 For each week that he works, Fred is paid a fixed hourly wage plus a bonus based on the amount of profit the company makes. Last week, Fred worked 14 hours
Final Exam Study Guide
 Algebra 2 Alei - Desert Academy 2011-12 Name: Date: Block: Final Exam Study Guide 1. Which of the properties of real numbers is illustrated below? a + b = b + a 2. Convert 6 yards to inches. 3. How long
Lesson 8: Representing Proportional Relationships with Equations
 Lesson 8: Representing Proportional Relationships with Equations Student Outcomes Students use the constant of proportionality to represent proportional relationships by equations in real world contexts
Lesson 9: Representing Proportional Relationships with Equations
 : Representing Proportional Relationships with Equations Classwork Example 1: Jackson s Birdhouses Jackson and his grandfather constructed a model for a birdhouse. Many of their neighbors offered to buy
Write each expression as a sum or difference of logarithms. All variables are positive. 4) log ( ) 843 6) Solve for x: 8 2x+3 = 467
 log ( ) 843 6) Solve for x: 8 2x+3 = 467") Write each expression as a single logarithm: 10 Name Period 1) 2 log 6 - ½ log 9 + log 5 2) 4 ln 2 - ¾ ln 16 Write each expression as a sum or difference of logarithms. All variables are positive. 3) ln
Write each expression as a single logarithm: 10 Name Period 1) 2 log 6 - ½ log 9 + log 5 2) 4 ln 2 - ¾ ln 16 Write each expression as a sum or difference of logarithms. All variables are positive. 3) ln
A C E. Answers Investigation 2. Applications. Age (wk) Weight (oz) 1. a. Accept any line that approximates the data. Here is one possibility:
 Weight (oz) 1. a. Accept any line that approximates the data. Here is one possibility:") Answers Applications 1. a. Accept any line that approximates the data. Here is one possibility: 4. a. Lines will vary. Here is one possibility: b. y = 8.5x 2.5. Students might come up with a simpler model
Answers Applications 1. a. Accept any line that approximates the data. Here is one possibility: 4. a. Lines will vary. Here is one possibility: b. y = 8.5x 2.5. Students might come up with a simpler model
PLC Papers. Created For:
 PLC Papers Created For: Compound Units 2 Grade 5 Objective: Convert standard compound units in numerical and algebraic contexts. Question 1. Ben goes on holiday to Hong Kong. In Hong Kong, Ben sees a camera
A C E. Applications. Applications Connections Extensions. Student 1 Student Below are some results from the bridge experiment in a CMP class.
 A C E Applications Connections Extensions Applications 1. Below are some results from the bridge experiment in a CMP class. Bridge-Thickness Experiment Number of Layers 2 4 6 8 Breaking Weight (pennies)
Solve using graphing. Solve using graphing. Solve using graphing.
 Solve using graphing. Solve using graphing. Solve using graphing. Solve using graphing. Solve using graphing. Solve using graphing. Of the four linear functions represented below, which has the greatest
ALGEBRA I END-of-COURSE PRACTICE
 1. Which graph is the solution to the inequality A. 2 x 6 B. C. D. 2. Which of the following tables does not represent a functional relationship? Division of Mathematics, Science, and Advanced Academic
Name: Class: Date: Unit 1. Thinking with Mathematical Models Investigation 2: Linear Models & Equations. Practice Problems
 Unit 1 Thinking with Mathematical Models Investigation 2: Linear Models & Equations Practice Problems Directions: Please complete the necessary problems to earn a maximum of 7 points according to the chart
VCE Further Mathematics Units 3&4
 Trial Examination 2016 VCE Further Mathematics Units 3&4 Written Examination 2 Question and Answer Booklet Reading time: 15 minutes Writing time: 1 hour 30 minutes Student s Name: Teacher s Name: Structure
International General Certificate of Secondary Education CAMBRIDGE INTERNATIONAL EXAMINATIONS MATHEMATICS
 Candidate Name Centre Number www.xtremepapers.com Candidate Number International General Certificate of Secondary Education CAMBRIDGE INTERNATIONAL EXAMINATIONS MATHEMATICS PAPER 1 OCTOBER/NOVEMBER SESSION
Instructions. Information. Advice
 Instructions Use black ink or ball-point pen. Fill in the boxes at the top of this page with your name, centre number and candidate number. Answer all questions. Answer the questions in the spaces provided
Learning Goal 11.2: Scatterplots & Regression
 Name: ate: 1. Which graph represents data used in a linear regression that produces a correlation coefficient closest to 1? 3. Which equation most closely represents the line of best fit for the scatter
2016 Calculator Test 1 Name:
 2016 Calculator Test 1 Name: GCSE Mathematics 1MA0 Formulae: Higher Tier You must not write on this formulae page. Anything you write on this formulae page will gain NO credit. Volume of prism = area of
GAUTENG DEPARTMENT OF EDUCATION PROVINCIAL EXAMINATION JUNE 2016 GRADE
 GAUTENG DEPARTMENT OF EDUCATION PROVINCIAL EXAMINATION JUNE 06 GRADE 9 MATHEMATICS TIME: 0 minutes MARKS: 00 pages MATHEMATICS Grade 9 GAUTENG DEPARTMENT OF EDUCATION PROVINCIAL EXAMINATION MATHEMATICS
NAME DATE PER. FALL FINAL EXAM REVIEW ALGEBRA 1 Solve = 6 3v = -3(c + 5)
") FINAL EXAM REVIEW, p. 1 NAME DATE PER. FALL FINAL EXAM REVIEW ALGEBRA 1 Solve. 1. 24 = 6 3v 2. 12 = -3(c + 5) 3. 5 2(x 3) = 63 4. 7x + 2(x - 5) = 4(x + 8) 5. r 1 10 3 2 6. x 1 2x 2 5 4 Write an equation,
FINAL EXAM REVIEW, p. 1 NAME DATE PER. FALL FINAL EXAM REVIEW ALGEBRA 1 Solve. 1. 24 = 6 3v 2. 12 = -3(c + 5) 3. 5 2(x 3) = 63 4. 7x + 2(x - 5) = 4(x + 8) 5. r 1 10 3 2 6. x 1 2x 2 5 4 Write an equation,
Solve each absolute value equation x 7 = x 9 = (3x 12) = - 12
 = - 12") Solve each absolute value equation. 16. 3x 7 = 11 17. - 4 x 9 = - 16 18. 2(3x 12) = - 12 19. Explain why there can be one, two or no solutions to an absolute value equation. 5. Solve each equation for
Solve each absolute value equation. 16. 3x 7 = 11 17. - 4 x 9 = - 16 18. 2(3x 12) = - 12 19. Explain why there can be one, two or no solutions to an absolute value equation. 5. Solve each equation for
Section 2.2 Objectives
 Section 2.2 Objectives Solve multi-step equations using algebra properties of equality. Solve equations that have no solution and equations that have infinitely many solutions. Solve equations with rational
Wahkiakum School District, Pre-EOC Algebra
 Pre-EOC Assessment Algebra1 #2 Wahkiakum School District ALG1 Page 1 1. Order the following numbers from least to greatest: a. 19 2, 3π, 8.7 100, 62 3π, 62, 8.7 10 0, 19 2 b. 62, 8.7 10 0, 3π, 19 2 c.
Algebra 1. Standard Linear Functions. Categories Graphs Tables Equations Context. Summative Assessment Date: Friday, September 14 th.
 Algebra 1 Standard Linear Functions Categories Graphs Tables Equations Contet Summative Assessment Date: Friday, September 14 th Page 1 Page 2 Page 3 Linear Functions DAY 1 Notesheet Topic Increasing and
Unit 3 Multiple Choice Test Questions
 Name: Date: Unit Multiple Choice Test Questions MCC9.F.IF. Understand that a function from one set (called the domain) to another set (called the range) assigns to each element of the domain exactly one
MAFS.8.F.1 Define, evaluate, and compare functions. Nonlinear functions may be included for identifying a function.
 Content Standard MAFS.8.F Functions Assessment Limits Calculator s Context A table of values for x and y is shown. x y 1 5 2 7 3 9 4 11 MAFS.8.F.1 Define, evaluate, and compare functions. MAFS.8.F.1.1
MATH 1101 Exam 1 Review. Spring 2018
 MATH 1101 Exam 1 Review Spring 2018 Topics Covered Section 2.1 Functions in the Real World Section 2.2 Describing the Behavior of Functions Section 2.3 Representing Functions Symbolically Section 2.4 Mathematical
STRAND E: STATISTICS E2 Data Presentation
 STRAND E: STATISTICS E2 Data Presentation Text Contents * * Section E2.1 Pie Charts E2.2 Line Graphs E2.3 Stem and Leaf Plots E2.4 Graphs: Histograms E2 Data Presentation E2.1 Pie Charts Pie charts, which
Coimisiún na Scrúduithe Stáit State Examinations Commission. Leaving Certificate Examination Sample Paper. Mathematics
 2015. M25S Coimisiún na Scrúduithe Stáit State Examinations Commission Leaving Certificate Examination Sample Paper Mathematics Time: 2 hours, 30 minutes 300 marks Running total Examination number Centre
Statistics I Exercises Lesson 3 Academic year 2015/16
 Statistics I Exercises Lesson 3 Academic year 2015/16 1. The following table represents the joint (relative) frequency distribution of two variables: semester grade in Estadística I course and # of hours
Practice Paper 1. Section I. Attempt Questions 1 15 (15 marks) Allow about 20 minutes for this section
 Allow about 20 minutes for this section") 45 Section I Attempt Questions 5 (5 marks) Allow about 0 minutes for this section Which of the following is the highest pay? A $44. per week B $884.68 per fortnight C $647.50 per month D $75 000 per annum
45 Section I Attempt Questions 5 (5 marks) Allow about 0 minutes for this section Which of the following is the highest pay? A $44. per week B $884.68 per fortnight C $647.50 per month D $75 000 per annum
Name Date Class Unit 4 Test 1 Review: Linear Functions
 Name Date Class Unit 4 Test 1 Review: Linear Functions Select the best answer. 1. Does this graph represent a linear function? Explain your answer in the space provided. 2. A jogger runs 4 mi/h. The function
10-1 Sequences as Functions. Determine whether each sequence is arithmetic. Write yes or no. 1. 8, 2, 12, 22
 Determine whether each sequence is arithmetic. Write yes or no. 1. 8, 2, 12, 22 Subtract each term from the term directly after it. The common difference is 10. 3. 1, 2, 4, 8, 16 Subtract each term from
3301/1F. General Certificate of Secondary Education June MATHEMATICS (SPECIFICATION A) 3301/1F Foundation Tier Paper 1 Non-Calculator
 3301/1F Foundation Tier Paper 1 Non-Calculator") Surname Other Names For Examiner s Use Centre Number Candidate Number Candidate Signature General Certificate of Secondary Education June 2007 MATHEMATICS (SPECIFICATION A) 3301/1F Foundation Tier Paper
Surname Other Names For Examiner s Use Centre Number Candidate Number Candidate Signature General Certificate of Secondary Education June 2007 MATHEMATICS (SPECIFICATION A) 3301/1F Foundation Tier Paper
The area under a graph can be estimated by counting squares.
 A15 CALCULATE OR ESTIMATE GRADIENTS OF GRAPHS AND AREAS UNDER GRAPHS (INCLUDING QUADRATIC AND OTHER NON-LINEAR GRAPHS), AND INTERPRET RESULTS IN CASES SUCH AS DISTANCE- TIME GRAPHS, VELOCITY-TIME GRAPHS
ALGEBRA 1. Workbook Common Core Standards Edition. Published by TOPICAL REVIEW BOOK COMPANY. P. O. Box 328 Onsted, MI
 Workbook Common Core Standards Edition Published by TOPICAL REVIEW BOOK COMPANY P. O. Box 328 Onsted, MI 49265-0328 www.topicalrbc.com EXAM PAGE Reference Sheet...i January 2017...1 June 2017...11 August
Rational, Exponential, and Logarithmic Functions
 Activity 1: Rational Functions Your company picnic is being held at a state park 15 miles away. There are large differences in how long it took the employees to arrive. Using the equation rate = distance
MATHEMATICS National Qualifications - Intermediate 1 Maths Units 1 and 2 Paper 1 (non-calculator)
") Prel Examination 005 / 06 MATHEMATICS National Qualifications - Intermediate Maths Units and Paper (non-calculator) Time allowed - 35 minutes Fill in these oxes and read carefully what is printed elow
Prel Examination 005 / 06 MATHEMATICS National Qualifications - Intermediate Maths Units and Paper (non-calculator) Time allowed - 35 minutes Fill in these oxes and read carefully what is printed elow
Algebra: Unit 3 Review
 Name: Date: Class: Algebra: Unit 3 Review 1) A company that manufactures radios first pays a start-up cost, and then spends a certain amount of money to manufacture each radio. If the cost of manufacturing
FURTHER MATHEMATICS Units 3 & 4 - Written Examination 2
 THIS BOX IS FOR ILLUSTRATIVE PURPOSES ONLY 2016 Examination Package - Trial Examination 4 of 5 Figures STUDENT NUMBER Letter Words FURTHER MATHEMATICS Units 3 & 4 - Written Examination 2 (TSSM s 2014 trial
Study Island. Linear and Exponential Models
 Study Island Copyright 2014 Edmentum - All rights reserved. 1. A company is holding a dinner reception in a hotel ballroom. The graph represents the total cost of the ballroom rental and dinner. 3. In
Systems of Equations Unit Five ONE NONE INFINITE
 Systems of Equations Unit Five ONE NONE INFINITE Standards: 8.EE.8 Analyze and solve pairs of simultaneous linear equations. a. Understand that solutions to a system of two linear equations in two variables
Sample. Test Booklet. Subject: MA, Grade: HS PSSA 2013 Keystone Algebra 1. - signup at to remove - Student name:
 Test Booklet Subject: MA, Grade: HS PSSA 2013 Keystone Algebra 1 Student name: Author: Pennsylvania District: Pennsylvania Released Tests Printed: Friday May 31, 2013 1 Which of the following inequalities
Applications of Mathematics
 Write your name here Surname Other names Edexcel GCSE Centre Number Candidate Number Applications of Mathematics Unit 1: Applications 1 For Approved Pilot Centres ONLY Higher Tier Tuesday 11 June 2013
Calculating Acceleration
 Calculating Acceleration Textbook pages 392 405 Before You Read Section 9. 2 Summary How do you think a velocity-time graph might differ from the position-time graph you learned about in the previous chapter?
c. Solve the system of two equations to find the speed of the boat in the water (x) and the speed of the current (y). (0.45, 0.05)
 and the speed of the current (y). (0.45, 0.05)") Math Applications The applications that follow are like the ones you will encounter in many workplaces. Use the mathematics you have learned in this chapter to solve the problems. Wherever possible, use
Math Applications The applications that follow are like the ones you will encounter in many workplaces. Use the mathematics you have learned in this chapter to solve the problems. Wherever possible, use
Chapter 4 Statistics
 Chapter 4 Section 4.1The mean, mode, median and Range The idea of an average is extremely useful, because it enables you to compare one set of data with another set by comparing just two values their averages.
The City School. Prep Section. PAF Chapter. 2 nd Term Mathematics. Class 9. Worksheets for Intervention Classes
 The City School PAF Chapter Prep Section 2 nd Term Mathematics Class 9 Worksheets for Intervention Classes (1) Express 17 as percentage. 40 EVERYDAY MATHEMATICS (2) When Peter went to Hong Kong, he changed
SOLVING LINEAR INEQUALITIES
 Topic 15: Solving linear inequalities 65 SOLVING LINEAR INEQUALITIES Lesson 15.1 Inequalities on the number line 15.1 OPENER Consider the inequality x > 7. 1. List five numbers that make the inequality
MATHEMATICS PAPER 1. Question-Answer Book. QUEEN S COLLEGE Half-yearly Examination, Secondary 1 Date: Time: 8:30 am 9:45 am
 QUEEN S COLLEGE Half-yearly Examination, 2008-2009 MATHEMATICS PAPER Class Class Number Question-Answer Book Secondary Date: 2 2009 Time: 8:0 am 9:5 am Teacher s Use Only Question No. Max. marks Marks
Mathematical Formulae. Total amount = Curved surface area of a cone = rl. Surface area of a sphere = Volume of a cone = Volume of a sphere =
 Mathematical Formulae Compound interest Total amount = r P 1 100 n Mensuration Curved surface area of a cone = rl Surface area of a sphere = 4 r Volume of a cone = 1 3 r h Volume of a sphere = 4 r 3 3
MATHEMATICS PRELIMINARY EXAMINATION PAPER 1
 MATHEMATICS PRELIMINARY EXAMINATION PAPER 1 GRADE 1 LEARNING OUTCOMES: LO 1 LO MARKS: 150 TIME: 3 hours ASSESSMENT STANDARDS: AS 1,, 3, 4,5, 6 AS 1,, 3, 4, 5, 6, 7, 8 LEARNER S NAME: CLASS: INSTRUCTIONS
Answer ALL questions. Each question is worth 1 mark. Show All working in the working column
 SECTION 1 Answer ALL questions. Each question is worth 1 mark. Show All working in the working column No TEST ITEMS WORKING COLUMNS 1 Round 4312 to the NEAREST hundred 2 Express 43% as a decimal 3 Write
Standard Form Calculation
 Clip Standard Form Calculation ) Work out the following, giving your answer in standard form. a) (6 0 ) (8 0 ) c) 0 6 0 - b) ( 0 ) + ( 0 ) d) (9. 0 ) ( 0 ) ) A spaceship travelled for 0 hours at a speed
Writing and Solving Equations
 Writing and Solving Equations Melody s Music Solution Lesson 6-1 Modeling and Writing Two-Step Equations ACTIVITY 6 Learning Targets: Use variables to represent quantities in real-world problems. Model
2. What are the zeros of (x 2)(x 2 9)? (1) { 3, 2, 3} (2) { 3, 3} (3) { 3, 0, 3} (4) {0, 3} 2
(x 2 9)? (1) { 3, 2, 3} (2) { 3, 3} (3) { 3, 0, 3} (4) {0, 3} 2") ALGEBRA 1 Part I Answer all 24 questions in this part. Each correct answer will receive 2 credits. No partial credit will be allowed. For each question, write on the space provided the numeral preceding
ALGEBRA 1 Part I Answer all 24 questions in this part. Each correct answer will receive 2 credits. No partial credit will be allowed. For each question, write on the space provided the numeral preceding
3-3 Using Tables and Equations of Lines
 3-3 Using Tables and Equations of Lines Objectives Students will understand that linear models are appropriate when the situation has a constant increase/decrease. slope is the rate of change. the rate
O5C1: Graphing Exponential Functions
 Name: Class Period: Date: Algebra 2 Honors O5C1-4 REVIEW O5C1: Graphing Exponential Functions Graph the exponential function and fill in the table to the right. You will need to draw in the x- and y- axis.
TEST. Name: A. $600 B. $1,200 C. $2,400 D. $3,600
 TEST 1. The graph shows two savings plans. If the same savings rates are continued, what will be the difference in the amount saved at the end of two years? A. $600 B. $1,200 C. $2,400 D. $3,600 2. Which
Tables and Line Graphs
 4 CHAPTER Tables and Line Graphs Worksheet 1 Making and Interpreting a Table Find the parts and wholes. The table shows the number of boys and girls in a school. Number of Boys Number of Girls Total 625
2. Tell which graph corresponds to person 1 in Table 1-9.2b above.
 1. An architect charges $1800 for a first draft of a three-bedroom house. If the work takes longer than 8 hours, the architect charges $105 for each additional hour. What would be the total cost for a
No. Items Working Column Mark
 TEST 16 291 No. Items Working Column Mark 1. Write in figures: Seven hundred and two thousand and nine. 702 009 Answer 2. Multiply: 124 by 25 124 x 25 = 3100 Answer 3. Express 0.375 as a percent. Answer
Modeling Linear Relationships In the Patterns of Change unit, you studied a variety of
 LESSON 1 Modeling Linear Relationships In the Patterns of Change unit, you studied a variety of relationships between quantitative variables. Among the most common were linear functions those with straight-line
An Explorative Econometric Model of Sydney Metropolitan Rail Patronage. Safe, clean and reliable passenger services
 An Explorative Econometric Model of Sydney Metropolitan Rail Patronage Dr Neil Douglas Managing Director Douglas Economics George Karpouzis Chief Economist Rail Corporation (RailCorp) NSW Safe, clean and
1.) The number of points a basketball player scored each game for one week is recorded. Which is a not a statistical question for the situation?
 The number of points a basketball player scored each game for one week is recorded. Which is a not a statistical question for the situation?") 6 th Grade Math Common Assessment: Chapter 6 Name: Date 6.SP.1 1.) The number of points a basketball player scored each game for one week is recorded. Which is a not a statistical question for the situation?
6 th Grade Math Common Assessment: Chapter 6 Name: Date 6.SP.1 1.) The number of points a basketball player scored each game for one week is recorded. Which is a not a statistical question for the situation?
Fall IM I Exam B
 Fall 2011-2012 IM I Exam B Multiple Choice Identify the choice that best completes the statement or answers the question. 1. Which of the following equations is linear? a. y = 2x - 3 c. 2. What is the
3.1 NOTES Solving Systems of Linear Equations Graphically
 3.1 NOTES Solving Systems of Linear Equations Graphically A system of two linear equations in two variables x and y consist of two equations of the following form: Ax + By = C Equation 1 Dx + Ey = F Equation
Semester 1 Final Review. c. 7 d.
 Solve the equation in questions 1-4. 1. 7 x + 5 = 8 a. 7 b. 1 7 c. 7 d. 7. 7 = d + 0 a. 10 b. 0 c. 1 d. 1. p 1 = 5(p 1) (7 p) a. b. 0 c. 9 d. 10 4. 5x 5 = x 9 a. b. 1 c. 1 d. 5. A customer went to a garden
UNIVERSITY OF CAMBRIDGE INTERNATIONAL EXAMINATIONS International General Certificate of Secondary Education
 UNIVERSITY OF CAMBRIDGE INTERNATIONAL EXAMINATIONS International General Certificate of Secondary Education *4552761824* MATHEMATICS 0580/32 Paper 3 (Core) October/November 2011 Candidates answer on the
Mathematics (Project Maths Phase 3)
") 01. M35 S Coimisiún na Scrúduithe Stáit State Examinations Commission Leaving Certificate Examination, 01 Sample Paper Mathematics (Project Maths Phase 3) Paper 1 Foundation Level Time: hours, 30 minutes
01. M35 S Coimisiún na Scrúduithe Stáit State Examinations Commission Leaving Certificate Examination, 01 Sample Paper Mathematics (Project Maths Phase 3) Paper 1 Foundation Level Time: hours, 30 minutes
Algebra 2 Unit 1 Print
 lgebra 2 Unit 1 Print Question 1 entano spends $170 to order 30 pounds of nuts from an online company. The company charges $3.50 per pound for peanuts and $7.50 per pound for almonds. It also charges a
0.3 Domain and Range: Relations vs Functions, Domain, Range, and Vertical Line Test Worksheet 3 #1-7
 Unit 0 Check Sheet Function Families Check sheet must be turned in to receive Homework & Quiz points. All quiz corrections must be done for test score to replace quiz scores. No check sheet = No Points.
1. Math 101. Math 101 Website: richard/math101 Section 2 Website: richard/math101/fall06
 1. Math 101 Lines and Slope Professor Richard Blecksmith richard@math.niu.edu Dept. of Mathematical Sciences Northern Illinois University Math 101 Website: http://math.niu.edu/ richard/math101 Section
2017 PAPER 1 SOLUTIONS. Junior Cert Higher Level
 4 8 5 10 3 2017 PAPER 1 SOLUTIONS Junior Cert Higher Level 2017 JCHL Paper 1 Question 1 (a) (i) 15 Marks A person s Body Mass Index (BMI) is given by the following formula: BMI = w h 2 where w is their
3, 8, 4, x, y and z. Find a value for each of x, y and z. [5]
![3, 8, 4, x, y and z. Find a value for each of x, y and z. [5]](/thumbs/87/96041667.jpg "3, 8, 4, x, y and z. Find a value for each of x, y and z. [5]") 9 (a) The number of people living in six houses is 3, 8, 4, x, y and z. The median is 7W. The mode is 8. The mean is 7. Find a value for each of x, y and z. [5] (b) The grouped frequency table below shows
9 (a) The number of people living in six houses is 3, 8, 4, x, y and z. The median is 7W. The mode is 8. The mean is 7. Find a value for each of x, y and z. [5] (b) The grouped frequency table below shows
TEST ITEMS WORKING COLUMN
 SECTION 1 Answer ALL questions. Each question is worth 1 mark Show ALL: working in the Working Column NO TEST ITEMS WORKING COLUMN 1 Express 3/8 as a percent 2 What is the value of the 6 in 80.36? 3 Arrange
Thursday 8 June 2017 Morning Time allowed: 1 hour 30 minutes
 Please write clearly in block capitals. Centre number Candidate number Surname Forename(s) Candidate signature GCSE MATHEMATICS Foundation Tier Paper 2 Calculator F Thursday 8 June 2017 Morning Time allowed:
Algebra I Practice Exam
 Algebra I This practice assessment represents selected TEKS student expectations for each reporting category. These questions do not represent all the student expectations eligible for assessment. Copyright