THE CLIMATE AND WEATHER OF CANTERBURY
|
|
|
- April Conley
- 6 years ago
- Views:
Transcription

1 THE CLIMATE AND WEATHER OF CANTERBURY 2nd edition G. R. Macara
2 2016. All rights reserved. The copyright for this report, and for the data, maps, figures and other information (hereafter collectively referred to as data ) contained in it, is held by NIWA. This copyright extends to all forms of copying and any storage of material in any kind of information retrieval system. While NIWA uses all reasonable endeavours to ensure the accuracy of the data, NIWA does not guarantee or make any representation or warranty (express or implied) regarding the accuracy or completeness of the data, the use to which the data may be put or the results to be obtained from the use of the data. Accordingly, NIWA expressly disclaims all legal liability whatsoever arising from, or connected to, the use of, reference to, reliance on or possession of the data or the existence of errors therein. NIWA recommends that users exercise their own skill and care with respect to their use of the data and that they obtain independent professional advice relevant to their particular circumstances. NIWA SCIENCE AND TECHNOLOGY SERIES NUMBER 68 ISSN Note to Second Edition This publication replaces the first edition of New Zealand Meteorological Service Miscellaneous Publication 115 (17), written in 1987 by A. P. Ryan. It was considered necessary to update the first edition, incorporating more recent data and updated methods of climatological variable calculation.
3 THE CLIMATE AND WEATHER OF CANTERBURY 2nd edition G.R. Macara
4

5 CONTENTS SUMMARY 5 INTRODUCTION 6 TYPICAL WEATHER SITUATIONS IN CANTERBURY 8 Easterly-quarter airflows 8 Southerly-quarter airflows 9 West-southwesterly airflows 9 Northwesterly airflows 10 CLIMATIC ELEMENTS 12 Wind 12 Rainfall 16 Rainfall distribution 16 Rainfall frequency and intensity 19 Recent extreme events in Canterbury 21 Periods of low rainfall 22 Temperature 23 Sea surface temperature 23 Air temperature 23 Earth temperatures 27 Frosts 27 Sunshine and Solar Radiation 29 Sunshine 29 Solar radiation 30 UV (ultra-violet) radiation 30 Other elements 31 Snow 31 Thunderstorms 32 Hail 32 Fog 32 DERIVED CLIMATOLOGICAL PARAMETERS 34 Vapour pressure and relative humidity 34 Evapotranspiration and soil water balance 35 Degree-day totals 36 ACKNOWLEDGEMENTS 41 REFERENCES 41 4

6 SUMMARY All aspects of the climate of Canterbury are dominated by the influence of the Southern Alps on the prevailing westerly airflows. Five main climate zones can be distinguished: 1. The plains, with prevailing winds from the northeast and south-west, low rainfall, and a relatively large annual temperature range by New Zealand standards. 2. The eastern foothills and southern Kaikouras, with cooler and wetter weather, and a high frequency of north-westerlies. 3. The high country near the main divide, with prevailing north-west winds, abundant precipitation, winter snow and some glaciers particularly towards the south. 4. Banks Peninsula and the coastal strip north of Amberley, with relatively mild winters, and rather high annual rainfall with a winter maximum. 5. The inland basins and some sheltered valleys, where rainfall is low with a summer maximum, and diurnal and annual temperature ranges are large. Although north-westerlies are not frequent on the plains they are an important consideration for the agricultural sector, due to the exceptional evaporation that occurs on north-westerly days. Irrigation is necessary in most parts of the plains during the growing season due to the relatively low rainfall received there. The rather cold winter weather in Canterbury is interrupted at times by unseasonably warm days during foehn episodes. Daily maximum temperatures in summer often exceed 30 C throughout Canterbury during such foehn episodes, and on rare occasions temperatures in excess of 40 C have been recorded.

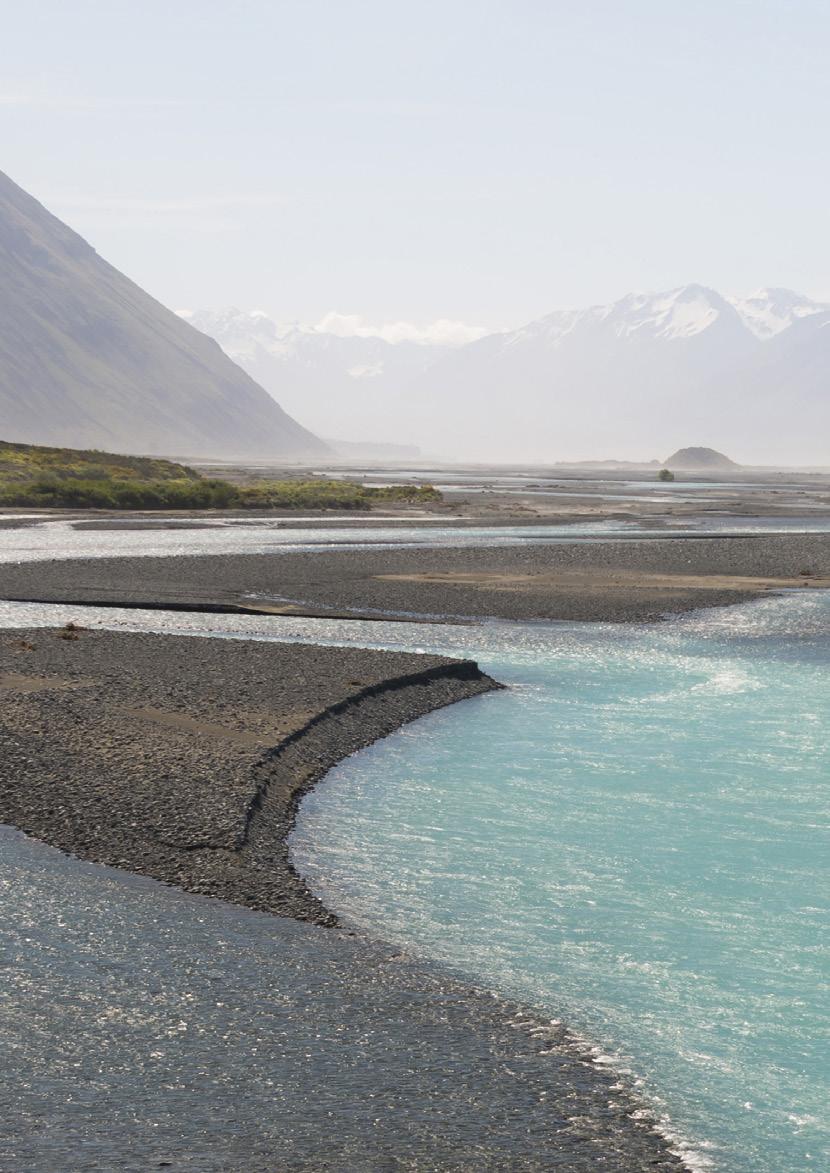
7 INTRODUCTION New Zealand spans latitudes 34 to 47 degrees south, and so lies within the Southern Hemisphere temperate zone. In this zone, westerly winds at all levels of the atmosphere move weather systems, which may also be either decaying or developing, eastwards over New Zealand giving great variability to its weather. These prevailing westerlies sometimes abate, and air from either tropical or polar regions may reach New Zealand with heavy rainfalls or cold showery conditions, respectively. The main divide of the Southern Alps acts as a barrier to the prevailing westerlies and has a profound effect on the climate of Canterbury, separating New Zealand s wettest region (the West Coast) from considerably drier regions east of the main divide. The Canterbury region (Figure 1) is bounded in the east by the coast, and in the west by the main divide which reaches 3,724 m at the summit of Mount Cook. The coastal plain extends from Waimate to Waipara. The plains slope gently upwards to reach m in the north, but where they are broadest in mid-canterbury, the foot of the ranges lies at m. Banks Figure 1. Map of the Canterbury region, showing the places mentioned in this publication. Peninsula lies to the east of the general run of the coast, and rises to 919 m at Mt Herbert. Apart from on Banks Peninsula, the high country are large enough to influence the local climate. region s rivers drain eastwards to the The unique colour of these lakes is derived from the suspended coast. There are two types of river system, sediment (rock flour) sourced from the glaciated areas occurring which respond differently to rainfall along and near the main divide. Photo: mychillybin.co.nz/jeremy Town events. The catchments of the major rivers extends to the main divide, and the rivers typically penetrate the foothills through deep gorges. River flows gauged at the plains may be very high when there is a heavy rainfall event along the divide, even though there may be little or no rainfall recorded on the plains at the time. Other rivers rise on the eastern flanks of the foothills, and their flow regimes may differ considerably from the major rivers. Some of the glacial lakes in the western Note that all numbers given in the following tables are calculated from the normal period (a normal is an average or estimated average over a standard 30-year period), unless otherwise stated. Also note that all data for Christchurch are recorded at the airport, unless otherwise stated. 6
8 7
9 TYPICAL WEATHER SITUATIONS IN CANTERBURY Photo: mychillybin.co.nz/peter Mitchell New Zealand lies in the zone of midlatitude westerlies where a succession of depressions (lows) and subtropical anticyclones (highs) generally progress eastwards over the country. Often, a trough of low pressure separates two highs, and it usually contains a frontal system, which extends into one or more lows on the southern side of the highs. As the highs move east, New Zealand experiences a regular weather sequence, which has a period of about a week. Whilst this pattern provides the basic framework of the day-to-day weather, the succession is frequently interrupted. In anticyclonic conditions the weather in Canterbury is generally fine, but it is often cloudy in winter if winds are onshore. Approaching troughs of low pressure are commonly preceded by extensive high cloud, but significant precipitation east of the main divide is rare at the frontal passage unless it becomes slow-moving. Orographic influences on the weather in Canterbury are very strong. Westerly airflows bring rainfall and cloudiness along the main divide, but reduced rainfall and increased sunshine hours farther east. Conversely, an easterly airflow often results in rainfall and cloudiness for the east coast and plains, but reduced rainfall and increased sunshine hours farther west. Because of the orographic influence, both the pressure and airflow patterns can be strongly disturbed in Canterbury causing, for example, a lee wave depression. Easterly-quarter airflows Surface south-easterlies are very rare, except for sea breezes south of Banks Peninsula, and where the flow is channeled by valleys. Usually, there is an anticyclone to the south or east of New Zealand (Figure 2), and an inversion at about m which prevents significant convection. However, in winter the freezing level may lie below the inversion, and in the more southerly flows there are frequent light showers. Otherwise, the typical cloud is stratus with a low base and periods of drizzle. Sea fog also occurs, especially between late-spring and early-autumn. The low cloud does not penetrate inland of the foothills, and it usually clears during the day, except in winter or when there is also a sheet of upper-level cloud. Figure 2. Mean sea level pressure analysis for 1200 hrs NZST on 19 November

10 Southerly-quarter airflows These cold airflows have travelled over relatively warm sea and they are unstable. When the flow is anticyclonic, there is extensive low stratus and cumulus cloud, with frequent light showers. Cloud generally clears west of the Seaward Kaikoura Range and the eastern foothills, but it occasionally penetrates into the southern basins. With cyclonic flow (Figure 3), convection is stronger, and significant snowfalls may occur to low elevations, particularly in winter and spring. Summer convection on land is intensified by daytime heating, and heavy afternoon or early evening showers may develop. At the passage of an active cold front, the south or south-west winds may be very strong. Eventually, the flow turns to the west as a trailing ridge approaches. As this happens, Canterbury is progressively sheltered by the high ground farther south. The sheltering effect begins inland and spreads to the coast, so that showers now only form over the sea and on exposed headlands. Figure 3. Mean sea level pressure analysis for 1800 hrs NZST on 26 April West-southwesterly airflows In deep south-west flows associated with strong outbreaks of polar air, the wind is south-west over the whole region, except in some of the river gorges where winds are often channeled to north-west. The weather is mainly fine throughout Canterbury and showers only affect exposed coastal areas, mainly north of the Rakaia mouth. Showers do not penetrate far inland as these areas are sheltered by the mountains of Southland and Otago. In many cases, especially in spring and summer, southwesterlies are comparatively shallow. Such cases are often associated with minor frontal disturbances. The postfrontal air penetrates quickly north-east along the east coast, but only very slowly inland, where the winds remain northwest. However, when winds are not too strong and the flow ahead of the frontal 9
, there is strong resistance to the ascent of air over the main divide.")
11 disturbance is potentially unstable, the combination of daytime heating and frontal uplift may result in the formation of heavy convective storms. Northwesterly airflows When the undisturbed flow is light or moderate and stable (Figure 4), there is strong resistance to the ascent of air over the main divide. The flow is diverted around the northern end of the South Island, to return through Cook Strait and along the east coast of Canterbury as a north-easterly. With a strong unstable flow, there is little resistance to ascent over the main divide, and the wind is north-west throughout Canterbury. The weather is usually fine eastward of the main divide, although convection occasionally occurs towards the east coast on summer afternoons, resulting in showers from high-base cumulus. There is strong diurnal variation in wind strength, especially in winter, when a nocturnal inversion often forms over the plains. In such conditions, places above the inversion (such as the hills of Banks Peninsula) experience relatively high temperatures while considerable frosts may be present on the plains. Often the warm north-westerlies reach the ground over the inland plains but rise over the cool north-east flow nearer the east coast. As a result, there can be a considerable difference between the air temperatures observed at these locations, with coastal temperatures at least several degrees lower than those inland. Figure 4. Mean sea level pressure analysis for 0000 hours NZST on 18 September
12 11
13 CLIMATIC ELEMENTS Wind Wind direction over New Zealand in the zone directly above the earth s surface may be interpreted from a mean sea level pressure (MSLP) map, following the general principle that in the Southern Hemisphere air flows in a clockwise direction around a depression (or a low ), and in an anticlockwise direction around an anticyclone (or a high ). As such, MSLP maps can be used to indicate the general wind direction at the earth s surface. However, actual wind direction and speed at a particular locality is modified by the influence of friction and topography. Along the east coast of Canterbury the wind regime is complicated by a cool sea breeze from the easterly quarter, particularly in late-spring, summer and early-autumn. Sea breezes develop in Canterbury when synoptic-scale pressure gradients are weak (e.g. Figure 4), and are generated by air temperatures over land becoming higher than air temperatures over the sea. Figure 5 shows mean annual wind frequencies of surface wind based on hourly observations from selected Canterbury stations. Mean wind speed data (average wind speeds are taken over the 10 minute period preceding each hour) are available for a number of sites in Canterbury, and these illustrate the several different wind regimes of the region (Table 1). Mean wind speeds are highest at coastal locations such as Le Bons Bay and Kaikoura, and lowest at the sheltered inland location of Hanmer Springs. There is notable variability in mean monthly wind speeds over the course of a year in Canterbury, where wind speeds are typically highest from around mid-spring (October) to midsummer (January), and lowest from midautumn to mid-winter (April to August). This seasonality is observed across almost all of the Canterbury region, but is more pronounced at inland locations. Kaikoura is typically windier than most areas of Figure 5. Mean annual wind frequencies (%) of surface wind directions from hourly observations at selected Canterbury stations. The plot shows the directions from which the wind blows, e.g. the dominant wind direction at Christchurch Airport is from the east-north-east. 12
14 Canterbury throughout the year, with this difference in mean wind speeds more prominent during the winter months. Table 2 gives the seasonal distribution and frequency of occurrence of strong winds (defined as having a daily mean wind speed of greater than 30 km/hr). For example, of all strong winds recorded at Christchurch, 35% (seven strong wind days, on average) occur in spring. As a further example, Le Bons Bay and Rangiora share the same distribution of strong winds in autumn, with 26% of their respective annual strong winds being recorded in that season. However, Le Bons Bay has an average of 25 strong wind days in autumn, compared to just 1 in Rangiora. This highlights that although a similar seasonal distribution of strong winds may be observed between different locations in Canterbury, the actual number of strong wind days per season at those locations may be considerably different. As shown in Tables 1 and 2, spring and summer are typically the windiest seasons throughout the region. Diurnal variation in wind speed is well-marked, with highest wind speeds occurring mid-afternoon before decreasing overnight. This is because heating of the land surface is most intense during the day, and stronger winds aloft are brought down to ground level by turbulent mixing. Cooling at night generally restores a lighter wind regime. Table 3 gives average wind speeds at three-hourly intervals for selected locations, whilst Figure 6 visually highlights the typical diurnal variation of wind speed observed at two of these sites. Table 1. Mean monthly and annual wind speed (km/hr) for selected Canterbury locations, from all available data. Location Jan Feb Mar Apr May Jun Jul Aug Sep Oct Nov Dec Ann Le Bons Bay Kaikoura Lyttelton Harbour Christchurch Lake Tekapo Darfield Rangiora Pukaki Aerodrome Winchmore Fairlie Mt Cook Village Timaru Culverden Hanmer Springs Table 2. Seasonal distribution and frequency (mean number of days) of strong winds (daily mean wind speed > 30 km/hr) recorded at selected Canterbury locations, from all available data. Location Summer Autumn Winter Spring Annual Distribution Frequency Distribution Frequency Distribution Frequency Distribution Frequency Frequency Le Bons Bay 22% 21 26% 25 25% 25 27% Kaikoura 23% 9 24% 10 26% 10 27% Christchurch 28% 6 21% 4 16% 3 35% 7 20 Lake Tekapo 28% 5 15% 2 18% 3 39% 7 17 Mt Cook Village 30% 3 20% 2 15% 1 35% 4 10 Darfield 26% 2 15% 1 18% 2 41% 4 9 Timaru 24% 1 17% 1 23% 1 36% 2 5 Rangiora 16% 1 26% 1 20% 1 38% 2 5 Hanmer Springs 27% 1 10% % %
 at three-hourly intervals of the day.")
15 Mean wind speed (km/hr) Mt Cook Village Christchurch Hour of day Figure 6. Mean wind speed at selected hours of the day for Christchurch and Mt Cook Village. Table 3. Mean wind speed (km/hr) at three-hourly intervals of the day. Location Christchurch Darfield Hanmer Springs Kaikoura Lake Tekapo Le Bons Bay Mt Cook Village Rangiora Timaru Photo: mychillybin.co.nz/jeremy Town 14
.")
16 Gusty winds are relatively infrequent throughout most lowland Canterbury locations, occurring more frequently in the mountain ranges and exposed coastal locations. Christchurch experiences an average of 52 days per year with wind gusts exceeding 61 km/hr, considerably less than Kaikoura where on average 97 such days per year are recorded (Table 4). Maximum gusts recorded at different locations in Canterbury are listed in Table 5. The highest gust recorded in the region (and for all New Zealand) was 250 km/hr, occurring at Mt John (near Lake Tekapo) on 18 April 1970 ( education-and-training/schools/resources/ climate/extreme). Table 4. Mean number of days per year with gusts exceeding 61 km/hr (33 knots) and 94 km/hr (50 knots) for selected locations. Location Days with gusts >61 km/hr Days with gusts >94 km/hr Christchurch 52 2 Darfield 43 1 Hanmer Springs 36 2 Kaikoura Lake Tekapo 69 5 Mt Cook Village Mt John Rangiora Timaru 34 2 Table 5. Highest recorded wind gusts at selected Canterbury locations, from all available data. Location Gust (km/hr) Direction Date Christchurch (Airport) WNW 01/08/1975 Darfield NW 05/05/2014 Hanmer Springs NW 28/03/2001 Kaikoura WNW 01/08/1975 Lake Tekapo WNW 13/10/2006 Mt Cook Village N 21/02/2004 Mt John NW 18/4/1970 Rangiora NW 22/09/2002 Timaru WNW 01/08/1975 Photo: mychillybin.co.nz/jeremy Town 15
17 Rainfall Rainfall distribution Canterbury s median annual rainfall is shown in Figure 7, which clearly illustrates how rainfall is affected by topography and exposure to the main rain bearing airflows from the west. Rainfall is highest along the main divide which has both high elevation and western exposure. This is the result of orographic enhancement. Specifically, moisture-laden air masses passing over the Tasman Sea are forced to rise over the western ranges. As these air masses rise, they cool rapidly, causing the stored water vapour to condense, resulting in rainfall. The air masses continue eastwards, but they hold significantly less moisture once beyond the main divide. As a result, there is a marked decrease eastwards in median annual rainfall beyond the Canterbury high country. The inland basins of the MacKenzie Country are among the driest areas of New Zealand. Here, annual rainfall totals of below 500 mm are typically recorded. This is approximately ten times less than that which falls in nearby high elevation locations in the main divide. The inland basins typically aren t quite as dry as Central Otago, where annual rainfall totals below 400 mm are common. Figure 7. Canterbury median annual total rainfall, Table 6 lists monthly rainfall normals and the percentage of annual total for selected locations. Many Canterbury locations observe a maximum of rainfall in late-autumn and winter. For example, Christchurch, Kaikoura and Akaroa receive 31%, 32% and 37% of their annual rainfall during winter respectively. Methven, Timaru, Waimate and Tara Hills receive a fairly even distribution of rainfall throughout the year, with a peak in December. Akaroa observes a notable summer rainfall minimum, with just 16% of annual rainfall falling from to December to February. 16
18 Table 6. Monthly and annual rainfall normal (a; mm), and monthly distribution of annual rainfall (b; %) at selected Canterbury locations, for the period Location Jan Feb Mar Apr May Jun Jul Aug Sep Oct Nov Dec Ann a Akaroa b Arthur s Pass Ashburton Castle Hill Village Christchurch Culverden Darfield Kaikoura Lake Tekapo Methven Mt Cook Village Rangiora Tara Hills (Omarama) Timaru Waimate Waipara a b a b a b a b a b a b a b a b a b a b a b a b a b a b a b
19 Christchurch Timaru Lake Tekapo Rainfall (mm) Rainfall (mm) Rainfall (mm) Rainfall (mm) J F M A M J J A S O Kaikoura J F M A M J J A S O N D J F M A M J J A S O N D J F M A M J J A S O N D Rainfall (mm) Arthur s Pass N D J F M A M J J A S O N D Highest Monthly Total 90 Percentile Value Mean 10 Percentile Value Lowest Monthly Total Figure 8. Monthly variation of rainfall for selected Canterbury locations from all available data. The distribution of monthly rainfall is shown in Figure 8. The 10th percentile, 90th percentile, and mean rainfall values for each month are shown along with maximum and minimum recorded values for several stations. Rainfall variability is further indicated by rainfall deciles, as given in Tables 7, 8 and 9. The 10th percentile values show the accumulated rainfalls that will normally be exceeded in nine out of ten years, whilst the 90th percentile values indicate the accumulated falls that will normally be exceeded in only one year in ten. The tables include periods from one month to twelve months (annual), with each time period that is longer than one month beginning with the month stated. For example, using the table for Christchurch (Table 8), it can be seen that in the three month period beginning in January, 75 mm or more of rainfall can be expected in nine years in ten, while a total of 246 mm or more should occur, on average, in only one year in ten. Table 7. Rainfall means and deciles at monthly, 3-monthly, 6-monthly, 9-monthly and annual intervals for Arthur s Pass from all available data. Arthur s Pass Jan Feb Mar Apr May Jun Jul Aug Sep Oct Nov Dec 1 month 90th Mean th months 90th Mean th months 90th Mean th months 90th Mean th Annual 90th 5317 Mean th
20 Table 8. Rainfall means and deciles at monthly, 3-monthly, 6-monthly, 9-monthly and annual intervals for Christchurch from all available data. Christchurch Jan Feb Mar Apr May Jun Jul Aug Sep Oct Nov Dec 1 month 90th Mean th months 90th Mean th months 90th Mean th months 90th Mean th Annual 90th 839 Mean th 461 Table 9. Rainfall means and deciles at monthly, 3-monthly, 6-monthly, 9-monthly and annual intervals for Lake Tekapo from all available data. Lake Tekapo Jan Feb Mar Apr May Jun Jul Aug Sep Oct Nov Dec 1 month 90th Mean th months 90th Mean th months 90th Mean th months 90th Mean th Annual 90th 767 Mean th 425 Rainfall frequency and intensity Table 10 lists the average number of days per month with at least 0.1 mm (a rain day ) and 1 mm (a wet day ) of rain for selected locations. The number of rain and wet days recorded at a given station tends to be higher near the main divide and foothills, and lower near the east coast and in inland basins. The inland basins experience considerably fewer rain and wet days than nearby western-most locations, which is due to the rain-shadow (sheltering) created by the main divide. The seasonal variation of rain days and wet days in Kaikoura is relatively small. Therefore, the winter maximum of rainfall observed may be largely attributed to there being more heavy falls of rain, as opposed to more total days of rain when compared to other seasons. The average number of rain days each year varies from 87 days at Waipara to 171 days at Mt Cook Village. Tara Hills and Lake Tekapo exhibit the lowest number of wet days in the region, with 72 and 74 wet days recorded on average respectively, compared with 153 wet days at Mt Cook Village. 19
21 Table 10. Average monthly rain days (a; days where at least 0.1 mm rainfall is measured) and wet days (b; days where at least 1 mm rainfall is measured) at selected Canterbury locations. Location Jan Feb Mar Apr May Jun Jul Aug Sep Oct Nov Dec Ann Akaroa a b Arthur s Pass a b Ashburton a b Castle Hill a b Christchurch a b Culverden a b Darfield a b Kaikoura a b Lake Tekapo a b Methven a b Mt Cook Village a b Rangiora a b Tara Hills (Omarama) a b Timaru a b Waimate a b Waipara a b The heaviest short period rainfalls in Canterbury are recorded nearest the main divide, which often occur when persistent west/northwesterly airflows are established as a trough approaches the South Island. For remaining areas of Canterbury, heavy short period rainfalls occur with the passage of a depression over or close to the region, or in association with slow moving fronts. Eastern areas of Canterbury typically experience heaviest 12-hour to 72-hour period rainfall when a depression is centred to the east of the South Island, due to the prevalence of moistureladen easterly or south-easterly winds under such circumstances. In Table 11, maximum short period rainfalls for periods of 10 minutes to 72 hours with calculated return periods are given for Christchurch and Mt Cook Village. Also listed in this table are the maximum rainfalls expected in 2, 5, 10, 20, and 50 years. Depth-duration frequency tables for Canterbury locations are available from NIWA s High Intensity Rainfall Design System (HIRDS). HIRDS uses the indexfrequency method to calculate rainfall return periods. For more information on methods and to use the tool, see hirds.niwa.co.nz. 20
22 Table 11. Maximum recorded short period rainfalls and calculated return periods (or average recurrence intervals, ARI) from HIRDS. Location 10min 20min 30min 1hr 2hrs 6hrs 12hrs 24hrs 48hrs 72hrs Christchurch a b Jan 1968 Nov 1979 Nov 1979 Mar 1975 Mar 1975 Mar 1975 Jan 1980 Jan 1980 Jan 1980 c d Apr 1968 e f g h Mt Cook Village a b Dec 2000 Dec 2000 Dec 2000 Dec 2000 Mar 2004 Mar 2004 Apr 2009 Apr 2009 Apr 2009 Apr 2009 c d e f g h Recent extreme events in Canterbury Canterbury has experienced numerous extreme weather events, with significant damage and disruption caused by heavy rain and flooding. The events listed below are some of the most severe rainfall and flooding events to have affected the Canterbury region between 1986 and March - April 2014: March and April 2014 were remarkably wet months for eastern parts of Canterbury. Christchurch (Riccarton) endured its wettest March on record at the time (records began in 1863). Additionally, of the 200 mm (437% of the March normal) that fell during the month at Christchurch, 123 mm accumulated on one day (4 March), which was the greatest one-day March rainfall on record for the city at the time. The highest one-day rainfall total in New Zealand for the month of March 2014 was 153 mm, recorded at Lyttelton on the 4th. These records were largely as a result of heavy rain that fell on 4 and 5 March, which caused considerable flooding throughout Christchurch and surrounding areas. At least 100 homes in Woolston, Richmond, St Albans and Mairehau were inundated with water, and residents of Akaroa and Sumner were temporarily isolated by flooding. Further significant rainfall was recorded a: highest fall recorded (mm) b: month and year of occurrence c: calculated return period of a (years) d: max fall calculated with ARI 2 years (mm) e: max fall calculated with ARI 5 years (mm) f: max fall calculated with ARI 10 years (mm) g: max fall calculated with ARI 20 years (mm) h: max fall calculated with ARI 50 years (mm) during April Winchmore experienced its wettest April on record at the time, with 301 mm recorded there (599% of the April normal). In Christchurch (Riccarton), 224 mm of rain was recorded (499% of the April normal): the second-wettest April observed there on record at the time. Farther north, Kaikoura recorded 264 mm of rain in April (475% of the April normal). Christchurch (Riccarton) received a total of 424 mm of rain for the March-April 2014 period. This is more than four-times greater than the normal March- April rainfall, with the city receiving 71% of its average annual rainfall over the two-month period December 1995: Heavy rain during this period was caused by a front that stalled over the southern South Island. On the evening of 11 December, an active cold front crossed Fiordland and Southland, preceded by a long fetch of northerlies originating from the subtropics. During 12 December, this front was blocked by a large high east of New Zealand and became stationary, while a weak southerly spread into eastern parts of the South Island. Overrunning of moist warm air produced high rainfalls in eastern areas on this day. The combination of snow-melt and heavy rain in the headwaters contributed to a major flood event, and 21
23 the hydro-lakes were at abnormally high levels. A Civil Defence Emergency was declared for Hakataramea, Waimate and Omarama districts. Seventeen people were evacuated from seven houses at Hakataramea, and 35 people were evacuated from Omarama. Rivers throughout Canterbury were running high. The Waitaki River at the Waitaki Dam had a peak flow of 3,300 cumecs: the highest flow since recordings began 55 years earlier. Farther north, the main trunk railway line was washed out near Rangitata. Mount Cook Village recorded 515 mm of rain in 72-hours from 9 a.m. on 11 December to 9 a.m. on 14 December March 1986: A very intense rainstorm brought flooding to large parts of Canterbury, resulting in very high damage costs and stock losses. Two key features combined to create this extreme event. Firstly, warm and moist air originating from a tropical cyclone near the Kermadec Islands spread down onto the South Island. Secondly, a high-latitude anticyclone brought cool south-easterly air up the east coast of the South Island. Convergence between the cool and warm airmasses resulted in intense convection. The highest rainfalls of the event occurred in the Timaru district and the western foothills of Ashburton, especially near Peel Forest. A Civil Defence Declaration was in place for the entire Canterbury region. The flood damage to property, roads, railway lines, bridges, crops and livestock throughout South Canterbury was extensive, and estimated to cost $60,000,000 (1986 dollars). Other damage costs included another $6,170,000 (1986 dollars) to river control works such as embankments and plantings. Geraldine recorded 102 mm of rain in the 24-hours from 9 a.m. on 12 March to 9 a.m. the following day, and reported its worst flood since Rangiora recorded 86 mm of rain in the three hours from 1 a.m. to 4 a.m. on 13 March, and Timaru recorded 100 mm of rain in the 48-hours to 9 a.m. on 13 March. Periods of low rainfall Periods of fifteen days or longer with less than 1mm of rain on any day are referred to as dry spells. Dry spells are quite common in most areas of Canterbury, however they occur relatively infrequently in the western-most parts of the region. Dry spells throughout Canterbury typically occur when a persistent (blocking) anticyclone becomes established over the South Island. Additionally, the western ranges provide a great deal of sheltering for eastern areas, such that dry spell conditions can occur in westerly and north-westerly airstreams. Table 12 outlines the dry spell frequency and duration for selected Canterbury locations. On average, a dry spell occurs once every four months in Christchurch, and once every fourteen months in Arthur s Pass. To date, the longest dry spell is 49 days, recorded in Lake Tekapo on three separate occasions. Table 13 shows the seasonal distribution of dry spells at selected Canterbury locations. Dry spell occurrence is fairly evenly distributed throughout the year in Lake Tekapo. In contrast, dry spell occurrence is notably infrequent during spring in Arthur s Pass, reflecting the high frequency of westerly airflows in that season. Table 12. Average dry spell (at least 15 consecutive days with less than 1 mm rainfall per day) frequency and duration for selected Canterbury locations, from all available data. Location Frequency Mean duration (days) Max duration (days) Max duration date Arthur s Pass One every 14 months /5/1922 to 23/6/1922 Christchurch One every 4 months /8/1911 to 14/9/1911 Lake Tekapo One every 3 months /2/1930 to 7/4/ /9/1937 to 17/11/ /2/1976 to 29/3/1976 Table 13. Seasonal distribution (%) of dry spells at selected Canterbury locations, from all available data. Location Summer Autumn Winter Spring Arthur s Pass 28% 32% 33% 7% Christchurch 27% 27% 19% 27% Lake Tekapo 27% 27% 24% 22% 22


24 Temperature Sea surface temperature Monthly mean sea surface temperatures (SST) off the east coast of Canterbury are compared with mean air temperature for Christchurch and Lake Tekapo in Figure 9. There is a lag in the increase of sea surface temperatures when compared to air temperatures from July to September. This may be at least in part attributed to the greater heat capacity of the sea compared to land, which results in the sea surface temperatures taking longer to increase and decrease in response to changing seasons compared to landbased areas. Christchurch records considerably higher mean air temperatures in winter compared to the inland location of Lake Tekapo. This may be partly attributed to the moderating influence of the sea on overnight minimum temperatures near the coast. Figure 10 shows the mean sea surface temperatures for the New Zealand region for February and August, which are the warmest and coolest months with respect to sea surface temperatures. Temperature ( C) Jan Feb Mar Apr May Jun Jul Aug Sep Oct Nov Dec Month Christchurch air temp Lake Tekapo air temp Sea surface temp Figure 9. Mean monthly air temperature (Christchurch and Lake Tekapo) and estimated sea surface temperatures (off the east coast of Canterbury). A) MEAN FEBRUARY SST ( C) B) MEAN AUGUST SST ( C) Figure 10. Monthly mean sea surface temperatures ( C) for: a) February; b) August. Source: NIWA SST Archive, Uddstrom and Oien (1999). Air temperature Canterbury typically observes afternoon temperatures reaching between 20 C and 23 C in summer, and overnight temperatures falling to between -2 C and 4 C in winter (Figure 11). Similar daily maximum temperatures are recorded throughout Canterbury, with the notable exception of high elevation hills and mountains where temperatures become increasingly lower as elevation increases. In winter, daily minimum temperatures become lower as distance from the 23
 average daily maximum temperature; Right: Canterbury median winter (June, July and August) average daily minimum temperature, 1981 2010.")
25 Figure 11. Left: Canterbury median summer (December, January and February) average daily maximum temperature; Right: Canterbury median winter (June, July and August) average daily minimum temperature, east coast and elevation increases. Figure 12 shows the median annual average temperature in the Canterbury region, and clearly demonstrates that lower temperatures are recorded at higher elevation locations. Locations near the coast and on the plains have a median annual temperature of between 11 C and 13 C. Median annual temperatures are between 10 C and 11 C nearer the foothills, and between 8 C and 10 C in the inland basins. Median annual temperatures of below 2 C occur along the main divide especially around Mt Cook, which contributes to the perennial snow and glaciers at high elevations in those areas. Figure 13 gives the monthly temperature regime (highest recorded, mean monthly maximum, mean daily maximum, mean, mean daily minimum, mean monthly minimum, and lowest recorded) for selected locations in Canterbury. Figure 12. Canterbury median annual average temperature,
26 Christchurch Hanmer Springs Kaikoura Temperature ( o C) Temperature ( o C) Temperature ( o C) J F M A M J J A S O N D J F M A M J J A S O N D J F M A M J J A S O N D Temperature ( o C) Lake Tekapo Timaru Temperature ( o C) J F M A M J J A S O N D J F M A M J J A S O N D Highest Recorded Mean Monthly Maximum Mean Daily Maximum Mean Mean Daily Minimum Mean Monthly Minimum Lowest Recorded Figure 13. Monthly variation in air temperatures for selected Canterbury locations from all available data. Table 14 shows that the average daily temperature range, i.e. the difference between the daily maximum and minimum temperature, is typically smaller at the coast (e.g. Kaikoura) than in inland areas (e.g. Hanmer Springs). This is the case for most of the year, however the difference is most prominent from January to April. The average daily temperature range in Lake Tekapo isn t as pronounced as may be expected given its inland location. This is because the town is located at a relatively high elevation (the local climate station is 762 metres above sea level), which constrains the daily maximum air temperatures, particularly during the summer months. Table 14. Average daily temperature range (Tmax Tmin, C) for selected Canterbury locations. Location Jan Feb Mar Apr May Jun Jul Aug Sep Oct Nov Dec Ann Christchurch Hanmer Springs Kaikoura Lake Tekapo Timaru Table 15. Median hourly mean air temperatures for January and July at Christchurch and Lake Tekapo January July Christchurch Lake Tekapo January July January July January July
27 Table 15 and Figure 14 further highlight the diurnal temperature range, showing the median hourly mean air temperature for January and July at Christchurch and Lake Tekapo. Air temperatures at Lake Tekapo remain lower than Christchurch at all hours of the day in July, but become higher from 3 p.m. to 8 p.m. in January. Note that hourly mean air temperature at a given time is calculated as the mean of many air temperature observations recorded over the previous hour. As such, both the daily maximum and minimum air temperatures calculated from hourly values are dampened, resulting in a reduced diurnal temperature range (Table 15) compared to the absolute daily temperature range (Table 14) recorded at Christchurch and Lake Tekapo. Maximum air temperatures in excess of 25 C occur relatively frequently throughout the plains, particularly in Darfield, where an annual average of 45 such days occur (Table 16). Furthermore, locations on the plains reach maximum air temperatures in excess of 30 C relatively frequently when compared to remaining parts of New Zealand. Inland parts of Temperature ( C) Christchurch (January) Christchurch (July) Time (hours) Lake Tekapo (January) Lake Tekapo (July) Figure 14. Median hourly mean air temperatures at Christchurch and Lake Tekapo in January and July. Canterbury record considerably more days with a minimum temperature below 0 C compared to locations closer to the coast. Indeed, the inland basins of Canterbury frequently observe New Zealand s lowest daily minimum temperature during winter. The highest air temperature recorded in Canterbury to date is 42.4 C at Rangiora on 7 February This temperature is additionally the highest recorded in New Zealand, and occurred on the last day of an extremely hot spell in Rangiora between 31 January and 7 February During these eight days, the average daily maximum temperature was 32.1 C, with the temperature reaching at least 32.5 C on five out of the eight days. Tara Hills (Omarama) recorded the lowest air temperature in Canterbury; C on 24 June Table 16. Highest and lowest recorded air temperatures, average number of days per year where maximum air temperature exceeds 30 C and 25 C, and average number of days per year where the minimum air temperature falls below 0 C, for selected Canterbury locations from all available data. Location Highest recorded ( C) Annual days max temp > 30 C Annual days max temp > 25 C Lowest recorded ( C) Annual days min temp < 0 C Akaroa Arthur s Pass Ashburton Christchurch Culverden Darfield Kaikoura Lake Tekapo Mount Cook Village Rangiora Tara Hills (Omarama) Timaru Waimate Waipara
28 Earth temperatures Earth (soil) temperatures are measured once daily at 9 a.m. at several Canterbury locations. Earth temperatures are measured at varying depths and are important for determining the growth and development of plants. Different plants have different rooting depths and as such, earth temperatures are routinely monitored at 10, 20, 30, 50, and 100 cm depths. Table 17 lists mean monthly earth temperatures for a number of standard depths. At the coastal Christchurch location, higher winter earth temperatures are observed when compared to the inland location of Tara Hills. Figure 15 shows how earth temperatures change throughout the year at Christchurch, compared with mean air temperature. The 10 cm earth temperatures are lower than the mean air temperature except during summer. The annual earth temperature cycle at 100 cm depth is more dampened and lagged than at shallower depths. As a result, earth temperatures at 100 cm remain above mean air temperature in June and July, but fall slightly below mean air temperatures during spring, before returning to higher temperatures than the mean air temperature in summer. Diurnal variation of earth temperatures (not shown) decreases with increasing depth, such that earth temperatures may show little-to-no diurnal variation at 100 cm depth. Frosts Frost is a local phenomenon and both its frequency of occurrence and intensity can vary widely over small areas. Frosts occur most frequently in winter during periods of anticyclonic conditions, primarily for two reasons. Firstly, clear skies associated with anticyclones enhance the rate of radiative cooling during the night. Secondly, anticyclones are associated with light winds, which reduces the amount of turbulent mixing of air. Cold air is relatively dense, so when there is a lack of turbulent mixing it tends to sink towards the earth surface. Therefore, areas most likely to experience frost are flat areas, where relatively cold air is not able to drain away on calm nights, and in valleys and basins, where relatively cold air pools after descending from higher elevation areas nearby. Under such conditions, temperature inversions (where the air temperature increases with elevation) are common. Table 17. Monthly and annual mean 9 a.m. earth temperatures ( C) at varying depths from the ground surface for selected Canterbury locations. Location Jan Feb Mar Apr May Jun Jul Aug Sep Oct Nov Dec Ann Christchurch 10 cm cm cm cm Rangiora 10 cm cm cm cm Tara Hills (Omarama) 10 cm cm cm cm cm
29 There are two types of frost recorded. Air frosts occur when air temperature measured by a thermometer in a screen 1.3 m above the ground falls below 0 C. Ground frosts are recorded when the air temperature 2.5 cm above a closely cut grass surface falls to -1.0 C or lower. Both types of frost are common in Canterbury in the cooler months. Table 18 lists for selected locations the mean daily grass minimum and extreme grass minimum temperatures, and the average number of days each month with ground and air frosts. Ground frosts occur more frequently than air frosts, and air frosts occur most frequently at the inland location of Lake Tekapo. Hoar frost is another form of frost which occurs infrequently, and its occurrence in Canterbury is typically limited to the inland basins. Hoar frost occurs when water vapour in the air contacts features at the Earth s surface (e.g. tree leaves, branches, fences) that are below 0 C. The water vapour condenses and freezes upon contact, enabling ice crystals (frost) to form on the individual features, making for a scenic phenomenon. Temperature ( C) Jan Feb Mar Apr May Jun Jul Aug Sep Oct Nov Dec Month 10 cm 100 cm Air temp Figure 15. Monthly mean 9 a.m. earth temperature at different depths from the ground surface, and monthly mean air temperature, from all available data at Christchurch. Table 18. Frost occurrence and grass minimum temperatures at selected Canterbury locations from all available data. Location Jan Feb Mar Apr May Jun Jul Aug Sep Oct Nov Dec Christchurch a b c d Darfield a b c d Lake Tekapo a b c d a: Mean daily grass minimum ( C) b: Lowest grass minimum recorded ( C) c: Mean number of ground frosts per month d: Mean number of air frosts per month 28
30 Sunshine and Solar Radiation Sunshine Sunshine hours are highest in the inland basins of Canterbury, which typically receive between 2,100 and 2,300 hours of sunshine annually (Figure 16). Lake Tekapo is frequently one of the top-5 sunniest locations in New Zealand on an annual basis. The remainder of the Canterbury region receives moderate annual sunshine hours compared to the rest of New Zealand. The notable exception is high elevation mountainous areas, where increased cloudiness reduces the annual sunshine totals experienced. Figure 17 shows the monthly mean, maximum, and minimum recorded bright sunshine hours for selected locations in Canterbury. Note that the lower sunshine hours recorded in the winter months tends to reflect the northerly declination of the sun, as opposed to signalling an increase in cloudiness during those times. Figure 16. Median annual sunshine hours for Canterbury, Christchurch Hanmer Springs Bright Sunshine (hours) Bright Sunshine (hours) J F M A M J J A S O Lake Tekapo N D J F M A M J J A S O N D Bright Sunshine (hours) Highest Recorded Mean Lowest Recorded J F M A M J J A S O N D Figure 17. Mean, highest and lowest recorded monthly bright sunshine hours for selected locations in Canterbury from all available data. 29
31 Solar radiation Solar radiation observations of greater than 10 years are available for only a few sites in Canterbury. Table 19 presents the mean daily global (i.e. direct and diffuse) solar radiation for Christchurch, Hanmer Springs and Lake Tekapo. Insolation is highest in December in Christchurch and Hanmer Springs, but peaks in January at Lake Tekapo. Insolation is at a minimum in June at all locations. Table 19. Mean daily global solar radiation (MJ/m 2 /day) for selected Canterbury locations from all available data. Location Jan Feb Mar Apr May Jun Jul Aug Sep Oct Nov Dec Ann Christchurch Hanmer Springs Lake Tekapo UV (ultra-violet) radiation The mean daily ultra violet radiation (UV) index recorded at Christchurch is compared to that recorded at Leigh (a site north of Auckland) in Figure 18. Christchurch records lower UV levels than Leigh throughout the year due to its relatively southern location. Both sites record significantly higher UV levels in summer than in winter, with maximum UV levels recorded in January and minimum UV levels recorded in June. Figure 19 shows an example of a UV forecast for Christchurch, indicating the UV levels and times of the day when sun protection is required. UV Index Christchurch Leigh (Auckland) Jan Feb Mar Apr May Jun Jul Aug Sep Oct Nov Dec Month Figure 18. Mean daily maximum UV index for each month at Christchurch and Leigh. Figure 19. UV Index forecast for Christchurch, January and July. Source: online-services/uv-and-ozone. 30

32 Other elements Snow Snowfalls occur quite frequently in Canterbury relative to other parts of New Zealand. Table 20 shows the average number of days each year that snowfall occurs at selected Canterbury locations. Snow doesn t tend to settle for longer than a day or two at a time, except after particularly heavy snowfall events or in higher elevation inland locations. The exception is Canterbury s extensive mountainous terrain, where seasonal snowfields typically begin to accumulate in late autumn, and persist through to early summer. Heavy and frequent snowfalls occur in the westernmost mountains of Canterbury which contributes to the perennial snow and glaciers at high elevations in those areas. A single winter storm cycle can deposit 2-3 m of snow in the Fiordland mountains farther south (Conway et al., 2000), and it is likely that similar totals would be recorded along and near the main divide in Canterbury. The alpine passes over Porters Pass, Arthur s Pass and Lewis Pass are often subject to snowfall in winter, requiring the use of chains by motorists and forcing closure of those roads from time to time. Snow has an important role to play for the economy of the Canterbury region. Commercial skifields and heli-ski companies operate throughout the region, attracting thousands of visitors each winter. Table 20. Average number of days each year with snow, thunder, hail and fog recorded at selected Canterbury locations, from all available data. The elevation of each station above mean sea level is also shown. Location Snow Thunder Fog Hail Christchurch Airport (37 m) Darfield (195 m) Kaikoura (108 m) Lake Tekapo (762 m) Mount Cook Village (765 m) Tara Hills, Omarama (488 m) Timaru Airport (25 m) In June 2006 a significant snow event struck throughout Canterbury. The snowstorm was a result of a rapidly deepening depression moving southeastward from the Tasman Sea across New Zealand, with a strong moist north-westerly flow preceding it and a very cold southerly airflow behind. Notably, the depression s central pressure fell by 20 hpa in the 24-hours between midnight 10 June and midnight 11 June. Snow fell in Canterbury overnight on 11 June and lay for about two weeks across the plains. The weight of snow and ice destroyed more than 500 power poles around the region, cutting power to 35,000 homes and businesses. On 21 June, 800 mid- and south- Canterbury homes went into their 10th day without power. Between 30 and 60 cm of snow accumulated over much of the plains, with approximately 40 cm recorded in Ashburton, 30 cm in Timaru and 15 cm in Christchurch. The insurance cost of the June snow in the South Island was $43.91 million (in 2006 dollars), making it the third-most expensive single weather event in New Zealand at that time. 31
33 Thunderstorms Thunder occurs relatively infrequently in Canterbury compared to other regions of New Zealand, with three or fewer days of occurrence per year in Christchurch, Darfield and Timaru (Table 20.) However, thunder occurs more frequently in the west of the region, with Mount Cook Village recording thunder on nine days per year, on average. Due to the localised nature of thunderstorm occurrence, it is possible that not all thunderstorms are detected at each station. Thunderstorms in Canterbury are associated with bouts of high intensity rainfall, lightning, hail, and wind squalls which sometimes cause considerable localised flooding and damage to vegetation and buildings. Hail Table 20 gives the average number of days per year on which hail is reported at selected locations. Hail occurs most often at Christchurch and Kaikoura compared with the other locations shown. As with thunder, hail can be a localised event, meaning some falls may escape detection at some stations. Severe hailstorms may be classified as those which cause damage and/or have hailstones of at least 0.5 cm in diameter. One such severe hailstorm occurred in Ashburton late in the afternoon on 17 November The hail stones were larger than 2.5 cm in diameter, with some reportedly as large as golf balls. The hail smashed glasshouses, skylights and windows, ruined gardens, damaged street lights and shop signs and created hazardous driving conditions. Hundreds of cars were damaged, and local orchardists had their crops decimated. Ashburton Airport recorded 13.6 mm of rainfall in the hour between 4 p.m. and 5 p.m. Fog The most common type of fog in the Canterbury basins is radiation fog, formed when the air cools to its dewpoint on clear nights, allowing the water vapour in the air to condense. Near the coast, advection fog can occur, where sea fog spreads onto the land as evening cooling proceeds. The average number of days per year with fog for selected locations in Canterbury is listed in Table 20. The frequency of fog varies widely over the Canterbury region, ranging from an average of nine days with fog per year at Lake Tekapo to an average of 49 days per year at Christchurch Airport. Although fog can occur at any time of the year in Canterbury, it is recorded most frequently during lateautumn and winter. For example, of the annual average of 49 days with fog at Christchurch Airport, 24 days (49%) are recorded between May and August. Similarly at Tara Hills, of the annual average of 22 days with fog there, 11 days (50%) are recorded between these same months. 32

34
35 DERIVED CLIMATOLOGICAL PARAMETERS Apart from elements such as temperature and rainfall which can be measured directly, it has been found that parameters calculated from several elements have some important uses, especially in industry. Parameters which define the overall suitability of the climate for agriculture, horticulture, architectural and structural designs, and contracting, etc., are vapour pressure, relative humidity, evapotranspiration (leading to soil water balance), degree-days (thermal time), and rainfall extremes. Some of these and their uses are discussed in the following paragraphs. Note that short-duration high intensity rainfalls have already been addressed in this publication. Vapour pressure and relative humidity Vapour pressure and relative humidity are the two parameters most frequently used to indicate moisture levels in the atmosphere. Both are calculated from simultaneous dry and wet bulb thermometer readings, although a hygrograph may be used to obtain continuous humidity readings. Vapour pressure is the part of the total atmospheric pressure that results from the presence of water vapour in the atmosphere. It varies greatly with air masses from different sources, being greatest in warm air masses that have tropical origins and lowest in cold, polar-derived air masses. Vapour pressure can be important in determining the physiological response of organisms to the environment (very dry air, especially if there is a pre-existing soil moisture deficit, can cause or increase wilting in plants). Mean monthly 9 a.m. vapour pressures for several locations are given in Table 21, which shows that vapour pressures are lowest in the winter months. Relative humidity relates the amount of water present in the atmosphere to the amount of water necessary to saturate the atmosphere. Unlike vapour pressure, relative humidity is dependent on the air temperature. This is because as air temperature increases, the capacity of the atmosphere to hold water also increases. Therefore, relative humidity often displays large diurnal variation. Table 22 highlights this diurnal variation, showing 9 a.m. relative humidity is higher than that recorded at 3 p.m. at corresponding times of the year. Highest relative humidity is experienced in the winter months due to lower air temperatures. Table 21. Mean monthly and annual 9 a.m. vapour pressure (hpa) at selected Canterbury locations from all available data. Location Jan Feb Mar Apr May Jun Jul Aug Sep Oct Nov Dec Ann Arthur s Pass Christchurch Darfield Kaikoura Lake Tekapo Timaru Table 22. Mean monthly and annual 9 a.m. (a) and 3 p.m. (b) relative humidity (%) at selected Canterbury locations. Location Jan Feb Mar Apr May Jun Jul Aug Sep Oct Nov Dec Ann Arthur s Pass a b Photo: mychillybin.co.nz/mark Meredith Christchurch Darfield Kaikoura Lake Tekapo Timaru a b a b a b a b a b
36 Evapotranspiration and soil water balance Evapotranspiration is the process where water held in the soil is gradually released to the atmosphere through a combination of direct evaporation and transpiration from plants. A water balance can be calculated by using daily rainfalls and by assuming that the soil can hold a fixed amount of water with actual evapotranspiration continuing at the potential rate until total moisture depletion of the soil occurs. The calculation of water balance begins after a long dry spell when it is known that all available soil moisture is depleted or after a period of very heavy rainfall when the soil is at field capacity. Daily calculations are then made of moisture lost through evapotranspiration or replaced through precipitation. If the available soil water becomes insufficient to maintain evapotranspiration then a soil moisture deficit occurs and irrigation becomes necessary to maintain plant growth. Runoff occurs when the rainfall exceeds the field capacity (assumed to be 150 mm for most New Zealand soils). Mean monthly and annual water balance values for a number of locations in Canterbury are given in Table 23. Soil moisture deficit peaks in summer throughout Canterbury, with highest soil moisture deficit observed in Christchurch and Tara Hills, whereas runoff peaks in the winter months. Compared to the remainder of New Zealand, mean soil moisture deficit observed throughout the year in Christchurch and Tara Hills is relatively high. Figure 20 shows regionwide variability in days of soil moisture deficit per year, which further illustrates the dryness of Christchurch, Tara Hills, and the east coast north of Kaikoura compared to other areas of Canterbury. Figure 20. Median annual days of wilting point deficit for Canterbury, Potential evapotranspiration (PET) has been calculated for Christchurch, Hanmer Springs and Tara Hills using the Penman method (Penman, 1948). The monthly mean, minimum, and maximum PET values for these locations are listed in Table
37 Table 23. Mean monthly and annual water balance summary for a soil moisture capacity of 150 mm at selected Canterbury locations. Location Jan Feb Mar Apr May Jun Jul Aug Sep Oct Nov Dec Ann Christchurch DE ND RO NR Hanmer Springs DE ND RO NR Methven DE ND RO NR Tara Hills (Omarama) DE ND RO NR Timaru DE ND RO NR DE: average amount of soil moisture deficit (mm) ND: average number of days on which a soil moisture deficit occurs RO: average amount of runoff (mm) NR: average number of days on which runoff occurs Table 24. Penman calculated maximum, mean, and minimum monthly potential evapotranspiration (mm), and mean annual total potential evapotranspiration, for selected Canterbury locations. Location Jan Feb Mar Apr May Jun Jul Aug Sep Oct Nov Dec Ann Christchurch Max Mean Min Hanmer Springs Max Mean Min Tara Hills (Omarama) Max Mean Min Degree-day totals The departure of mean daily temperature above a base temperature which has been found to be critical to the growth or development of a particular plant is a measure of the plant s development on that day. The sum of these departures then relates to the maturity or harvestable state of the crop. Thus, as the plant grows, updated estimates of harvest time can be made. These estimates have been found to be very valuable for a variety of crops with different base temperatures. Degree-day totals indicate the overall effects of temperature for a specified period, and can be applied to agricultural and horticultural production. Growing degree-days express the sum of daily temperatures above a selected base temperature 36
38 that represent a threshold of plant growth. Table 25 lists the mean monthly growing degree-day totals above base temperatures of 5 C and 10 C for locations in Canterbury. Cooling and heating degree days are measurements that reflect the amount of energy that is required to cool or heat buildings to a comfortable base temperature, which in this case is 18 C. Table 26 shows that the number of cooling degree days reaches a peak in mid-late summer in Canterbury, when energy required to cool building interiors to 18 C is highest. Conversely, heating degree days reach a peak in winter, when the energy required to heat buildings to 18 C is highest. Figure 21 shows region-wide variability in the number of heating degree days per year. The number of heating degree days tends to be lower in low elevation coastal areas, compared with areas further inland and at higher elevations. Table 25. Average growing degree-day totals above base 5 C and 10 C for selected Canterbury locations. Location Jan Feb Mar Apr May Jun Jul Aug Sep Oct Nov Dec Ann Arthur s Pass 5 C C Christchurch 5 C C Darfield 5 C C Kaikoura 5 C C Lake Tekapo 5 C C Timaru 5 C C Table 26. Average cooling (CDD) and heating (HDD) degree-day totals with base 18 C for selected Canterbury locations. Location Jan Feb Mar Apr May Jun Jul Aug Sep Oct Nov Dec Ann Arthur s Pass CDD HDD Christchurch CDD HDD Darfield CDD HDD Kaikoura CDD HDD Lake Tekapo CDD HDD Timaru CDD HDD

39 Figure 21. Median annual heating degree days for Canterbury, Photo: mychillybin.co.nz/thomas Neubauer 38

40 Photo: mychillybin.co.nz/mark Meredith 39
41 40
NEW ZEALAND WEATHER. BRIEF REVIEW OF THE WEATHER WINTER 1991 (Fig. 1) CONTRASTING RAINFALL, COLD IN THE SOUTH-WEST OF THE SOUTH ISLAND
 CONTRASTING RAINFALL, COLD IN THE SOUTH-WEST OF THE SOUTH ISLAND") Weather and Climate (1992) 12: 47-52 47 NEW ZEALAND WEATHER BRIEF REVIEW OF THE WEATHER (Fig. 1) CONTRASTING RAINFALL, COLD IN THE SOUTH-WEST OF THE SOUTH ISLAND An El Nino event (negative phase of the
Weather and Climate (1992) 12: 47-52 47 NEW ZEALAND WEATHER BRIEF REVIEW OF THE WEATHER (Fig. 1) CONTRASTING RAINFALL, COLD IN THE SOUTH-WEST OF THE SOUTH ISLAND An El Nino event (negative phase of the
National Meteorological Library and Archive
 National Meteorological Library and Archive Fact sheet No. 4 Climate of the United Kingdom Causes of the weather in the United Kingdom The United Kingdom lies in the latitude of predominately westerly
8.1 Attachment 1: Ambient Weather Conditions at Jervoise Bay, Cockburn Sound
 8.1 Attachment 1: Ambient Weather Conditions at Jervoise Bay, Cockburn Sound Cockburn Sound is 20km south of the Perth-Fremantle area and has two features that are unique along Perth s metropolitan coast
NEW ZEALAND WEATHER. BRIEF REVIEW OF WINTER AND SPRING 1990 WINTER 1990 (Fig. 1) Weather and Climate (1991) 11: 31-36
 Weather and Climate (1991) 11: 31-36") Weather and Climate (1991) 11: 31-36 31 NEW ZEALAND WEATHER BRIEF REVIEW OF WINTER AND SPRING 1990 WINTER 1990 (Fig. 1) Winter 1990 was very dry in the far south. Northeasterlies brought sunny conditions
Weather and Climate (1991) 11: 31-36 31 NEW ZEALAND WEATHER BRIEF REVIEW OF WINTER AND SPRING 1990 WINTER 1990 (Fig. 1) Winter 1990 was very dry in the far south. Northeasterlies brought sunny conditions
Summary report for Ruamāhanga Whaitua Committee The climate of the Ruamāhanga catchment
 Summary report for Ruamāhanga Whaitua Committee The climate of the Ruamāhanga catchment The Tararua and Rimutaka ranges have a large influence on the climate of the Ruamāhanga catchment. The ranges shelter
National Meteorological Library and Archive
 National Meteorological Library and Archive Fact sheet No. 4 Climate of the United Kingdom Causes of the weather in the United Kingdom The United Kingdom lies in the latitude of predominately westerly
NEW ZEALAND WEATHER. BRIEF REVIEW OF THE WEATHER WINTER 1988 (Fig. 1)
") Weather and Climate (1989) 9: 29-36 29 NEW ZEALAND WEATHER BRIEF REVIEW OF THE WEATHER WINTER 1988 (Fig. 1) Rainfall for winter was above normal in central highcountry regions of the North Island, Wanganui,
Weather and Climate (1989) 9: 29-36 29 NEW ZEALAND WEATHER BRIEF REVIEW OF THE WEATHER WINTER 1988 (Fig. 1) Rainfall for winter was above normal in central highcountry regions of the North Island, Wanganui,
Champaign-Urbana 1999 Annual Weather Summary
 Champaign-Urbana 1999 Annual Weather Summary ILLINOIS STATE WATER SURVEY 2204 Griffith Dr. Champaign, IL 61820 wxobsrvr@sws.uiuc.edu Maria Peters, Weather Observer A major snowstorm kicked off the new
Champaign-Urbana 1998 Annual Weather Summary
 Champaign-Urbana 1998 Annual Weather Summary ILLINOIS STATE WATER SURVEY Audrey Bryan, Weather Observer 2204 Griffith Dr. Champaign, IL 61820 wxobsrvr@sparc.sws.uiuc.edu The development of the El Nìno
Fort Lewis, Washington (47 05'N, 'W)
") Fort Lewis, Washington (47 05'N, 122 35'W) Full Year Climatology CONVENTIONS: The spelling of place names and geographical features are those used by the National Imagery and Mapping Agency (NIMA). All
Fort Lewis, Washington (47 05'N, 122 35'W) Full Year Climatology CONVENTIONS: The spelling of place names and geographical features are those used by the National Imagery and Mapping Agency (NIMA). All
The Climate of Payne County
 The Climate of Payne County Payne County is part of the Central Great Plains in the west, encompassing some of the best agricultural land in Oklahoma. Payne County is also part of the Crosstimbers in the
Weather and Climate of the Rogue Valley By Gregory V. Jones, Ph.D., Southern Oregon University
 Weather and Climate of the Rogue Valley By Gregory V. Jones, Ph.D., Southern Oregon University The Rogue Valley region is one of many intermountain valley areas along the west coast of the United States.
NEW ZEALAND WEATHER. BRIEF REVIEW OF THE WEATHER WINTER 1989 (Fig. 1) MONTHLY HIGHLIGHTS JUNE-AUGUST Weather and Climate (1990) 10: 27-31
 MONTHLY HIGHLIGHTS JUNE-AUGUST Weather and Climate (1990) 10: 27-31") Weather and Climate (1990) 10: 27-31 27 NEW ZEALAND WEATHER BRIEF REVIEW OF THE WEATHER (Fig. 1) WARMER THAN USUAL This was the third warmer than normal winter in a row, but not as warm as those of 1987
Weather and Climate (1990) 10: 27-31 27 NEW ZEALAND WEATHER BRIEF REVIEW OF THE WEATHER (Fig. 1) WARMER THAN USUAL This was the third warmer than normal winter in a row, but not as warm as those of 1987
Percentage of normal rainfall for August 2017 Departure from average air temperature for August 2017
 New Zealand Climate Update No 219, August 2017 Current climate August 2017 Overall, mean sea level pressure was lower than normal over and to the west of New Zealand during August while higher than normal
The Climate of Grady County
 The Climate of Grady County Grady County is part of the Central Great Plains, encompassing some of the best agricultural land in Oklahoma. Average annual precipitation ranges from about 33 inches in northern
Monthly Long Range Weather Commentary Issued: APRIL 18, 2017 Steven A. Root, CCM, Chief Analytics Officer, Sr. VP,
 Monthly Long Range Weather Commentary Issued: APRIL 18, 2017 Steven A. Root, CCM, Chief Analytics Officer, Sr. VP, sroot@weatherbank.com MARCH 2017 Climate Highlights The Month in Review The average contiguous
SEPTEMBER 2013 REVIEW
 Monthly Long Range Weather Commentary Issued: October 21, 2013 Steven A. Root, CCM, President/CEO sroot@weatherbank.com SEPTEMBER 2013 REVIEW Climate Highlights The Month in Review The average temperature
ESCI 344 Tropical Meteorology Lesson 7 Temperature, Clouds, and Rain
 ESCI 344 Tropical Meteorology Lesson 7 Temperature, Clouds, and Rain References: Forecaster s Guide to Tropical Meteorology (updated), Ramage Tropical Climatology, McGregor and Nieuwolt Climate and Weather
CATCHMENT DESCRIPTION. Little River Catchment Management Plan Stage I Report Climate 4.0
 CATCHMENT DESCRIPTION Little River Catchment Management Plan Stage I Report Climate 4. Little River Catchment Management Plan Stage I Report Climate 4.1 4. CLIMATE 4.1 INTRODUCTION Climate is one of the
The Climate of Marshall County
 The Climate of Marshall County Marshall County is part of the Crosstimbers. This region is a transition region from the Central Great Plains to the more irregular terrain of southeastern Oklahoma. Average
The Climate of Bryan County
 The Climate of Bryan County Bryan County is part of the Crosstimbers throughout most of the county. The extreme eastern portions of Bryan County are part of the Cypress Swamp and Forest. Average annual
The weather in Iceland 2012
 The Icelandic Meteorological Office Climate summary 2012 published 9.1.2013 The weather in Iceland 2012 Climate summary Sunset in Reykjavík 24th April 2012 at 21:42. View towards west from the balcony
The Climate of Haskell County
 The Climate of Haskell County Haskell County is part of the Hardwood Forest. The Hardwood Forest is characterized by its irregular landscape and the largest lake in Oklahoma, Lake Eufaula. Average annual
The Climate of Murray County
 The Climate of Murray County Murray County is part of the Crosstimbers. This region is a transition between prairies and the mountains of southeastern Oklahoma. Average annual precipitation ranges from
The Climate of Texas County
 The Climate of Texas County Texas County is part of the Western High Plains in the north and west and the Southwestern Tablelands in the east. The Western High Plains are characterized by abundant cropland
The Climate of Kiowa County
 The Climate of Kiowa County Kiowa County is part of the Central Great Plains, encompassing some of the best agricultural land in Oklahoma. Average annual precipitation ranges from about 24 inches in northwestern
UPDATE OF REGIONAL WEATHER AND SMOKE HAZE (December 2017)
") UPDATE OF REGIONAL WEATHER AND SMOKE HAZE (December 2017) 1. Review of Regional Weather Conditions for November 2017 1.1 In November 2017, Southeast Asia experienced inter-monsoon conditions in the first
UPDATE OF REGIONAL WEATHER AND SMOKE HAZE (December 2017) 1. Review of Regional Weather Conditions for November 2017 1.1 In November 2017, Southeast Asia experienced inter-monsoon conditions in the first
The Climate of Pontotoc County
 The Climate of Pontotoc County Pontotoc County is part of the Crosstimbers. This region is a transition region from the Central Great Plains to the more irregular terrain of southeast Oklahoma. Average
The Climate of Seminole County
 The Climate of Seminole County Seminole County is part of the Crosstimbers. This region is a transition region from the Central Great Plains to the more irregular terrain of southeastern Oklahoma. Average
Chiang Rai Province CC Threat overview AAS1109 Mekong ARCC
 Chiang Rai Province CC Threat overview AAS1109 Mekong ARCC This threat overview relies on projections of future climate change in the Mekong Basin for the period 2045-2069 compared to a baseline of 1980-2005.
Forecasting Local Weather
 Forecasting Local Weather Sea/Land Breeze Temperature Dew Fog Frost Snow Thunderstorms Tropical Cyclones Temperatures: Radiation Balance Typical Diurnal Variation of Temperature Min soon after dawn Temp
Champaign-Urbana 2001 Annual Weather Summary
 Champaign-Urbana 2001 Annual Weather Summary ILLINOIS STATE WATER SURVEY 2204 Griffith Dr. Champaign, IL 61820 wxobsrvr@sws.uiuc.edu Maria Peters, Weather Observer January: After a cold and snowy December,
AIR MASSES. Large bodies of air. SOURCE REGIONS areas where air masses originate
 Large bodies of air AIR MASSES SOURCE REGIONS areas where air masses originate Uniform in composition Light surface winds Dominated by high surface pressure The longer the air mass remains over a region,
3. HYDROMETEROLOGY. 3.1 Introduction. 3.2 Hydro-meteorological Aspect. 3.3 Rain Gauge Stations
 3. HYDROMETEROLOGY 3.1 Introduction Hydrometeorology is a branch of meteorology and hydrology that studies the transfer of water and energy between the land surface and the lower atmosphere. Detailed hydrological
Drought in Southeast Colorado
 Drought in Southeast Colorado Nolan Doesken and Roger Pielke, Sr. Colorado Climate Center Prepared by Tara Green and Odie Bliss http://climate.atmos.colostate.edu 1 Historical Perspective on Drought Tourism
The Climate of Oregon Climate Zone 4 Northern Cascades
 /05 E55 Unbound issue No. 9/ is Does not circulate Special Report 916 May 1993 The Climate of Oregon Climate Zone 4 Property of OREGON STATE UNIVERSITY Library Serials Corvallis, OR 97331-4503 Agricultural
The Weather Wire. Contents: Summer 2018 Outlook. Summer 2018 Outlook Drought Monitor May Summary/Statistics June Preview Rainfall Totals
 The Weather Wire June 2018 Volume 25 Number 6 Contents: Summer 2018 Outlook Drought Monitor May Summary/Statistics June Preview Rainfall Totals Summer 2018 Outlook June 1 st marked the first day of meteorological
Colorado s 2003 Moisture Outlook
 Colorado s 2003 Moisture Outlook Nolan Doesken and Roger Pielke, Sr. Colorado Climate Center Prepared by Tara Green and Odie Bliss http://climate.atmos.colostate.edu How we got into this drought! Fort
New Zealand Climate Update No 223, January 2018 Current climate December 2017
 New Zealand Climate Update No 223, January 2018 Current climate December 2017 December 2017 was characterised by higher than normal sea level pressure over New Zealand and the surrounding seas. This pressure
Foundations of Earth Science, 6e Lutgens, Tarbuck, & Tasa
 Foundations of Earth Science, 6e Lutgens, Tarbuck, & Tasa Weather Patterns and Severe Weather Foundations, 6e - Chapter 14 Stan Hatfield Southwestern Illinois College Air masses Characteristics Large body
Climate of Columbus. Aaron Wilson. Byrd Polar & Climate Research Center State Climate Office of Ohio.
 Climate of Columbus Aaron Wilson Byrd Polar & Climate Research Center http://bpcrc.osu.edu/greenteam Overview Historical Climatology Climate Change & Impacts Projected Changes Summary 2 Historical Climatology
What is happening to the Jamaican climate?
 What is happening to the Jamaican climate? Climate Change and Jamaica: Why worry? Climate Studies Group, Mona (CSGM) Department of Physics University of the West Indies, Mona Part 1 RAIN A FALL, BUT DUTTY
New Zealand Climate Update No 226, April 2018 Current climate March 2018
 New Zealand Climate Update No 226, April 2018 Current climate March 2018 March 2018 was characterised by significantly higher pressure than normal to the east of New Zealand. This pressure pattern, in
Local Ctimatotogical Data Summary White Hall, Illinois
 SWS Miscellaneous Publication 98-5 STATE OF ILLINOIS DEPARTMENT OF ENERGY AND NATURAL RESOURCES Local Ctimatotogical Data Summary White Hall, Illinois 1901-1990 by Audrey A. Bryan and Wayne Armstrong Illinois
L.O Students will learn about factors that influences the environment
 Name L.O Students will learn about factors that influences the environment Date 1. At the present time, glaciers occur mostly in areas of A) high latitude or high altitude B) low latitude or low altitude
Climate. Annual Temperature (Last 30 Years) January Temperature. July Temperature. Average Precipitation (Last 30 Years)
 January Temperature. July Temperature. Average Precipitation (Last 30 Years)") Climate Annual Temperature (Last 30 Years) Average Annual High Temp. (F)70, (C)21 Average Annual Low Temp. (F)43, (C)6 January Temperature Average January High Temp. (F)48, (C)9 Average January Low Temp.
Climate Annual Temperature (Last 30 Years) Average Annual High Temp. (F)70, (C)21 Average Annual Low Temp. (F)43, (C)6 January Temperature Average January High Temp. (F)48, (C)9 Average January Low Temp.
Atmosphere and Weather Revision Notes
 Atmosphere and Weather Revision Notes Atmosphere The blanket of gases that surrounds the Earth is called the atmosphere. The main gases are nitrogen (78 %), oxygen (21 %), water vapour, ozone and carbon
Weather Notes. Chapter 16, 17, & 18
 Weather Notes Chapter 16, 17, & 18 Weather Weather is the condition of the Earth s atmosphere at a particular place and time Weather It is the movement of energy through the atmosphere Energy comes from
Champaign-Urbana 2000 Annual Weather Summary
 Champaign-Urbana 2000 Annual Weather Summary ILLINOIS STATE WATER SURVEY 2204 Griffith Dr. Champaign, IL 61820 wxobsrvr@sws.uiuc.edu Maria Peters, Weather Observer January: January started on a mild note,
Unit 4 Review Guide: Weather
 Unit 4 Review Guide: Weather Weather: The condition of the atmosphere at a specific time and place. Freezing: To become hardened into ice or into a solid body Deposition: The change in state of matter
New Zealand Climate Update No 222, November 2017 Current climate November 2017
 New Zealand Climate Update No 222, November 2017 Current climate November 2017 November 2017 was characterised by higher than normal sea level pressure over New Zealand and the surrounding seas, particularly
Regional Climate Change: Current Impacts and Perspectives Greater Lake Nipissing Stewardship Council Annual Meeting Wednesday April 16, 2014
 Regional Climate Change: Current Impacts and Perspectives Greater Lake Nipissing Stewardship Council Annual Meeting Wednesday April 16, 2014 Speaker: Peter Bullock, Stantec Consulting Information Source:
2003 Moisture Outlook
 2003 Moisture Outlook Nolan Doesken and Roger Pielke, Sr. Colorado Climate Center Prepared by Tara Green and Odie Bliss http://climate.atmos.colostate.edu Through 1999 Through 1999 Fort Collins Total Water
Monthly Long Range Weather Commentary Issued: SEPTEMBER 19, 2016 Steven A. Root, CCM, Chief Analytics Officer, Sr. VP,
 Monthly Long Range Weather Commentary Issued: SEPTEMBER 19, 2016 Steven A. Root, CCM, Chief Analytics Officer, Sr. VP, sroot@weatherbank.com SEPTEMBER 2016 Climate Highlights The Month in Review The contiguous
Weather Related Factors of the Adelaide floods ; 7 th to 8 th November 2005
 Weather Related Factors of the Adelaide floods ; th to th November 2005 Extended Abstract Andrew Watson Regional Director Bureau of Meteorology, South Australian Region 1. Antecedent Weather 1.1 Rainfall
4/29/2011. Mid-latitude cyclones form along a
 Chapter 10: Cyclones: East of the Rocky Mountain Extratropical Cyclones Environment prior to the development of the Cyclone Initial Development of the Extratropical Cyclone Early Weather Along the Fronts
Monthly Long Range Weather Commentary Issued: February 15, 2015 Steven A. Root, CCM, President/CEO
 Monthly Long Range Weather Commentary Issued: February 15, 2015 Steven A. Root, CCM, President/CEO sroot@weatherbank.com JANUARY 2015 Climate Highlights The Month in Review During January, the average
Climate briefing. Wellington region, May Alex Pezza and Mike Thompson Environmental Science Department
 Climate briefing Wellington region, May 2016 Alex Pezza and Mike Thompson Environmental Science Department For more information, contact the Greater Wellington Regional Council: Wellington PO Box 11646
1 What Is Climate? TAKE A LOOK 2. Explain Why do areas near the equator tend to have high temperatures?
 CHAPTER 17 1 What Is Climate? SECTION Climate BEFORE YOU READ After you read this section, you should be able to answer these questions: What is climate? What factors affect climate? How do climates differ
16 Global Climate. Learning Goals. Summary. After studying this chapter, students should be able to:
 16 Global Climate Learning Goals After studying this chapter, students should be able to: 1. associate the world s six major vegetation biomes to climate (pp. 406 408); 2. describe methods for classifying
Storm and Storm Systems Related Vocabulary and Definitions. Magnitudes are measured differently for different hazard types:
 Storm and Storm Systems Related Vocabulary and Definitions Magnitude: this is an indication of the scale of an event, often synonymous with intensity or size. In natural systems, magnitude is also related
Transient and Eddy. Transient/Eddy Flux. Flux Components. Lecture 3: Weather/Disturbance. Transient: deviations from time mean Time Mean
 Lecture 3: Weather/Disturbance Transients and Eddies Climate Roles Mid-Latitude Cyclones Tropical Hurricanes Mid-Ocean Eddies Transient and Eddy Transient: deviations from time mean Time Mean Eddy: deviations
2015: A YEAR IN REVIEW F.S. ANSLOW
 2015: A YEAR IN REVIEW F.S. ANSLOW 1 INTRODUCTION Recently, three of the major centres for global climate monitoring determined with high confidence that 2015 was the warmest year on record, globally.
Will a warmer world change Queensland s rainfall?
 Will a warmer world change Queensland s rainfall? Nicholas P. Klingaman National Centre for Atmospheric Science-Climate Walker Institute for Climate System Research University of Reading The Walker-QCCCE
Special Climate Statement record warmth in the Tasman Sea, New Zealand and Tasmania. 27 March 2018
 Special Climate Statement record warmth in the Tasman Sea, New Zealand and Tasmania 27 March 2018 Version number/type Date of issue 1.0 27 March 2018 Unless otherwise noted, all images in this document
Monthly Long Range Weather Commentary Issued: APRIL 1, 2015 Steven A. Root, CCM, President/CEO
 Monthly Long Range Weather Commentary Issued: APRIL 1, 2015 Steven A. Root, CCM, President/CEO sroot@weatherbank.com FEBRUARY 2015 Climate Highlights The Month in Review The February contiguous U.S. temperature
National Wildland Significant Fire Potential Outlook
 National Wildland Significant Fire Potential Outlook National Interagency Fire Center Predictive Services Issued: September, 2007 Wildland Fire Outlook September through December 2007 Significant fire
Definitions Weather and Climate Climates of NYS Weather Climate 2012 Characteristics of Climate Regions of NYS NYS s Climates 1.
 Definitions Climates of NYS Prof. Anthony Grande 2012 Weather and Climate Weather the state of the atmosphere at one point in time. The elements of weather are temperature, t air pressure, wind and moisture.
Impacts of the April 2013 Mean trough over central North America
 Impacts of the April 2013 Mean trough over central North America By Richard H. Grumm National Weather Service State College, PA Abstract: The mean 500 hpa flow over North America featured a trough over
May 2016 Volume 23 Number 5
 The Weather Wire May 2016 Volume 23 Number 5 Contents: Winter Summary Current Colorado and West-wide Snow Pack Drought Monitor April Summary/Statistics May Preview Snowfall Totals Winter Summary The Front
Minnesota s Climatic Conditions, Outlook, and Impacts on Agriculture. Today. 1. The weather and climate of 2017 to date
 Minnesota s Climatic Conditions, Outlook, and Impacts on Agriculture Kenny Blumenfeld, State Climatology Office Crop Insurance Conference, Sep 13, 2017 Today 1. The weather and climate of 2017 to date
DEPARTMENT OF EARTH & CLIMATE SCIENCES Name SAN FRANCISCO STATE UNIVERSITY Nov 29, ERTH 360 Test #2 200 pts
 DEPARTMENT OF EARTH & CLIMATE SCIENCES Name SAN FRANCISCO STATE UNIVERSITY Nov 29, 2018 ERTH 360 Test #2 200 pts Each question is worth 4 points. Indicate your BEST CHOICE for each question on the Scantron
Bell Work. REVIEW: Our Planet Earth Page 29 Document A & B Questions
 9.12.16 Bell Work REVIEW: Our Planet Earth Page 29 Document A & B Questions Intro to Climate & Weather https://www.youtube.com/watch?v=vhgyoa70q7y Weather vs. Climate Video Climate & Weather 3.1 Weather
The Climate of Oregon Climate Zone 3 Southwest Interior
 .k) 105 Unbound issue " " 1 4oes not circulate C4P. Special Report 915 May 1993 The Climate of Oregon Climate Zone 3 Southwest Interior Property of OREGON STATE UNIVERSITY Library Serials Corvallis, OR
The Pennsylvania Observer
 The Pennsylvania Observer August 3, 2015 July 2015 - Pennsylvania Weather Recap By: Arthur Person Although this seventh month of 2015 was fairly normal across Pennsylvania as a whole, the details reveal
Weather is the of the Earth s atmosphere at a place and time. It is the movement of through the atmosphere o Energy comes from the
 Weather Notes Weather Weather is the of the Earth s atmosphere at a place and time It is the movement of through the atmosphere o Energy comes from the The sun is the force that weather The sun s energy
Chapter outline. Reference 12/13/2016
 Chapter 2. observation CC EST 5103 Climate Change Science Rezaul Karim Environmental Science & Technology Jessore University of science & Technology Chapter outline Temperature in the instrumental record
July 2007 Climate Summary
 Dan Bowman (765) 494-6574 Sep 3, 2007 http://www.iclimate.org Summary July 2007 Climate Summary The month of July ended as a very unusual month. Many events occurred during the month of July that is not
What a Hurricane Needs to Develop
 Weather Weather is the current atmospheric conditions, such as air temperature, wind speed, wind direction, cloud cover, precipitation, relative humidity, air pressure, etc. 8.10B: global patterns of atmospheric
NIWA Outlook: October - December 2015
 October December 2015 Issued: 1 October 2015 Hold mouse over links and press ctrl + left click to jump to the information you require: Overview Regional predictions for the next three months: Northland,
3) What is the difference between latitude and longitude and what is their affect on local and world weather and climate?
 What is the difference between latitude and longitude and what is their affect on local and world weather and climate?") www.discoveryeducation.com 1) Describe the difference between climate and weather citing an example of each. Describe how water (ocean, lake, river) has a local effect on weather and climate and provide
www.discoveryeducation.com 1) Describe the difference between climate and weather citing an example of each. Describe how water (ocean, lake, river) has a local effect on weather and climate and provide
1 What Is Climate? TAKE A LOOK 2. Explain Why do areas near the equator tend to have high temperatures?
 CHAPTER 17 1 What Is Climate? SECTION Climate BEFORE YOU READ After you read this section, you should be able to answer these questions: What is climate? What factors affect climate? How do climates differ
The Climate of Oregon Climate Zone 5 High Plateau
 105 E55 Unbound issue i". 9 13oes not circulate CZe Special Report 917 May 1993 The Climate of Oregon Climate Zone 5 Property of OREGON STATE UNIVERSITY Library Serials Corvallis, OR 97331-4503 Agricultural
New Zealand Seasonal Fire Danger Outlook 2017/18
 New Zealand Seasonal Fire Danger Outlook 2017/18 ISSUE: South Island, March 2018 Current fire danger situation & outlook: Looking back at February, it was a very unsettled month. The tropics directed New
DUST REPORT WALSHESTOWN RESTORATION LIMITED. For Site at Walshestown, Blackhall, Tipperkevin & Bawnoge, Naas, Co. Kildare
 DUST REPORT WALSHESTOWN RESTORATION LIMITED For Site at Walshestown, Blackhall, Tipperkevin & Bawnoge, Naas, Co. Kildare October 2016 BY: TÚS NUA ENVIRONMENTAL BACK GATE LODGE KILLARKIN DUNBOYNE CO. MEATH
MAURITIUS METEOROLOGICAL SERVICES
 MAURITIUS METEOROLOGICAL SERVICES CLIMATE NOVEMBER 2018 Introduction Climatologically speaking, November is a relatively dry month for Mauritius with a long term monthly mean rainfall of 78 mm. However,
THE CLIMATE AND WEATHER OF WAIKATO
 THE CLIMATE AND WEATHER OF WAIKATO 2nd edition P.R. Chappell 2013. All rights reserved. The copyright for this report, and for the data, maps, figures and other information (hereafter collectively referred
Percentage of normal rainfall for April 2018 Departure from average air temperature for April 2018
 New Zealand Climate Update No 227, May 2018 Current climate April 2018 Overall, April 2018 was characterised by lower pressure than normal over and to the southeast of New Zealand. Unlike the first three
Using Temperature and Dew Point to Aid Forecasting Springtime Radiational Frost and/or Freezing Temperatures in the NWS La Crosse Service Area
 Using Temperature and Dew Point to Aid Forecasting Springtime Radiational Frost and/or Freezing Temperatures in the NWS La Crosse Service Area WFO La Crosse Climatology Series #21 The formation of radiational
Science 1206 Chapter 1 - Inquiring about Weather
 Science 1206 Chapter 1 - Inquiring about Weather 1.1 - The Atmosphere: Energy Transfer and Properties (pp. 10-25) Weather and the Atmosphere weather the physical conditions of the atmosphere at a specific
Monthly Long Range Weather Commentary Issued: NOVEMBER 16, 2015 Steven A. Root, CCM, Chief Analytics Officer, Sr. VP, sales
 Monthly Long Range Weather Commentary Issued: NOVEMBER 16, 2015 Steven A. Root, CCM, Chief Analytics Officer, Sr. VP, sales sroot@weatherbank.com OCTOBER 2015 Climate Highlights The Month in Review The
Lecture #14 March 29, 2010, Monday. Air Masses & Fronts
 Lecture #14 March 29, 2010, Monday Air Masses & Fronts General definitions air masses source regions fronts Air masses formation types Fronts formation types Air Masses General Definitions a large body
Climate versus Weather
 Climate versus Weather What is climate? Climate is the average weather usually taken over a 30-year time period for a particular region and time period. Climate is not the same as weather, but rather,
Wind: Global Systems Chapter 10
 Wind: Global Systems Chapter 10 General Circulation of the Atmosphere General circulation of the atmosphere describes average wind patterns and is useful for understanding climate Over the earth, incoming
UPDATE OF REGIONAL WEATHER AND SMOKE HAZE (February 2018)
") UPDATE OF REGIONAL WEATHER AND SMOKE HAZE (February 2018) 1. Review of Regional Weather Conditions for January 2018 1.1 The prevailing Northeast monsoon conditions over Southeast Asia strengthened in January
UPDATE OF REGIONAL WEATHER AND SMOKE HAZE (February 2018) 1. Review of Regional Weather Conditions for January 2018 1.1 The prevailing Northeast monsoon conditions over Southeast Asia strengthened in January
Meteorology. Circle the letter that corresponds to the correct answer
 Chapter 3 Worksheet 1 Meteorology Name: Circle the letter that corresponds to the correct answer 1) If the maximum temperature for a particular day is 26 C and the minimum temperature is 14 C, the daily
- tornadoes. Further Reading: Chapter 08 of the text book. Outline. - cyclones and anti-cyclones. -tropical storms. -Storm surge
 (1 of 16) Further Reading: Chapter 08 of the text book Outline - cyclones and anti-cyclones - tornadoes -tropical storms -Storm surge (2 of 16) Introduction Previously, We talked about fronts and their
January 25, Summary
 January 25, 2013 Summary Precipitation since the December 17, 2012, Drought Update has been slightly below average in parts of central and northern Illinois and above average in southern Illinois. Soil
Early May Cut-off low and Mid-Atlantic rains
 Abstract: Early May Cut-off low and Mid-Atlantic rains By Richard H. Grumm National Weather Service State College, PA A deep 500 hpa cutoff developed in the southern Plains on 3 May 2013. It produced a
Tropical Moist Rainforest
 Tropical or Lowlatitude Climates: Controlled by equatorial tropical air masses Tropical Moist Rainforest Rainfall is heavy in all months - more than 250 cm. (100 in.). Common temperatures of 27 C (80 F)