Alaskan heat episode of June 2013-Draft
|
|
|
- Ashlie Townsend
- 5 years ago
- Views:
Transcription
1 Alaskan heat episode of June 2013-Draft Abstract: By Trevor Alcott National Weather Service Western Region, Salt Lake City UT And Richard H. Grumm National Weather Service State College, PA A strong 500 hpa ridge developed over Alaska from June The 500 hpa heights peaked around +4σ above normal June Despite these relative values, data from the climate forecast system indicated that the 500 hpa heights were higher than 500 hpa heights observed in the climate forecast system since A similar signature was observed in the 700 hpa temperature field. The forecast and observed 700 hpa temperatures were at the extreme tail of the probability distribution function relative to the climate forecast system. The resulting large ridge with above normal heights and temperatures lead to a multi-day heat episode over Alaska. Temperatures at several climate sites exceed 90F on at least 1 day and several locations had high temperatures in excess of 80F for three consecutive days, a true Alaskan heat wave. The results shown here suggest that for extreme events and heat episodes that the traditional standardized anomaly provides insights into extreme events. However, the skewed distribution of the height and temperature fields reveals that where a forecast lies relative to the probability distribution can provide a clearer signal when extreme weather events approach historic levels.
2 1. Overview An unseasonably strong ridge affected Alaska in June The 500 hpa heights +2 to +4σ above normal as the ridge peaked in intensity around mid-june. Beneath the ridge, most of Alaska experienced a heat episode and several locations set all-time record highs. The standardized anomalies (Hart and Grumm 2001; Grumm and Hart 2001) provided some insights into the potential for a heat episode. Standardized anomalies offer clues to potential extreme and near record events and have proven successful in identifying historic heat waves (Grumm 2011) and broad range of high impact events (Hart and Grumm 2001; Graham and Grumm 2010). Over the course of the past 14 years, standardized anomalies have proven useful in aiding forecasters in distinguishing high-end weather events. Surges of high precipitable water (PW) accompanied by strong low-level winds with large u- and v-wind anomalies (Stuart and Grumm 2006; Bodner et al 2011;Junker et al 2009;Junker et al 2008;Grumm 2011) have been used to diagnose and forecast extreme rainfall events. The same concepts have been applied to predicted heat waves (Grumm 2011) and significant East Coast snow events (Stuart and Grumm 2007). Many of the aforementioned studies (Graham and Grumm 2011; Hart and Grumm 2001) were biased toward the larger anomalies being associated with deep troughs and cyclonic events. Due to the general lack of large anomalies with anticyclones, heat waves and major heat waves rarely show up in lists of extreme weather events when magnitude of the standardized anomaly is used to identify large events. This implies that the anomalies associated with high impact weather events are skewed and biased toward events with deep cyclones or strong pressure gradients. The European Center for Medium-Range forecasting (ECMWF) developed an extreme forecast index (EFI: Legg and Mylne 200;Lalaurette 2003). The EFI is based on an internal ensemble forecast system (EFS) climatology. The emphasis is on when key fields such as model quantitative precipitation (QPF), winds, temperatures, and other variables depart for the 15-year ensemble forecast. The data are displayed and the index is computed using the model probability distribution function (PDF). This facilitates identifying when a parameter is forecast to exceed the internal model climatology (M-Climate) and thus when the EFS may be forecasting a near extreme, extreme, or potentially extreme event. Using the comparative PDF the data can identify record high temperatures and extreme 500 hpa events where the standardized anomaly approach might not facilitate identifying an extreme event. This paper examines the heat episode of June 2013 as it affected Alaska. The larger scale pattern from a standardized anomaly construct is presented. These data clearly show the successful forecast of the heat episode with 6 days of predictability and a coherent signal of a strong ridge
3 Date New Record High 14-Jun Jun Jun Jun Jun Jun Table 1. NCDC climate data showing record high maximums and record high minimums for June Data includes a list of dates in June 2013 and the number of record high maximums and record high minimums set by date. The highs over 80 value shows the number of sites each day which set new records had daily maximums of 80F or greater. For each record type the new record and tied records for the date are shown. with about 10 days of predictability. A re-analysis based (R-Climate) EFI approach is presented to show how similar to an M-Climate based EFI, R-Climate based EFI indicated that this was an extremely anomalous 500 hpa ridge, despite the modest 500 hpa and 700 hpa height and temperature anomalies respectively. The R-Climate and M-Climate approach offer an opportunity to improve forecasting synoptically forced high impact events and lend themselves well to automate decision support systems applications. 2. Methods and Data High Tied Record High Total Record High Max Tied Record High max Total2 Highs over 80 The large scale pattern was constructed using the GFS 00-hour forecasts which were compared to the standardized anomalies for key fields as described by Hart and Grumm (2001). The pattern with standardized anomalies was extracted from the Climate Forecast System (CFS) and compared to the 30-year climatology. Gridded forecasts and CFS data relative to standardized anomalies were plotted using GrADS (Doty and Kinter 1995). Forecasts from the NCEP Global Ensemble Forecast System (GEFS), Global Forecast System (GFS), and North American Ensemble Forecast System (NAEFS) were used to examine how well the heat episode was predicted. The NAEFS data was plotted against a 30-year climate which included the probability distribution function (PDF) at each grid point. The relative value of the forecast parameter was plotted as to its location in the PDF. The displays using the PDF were made using PYGRIB and only extreme events, in the lower 10 th or upper 90 th percentile were displayed. In section 6 a comparison of PDF and standardized anomalies is presented these data were also displayed using PYGRIB. The high temperature data for the period of the heat episode were retrieved from the National Climatic Data Center. These data were plotted and used to produce tables showing the records
4 set and locations where temperatures were above 80F. The term heat episode is used here as no site in Alaska was able to meet the heat wave criteria of 3 consecutive days of 90F or greater high temperatures. 3. Pattern Overview The 500 hpa pattern over Alaska and the northeastern Pacific basin (Fig. 1) shows the evolution of the large 500 hpa ridge over Alaska from 0000 UTC 15 June through 0000 UTC 20 June The 500 hpa height anomalies peaked June when the anomalies were +3 to +4σ above normal. The accompanying 850 hpa temperatures (Fig. 2) showed 850 hpa temperatures too were in the +3 to +4σ range, but the peak lagged the 500 hpa height anomalies by about 1 day. The precipitable water (PW: mm) and PW anomalies showed (Fig. 3) the well-known pattern associated with heat waves with a plume of high PW air on the west side of the ridge (Grumm 2013). The PW values in west-central Alaska peaked at +3 to +4σ above normal at 0000 UTC 16 June (Fig. 3b) and remained above normal through about 0000 UTC 18 June 2013 (Fig. 3d). The plume of high PW air was associated with a strong 850 hpa southerly jet (not shown) and 250 hpa jet (Fig. 4) over the northern Pacific which brought the high PW air from lower latitudes into Alaska. The National Climatic Data Center (NCDC) climate sites in Alaska (Table 1) indicated that the heat episode peaked between June where 4-10 Stations tied or broke record high temperatures for the date. Fairbanks, Alaska reached 91F on 20 June Only 2 sites reached or exceed 90F including Chulitina River on 17 June (Table 2) and Fairbanks on 19 June (not shown). The high temperatures over much of central Alaska were over 80F on 17 June (Fig. 05). Chulitina River exceeded 80F on 3 consecutive days (Tables 2-4) including 16, 17, and 18 June 2013 but only exceeded 90F on 17 June. Thus, the term heat episode is used here as the definition of a heat wave includes 3 or more consecutive days of 90F or greater temperatures. The 500 hpa heights and height anomalies (Fig. 6) and the 850 hpa temperatures and temperature anomalies (Fig. 7) show that 500 hpa heights peaked over 5820 m over central Alaska during the period of record heat from 0000 UTC 17 to 1200 UTC 18 June The 500 hpa height anomalies peaked in the CFSV2 data in the +3 to +4σ range. The 850 hpa temperatures (Fig. 7) showed the same lag indicated in the 24 hour perspective. The 850 hpa temperatures peaked in the 18 to 20C range at 0000 UTC though 1200 UTC 18 June 2013 with standardized anomalies around +4σ above normal (Figs. 6d-e). 4. PDF analysis of the event 1 6-hourly data showed a 5820 m high at 1800 UTC 16 June.
5 Figure 8 shows the North American Ensemble Forecast System (NAEFS) 500 hpa height forecasts leading up to the event and the verifying GFS 00-hour forecast. The GFS analysis indicated that the 500 hpa heights over most of Alaska were extreme end of the CFS 500 hpa height climatological PDF at 0000 UTC and all time periods in the CFS centered on 18 June. The analysis clearly shows that the 500 hpa heights analyzed represented a record event relative to the CFS.. Figure 9 shows the NAEFS 700 hpa temperature forecasts and the verifying GFS 00 hour forecasts. These data too show that the 700 hpa temperatures at 0000 UTC 18 June were at alltime values for the time of year. Comparing the analysis to the PDF clearly shows this was the record event at both 500 hpa and 700 hpa in terms of height and temperature extremes respectively. Relative to traditional anomalies, these data can highlight extreme and in this case, record events. 5. Ensemble forecasts NCEP GEFS forecast of 500 hpa heights for 6 forecast cycles valid at 0000 UTC 18 and 0000 UTC 19 June 2013 are shown in Figures 10 & 11. These data show that forecasts of a ridge over Alaska had at least 7 days of lead-time (Fig. 10a). The convergence of forecasts on a strong ridge with 500 hpa height anomalies in excess of +3σ above normal showed about 5 days of predictability. An examination of intervening GEFS runs suggested about a 5.5 to +6 day leadtime for a strong ridge (not shown). Forecasts valid at 0000 UTC 19 June (Fig. 11), the afternoon hours where the highest temperatures over the widest region were experience, showed a similar success as those valid 24 hours earlier. Once the ridge was established in the GEFS the predictions of its duration were relatively good and in this timeframe the ridge showed good predictability at least 8 days in advance and the strong ridge was predicted with about 6-7 days lead-time. The 850 hpa forecasts for the 0000 UTC 18 June (Fig. 12) and 19 June (Fig. 13) showed similar skill. The 850 hpa temperature anomalies in several forecasts showed a wide area of +3 to +4σ 850 hpa temperature anomalies (Figs. 11d-f) and a few areas where the 850 hpa temperature anomalies were forecast to over +5σ above normal. The broad region of over +4σ 850 hpa temperature anomalies were in the forecasts valid at 0000 UTC 18 June 2013 too (Fig. 13). These latter forecasts lacked the extreme areas of over 5σ 850 hpa temperature anomalies. 6. Forecast relative to the full PDF The 500 hpa and 700 hpa forecasts from the NAEFS (Figs. 8 & 9) showed the evolution of the forecast of a record event over 10 days. Due to position and intensity issues in the forecasts, the 500 hpa heights were unable to show a strong signal until about 144 hours prior to the event. It should be noted that the NAEFS ensemble mean 500 hpa heights at 240 hours forecast the heights in the 90 th percentile relative to the CFS climatology. The 96-hour and shorter forecasts
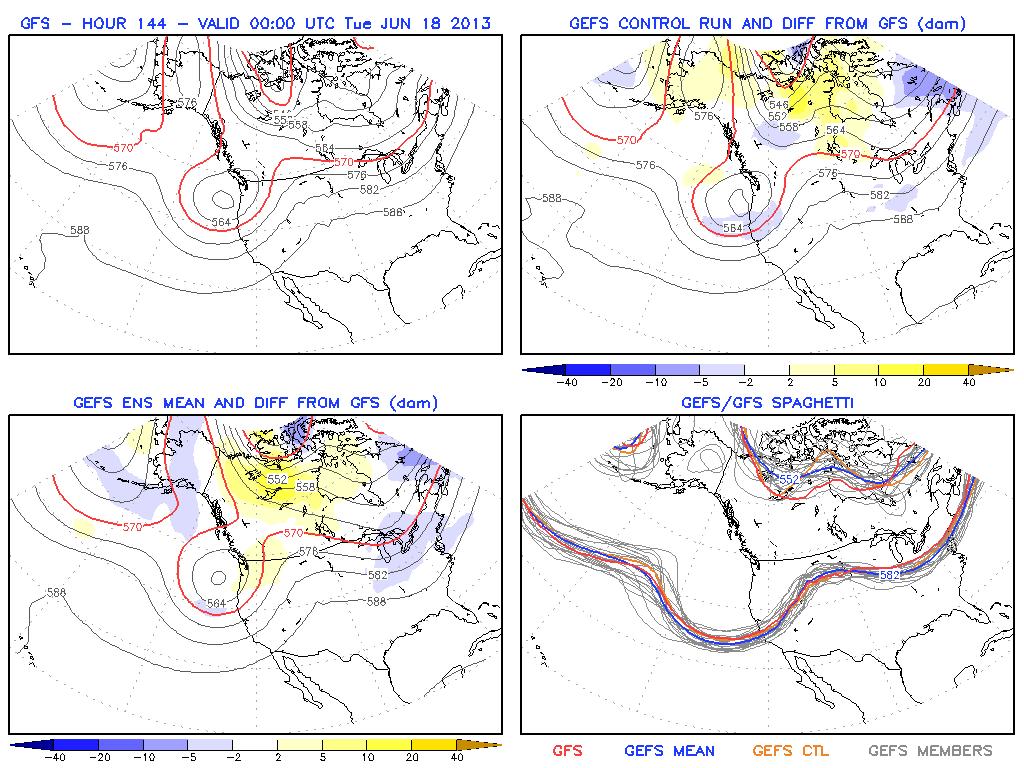
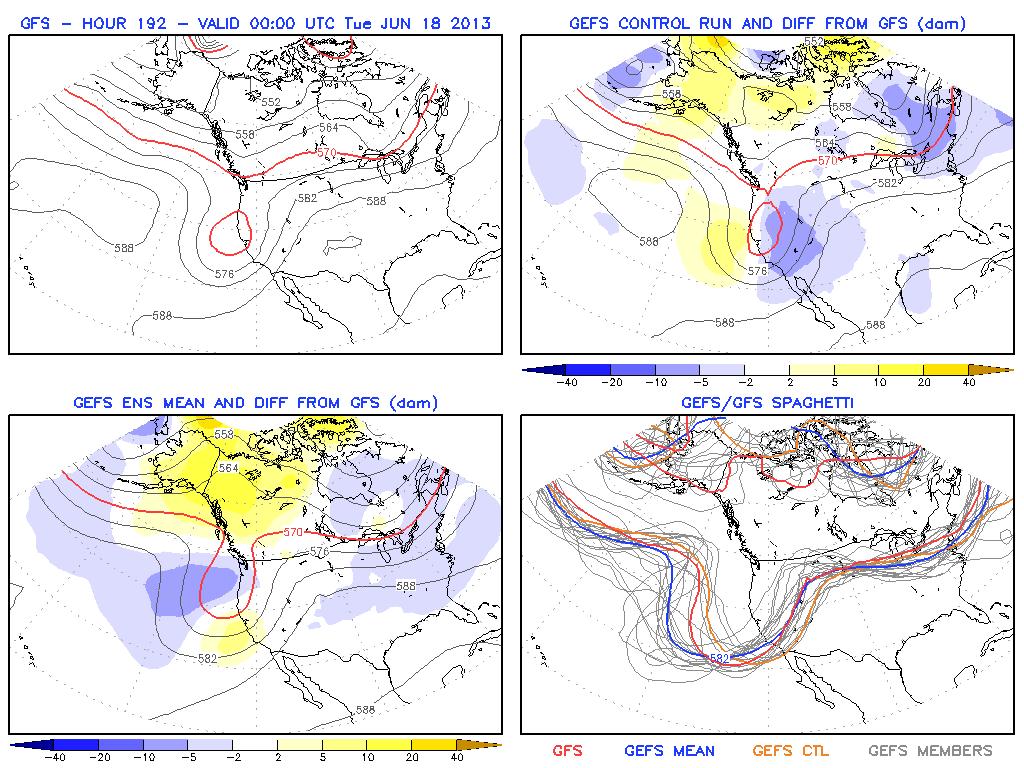
6 all predicted a record event in terms of 500 hpa heights and the GFS analysis verified this record forecast. The 700 hpa temperature forecasts showed a similar pattern with the ensemble mean forecast close to 90 th percentile outcome 10 days in advance and a 97.5 percentile event, in the correct approximate location, about 6 days in advance of what was a record event in terms of 700 hpa temperatures. The verifying analysis suggests that the 500 hpa height forecasts were more successful than the 700 hpa temperature forecasts. An examination of the GFS and GEFS forecasts is used to illustrate the limitations of predicting record events at longer ranges. The 144 hour GFS and GEFS control forecasts (Fig. 14) show the differences in the pattern within the two forecasts systems and the GEFS ensemble mean verse the GFS. The spaghetti plot from all members and the GFS shows the differences. The key to a successful forecasts of a record event within an ensemble forecast system requires that the system correctly predicted the feature, the geographic location of the feature, and the intensity of the feature. In these 144 hour forecasts the GFS and GEFS correctly forecast a ridge over central Alaska. There were slight differences in the intensity and location of the ridge (lower panel). These issues in the GEFS and CMC EFS (shown), likely lead to the strong ridge in the NAEFS over Alaska (Fig. 8) at 144 hours and the heights in the 97 percentile. The 240 hour GEFS (Fig. 15) showed far more uncertainty with the location and intensity of the ridge over central Alaska. Thus, the NAEFS showed as strong ridge and high end event, though less confidence in the event. A comparison of the NAEFS 500 hpa heights and 700 hpa temperatures valid at 0000 UTC 18 June 2013 showing the forecasts of the standardize anomalies and using the PDF illustrates the power of the PDF in forecasting extreme events. These data show that over portions of central Alaska, the NAEFS was forecasting both 500 hpa heights (Fig. 18) and 700 hpa temperatures (Fig. 19) which exceed all the analyzed values in the CFSR since The NAEFS forecasts, relative to the CFSR climatology, were predicting an historic event. The standardized anomalies for this event showed at +3 and +5σ event for 700 hpa temperatures and 500 hpa heights respectively. These data suggest that meteorological data are highly skewed and in ridges and high temperatures the PDF is better able to identify extreme events than standardized anomalies. The data also imply that use of climate data relative to ensemble forecasts contains uncertainty information when the system is forecasting a relative extreme event. The 240 hour forecasts correctly predicted the ridge and that the heights in the ridge would be in the 90 th percentile. Due to uncertainty, this signal appeared weak, though as the forecasts converged these skewed forecasts proved to have correctly predicted a strong ridge, underestimating the actual intensity 7. Summary
7 A record heat event impacted Alaska in June 2013 and the number of record high temperatures tied or broken peaked on the 17 th and 18 th of June. The data presented here indicate that the NCEP GEFS and NAEF when displayed using the 30-year CFS data, forecast a potential extreme weather event. The 500 hpa height, 850 hpa temperature and 700 hpa temperature anomalies all indicated values at least +3σ above normal. The CFS and 00-hour GFS data were used to verify the forecasts of the heights and temperatures within the Alaskan ridge. These data indicated a successful forecast of an anomalously strong ridge with above normal temperatures. The GEFS forecasts of the 500 hpa heights and height anomalies (Figs. 10 & 11) along with the forecasts of the 850 hpa temperatures and temperature anomalies (Fig. 12 & 13) implied that the GEFS correctly predicted the Alaskan heat episode. The skill in the general pattern at 500 hpa was on the order of 8 days. The skill in predicting the potential for both 500 hpa heights and 850 hpa temperatures to have anomalies on the order of +3 to +5σ above normal showed considerable lead-time, on the order of 6-7 days. Other modeling and ensemble prediction systems showed comparable skill at forecasting the strong ridge and resulting warm episode. This event and the ridge associated with central European heat wave of 2010 (Grumm 2011) suggest that larger scale ridges are relatively well predicted by synoptic scale models and EFS. The standardized anomaly approach provided useful insights into the potential for a significant heat episode over Alaska. When used with EFS data, the standardized anomalies provide at least 6 days of lead-time for the onset of this record event. However, the standardize anomalies were primarily on the order of +3 to +4σ above normal in the CFS and most EFS s. Unlike deep cyclones and in regions of strong gradients, it is often difficult to get large standardized anomalies, much over +4 to +5σ in ridges and features more typically associated with droughts and heat waves. Cases such as this show why an EFI and more PDF based approach may add information to the forecast, analysis, and decision making processes associated with extreme synoptic events. The PDF of the 500 hpa heights from the 42-member NAEFS system (Fig. 8) showed that a broad region of central Alaska was forecast to experience 500 hpa heights that were higher than the highest 500 hpa heights in the CFSR over a 30-year period for forecasts of less than 144 hours in duration. Unlike the standardized anomalies, these data showed that the 500 hpa heights in the NAEFS were forecast to be higher than observed since Even at 240 hours, the heights in the NAEFS were forecast to be in the 90 th percentile. The signal looked weak relative to the strong and coherent signal in the shorter range forecasts. Relative to traditional anomalies, these PDFs of the forecast, relative to the CFS climatology can help identify the potential for both high impact and record events. This case suggests that i. PDF data can show both the potential for a high and a record event. ii. A weak signal at long ranges, of a high impact event can be useful data. iii. Higher anomalies and PDFs near the tails in the ensemble mean contain confidence information when the EFS is forecasting a high-end event. iv. The lack of a signal at longer ranges does not facilitate knowing weather uncertainty or conditions close to normal produce the resulting signal.
8 v. Probabilistic displays of the data, such as the probability of 90 (10),95 (5),97 (3) and 100 (0) percent could be of value and would provide additional confidence information. The term heat episode is used here as the definition of a heat wave includes 3 or more consecutive days of 90F or greater temperatures. In Alaska, high temperature of 90F or greater are difficult to achieve and reaching these values for 3 consecutive days is likely even more difficult to achieve. Thus, for some regions of the world, based on latitude and altitude a more generic definition of may be required. Though the extreme heat achieved in Alaska in June 2013 was not likely a high impact heat event relative to heat waves such as the Central European Heat Wave of 2010 (Grumm 2011) or the 2003 western European heat wave. 8. Acknowledgements Randy Graham for feedback and information related to rare events. 9. References Bodner, M. J., N. W. Junker, R. H. Grumm, and R. S. Schumacher, 2011: Comparison of atmospheric circulation patterns during the 2008 and 1993 historic Midwest floods. Natl. Wea. Dig., 35, Doty, B.E. and J.L. Kinter III, 1995: Geophysical Data Analysis and Visualization using GrADS. Visualization Techniques in Space and Atmospheric Sciences, eds. E.P. Szuszczewicz and J.H. Bredekamp, NASA, Washington, D.C., Grumm, R.H. 2011: New England Record Maker rain event of March NWA, Electronic Journal of Operational Meteorology, EJ4. Graham, R A. and R. H. Grumm, 2010: Utilizing Normalized Anomalies to Assess Synoptic-Scale Weather Events in the Western United States. Wea. Forecasting, 25, Grumm, R.H. and R. Hart. 2001: Standardized Anomalies Applied to Significant Cold Season Weather Events: Preliminary Findings. Wea. and Fore., 16, Grumm, Richard H., 2011: The Central European and Russian Heat Event of July August Bull. Amer. Meteor. Soc., 92, Hart, R. E., and R. H. Grumm, 2001: Using normalized climatological anomalies to rank synoptic scale events objectively. Mon. Wea. Rev., 129, Junker, N.W, M.J.Brennan, F. Pereira,M.J.Bodner,and R.H. Grumm, 2009:Assessing the Potential for Rare Precipitation Events with Standardized Anomalies and Ensemble Guidance at the Hydrometeorological Prediction Center. Bulletin of the American Meteorological Society,4 Article: pp
9 Junker, N. W., R. H. Grumm, R. Hart, L. F. Bosart, K. M. Bell, and F. J. Pereira, 2008: Use of standardized anomaly fields to anticipate extreme rainfall in the mountains of northern California. Wea. Forecasting,23, Knight, P., J. Ross, B. Root, G.S. Young, R.H. Grumm, 2005: Fingerprinting significant weather events. Proceedkngs of the Fourth Conference on Artificial Intelligence, San Diego, CA, January 9-13, Stuart, N. and R. Grumm 2009, "The Use of Ensemble and Anomaly Data to Anticipate Extreme Flood Events in the Northeastern United States",NWA Digest,33, Stuart, N. and R. Grumm 2009, "The Use of Ensemble and Anomaly Data to Anticipate Extreme Flood Events in the Northeastern United States", 33, Stuart,N.A and R.H. Grumm 2007: Using Wind Anomalies to Forecast East Coast Winter Storms.Wea. and Forecasting, 21,

10 Figure 1. Return to text.
11 Figure 2. Return to text.

12 Figure 3. Return to text.

13 Figure 4. Return to text.
 from the Pennsylvania State")
14 Figure 5. The 24 hour maximum temperatures (F) from the Pennsylvania State University ewall-site for the period covering 17 June Return to text.
15 Location Lat Lon POR Max Difference Date Old record Date2 CHULITNA RIVER F 12 6/17/ F 6/17/1983 GLENNALLEN KCAM F 6.1 6/17/ F 6/17/1986 NORTH POLE F 5 6/17/ F 6/17/2005 TONSINA F 4 6/17/ F 6/17/1907 SKAGWAY F 2 6/17/ F 6/17/1948 COLLEGE OBSERVATORY JUNEAU DOWNTOWN F 0 6/17/ F 6/17/ F 0.9 6/17/ F 6/17/1967 CRAIG F 7.1 6/17/ F 6/17/2005 WISEMAN F 2 6/17/ F 6/17/1948 ELFIN COVE F 5.1 6/17/ F Table 2. As in Table 1 for daily data for 17 June 2013 including the location, latitude, longitude, the length of the climate period of record, the attained maximum temperatures, how much the daily maximum exceed the previous record by and the date of the current and previous records. Return to text.
16 Location Lat Lon POR Max Difference Date Old record Date2 NORTH POLE F 5.1 6/18/ F 6/18/1996 CHULITNA RIVER F 8.1 6/18/ F 6/18/2011 TONSINA F 4.2 6/18/ F 6/18/2005 GLENNALLEN KCAM F 2 6/18/ F 6/18/2005 SKAGWAY F 0 6/18/ F 6/18/1961 ALYESKA F /18/ F 6/18/2005 WISEMAN F 0.9 6/18/ F 6/18/1948 Table 4. As in Table 3 except for 18 June Return to text. Location Lat Lon POR Max Difference Date Old record Date2 CHULITNA RIVER F 9 6/16/ F 6/16/2002 SKAGWAY F 2.2 6/16/ F 6/16/2002 ELFIN COVE F 16 6/16/ F 6/16/2006 CRAIG F 4.8 6/16/ F 6/16/1944 Table 3. As in Table 3 except for 16 June Return to text.
17 Figure 6. Return to text.

18 Figure 7. Return to text.
 and the percentile of the 500 hpa verse the climatological 500 hpa height probability density function.")
19 Figure 8. NAEFS forecasts and GFS analysis of 500 hpa heights (m) and the percentile of the 500 hpa verse the climatological 500 hpa height probability density function. Data show NAEFS forecasts at a) 240 hours, b) 192 hours, c) 144 hours, d) 96 hours, f) 48 hours, and d) the verifying GFS 00-hour forecasts. Return to text.

20 Figure 9. As in Figure 8 except for 700 hpa temperatures. Return to text.
21 Figure 10. GEFS forecasts of 500 hpa heights and 500 hpa height anomalies (shaded) from 6 GEFS forecasts valid at 0000 UTC 18 June 2013 from GEFS forecasts initialized at a) 1200 UTC 11 June, b) 1200 UTC 13 June, c) 1200 UTC 14 June, d) 1200 UTC 15 June, e) 1200 UTC 16 June, f) 1200 UTC 17 June Return to text.

22 Figure 11. As in Figure 9 except valid at 0000 UTC 19 June Return to text.

23 Figure 12. As in Figure 9 except for GEFS forecasts of 850 hpa temperatures ( C) and 850 hpa temperature anomalies. Return to text.
24 Figure 13. As in Figure 9 except valid at 0000 UTC 19 June Return to text.
25 Figure 15.
26 Figure 16.


27 Figure 15. As in Figure 13 except for 700 hpa temperature and comparative temperature anomalies. Return to text. Figure 14. NAEFS 500 hpa heights valid at 0000 UTC 18 June Upper panels shows the NAEFS forecasts of 500 hpa heights relative to the 30-year CFSR data. The lower panels shows the 500 hpa heights with the traditional standardized anomalies. Return to text.
Pre-Christmas Warm-up December 2013-Draft
 Pre-Christmas Warm-up 21-23 December 2013-Draft By Richard H. Grumm National Weather Service State College, PA 1. Overview A large ridge over the west-central Atlantic (Fig.1) and trough moving into eastern
The Big Chill of November 2013
 The Big Chill of November 2013 Value of anomalies for situational awareness By Richard H. Grumm National Weather Service State College, PA Trevor Alcott National Weather Service, Salt Lake City UT 1. Overview
2 July 2013 Flash Flood Event
 2 July 2013 Flash Flood Event By Richard H. Grumm and Charles Ross National Weather Service State College, PA 1. Overview A retrograding 500 hpa cyclone and anticyclone (Fig. 1) set up deep southerly flow
Early Summer Heat Waves of 2013
 Early Summer Heat Waves of 2013 Abstract: By Richard H. Grumm National Weather Service State College, PA And Trevor Alcott National Weather Service, Salt Lake City Utah From late June into mid-july large
Impacts of the April 2013 Mean trough over central North America
 Impacts of the April 2013 Mean trough over central North America By Richard H. Grumm National Weather Service State College, PA Abstract: The mean 500 hpa flow over North America featured a trough over
Early May Cut-off low and Mid-Atlantic rains
 Abstract: Early May Cut-off low and Mid-Atlantic rains By Richard H. Grumm National Weather Service State College, PA A deep 500 hpa cutoff developed in the southern Plains on 3 May 2013. It produced a
National Weather Service-Pennsylvania State University Weather Events
 National Weather Service-Pennsylvania State University Weather Events Abstract: Tropical Storm Debbie, standardized anomalies and heavy rainfall by Richard H. Grumm National Weather Service State College
National Weather Service-Pennsylvania State University Weather Events
 National Weather Service-Pennsylvania State University Weather Events Abstract: West Coast Heavy Precipitation Event of January 2012 by Richard H. Grumm National Weather Service State College PA 16803
Southern United States Heavy rain and flood event 6-8 April 2014
 Southern United States Heavy rain and flood event 6-8 April 2014 By Richard H. Grumm National Weather Service State College, PA 1. Overview Heavy rainfall (Fig. 1) affected the southern United States from
Memorial Day Weekend 2013: Snow and Cold
 Abstract: Memorial Day Weekend 2013: Snow and Cold By Richard H. Grumm National Weather Service State College, PA A slow moving 500 hpa low and associated unseasonably cold air in the lower troposphere
Eastern United States Wild Weather April 2014-Draft
 1. Overview Eastern United States Wild Weather 27-30 April 2014-Draft Significant quantitative precipitation bust By Richard H. Grumm National Weather Service State College, PA and Joel Maruschak Over
National Weather Service-Pennsylvania State University Weather Events
 National Weather Service-Pennsylvania State University Weather Events New Zealand heavy rain and flood event-draft by Richard H. Grumm National Weather Service State College PA 16803 Abstract:. A record
Southern Heavy rain and floods of 8-10 March 2016 by Richard H. Grumm National Weather Service State College, PA 16803
 Southern Heavy rain and floods of 8-10 March 2016 by Richard H. Grumm National Weather Service State College, PA 16803 1. Introduction Heavy rains (Fig. 1) produced record flooding in northeastern Texas
Convective Heavy rainfall event of 23 July 2013
 Convective Heavy rainfall event of 23 July 2013 By Richard H. Grumm and Charles Ross National Weather Service State College, PA Abstract: A record rain event affected southern Lebanon County on 23 July
Tropical Storm Hermine: Heavy rainfall in western Gulf By Richard H. Grumm National Weather Service Office State College, PA 16803
 Tropical Storm Hermine: Heavy rainfall in western Gulf By Richard H. Grumm National Weather Service Office State College, PA 16803 1. INTRODUCTION Tropical storm Hermine, the eighth named tropical system
Heavy Rainfall Event of June 2013
 Heavy Rainfall Event of 10-11 June 2013 By Richard H. Grumm National Weather Service State College, PA 1. Overview A 500 hpa short-wave moved over the eastern United States (Fig. 1) brought a surge of
Mid-Atlantic Ice Storm 4 March 2015
 1. Overview Mid-Atlantic Ice Storm 4 March 2015 By Richard H. Grumm National Weather Service State College, PA A large 500 hpa ridge over the southern United States (Fig. 1a-e)) built into the Mid-Atlantic
Southern Plains Heavy rain and Flooding
 Abstract: Southern Plains Heavy rain and Flooding By Richard H. Grumm National Weather Service State College, PA A severe weather event affected the southern Plains on 31 May 2013. The severe weather event
Winter Storm of 15 December 2005 By Richard H. Grumm National Weather Service Office State College, PA 16803
 Winter Storm of 15 December 2005 By Richard H. Grumm National Weather Service Office State College, PA 16803 1. INTRODUCTION A complex winter storm brought snow, sleet, and freezing rain to central Pennsylvania.
Mid-West Heavy rains 18 April 2013
 Abstract: Mid-West Heavy rains 18 April 2013 By Richard H. Grumm and Charles Ross National Weather Service State College, PA The relatively wet conditions during the first 16 days of April 2013 set the
Snow, freezing rain, and shallow arctic Air 8-10 February 2015: NCEP HRRR success story
 Snow, freezing rain, and shallow arctic Air 8-10 February 2015: NCEP HRRR success story By Richard H. Grumm National Weather Service State College, PA 1. Overview A short-wave (Fig. 1) moved over the strong
Heat wave ending severe events of July 2010 By Richard H. Grumm National Weather Service Office State College, PA 16803
 Heat wave ending severe events of 23-25 July 2010 By Richard H. Grumm National Weather Service Office State College, PA 16803 1. INTRODUCTION A strong subtropical ridge (Fig. 1a) dominated the eastern
Southern United States Winter Storm of 28 January 2014-v1. High Impact Snow on Edge of Forecast Precipitation Shield
 Southern United States Winter Storm of 28 January 2014-v1 High Impact Snow on Edge of Forecast Precipitation Shield by Richard H. Grumm National Weather Service State College, PA 16803 and 1. Introduction
1995 and 1980 (exact dates would be useful). 1. INTRODUCTION
. 1. INTRODUCTION") Alaskan Autumn Storm of 22-24 November 2010 By Richard Grumm National Weather Service State College, PA 16803 and Rick Thoman and James A. Nelson National Weather Service Alaska Region 1. INTRODUCTION
Alaskan Autumn Storm of 22-24 November 2010 By Richard Grumm National Weather Service State College, PA 16803 and Rick Thoman and James A. Nelson National Weather Service Alaska Region 1. INTRODUCTION
1. INTRODUCTION. March. Local time used in text to define dates. 1 Due to UTC time the went passed 0000 UTC 31
 New England Record Maker Rain Event of 29-30 March 2010 By Richard H. Grumm National Weather Service Contributions by Frank Nocera National Weather Service Office Taunton, MA 1. INTRODUCTION The second
Eastern United States Winter Storm of 1-2 February 2015-DRAFT Northeast Ground Hog Storm
 Eastern United States Winter Storm of 1-2 February 2015-DRAFT Northeast Ground Hog Storm By Richard H. Grumm National Weather Service State College, PA 1. Overview A major Winter Storm brought precipitation
National Weather Service-Pennsylvania State University Weather Events
 National Weather Service-Pennsylvania State University Weather Events Eastern United States Winter Storm and Severe Event of 28-29 February 2012 by Richard H. Grumm National Weather Service State College
This paper will document the pattern which produced the record rainfall of 30 September The goal is to show the pattern the
 The Historic Synoptic-Hybrid rainfall event 30 September 2010 By Richard Grumm And Michael Kozar National Weather Service State College, PA 16803 1. INTRODUCTION A slow moving north-south oriented frontal
Multi-day severe event of May 2013
 Abstract: Multi-day severe event of 18-22 May 2013 By Richard H. Grumm and Charles Ross National Weather Service State College, PA A relatively slow moving Trough over the western United States and a ridge
Deep Cyclone and rapid moving severe weather event of 5-6 June 2010 By Richard H. Grumm National Weather Service Office State College, PA 16803
 Deep Cyclone and rapid moving severe weather event of 5-6 June 2010 By Richard H. Grumm National Weather Service Office State College, PA 16803 1. INTRODUCTION A rapidly deepening surface cyclone raced
National Weather Service-Pennsylvania State University Weather Events
 National Weather Service-Pennsylvania State University Weather Events Heavy Rain 7-8 December 2011 by Richard H. Grumm National Weather Service State College PA 16803 Abstract:. A mid-level short-wave
2. Methods and data. 1 NWS Reno, NV report circulated in the LA Times story maximum wind was observed at 0900 AM 8 January 2017.
 The California Extreme Precipitation Event of 8-10 January 2017 By Richard H. Grumm and Charles Ross National Weather Service State College, PA 16803 1. Introduction A strong Pacific jet and a surge of
The Deep South snowfall of February 2010 By Richard H. Grumm National Weather Service Office, State College, PA 16803
 The Deep South snowfall of 11-13 February 2010 By Richard H. Grumm National Weather Service Office, State College, PA 16803 1. INTRODUCTION A surface cyclone tracked across Mexico and the Gulf of Mexico
The Devastating Western European Winter Storm February 2010 By Richard H. Grumm National Weather Service
 The Devastating Western European Winter Storm 27-28 February 2010 By Richard H. Grumm National Weather Service 1. INTRODUCTION A strong late winter storm, called Xynthia 1, raced across Western Europe
National Weather Service-Pennsylvania State University Weather Events
 National Weather Service-Pennsylvania State University Weather Events Heavy rainfall of 23 November 2011 by Richard H. Grumm National Weather Service State College PA 16803 Abstract:. A fast moving mid-tropospheric
New Zealand Heavy Rainfall and Floods
 New Zealand Heavy Rainfall and Floods 1. Introduction Three days of heavy rainfall associated with a deep upper-level low (Fig. 1) brought flooding to portions of New Zealand (Fig. 2). The flooding was
Warm Episode of December 2015:
 Warm Episode of 11-16 December 2015: Record Warmth over Mid-Atlantic Region By Richard H. Grumm National Weather Service State College, PA 1. Overview A strong 500 hpa ridge over the eastern United States
Heavy rains and precipitable water anomalies August 2010 By Richard H. Grumm And Jason Krekeler National Weather Service State College, PA 16803
 Heavy rains and precipitable water anomalies 17-19 August 2010 By Richard H. Grumm And Jason Krekeler National Weather Service State College, PA 16803 1. INTRODUCTION Heavy rain fell over the Gulf States,
NWS-PSU Case Study Site 2010 Severe Weather Case
 NWS-PSU Case Study Site 2010 Severe Weather Case New Years Eve Severe Weather Event of 31 December 2010 by Richard H. Grumm National Weather Service State College PA 16083 Abstract: A surge of warm humid
The high latitude blocking and impacts on Asia
 The high latitude blocking and impacts on Asia By Richard H. Grumm National Weather Service Office State College, PA 16803 1. INTRODUCTION An episode of high latitude blocking during the month of December
National Weather Service-Pennsylvania State University Weather Events
 National Weather Service-Pennsylvania State University Weather Events Historic Ohio Valley January Severe weather and Tornado Event by Richard H. Grumm National Weather Service State College PA 16803 and
Orographically enhanced heavy rainfall of 23 May 2010 By Richard H. Grumm National Weather Service Office State College, PA 16803
 Orographically enhanced heavy rainfall of 23 May 2010 By Richard H. Grumm National Weather Service Office State College, PA 16803 1. INTRODUCTION During the overnight hours and into the early morning of
A summary of the heat episodes of June 2017
 A summary of the heat episodes of June 2017 By Richard H. Grumm and Elissa A. Smith National Weather Service State College, PA 1. Overview Over 1800 record high temperatures were set or tied during the
New England Record Maker Rain Event of March 2010
 National Weather Association, Electronic Journal of Operational Meteorology, 2011-EJ4 New England Record Maker Rain Event of 29-30 March 2010 RICHARD H. GRUMM National Weather Service, State College, PA
Thanksgiving Eve snow of November 2014
 1. Overview Thanksgiving Eve snow of 26-27 November 2014 By Richard H. Grumm National Weather Service State College, PA An early season east coast winter storm (ECWS: DeGaetano et al. 2002) brought snow
The southern express: Winter storm of January 2010 By Richard H. Grumm National Weather Service
 The southern express: Winter storm of 28-30 January 2010 By Richard H. Grumm National Weather Service 1. INTRODUCTION A storm system of Pacific origin tracked across the southern United States from 27-31
Northeastern United States Snowstorm of 9 February 2017
 Northeastern United States Snowstorm of 9 February 2017 By Richard H. Grumm and Charles Ross National Weather Service State College, PA 1. Overview A strong shortwave produced a stripe of precipitation
West Coast Multi-Day heavy Precipitation Event 28 November-2 December 2012-Draft
 West Coast Multi-Day heavy Precipitation Event 28 November-2 December 2012-Draft By Richard H. Grumm and Charles Ross National Weather Service State College, PA 16803 Contributions by the Albany MAP and
Record snow blankets the United Kingdom 5-6 January 2010
 1. INTRODUCTION Record snow blankets the United Kingdom 5-6 January 2010 By Richard H. Grumm National Weather Service Office State College, PA 16803 A rare winter storm brought heavy snow the United Kingdom
East Coast Heavy Rainfall of January 2010 By Richard H. Grumm National Weather Service
 1. INTRODUCTION A strong storm moved across the United States from 21 January through 25 January 2010 (Fig. 1). This storm produced record rainfall and snowfall in the western United States from 20-22
NCEP Short-Range Ensemble forecasts of an historic rainfall event: The June 2006 East Coast Floods 1. INTRODUCTION
 NCEP Short-Range Ensemble forecasts of an historic rainfall event: The 23-27 June 2006 East Coast Floods By Richard H. Grumm National Weather Service Office, State College PA 16803 And Norman W. Junker
Winter Storm of February 2008 By Richard H. Grumm National Weather Service Office State College PA 16803
 1. INTRODUCTION Winter Storm of 11-13 February 2008 By Richard H. Grumm National Weather Service Office State College PA 16803 A potent winter storm brought snow, sleet, freezing rain, and rain to the
National Weather Service-Pennsylvania State University Weather Events
 National Weather Service-Pennsylvania State University Weather Events The high latitude Eurasian Anticyclone of January-February 2012 by Richard H. Grumm National Weather Service State College PA 16803
The Devastating Mid-Mississippi Valley Floods of 1-2 May 2010 By Richard H. Grumm National Weather Service
 The Devastating Mid-Mississippi Valley Floods of 1-2 May 2010 By Richard H. Grumm National Weather Service 1. INTRODUCTION A devastating heavy rainfall event affected the Mid-Mississippi Valley (MMV) from
Hurricane Harvey the Name says it all. by Richard H. Grumm and Charles Ross National Weather Service office State College, PA
 Hurricane Harvey the Name says it all by Richard H. Grumm and Charles Ross National Weather Service office State College, PA 16803. 1. Overview Hurricane Harvey crossed the Texas coast (Fig. 1) as a category
Hurricane Alex: Heavy rainfall and anomalous precipitable water By Richard H. Grumm National Weather Service Office State College, PA 16803
 Hurricane Alex: Heavy rainfall and anomalous precipitable water By Richard H. Grumm National Weather Service Office State College, PA 16803 1. INTRODUCTION Hurricane Alex ambled across the Gulf of Mexico
The North American Heat Wave of July 2011-Draft
 The North American Heat Wave of July 2011-Draft By Richard H. Grumm And Jason Krekeler 328 Innovation Blvd Suite 330 National Weather Service Office State College, PA 16803 The meteorological conditions
Utilizing Ensemble-based Anomalies to Anticipate Significant Events A New Display Tool
 Utilizing Ensemble-based Anomalies to Anticipate Significant Events A New Display Tool Randy Graham 1, Rich Grumm 2, Nanette Hosenfeld 1, Trevor Alcott 3 1 NOAA/NWS Salt Lake City UT 2 NOAA/NWS State College
1. INTRODUCTION. For brevity times are referred to in the format of 20/1800 for 20 August UTC. 3. RESULTS
 Heavy rains and precipitable water anomalies 20-23 August 2010-Draft By Jason Krekeler And Richard Grumm National Weather Service State College, PA 16803 1. INTRODUCTION Heavy rain fell across the central
Eastern United States Anafrontal Snow 4-5 March 2015-Draft
 Eastern United States Anafrontal Snow 4-5 March 2015-Draft By Richard H. Grumm National Weather Service State College, PA 1. Overview A 500 hpa ridge over the western Atlantic (Fig. 1) and an approaching
Flooding and Severe weather of 27 June 2013
 Flooding and Severe weather of 27 June 2013 By Richard H. Grumm National Weather Service State College, PA 1. Overview Flooding and severe weather affected Pennsylvania on 27 June 2013 (Fig 1). The severe
Arkansas Flash Floods and heavy rainfall-draft By Richard H. Grumm National Weather Service State College PA 16803
 Arkansas Flash Floods and heavy rainfall-draft By Richard H. Grumm National Weather Service State College PA 16803 1. INTRODUCTION Training convection associated with deep moisture and a strongly southerly
National Weather Service-Pennsylvania State University Weather Events
 National Weather Service-Pennsylvania State University Weather Events Southern Express 18-19 February 2012: Probabilities, Potentials and uncertainty by Richard H. Grumm National Weather Service State
National Weather Service-Pennsylvania State University Weather Events
 National Weather Service-Pennsylvania State University Weather Events The February Thaw 17-19 February 2011 by Richard H. Grumm National Weather Service State College PA 16803 Abstract: After a cold January
Anticipating record events using patterns and pattern forecast: Mid-Mississippi Valley floods of April 2011
 Anticipating record events using patterns and pattern forecast: Mid-Mississippi Valley floods of April 2011 Richard H. Grumm National Weather Service State College, PA Abstract: A persistent pattern produced
Warm Episode over Indian Sub-continent March 2010 By Richard Grumm National Weather Service State College Contributions by Lance Bosart SUNY Albany
 Warm Episode over Indian Sub-continent March 2010 By Richard Grumm National Weather Service State College Contributions by Lance Bosart SUNY Albany 1. INTRODUCTION A massive subtropical ridge formed over
The enduring Louisiana rain and flooding of August 2016 by Richard H. Grumm National Weather Service State College, PA 16803
 1. Introduction The enduring Louisiana rain and flooding of August 2016 by Richard H. Grumm National Weather Service State College, PA 16803 Historic flooding impacted Louisiana on 12-15 August 2016 (TWC
Will Tropical Storm Sandy become the Storm of the 21 st Century?
 Will Tropical Storm Sandy become the Storm of the 21 st Century? By Richard H. Grumm National Weather Service State College, PA 16803 Contributions by Craig Evanego Abstract The interaction with tropical
Ensemble Forecasts of the Blizzard of January 2005 By Richard H. Grumm National Weather Service State College Pennsylvania
 Ensemble Forecasts of the Blizzard of 22-23 January 2005 By Richard H. Grumm National Weather Service State College Pennsylvania 1. Introduction A fast moving upper-level disturbance produced a wide area
1. INTRODUCTION. The super storm of March 1993 produced severe weather and tornadoes as it s trailing cold front pushed through Florida (Kocin eta 1l
 1. INTRODUCTION Super Tuesday and awful Wednesday: the 5-6 February 2008 Severe Weather Outbreak By Richard H. Grumm National Weather Service State College, PA And Seth Binau National Weather Service,
Recent Trends in Northern and Southern Hemispheric Cold and Warm Pockets
 Recent Trends in Northern and Southern Hemispheric Cold and Warm Pockets Abstract: Richard Grumm National Weather Service Office, State College, Pennsylvania and Anne Balogh The Pennsylvania State University
The Historic Storm of October 2010 By Richard H. Grumm National Weather Service
 The Historic Storm of 24-26 October 2010 By Richard H. Grumm National Weather Service 1. INTRODUCTION An historic storm impacted much of the United States from 24-26 October 2010. Though the cyclone was
Minor Winter Flooding Event in northwestern Pennsylvania January 2017
 1. Overview Minor Winter Flooding Event in northwestern Pennsylvania 12-13 January 2017 By Richard H. Grumm National Weather Service State College, PA A combination of snow melt, frozen ground, and areas
HRRR and the Mid-Mississippi Valley Severe and Heavy rainfall event of October 2014
 HRRR and the Mid-Mississippi Valley Severe and Heavy rainfall event of 13-14 October 2014 By Richard H. Grumm National Weather Service State College, PA contributions by Charles Ross 1. Overview A deep
The high latitude blocking and low arctic oscillation values of December 2009
 The high latitude blocking and low arctic oscillation values of December 2009 By Richard H. Grumm National Weather Service Office State College, PA 16803 1. INTRODUCTION An episode of high latitude blocking
Eastern United States Winter Storm of February Dealing with Divergent Model and Ensemble Forecast Systems
 Eastern United States Winter Storm of 12-14 February 2014 Dealing with Divergent Model and Ensemble Forecast Systems By Richard H. Grumm National Weather Service State College, PA 16803 1. Introduction
Patterns of Heavy rainfall in the Mid-Atlantic Region 1. INTRODUCTION
 5A.2 Patterns of Heavy rainfall in the Mid-Atlantic Region by Richard H. Grumm * And Ron Holmes National Weather Service Office State College, PA 16802 1. INTRODUCTION The patterns associated with heavy
The Arctic Outbreak of 4-8 January 2014
 The Arctic Outbreak of 4-8 January 2014 by Richard H. Grumm National Weather Service State College, PA 16803 1. INTRODUCTION An artic outbreak affected much of eastern North American to include the eastern
1. INTRODUCTION * Figure 1. National Weather Service Storm Prediction Center (SPC) storm reports for December 1, 2006.
 storm reports for December 1, 2006.") P1.14 FORECAST ISSUES RELATED TO THE UNPRECEDENTED SEVERE AND HIGH WIND EVENT OF DECEMBER 2006 by Greg A. DeVoir* and Richard H. Grumm National Weather Service Office State College, PA 16803 1. INTRODUCTION
P1.14 FORECAST ISSUES RELATED TO THE UNPRECEDENTED SEVERE AND HIGH WIND EVENT OF DECEMBER 2006 by Greg A. DeVoir* and Richard H. Grumm National Weather Service Office State College, PA 16803 1. INTRODUCTION
Eastern United States Ice Storm of December 2008 By Richard H. Grumm National Weather Service State College, PA 16803
 Eastern United States Ice Storm of 11-12 December 2008 By Richard H. Grumm National Weather Service State College, PA 16803 1. INTRODUCTION A significant ice storm affected the eastern United States on
Cold frontal Rainband and Mid-Atlantic Severe Weather Event 28 September 2006 by Richard H. Grumm And Ron Holmes
 Cold frontal Rainband and Mid-Atlantic Severe Weather Event 28 September 2006 by Richard H. Grumm And Ron Holmes 1. INTRODUCTION A strong cold front moved across central Pennsylvania and the Mid-Atlantic
Indiana County Flash Flood of 22 June 2017
 Indiana County Flash Flood of 22 June 2017 By Richard H. Grumm National Weather Service State College, PA 1. Overview Slow moving thunderstorms brought 3 to 4 inches of rainfall to Indiana County, PA during
National Weather Service-Pennsylvania State University Weather Events
 National Weather Service-Pennsylvania State University Weather Events Western Windstorm of 1-2 December 2011-Draft by Richard H. Grumm National Weather Service State College PA 16803 Abstract:. A strong
Historic Eastern United States Winter Storm of January 2016: Record snow along the megalopolitan corridor 1. Introduction
 Historic Eastern United States Winter Storm of 22-24 January 2016: Record snow along the megalopolitan corridor by Richard H. Grumm National Weather Service State College, PA 16803 1. Introduction An historic
Devastating Tornadoes of 22 May 2011-Draft by Richard H. Grumm National Weather Service State College, PA
 Abstract: Devastating Tornadoes of 22 May 2011-Draft by Richard H. Grumm National Weather Service State College, PA A series of tornadoes struck the central United States on Sunday 22 May 2011. Tornadoes
Low-end derecho of 19 August 2017
 Low-end derecho of 19 August 2017 By Richard H. Grumm and Charles Ross National Weather Service State College, PA 1. Overview A cluster of thunderstorms developed in eastern Ohio around 1800 UTC on 19
1. INTRODUCTION. Hellström, SMHI. This includes all record highs and dates for Sweden. 2 Data provided by Jari Tuovinen, Helsinki, Finland.
 European Heat Event of July 2010 By Richard H. Grumm National Weather Service State College, PA 16803 Contributions by Jari Tuovinen Finnish Meteorological Institute 1. INTRODUCTION A significant heat
Southeastern Texas historic rain of 18 April 2016 by Richard H. Grumm and Charles Ross National Weather Service State College, PA 16803
 Southeastern Texas historic rain of 18 April 2016 by Richard H. Grumm and Charles Ross National Weather Service State College, PA 16803 1. Introduction Extremely heavy rainfall across southeastern Texas
5A.3 THE USE OF ENSEMBLE AND ANOMALY DATA TO ANTICIPATE EXTREME FLOOD EVENTS IN THE NORTHEASTERN U.S.
 5A.3 THE USE OF ENSEMBLE AND ANOMALY DATA TO ANTICIPATE EXTREME FLOOD EVENTS IN THE NORTHEASTERN U.S. Neil A. Stuart(1), Richard H. Grumm(2), John Cannon(3), and Walt Drag(4) (1)NOAA/National Weather Service,
Eastern Derecho June 2013-Draft
 Abstract: Eastern Derecho 12-13 June 2013-Draft Richard H. Grumm National Weather Service Office State College, PA 16803 A strong mid-tropospheric short-wave coming over a sharp 500 hpa ridge produced
In recent years, the use of tropospheric anomalies to
 Anticipating a Rare Event Utilizing Forecast Anomalies and a Situational Awareness Display The Western U.S. Storms of 18 23 January 2010 by Randy Graham, Trevor Alcott, Nanette Hosenfeld, and Richard Grumm
Heavy Rainfall and Flooding of 23 July 2009 By Richard H. Grumm And Ron Holmes National Weather Service Office State College, PA 16803
 Heavy Rainfall and Flooding of 23 July 2009 By Richard H. Grumm And Ron Holmes National Weather Service Office State College, PA 16803 1. INTRODUCTION Heavy rains fall over Pennsylvania and eastern New
This storm was associated with strong low-level easterly winds at 850 and 925 hpa. Stuart and Grumm (2006) document the value of using u-wind
 document the value of using u-wind") The Historic Mid-Atlantic Snow storm of 5-6 February 2010-Draft By Richard H. Grumm and John LaCorte National Weather Service Office, State College, PA 16803 1. INTRODUCTION A strong storm moved across
The Historic Mid-Atlantic Snow storm of 5-6 February 2010-Draft By Richard H. Grumm and John LaCorte National Weather Service Office, State College, PA 16803 1. INTRODUCTION A strong storm moved across
National Weather Service-Pennsylvania State University Weather Events
 National Weather Service-Pennsylvania State University Weather Events The southern Express: High Impact Spring Storm of 14-17 April 2011 by Richard H. Grumm National Weather Service State College PA 16803
09 December 2005 snow event by Richard H. Grumm National Weather Service Office State College, PA 16803
 09 December 2005 snow event by Richard H. Grumm National Weather Service Office State College, PA 16803 1. INTRODUCTION A winter storm produced heavy snow over a large portion of Pennsylvania on 8-9 December
Mid Atlantic Severe Event of 1 May 2017 Central Pennsylvania QLCS event By Richard H. Grumm National Weather Service, State College, PA 16803
 1. Overview Mid Atlantic Severe Event of 1 May 2017 Central Pennsylvania QLCS event By Richard H. Grumm National Weather Service, State College, PA 16803 A strong upper-level wave (Fig.1) moving into a
The St Patrick s Snow Storm of March 2007 By Richard H. Grumm National Weather Service Office State College PA 16803
 The St Patrick s Snow Storm of 16-17 March 2007 By Richard H. Grumm National Weather Service Office State College PA 16803 1. INTRODUCTION A complex March snowstorm struck the eastern United States on
Poorly Forecast Winter Storm of 2-3 March 2014-draft
 Poorly Forecast Winter Storm of 2-3 March 2014-draft Who would ve thought that non-linear chaotic systems are hard to predict : By Richard H. Grumm National Weather Service State College, PA 16803 1. Introduction
Mid Atlantic Heavy rainfall event 1. Overview 2. Methods and Data 3. Pattern
 1. Overview Mid Atlantic Heavy rainfall event With an inertial gravity wave? By Richard H. Grumm National Weather Service, State College, PA 16803 Contributions from the Albany MAP An unseasonably strong
A Synoptic Climatology of Heavy Precipitation Events in California
 A Synoptic Climatology of Heavy Precipitation Events in California Alan Haynes Hydrometeorological Analysis and Support (HAS) Forecaster National Weather Service California-Nevada River Forecast Center