State of polar boreal winter stratosphere ( ) The middle and upper regions of the atmosphere are now recognized as important and
|
|
|
- Marcia Lambert
- 5 years ago
- Views:
Transcription
1 CHAPTER 3 State of polar boreal winter stratosphere ( ) 3.1 Introduction The middle and upper regions of the atmosphere are now recognized as important and sensitive indicators of the polar middle atmosphere with changes in occurrence of phenomena such as polar mesospheric summer echoes (PMSEs), polar mesospheric clouds (PMCs) and noctilucent clouds (NLCs) being possible indicators of global climate change [Thomas, 1996; Shettle et al., 2002; Klostermeyer, 2002]. In spite of this, the polar middle atmosphere remains one of the least understood regions of the Earth s atmosphere. The importance of dynamics at high latitude is instrumental in determining the extent and timing of polar processes and ozone loss, since these processes are strongly dependent on temperature and vortex containment. In addition, dynamics plays a large role in determining the composition of the middle atmosphere via transport processes. The normal winter stratosphere circulation is qualitatively summarized below. After the fall equinox, the heating at high latitudes due to ozone absorption of UV radiation decreases as the polar night expands equatorward. Temperatures over the winter pole decline and strong westerlies develop, driven by the meridional temperature gradient between the equator and the pole and the Coriolis force. The core of strong westerly winds which thus forms in the upper stratosphere is called the polar vortex. The stratospheric polar vortex is the main dynamical feature of the winter middle atmosphere ( km) at middle and high latitudes. During 66
2 winter, on some occasions, strong perturbations in the temperature field occur which cause sudden rise in temperature in the stratosphere. As a result, a temporary summer condition is established in the stratosphere. Such a sudden rise in temperature in the stratosphere is identified as sudden stratospheric warming. The temperature rise appears primarily to be due to an increase in eddy transport of heat associated with a vertical flow of energy from the troposphere by planetary scale waves [Mahlman, 1969]. It is known to occur over middle and high latitudes. It was first discovered by Scherhag [1952] from sudden increase in the radiosonde 10 hpa temperature on 30 January 1952 over Berlin. It is seen as a latitudinal mean temperature increase poleward of 60 o N and associated circulation reversal at 10 hpa level or below. Major warmings do not occur every winter. They tend to occur every three or four years, but there have been several years in the past without a major warming. SSWs are most common in mid to late winter, but they have been observed as early as December in Northern Hemisphere. From the mid- 1950s to 1991, major warming occurred almost every other year, but between 1992 and 1998 there was no major warming. In this chapter, the winter stratospheric state is described using conventional zonal mean parameters such as temperature and zonal wind for the 16 Arctic winters since The characteristics of SSW events are studied in the context of different types of warming and their vertical structure. Long term studies provide a sound climatology and information about interannual variability in the winter middle atmosphere. The most common long term periodicities are associated with the 11 year solar cycle and the quasi biennial oscillation (QBO). It has been suggested that the stratosphere, in particular, the polar stratosphere, is a sensitive indicator for long term global 67
3 changes in the atmosphere. Thus, efforts are made to identify the relation between high latitude stratosphere on one hand and QBO and 11 year solar cycle on the other hand. 3.2 Classification of stratospheric warming Following the classification system of the stratospheric research group of the Free University (FU) of Berlin [Labitzke and Naujokat, 2000], a major stratospheric warming must have a zonal mean temperature increasing poleward from 60 o latitude and time-mean easterly wind poleward of 60 o latitude. The stratospheric circulation reversal means that the requirement for major stratospheric warming is a breakdown or splitting of the winter polar stratospheric vortex. Major warming occurs mostly in January or February. This type of warming is often referred to as wave-1 warming or wave-2 warming. If the zonal-mean zonal winds at 10 hpa level do not reverse, but the temperature increases by at least 25 K in a period of a week or less at any stratospheric level in any region of the winter hemisphere then the warming is called minor warming. It occurs every winter in both hemispheres. After the warming event, the polar stratospheric temperature decreases and the zonal winds accelerate eastwards returning the stratosphere back to a state typical of winter. However, a warming sometime can lead directly to a summer type circulation, with warmer polar stratospheric temperatures and westward zonal winds persisting even after the sudden warming event. In this case the warming is classified as final warming. Final warming events are common when SSW occurs towards the end of winter. 68
4 Another class of SSW is termed Canadian Warming. Canadian warming is characterized by strong wave-1 amplification in the middle stratosphere resulting in the Arctic vortex shifting off the pole towards Europe (i.e. away from Canada). Canadian warming rarely leads to a major stratospheric warming with zonal wind reversals having been observed only six times since regular observations began about 50 years ago [Manney et al., 2001]. 3.3 High latitude stratosphere during winter The middle atmosphere dynamics is characterized by a strong variability during winter which can lead to strong planetary wave activity and disturbances in the stratospheric circulation. This section examines various SSW events when MF radar data were available from the low latitude station Tirunelveli (8.7 o N, 77.8 o E). The warming events are classified in terms of their strength and duration. 69
5 70
6 71
7 72
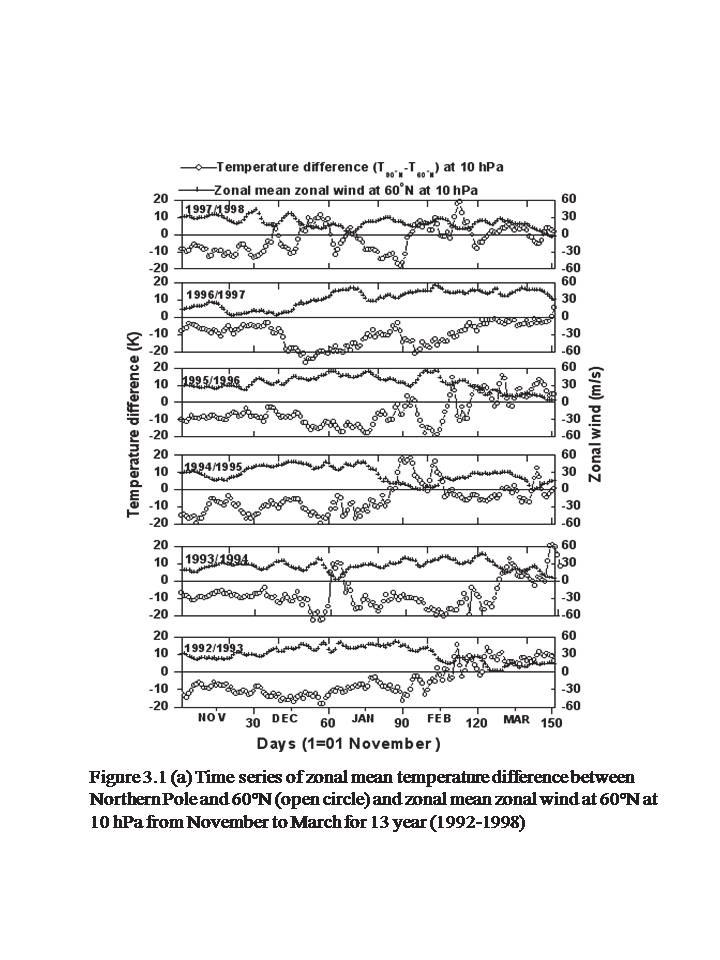
8 Figures 3.1(a) to (c) depict the daily zonal mean temperature difference between the North Pole and 60 o N and zonal mean zonal wind at 10 hpa from 1 November to 31 March for sixteen winters since During 1992/1993 winter shown in the bottommost panel of Figure 3.1 (a), there was a strong eastward wind at 60 o N (plus symbol) and cold condition (negative temperature) at 10 hpa (open circle) observed up to the end of January An abrupt increase in temperature of ~10 K was observed during end of February 1993 (day number 120). The zonal wind did not reverse then but it weakened considerably. No reversal was found during the entire observational period of 1992/1993. The response of temperature and zonal mean zonal wind for 1993/1994 winter is shown in the second panel from bottom of Figure 3.1(a). Cold condition that prevailed until end of December was followed by an increase in temperature from ~-20 K to ~12 K at the beginning of January The raise in temperature was accompanied by a weak eastward wind. The zonal wind did not show any reversal during this period. This winter serves as an example for a minor warming. During 1994/1995 winter (third panel from bottom of Figure 3.1(a)), there was a strong warm pulse magnitude of ~20 K noticed during the end of January and it sustained for a few days only. Strong eastward winds were observed till end of December that weakened considerably by end of January. This winter also did not show any significant reversal in the zonal wind in the stratosphere and also satisfies the criteria of minor warming. The 1995/1996 winter (fourth panel from bottom of Figure 3.1(a)) was similar to the previous winter but a series of warm temperature were observed between middle of February (day number 100) and March. No reversal in the zonal wind was observed but the eastward flow 73
9 weakened when a warm condition was observed in the stratosphere. The 1996/1997 winter (second panel from top of Figure 3.1(a)) showed a normal winter pattern of the polar stratosphere. The 1997/1998 winter (topmost on the left column of Figure 3.1(a)) showed a moderately raise in temperature of ~8K during the month of December (day number 55) accompanied by a weak eastward wind. No reversal was observed in the zonal wind at stratospheric heights. This was a minor warming event. Manney et al. [1999] reported that no major warming occurred for nine consecutive winters from till Results for 1998/1999 winter are shown in the bottommost panel of Figure 3.1(b). Two predominant warm temperatures were observed during this winter, the first one was during the middle of December (day number 46) and other one was during the end of February (day number 120). An eastward flow of ~40 m/s reversed to westward (-20 m/s) direction when the temperature attained its peak during middle of December This was considered as a major warming event that had occurred after a period of eight years, and only the second major warming that had ever been observed in early December [Manney et al., 1999]. This warming may also be regarded as a Canadian warming since it occurred in December. Canadian warming sometimes leads to major warming. Another rise in temperature began from -15 K to 20 K was observed during the end of February which is known to be final warming. During 1999/2000 winter (second panel from bottom in Figure 3.1 (b)), a cold condition was observed during the course of this winter. A strong wintertime eastward flow was found during this winter by Manney and Sabutis [2000] and Rex et al. [2004]. During 2000/2001 winter (third panel from bottom of Figure 3.1(b)), a sudden increase in temperature from -20 K to 15 K 74
10 was noticed during the middle of December (day number 50) that persisted for only three days. The wintertime eastward flow weakened. Another warming event of about 12 K was observed during the end of January (day number 88). Around this time the eastward wind decelerated and turned westward (-20 m/s). The reversal lasted more than a week. This winter was categorized as midwinter major warming. The 2001/2002 winter shown in the fourth panel from bottom on right column of Figure 3.1(b), had two dominant warm pulses. A steep increase in temperature of ~ 20 K was detected in the end of December (day number ~57) and the second pulse during the beginning of February. The December event was only the third major warming ever to be observed this early in a winter, along with December 1987 and December The eastward wind decelerated and reversed to weak westward flow (-5 m/s). Moreover, the reversal persisted only for two days in both of the cases. The 2002/2003 northern winter behaviour shown in the fifth panel from bottom on the right column of Figure 3.1(b) was characterized by stratospheric temperatures that were initially very low, although a major warming occurred during mid January dominated by a wave-2 planetary wave event [Kleinohl et al., 2004]. Minor warming was observed during January (day number 70) and February (day number 120) followed by a major warming. A zonal mean zonal wind reversal of -5 m/s at 10 hpa was associated with the warm condition whereas weak eastward wind was observed during minor warming. The 2003/2004 winter is shown in the topmost panel of Figure 3.1(b). There were two predominant positive temperatures of ~22 K observed during the end of December (day number 60) and during beginning of January (day number 70). In addition, warm condition continued more than two weeks of period during this winter. The eastward flow decelerated slowly during December and turned westward (-25 m/s) in 75
11 the beginning of January. This reversed wind persisted for more than a month in the polar stratosphere. Manney et al. [2005] summarized the prominent characteristics of the 2003/2004 events. Their results showed that this event was characterized by an extraordinarily long vortex disruption in the lower and middle stratosphere with strong and rapid recovery of the vortex in the upper stratosphere. The winter conditions during 2004/2005 depicted (bottommost panel in Figure. 3.1 (c)) showed a cold and strong polar vortex without any disturbance in the polar stratosphere. It was another example for normal wintertime polar stratosphere. These winter characteristics were described by Manson et al. [2008] and Manney et al. [2006]. During 2005/2006 winter (shown in the second panel from the bottom of Figure 3.1(c)), there were series of warming events, which can be inferred three sequential warming events were observed during January These warming events can be classified as major or minor depending on whether there is any wind reversal at latitude 60 o N. Though there are three successive warming events, only the third event is the major warming event, as it is accompanied by the reversal of zonal winds from eastward to westward. One of the strongest and most prolonged warming events on record began during January The winter of 2006/2007 is shown in the third panel from the bottom of Figure 3.1(c), in which the polar stratosphere was very cold during November-January. After the first week of February (day number 95), a rise in temperature of ~10 K accompanied by a weakening of eastward wind was observed. Another increasing temperature signal of more than ~10 K was noticed during the end of February 2007 (day number ~117) which persisted for several days whereas the weak eastward flow turned westward by the end of February. 76
12 In 2007/2008 winter, there were several disturbances that caused alternating occurrences of warming and cooling at 10 hpa heights during January and February and these features are shown in the fourth panel from the bottom in Figure 3.1(c). While the intense eastward wind was slowly decelerating from January 2008 onwards, it turned westward during end of February During 2008/2009 winter, a peak in the stratosphere temperature appeared during mid- January 2009 and is shown in the topmost panel in Figure 3.1(c). The zonal mean zonal wind shows a reversal from eastward to westward flow accompanied by enhanced temperature during mid-january The 2004 and 2006 SSW events were strong and long lasting [Manney, et al., 2005]. The diagnostic results depicted in Figure 3.1(c) show that the intensity of the SSW in 2009 surpassed that during 2004 and 2006 and had a more profound and lasting effect on the lower stratosphere [Manney et al., 2010]. 3.4 Vertical structure of temperature and zonal wind driven by SSW events One of the well known characteristics of the SSW event is the downward progression of a warm layer from about 45 km to the lower stratosphere. The SSW disturbance appears to move downward because of the secondary circulation driven by the wave interaction with the critical level that extends below the level of wave breaking, decelerating the mean flow below the wave breaking zone. The extension of the secondary circulation below the level of wave breaking is sometimes called downward control. It is important to study the vertical structure of temperature and zonal wind during major SSW events. Here, four major warming events are discussed in this context. 77
13 3.4.1 Major warming during 1998/1999 The bottom panel of Figure 3.2 shows the time-pressure cross section of the United Kingdom Meteorological Observation (UKMO) zonal mean zonal wind, while the upper panel shows the zonal mean temperature difference between North Pole and 60 o N. The altitude variation in the range 20 to 55 km (31-0.3hPa) is investigated. Figure 3.2 shows that during normal winter conditions, the stratosphere is dominated by a negative temperature gradient and strong eastward zonal mean zonal wind. During disturbed condition, a positive temperature difference (warm) was observed between day numbers 43 and 55 and between day numbers 115 and 125. The first of them occurred around day number 48 and propagated down to lower stratosphere (31hPa). This disturbance was accompanied by a reversal in the eastward wind (bottom panel of Figure 3.2). The second one was centered on day number 120 and it propagated down to lower stratosphere. The wintertime eastward flow turned westward around day number 120. After day number 125, the warm condition reverted to normal winter condition whereas the normal wintertime eastward flow was observed little later on day number 135. The first one is an example for a Canadian warming event and the second one for final warming. Figure 3.2 also reveals that the downward penetration of disturbance in the stratosphere occurred at all levels in the same time and this effect was visible in both the component. 78
 and zonal mean zonal wind at 60 o N (bottom plot) from 01 November 1998 to 31 March 1999.")
14 Figure.3.2.Pressure-time cross section of the UKMO zonal mean temperature difference between pole and 60 o N (upper plot) and zonal mean zonal wind at 60 o N (bottom plot) from 01 November 1998 to 31 March Major warming during 2003/2004 Figure 3.3 shows an enhanced temperature gradient can be noticed between day number 45 and 70. During 2003/2004, three warm pulses were observed. The first of them occurred around day number 45 and reached only ~40 km (3.5 hpa) height. This disturbance was accompanied by a rapid deceleration of the zonal mean zonal wind (bottom panel of Figure 3.3). The second pulse was centered on day number 55 and was the strongest among the three 79
 height then.")
15 observed between day numbers 30 and 70. The effects were visible down to 31 hpa. The zonal mean circulation decelerated rapidly towards west around day number 50. Figure 3.3 Same as Figure 3.2 except for the time interval 01 November 2003 to 31 March The reversal of the zonal mean zonal wind, however, did not extend below 3 hpa (~ 40 km) height then. The third warm pulse prevailed between day numbers 60 and 70 and it was accompanied by another reversal of mean zonal flow that extended down to 31 hpa. The zonal mean zonal wind became westward at 10 hpa over 60 o N around day number 65. After around day number 70, the stratospheric temperature gradually decreased and the westward circulation reverted to eastward. Another reversal of the mean circulation occurred around day number 90 and the disruption of the polar vortex is noticed ~24 km (~31 hpa) during this winter. Quiroz 80
![[1971] suggested that the disturbance started in the upper stratosphere (> 40 km) and moved down to lower heights. From Figure 3.](/docs-images/94/121339798/images/16-0.jpg "3, it is observed that there was a time delay between the variations in the zonal mean zonal wind (bottom panel of Figure 3.3) from higher to lower heights. Figure 3.4 Cross-correlation between UKMO zonal mean zonal wind at 0.")
16 [1971] suggested that the disturbance started in the upper stratosphere (> 40 km) and moved down to lower heights. From Figure 3.3, it is observed that there was a time delay between the variations in the zonal mean zonal wind (bottom panel of Figure 3.3) from higher to lower heights. Figure 3.4 Cross-correlation between UKMO zonal mean zonal wind at 0.15 hpa and pressure level between 31 to 0.15 hpa for the period 01 December 1998 to 30 January In order to investigate the delay in detail, a cross correlation analysis was performed between the zonal mean zonal wind at 0.1 hpa pressure level (~64 km) and all other pressure levels for the disturbed period (between day number 31 and 92). Figure.3.4 shows the contours for the cross correlation function in the altitude range of km with a maximum time lag of 30 days. From Figure 3.4, it may be inferred that there was no delay up to 40 km and a delay of ~3 days was present at an altitude of 30 km. The secondary maxima situated at time lags +20 days indicate the presence of planetary wave disturbances noticeable in the UKMO zonal mean zonal wind (bottom plot of Figure 3.3). 81
17 3.4.3 Major warming during 2005/2006 Figure 3.5 depicts the same parameters as in Figure 3.3 except for the period 01 November 2005 to 31 March As can be seen in Figure.3.5, three sequential warm pulses were observed between day numbers 60 and 95. This event was identical to the SSW event that occurred during 2003/2004 winter. The first warm pulse occurred around day number 62 and it reached only 3.4 hpa (~40 km) level. The eastward wind decelerated rapidly but did not turn westward. The second warm pulse occurred around day number 75 and it extended down to 31 hpa (24 km). This was accompanied by a reversal of eastward wind at 3 hpa. The third and final warm pulse that occurred on day number 86 which was the strongest of the three penetrated down to lower stratospheric heights (~31 hpa). The westward wind regime persisted up to day number 110. After day number 120, the existing temperature and zonal mean zonal wind conditions were replaced by normal winter conditions. The results presented in Figure 3.5 show that as the wind regime descended downwards, their magnitudes reduced similar to 2003/2004 winter. This event was also characterized by downward penetration of disturbances in the stratosphere with some time delay with respect to the upper levels. 82

18 Figure 3.5 depicts same as Figure.3.3 except for 01 November 005 to 31 March 2006 In order to obtain further information on this behaviour, a cross correlation analysis was applied to the zonal mean zonal wind for the disturbed period of 50 days during this winter. It is noticed in Figure 3.6 this was similar to the 2003/2004 event except that the time delay at 32 km was ~6 days. This provides credence to the hypothesis that SSW disturbance propagates from higher altitudes to lower levels. 83

19 Figure 3.6 depicts same as Figure.3.4 but from 01 January 2006 to 20 February Major warming during 2007/2008 Figure 3.7 is similar to Figure 3.4 except for the period 1 November 2007 to 31 March The polar stratosphere was relatively quiet until late January when it warmed up quickly and several episodes of SSW occurred then. The zonal mean temperature increased up to 30 K within a couple of days before end of January 2008 at 10 hpa. Four warm pulses were observed during this winter. The first warm pulse occurred on day number 85 and it extended to lower to stratosphere pressure level of~14 hpa (top panel in Figure 3.7). The eastward wind regime reversed to westward but reached only down to 6 hpa (35 km). The third and fourth warming events were observed during the end of February (day number 115) and they reached the lower stratosphere. The fourth was the strongest of all and was accompanied by a reversal of zonal wind at the lowest pressure level (31 hpa). 84

20 Figure 3.7 same as Figure.3.5 but for 01 November 2007 to 31 March 2008 The westward wind regime persisted in the lower stratosphere after the withdrawal of major warming event. All the warm pulses and the wind regime associated with them showed the downward progression in the respective parameters. From Figure 3.8, it can be concluded that there was no significant delay as in previous cases. 85
.")
21 Figure 3.8 same as Figure.3.4 but for 14 January 2008 to 03 March Major warming during 2008/2009 Figure 3.9 depicts the results for the time interval from 1 November 2008 to 31 March Two warm pulses were observed around day number 50 and day number 85. The first warm pulse occurred at higher heights (50 km). The final warm pulse occurred on day number 85 and it was strongest of the two and penetrated down to the lower stratosphere (~31 hpa). There was a transition to zonal mean westward flow when the temperature attained its peak. The westward circulation continued till the end of February 2009 when the temperature reverted back to normal winter condition. This was similar to the 2005/ 2006 event. 86

22 Figure 3.9 similar to Figure 3.5 except for 01 November 2008 to 31 March 2009 The results from the cross correlation function of this winter 2008/2009 was plotted in Figure 3.10 shows a behaviour similar to 2005/2006 event except that the delay at 30 km was ~5 days. Secondary maxima noticed around time lags of 12 to 15 days are attributed to the presence of the planetary wave disturbances visible in the UKMO zonal mean zonal wind (bottom panel of Figure 3.9). The differences and similarities between the dynamics of 2006 and 2009 SSW events are now discussed. The breakdown of vortex was wave -1 type during 2006 and wave- 2 type during The zonal mean zonal wind at 60 o N decelerated rapidly in 2009 compared to In 87

23 2006, the normal stratospheric winter conditions occurred very late after warming compared to These differences in dynamics were consistent with differing characteristics of vortex split and vortex displacement described by Charlton and Polvani, During 2006, the disturbance exhibited downward progression and there was time delay in the lower stratosphere with respect to the upper stratosphere level. Figure 3.10 same as Figure.3.4 but for 01 January 2009 to 19 February Sudden stratospheric warming (SSW) and its relation with QBO phase The occurrence of SSW is significantly affected by other forcing: agents such as the quasi-biennial oscillation (QBO), the 11-year solar cycle and sea surface temperature (SST) anomalies. These forcings influence the variability of extratropical stratosphere. The dominant source of variability in the tropical stratosphere is the QBO, which involves the quasi-periodic reversal of zonal winds from westerly to easterly and back again. Theory shows that due to interaction between planetary waves and zonal mean winds, the zonal winds exhibit alternating 88
24 patterns of westerly and easterly winds that repeat every 26 months on average. Several observational reports show that the equatorial QBO has significant effects on high latitude stratospheric circulation (Holton and Tan 1980, 1982 Baldwin and Dunkerton 1991n Baldwin et al 2001 and few). When the QBO is in its westerly phase in the tropical lower stratosphere, the planetary waves are refracted away from polar region towards the tropics. The stratospheric polar vortex should therefore be cold and strong because of the absence of wave forcing. On the other hand, when the QBO is in easterly phase, the waves are more confined to middle and polar latitudes. The polar vortex will be warmer and weaker and therefore is more susceptible to be broken down by SSWs. The phase of the QBO effects the both the position of the zero wind line and the structure of the zonal mean wind field. The Northern Hemisphere (NH) winter temperature and circulation are likely to be influenced both by the QBO and the 11 year solar cycle. The mechanisms of the interaction of the QBO with the polar stratosphere have been analyzed statistically, and yet many of the reported observational results have not been explained. For example, Holton and Tan [1980] have shown observational evidence that the QBO modulates the extratropical circulation at 50 hpa, and they speculate that the latitudinal shift of the critical line (u=0) might be an important link between the QBO and high latitude circulation. The hypothesis of Holton and Tan [1980] was motivated by the analysis of 16 years of National Meteorological Center (NMC) data ( ) in which they presented statistical evidence for the association between QBO and the extratropical flow. By compositing the data according to the phase of the QBO at 50 hpa, they showed westerly phase of the QBO (QBO-W) to be associated with anomalously low 50 hpa geopotential height at high latitudes corresponding to a strong polar vortex in both early (Nov- 89
25 Dec) and late (Jan-Mar) Northern Hemisphere winter. Anomalies of the opposite sense were associated with the easterly QBO phase (QBO-E). This correlation between QBO and stratospheric polar vortex was referred to as the HT effect. Labitzke [1977] investigated the interannual variability of the Northern Hemisphere winter using zonal harmonic wave analysis of daily 30 hpa temperatures. She identified the characteristics of disturbed winter months and undisturbed months. The undisturbed patterns were frequently observed during the QBO westerly phase. In contrast major stratospheric warmings were shown to occur during QBO easterly phase. Labitzke and Van Loon [1988] have shown that the major warming occurred during solar maximum with QBO westerly phase and during solar minimum with QBO easterly phase. As the zero wind line moves more poleward during easterly QBO, the easterly waveguide for stationary waves is narrowed and located more poleward. This tends to focus the planetary waves more poleward, making the polar vortex more disturbed and hence the region warmer. A physical mechanism for a solar cycle influence on polar variability was suggested by Kodera [1991, 1995], who analyzed 12 years of Northern Hemisphere extratropical NMC data and concluded that the four different combinations of QBO and solar cycle phase (Westerly/maximum, Westerly/minimum, Easterly/maximum and Easterly/minimum) appeared to induce different patterns of anomalous stratospheric mean zonal wind in early winter, which then became similar pattern in late winter. He suggested that the early winter influence of those forcings at low latitudes in the upper stratosphere created a polar signal by means of downward and poleward propagation of the mean zonal wind anomaly due to wave-mean flow interaction. Baldwin and Dunkerton [1991] diagnosed QBO-extra-tropical correlations using 13 years of NMC data extending up to 1hPa. They showed high correlation in the layer above 10hPa 90
26 extending from Northern Hemisphere polar latitudes to 30 o S and altitudes covering the whole depth of the extratropical stratosphere. Figure 3.11(a) Time- series of JF NP temperature anomalies (K) at 24 km (dotted line) and zonal wind anomalies at 24 km (solid line), (b) Scatter plot of the data, (c-d) similar to (a and b) except for 1993 to In order to explore the possible links between observed polar temperature and QBO winds during winter, averaged January and February North pole temperature anomalies at 24 km for the time interval of and and equatorial wind anomalies at 24 km over the same time interval are plotted in Figure The anomalies were derived by subtracting the mean value over the period from each point. It is seen in the top panel of Figure 3.11 that the polar temperature anomaly was positive (warmer conditions) during the westward phase of QBO winds and negative (colder conditions) in the eastward phase of the QBO winds. 91
27 The JF North Pole temperature anomalies and equatorial zonal wind anomaly at 24 km are anti-correlated during the periods , , , , and and there was no relationship noticed during the winter of The bottom panel of Figure 3.11 shows the scatter plot for these two parameters. The correlation coefficient was during and -0.4 during The Holton-Tan relationship of negative correlation between the two signals is found to hold only for certain winters and not for other winters. In Figure 3.11, the periods of Holton-Tan (i.e., negative) correlation tend to coincide with periods under the solar minimum conditions and the periods in which Holton-Tan relation is reversed tend to coincide with periods during solar maximum conditions. In the lower stratosphere the solar signals are mainly dynamical in origin. A direct influence of dynamics on the temperature fields is reinforced by anomalous ozone transport during solar maximum. Lu et al. [2009] suggested that the anomalies in this region may involve SSWs and anomalous wave forcing in the polar region. During solar maximum/eastward QBO years there are anomalously more SSWs occurring due to stronger poleward propagating planetary waves, hence greater equatorial upwelling. The anomalously stronger equatorial upwelling during solar maximum counteracts the anomalous eastward QBO descent. It results in weaker solar signals in the tropical lower stratosphere. During solar minimum/westward QBO phase years there are also more SSWs occurring in the lower stratosphere, mainly due to stronger poleward wave forcing under westward QBO phase [Holton and Tan 1980, 1982, McIntyre 1982, Lu et al., 2008]. However, the increased equatorial upwelling due to SSWs reinforces the anomalous QBO upwelling and hence the overall solar influence is strengthened in the equatorial lower stratosphere. Recently, Labitzke et al. [2009] observed opposite correlation in two 92
28 different phases of the QBO between geopotential height on February at 30hPa and 10.7 cm solar flux, while the winters in the east phase of the QBO are negatively correlated and the winters in the west phase are positively correlated. It still does not explain why we observe more SSWs during solar maximum/eastward QBO phase and solar minimum/westward QBO phase years in the mid and lower stratosphere and why planetary waves respond to the 11 year solar cycle differently in the early and late winters. Thus further research is needed to investigate the mechanism of the solar-qbo influence on the Northern Hemisphere polar winter stratosphere. 3.6 SSW impact on ENSO A major source of tropospheric variability is the El Nino Southern Oscillation phenomenon (ENSO). ENSO is one of the primary circulation patterns at equatorial latitudes and affects climate worldwide. Since strong El-Nino events are connected with more clouds over the tropical Pacific, this also leads to cooling of the tropopause region and lowermost stratosphere. This in turn during winter reduces the temperature gradient between lower latitudes and the polar vortex, weakens the later and enhances the probability of major stratospheric warming [Van Loon and Labitzke, 1987]. On average the polar stratospheric vortex is weaker during El- Nino years than it is during La-Nino years. Shiogama and Mukougawa [2005] suggested that ENSO has a significant effect on the life cycle of SSWs. The stratospheric wavenumber 1 wave is responsible for the onset of SSWs during the warm winters of ENSO. On other hand wavenumber 2 component also becomes important during cold winters. Kodera and Yamada [2004] observed that a major warming of the Southern Hemisphere in September 2002 produced a north-south sea-saw of tropical convection activity. Kodera [2006] also noted similar features 93
29 in his composite analysis of twelve major warming events that occurred at high latitude Northern Hemisphere. In this section, the SSW events that occurred during the years and are considered with the goal of investigating changes in convective activity, if any, over the equatorial region. It is known that the effect of SSWs propagates down to the troposphere within a few weeks and can last longer than two months [Baldwin and Dunkerton, 2001]. To identify the SSW events, UKMO data are used. A description of UKMO data set is provided in the earlier chapter. Besides, interpolated outgoing long-wave radiation (OLR) data are used in the present study and were obtained from the Climate Diagnostic Center (CDC) of NOAA. This parameter (OLR) is used as an indicator of deep convection in the tropical region [Liebman and Hartmann, 1982]. Kuroda [2008] used daily reanalysis data to analyze SSWs and their impact on the tropospheric climate. In the present study, we focus on the impact of the SSW on the stratosphere and troposphere in shorter time scales. We use unfiltered daily data with an assumption that the time scales associated with the SSW event can be quite short involving relatively fast interactions between the stratosphere and troposphere. Figure 3.12 (a) and (b) show the state of the winter hemisphere at 10 hpa, 1 hpa and 0.1 hpa for days starting from 01 November The SSW event may be identified from the positive poleward temperature difference at 10 hpa during day numbers (19 December January 2004) with a maximum temperature difference of 27 K occurring on day number 58 (Figure 3.13 (a)). This was a major warming event, as winds decelerated after day number 40 from 48 m/s, turned westward and attained a maximum speed of 38 m/s on day number 53 (Figure 3.12 (b)). The westward winds again turned eastward for about a week and 94
30 later changed to westward flow reaching a maximum speed of 20 m/s on day number 66. Though the event was identified at 10 hpa as per WMO definition [Quiroz, 1979], the warming events occurred earlier at 1 hpa and 0.1 hpa around day number 42. It may be noted that the largest temperature difference of ~40 K was observed at 1 hpa on day number 46, whereas it was only ~27 K at 10 hpa. Manney et al. [2005] summarized the prominent characteristics of the Northern Hemisphere winters. Their results showed that this warming event was characterized by an extraordinarily long vortex disruption in the lower and middle stratosphere, with strong and rapid recovery of the vortex in the upper stratosphere. As discussed earlier, the meridional circulation associated with any warming event is expected to induce upwelling in the equatorial region. As OLR has been used as a proxy for tropical convection, the time variation of zonal mean OLR averaged for equatorial northern hemisphere (ENH) (5 N-15 N), equator (EQ) (5 S-5 N) and equatorial southern hemisphere (ESH) (5 S-15 S) is compared with that of poleward temperature difference. It is observed that the zonal mean OLR (Figure 3.12 (c)) do not show any notable relationship with the SSW event and they just show an increasing tendency over ENH and decreasing tendency over equator and ESH. Figure 3.12 (d-e) shows results for the time interval of days from 1 November During this period, the temperature difference between the latitudes 90 N and 60 N reveals that there are series of warming anomalies, which can be inferred from the positive temperature difference at 10 hpa on day numbers 64 66, 69-80, and (Figure 3.12 (d). Large temperature differences of 16 K, 20 K and 32 K were observed on day numbers 65, 72 and 83 during the three warming cases, respectively. Though there were three successive warm 95
31 pulses, only the third was the major warming event, as it was accompanied by the reversal of zonal winds from eastward to westward (Figure 3.12 (e). 96
 zonal mean NOAA OLR (d) 90 o E-150 o E mean NOAA OLR averaged for the latitudes 5 o S-15 o S, 5 o N- 15 o N and 5 o S-5 o N for the time interval of 1-120 day starting from 01 November")
32 Figure.3.12 (a) UKMO zonal mean temperature difference between latitude 90 o N and 60 o N, (b) UKMO zonal mean zonal wind at 60 o N for pressure levels 10hPa, 1hPa and 0.1 hpa, (c) zonal mean NOAA OLR (d) 90 o E-150 o E mean NOAA OLR averaged for the latitudes 5 o S-15 o S, 5 o N- 15 o N and 5 o S-5 o N for the time interval of day starting from 01 November (e-h) Same (a-d) except for 01 November
33 The zonal mean wind at 60 N started decelerating after day number 55 (25 December 2005), reversed its direction to westward on day number 82 (21 January 2006), attained maximum westward wind of 26 m/s on day number 87 (26 January 2006) and reversed again to eastward direction on day number 109 (17 February 2006). Stronger warming is noticed in this case at 10 hpa than at 1 hpa and 0.1 hpa. The 2006 SSW event was a remarkable event with extended period of nearly one month of polar vortex disruption and zonal wind reversal observed in the lower and middle stratosphere [Manney, et al., 2008]. It was a polar vortex displacement event, whereas the one of 2009 was the polar vortex split event [Manney et al., 2009]. The daily zonal mean OLR shows a decreasing trend over equator and ESH whereas it shows an increasing trend over ENH (Figure 3.12 (e)). We compared the time variation of poleward temperature difference with the longitudetime cross section of ENH, EQ and ESH OLR and found that lower OLR prevailed in the longitude band E in relation with both the SSW events (not shown). In other longitudes, no notable relationship exists between OLR and stratospheric poleward temperature difference. In the case of , the equatorial OLR averaged for E shows large convective activity (<200 W/m 2 OLR) during day numbers with the lowest OLR value of 169 W/m 2 on day number 50 (Figure 3.13 (d)). It may be recalled that though peak warming day occurred at 10 hpa on day number 58, the onset of warming started much earlier at higher heights (1 hpa) on day number 43 and the peak warming (40 K) was observed on day number 46 (Figure 3.12 a). The ESH also shows less OLR value with the lowest being 190 W/m 2 on day number 48. The ENH shows convective activity, but relatively less when compared to ESH and EQ. 98
34 We performed lag-correlation analysis between stratospheric polar temperature difference and OLR over equator. Figure 3.13 shows the lag-correlation coefficient between temperature difference between the latitudes 90 N and 60 N at 10 hpa and 1 hpa and negative OLR averaged for 5 S-15 S (ESH), 5 N-15 N (ENH) and 5 N-5 S (EQ) for November 2003-January 2004 and December 2005-February We obtained correlation coefficients (CCs) of -0.5, -0.5 and -0.3 between the time variation of poleward temperature difference at 1 hpa and that of negative OLR variations at ENH, EQ and ESH for the period 01 November January of 2004, respectively. The correlation improves slightly, with a lag of 3-4 days. Similarly for the case of also, we obtained CCs of -0.6, -0.4 and -0.4 between the time variation of poleward temperature difference at 1 hpa and that of OLR variations at ENH, EQ and ESH for the period 01 December March In both cases, the poleward temperature difference at 10 hpa does not show noticeable correlation with equatorial OLR at zero lag. However, with a lag of 5 days, the CC increases to 0.5 and 0.35 with the ESH OLR, respectively, for the cases and
 and negative NOAA OLR at 10 hpa (left panel) and 1 hpa (right panel), a proxy for tropical convection")
35 Figure 3.13 Lag-correlation coefficient between UKMO temperature difference (between 90 o N and 60 o N) and negative NOAA OLR at 10 hpa (left panel) and 1 hpa (right panel), a proxy for tropical convection averaged for 5 o S-15 o S (ESH), 5 o N-15 o N (ENH) and 5 o S-5 o N (EQ) for November 2003-January 2004 (top panel) and December 2005-Februay 2006 (bottom panel). 3.7 Discussion Stratospheric major sudden warmings were detected using NCEP Reanalysis data for seventeen years ( ) in the Northern Hemisphere winter (November to March), Major sudden warming was defined when the temperature gradient between the pole and 60 o N is positive and the zonal mean zonal wind at 60 o N is negative (representing westward flow) at 10 hpa when the temperature gradient is positive. Nine major warmings were selected during 18 years. The vertical structure of major warming features observed during these events reveals that 100
36 the changes in zonal mean temperature gradient and zonal mean zonal wind occur first in the upper stratosphere and penetrate down with some delay to the lower heights. The delay is particularly noticeable below 40 km. The correlations during winters 2005/2006 and 2008/2009 were very similar, which perhaps due to congruities in their winter stratospheres such as the occurrence of a major warming, continuous and numerous disturbances, and consecutive and cumulative reversals of zonal mean zonal wind from westerly to easterly. Among the nine warmings, five occurred during the westward phase of the QBO, three occurred during the eastward phase and one during the QBO phase reversal period. In the case of major warmings, the largest warm anomaly observed when the QBO phase was west but in the case of minor warming the large warm anomalies was observed when the QBO was in eastward phase. In addition, we have also examined the SSW-QBO-solar cycle relationship in the Northern Hemisphere winter by using daily NCEP reanalysis data. It is found that the QBOsolar cycle relationship holds in both temperature and zonal wind anomalies throughout the period and the solar signals primarily occur in late winter (February). In polar temperature anomaly, positive solar signals are found in the lower and middle stratosphere during eastward phase of QBO whereas in the zonal wind anomaly, negative signals are found in the middle stratosphere under eastward phase of QBO. It seems that the QBO east phase locks the occurrence of the major warming and solar maximum has an unlocking effect on the role of the QBO east phase. The results for the entire data set confirm the earlier findings and demonstrate the significant effect that the solar cycle changes have on the polar stratosphere temperature and on the meridional circulation. The major SSW events that occurred during the years and were considered to investigate changes in the equatorial troposphere in response to the circulation 101
37 changes caused by the SSW events. Results obtained in the present study pertain to the time variation of poleward temperature difference at 10hPa, 1hPa and 0.3hPa, OLR over Equatorial Northern Hemisphere (ENH), Equatorial EQ and Equatorial Southern Hemisphere (ESH). The increase in the poleward temperature difference at 1 hpa is accompanied by a decrease in OLR over EQ and ESH averaged for the longitudes 90 o E-150 o E (Indonesian sector) indicating the development of deep convective activity The time variation of OLR values suggest that ENH also shows high, but relatively less convective activity than the EQ and ESH. Kodera and Yamada [2004] investigated the impact of Southern Hemispheric major SSW that occurred during September 2002 on the Hadley circulation. They found that the warming event induced equatorial upwelling and polar downwelling and noted that the impact on the average intensity of the convective activity was very small. They also observed that the convective activity in the equatorial region shifted towards Southern Hemisphere following the SSW. Similar results were obtained by Kodera [2006] in the composite analysis of 12 Northern Hemispheric stratospheric warming events that showed that the convection in the ENH decreases and that over ESH increases following the SSW event. Unlike the inferences made earlier by Kodera [2006], the present study (see Figure 3.12) shows that the zonal mean OLR decreases (increases) with time indicating more (less) convective activity over ESH (ENH), which merely shows the southward migration of inter-tropical convergence zone and but no notable relationship with major SSW events. The results of the present study also show that the convective activity in both hemispheres over Indonesian sector drastically decreases, which can be noted by an increase in OLR after the warming event. 102
Impact of the 2002 stratospheric warming in the southern hemisphere on the tropical cirrus clouds and convective activity
 The Third International SOWER meeting,, Lake Shikotsu,, July 18-20, 2006 1 Impact of the 2002 stratospheric warming in the southern hemisphere on the tropical cirrus clouds and convective activity Eguchi,
Interannual Variability of the Wintertime Polar Vortex in the Northern Hemisphere Middle Stratosphere1
 February 1982 j. M. Wallace and Fong-Chiau Chang 149 Interannual Variability of the Wintertime Polar Vortex in the Northern Hemisphere Middle Stratosphere1 By John M. Wallace and Fong-Chiau Chang Department
What kind of stratospheric sudden warming propagates to the troposphere?
 What kind of stratospheric sudden warming propagates to the troposphere? Ken I. Nakagawa 1, and Koji Yamazaki 2 1 Sapporo District Meteorological Observatory, Japan Meteorological Agency Kita-2, Nishi-18,
Influences of the 11-year sunspot cycle on the stratosphere and the importance of the QBO
 Influences of the 11-year sunspot cycle on the stratosphere and the importance of the QBO Karin Labitzke, Institute for Meteorology, F.U. Berlin Germany (Labitzke and van Loon, numerous papers, 1987 2006)
On the Interannual Variability of the Middle Stratosphere during the Northern Winters. By Karin Labitzke
 124 Journal of the Meteorological Society of Japan Vol. 60, No. 1 On the Interannual Variability of the Middle Stratosphere during the Northern Winters By Karin Labitzke Institut fur Meteorologie, Freie
On the remarkable Arctic winter in 2008/2009
 JOURNAL OF GEOPHYSICAL RESEARCH, VOL. 114,, doi:10.1029/2009jd012273, 2009 On the remarkable Arctic winter in 2008/2009 K. Labitzke 1 and M. Kunze 1 Received 17 April 2009; revised 11 June 2009; accepted
Observational responses of stratospheric sudden warming to blocking highs and its feedbacks on the troposphere
 Article SPECIAL ISSUE: Extreme Climate in China April 2013 Vol.58 No.12: 1374 1384 doi: 10.1007/s11434-012-5505-4 SPECIAL TOPICS: Observational responses of stratospheric sudden warming to blocking highs
Atmospheric Responses to Solar Wind Dynamic Pressure
 Atmospheric Responses to Solar Wind Dynamic Pressure Hua Lu British Antarctic Survey Outline Background: Sun-Earth Climate Connection Solar wind/geomagnetic activity signals with 3 examples stratospheric
Change in Occurrence Frequency of Stratospheric Sudden Warmings. with ENSO-like SST Forcing as Simulated WACCM
 Change in Occurrence Frequency of Stratospheric Sudden Warmings with ENSO-like SST Forcing as Simulated WACCM Masakazu Taguchi* and Dennis L. Hartmann Department of Atmospheric Sciences, University of
ENSO Cycle: Recent Evolution, Current Status and Predictions. Update prepared by Climate Prediction Center / NCEP 23 April 2012
 ENSO Cycle: Recent Evolution, Current Status and Predictions Update prepared by Climate Prediction Center / NCEP 23 April 2012 Outline Overview Recent Evolution and Current Conditions Oceanic Niño Index
Extremely cold and persistent stratospheric Arctic vortex in the winter of
 Article Atmospheric Science September 2013 Vol.58 No.25: 3155 3160 doi: 10.1007/s11434-013-5945-5 Extremely cold and persistent stratospheric Arctic vortex in the winter of 2010 2011 HU YongYun 1* & XIA
The Stratospheric Link Between the Sun and Climate
 The Stratospheric Link Between the Sun and Climate The Stratospheric Link Between the Sun and Climate Mark P. Baldwin Northwest Research Associates, USA SORCE, 27 October 2004 Overview Climatology of the
Solar cycle signal in a general circulation and chemistry model with internally generated quasi biennial oscillation
 Click Here for Full Article JOURNAL OF GEOPHYSICAL RESEARCH, VOL. 115,, doi:10.1029/2009jd012542, 2010 Solar cycle signal in a general circulation and chemistry model with internally generated quasi biennial
The feature of atmospheric circulation in the extremely warm winter 2006/2007
 The feature of atmospheric circulation in the extremely warm winter 2006/2007 Hiroshi Hasegawa 1, Yayoi Harada 1, Hiroshi Nakamigawa 1, Atsushi Goto 1 1 Climate Prediction Division, Japan Meteorological
High initial time sensitivity of medium range forecasting observed for a stratospheric sudden warming
 GEOPHYSICAL RESEARCH LETTERS, VOL. 37,, doi:10.1029/2010gl044119, 2010 High initial time sensitivity of medium range forecasting observed for a stratospheric sudden warming Yuhji Kuroda 1 Received 27 May
Overview of the Major Northern Hemisphere Stratospheric Sudden Warming: Evolution and Its Association with Surface Weather
 NO.4 LIU Yi and ZHANG Yuli 561 Overview of the Major 2012 2013 Northern Hemisphere Stratospheric Sudden Warming: Evolution and Its Association with Surface Weather LIU Yi 1 ( ) and ZHANG Yuli 1,2 ( ) 1
Influences of the 11-year sunspot cycle on the stratosphere and the importance of the QBO
 (Solar Variability, Earth s Climate and the Space Environment; Bozeman, Montana, June 2008) Influences of the 11-year sunspot cycle on the stratosphere and the importance of the QBO Karin Labitzke, Institute
Eurasian Snow Cover Variability and Links with Stratosphere-Troposphere Coupling and Their Potential Use in Seasonal to Decadal Climate Predictions
 US National Oceanic and Atmospheric Administration Climate Test Bed Joint Seminar Series NCEP, Camp Springs, Maryland, 22 June 2011 Eurasian Snow Cover Variability and Links with Stratosphere-Troposphere
The North Atlantic Oscillation: Climatic Significance and Environmental Impact
 1 The North Atlantic Oscillation: Climatic Significance and Environmental Impact James W. Hurrell National Center for Atmospheric Research Climate and Global Dynamics Division, Climate Analysis Section
P4.2 THE THREE DIMENSIONAL STRUCTURE AND TIME EVOLUTION OF THE DECADAL VARIABILITY REVEALED IN ECMWF REANALYSES
 P4.2 THE THREE DIMENSIONAL STRUCTURE AND TIME EVOLUTION OF THE DECADAL VARIABILITY REVEALED IN ECMWF REANALYSES Taehyoun Shim 1, Gyu-Ho Lim* 1 and Dong-In Lee 2 1 School of Earth and Environmental Sciences,
The stratospheric response to extratropical torques and its relationship with the annular mode
 The stratospheric response to extratropical torques and its relationship with the annular mode Peter Watson 1, Lesley Gray 1,2 1. Atmospheric, Oceanic and Planetary Physics, Oxford University 2. National
The Planetary Circulation System
 12 The Planetary Circulation System Learning Goals After studying this chapter, students should be able to: 1. describe and account for the global patterns of pressure, wind patterns and ocean currents
On the Control of the Residual Circulation and Stratospheric Temperatures in the Arctic by Planetary Wave Coupling
 JANUARY 2014 S H A W A N D P E R L W I T Z 195 On the Control of the Residual Circulation and Stratospheric Temperatures in the Arctic by Planetary Wave Coupling TIFFANY A. SHAW Department of Earth and
Vertical and interhemispheric links in the stratosphere-mesosphere as revealed by the day-to-day variability of Aura-MLS temperature data
 Author(s) 2009. This work is distributed under the Creative Commons Attribution 3.0 License. Annales Geophysicae Vertical and interhemispheric links in the stratosphere-mesosphere as revealed by the day-to-day
General Circulation. Nili Harnik DEES, Lamont-Doherty Earth Observatory
 General Circulation Nili Harnik DEES, Lamont-Doherty Earth Observatory nili@ldeo.columbia.edu Latitudinal Radiation Imbalance The annual mean, averaged around latitude circles, of the balance between the
ENSO Outlook by JMA. Hiroyuki Sugimoto. El Niño Monitoring and Prediction Group Climate Prediction Division Japan Meteorological Agency
 ENSO Outlook by JMA Hiroyuki Sugimoto El Niño Monitoring and Prediction Group Climate Prediction Division Outline 1. ENSO impacts on the climate 2. Current Conditions 3. Prediction by JMA/MRI-CGCM 4. Summary
AGU Chapman Conference on The Role of the Stratosphere in Climate and Climate Change in Santorini, Greece, on 28th September, 2007
 AGU Chapman Conference on The Role of the Stratosphere in Climate and Climate Change in Santorini, Greece, on 28th September, 2007 Parameter Sweep Experiments on the Remote Influences of the Equatorial
ENSO Cycle: Recent Evolution, Current Status and Predictions. Update prepared by Climate Prediction Center / NCEP 24 September 2012
 ENSO Cycle: Recent Evolution, Current Status and Predictions Update prepared by Climate Prediction Center / NCEP 24 September 2012 Outline Overview Recent Evolution and Current Conditions Oceanic Niño
ENSO Cycle: Recent Evolution, Current Status and Predictions. Update prepared by Climate Prediction Center / NCEP 11 November 2013
 ENSO Cycle: Recent Evolution, Current Status and Predictions Update prepared by Climate Prediction Center / NCEP 11 November 2013 Outline Overview Recent Evolution and Current Conditions Oceanic Niño Index
ENSO Cycle: Recent Evolution, Current Status and Predictions. Update prepared by Climate Prediction Center / NCEP 15 July 2013
 ENSO Cycle: Recent Evolution, Current Status and Predictions Update prepared by Climate Prediction Center / NCEP 15 July 2013 Outline Overview Recent Evolution and Current Conditions Oceanic Niño Index
ENSO Cycle: Recent Evolution, Current Status and Predictions. Update prepared by Climate Prediction Center / NCEP 25 February 2013
 ENSO Cycle: Recent Evolution, Current Status and Predictions Update prepared by Climate Prediction Center / NCEP 25 February 2013 Outline Overview Recent Evolution and Current Conditions Oceanic Niño Index
Downward propagation from the stratosphere to the troposphere: A comparison of the two hemispheres
 JOURNAL OF GEOPHYSICAL RESEARCH, VOL. 108, NO. D24, 4780, doi:10.1029/2003jd004077, 2003 Downward propagation from the stratosphere to the troposphere: A comparison of the two hemispheres Rune G. Graversen
ENSO Cycle: Recent Evolution, Current Status and Predictions. Update prepared by Climate Prediction Center / NCEP 5 August 2013
 ENSO Cycle: Recent Evolution, Current Status and Predictions Update prepared by Climate Prediction Center / NCEP 5 August 2013 Outline Overview Recent Evolution and Current Conditions Oceanic Niño Index
CHAPTER 5. Low latitude temperature change in the stratosphere and mesosphere. relation to Sudden Stratospheric Warming (SSW)
") CHAPTER 5 Low latitude temperature change in the stratosphere and mesosphere relation to Sudden Stratospheric Warming (SSW) 5.1 Introduction To understand middle atmosphere dynamics, the basic thermal
CHAPTER 5 Low latitude temperature change in the stratosphere and mesosphere relation to Sudden Stratospheric Warming (SSW) 5.1 Introduction To understand middle atmosphere dynamics, the basic thermal
ENSO: Recent Evolution, Current Status and Predictions. Update prepared by: Climate Prediction Center / NCEP 30 October 2017
 ENSO: Recent Evolution, Current Status and Predictions Update prepared by: Climate Prediction Center / NCEP 30 October 2017 Outline Summary Recent Evolution and Current Conditions Oceanic Niño Index (ONI)
HEIGHT-LATITUDE STRUCTURE OF PLANETARY WAVES IN THE STRATOSPHERE AND TROPOSPHERE. V. Guryanov, A. Fahrutdinova, S. Yurtaeva
 HEIGHT-LATITUDE STRUCTURE OF PLANETARY WAVES IN THE STRATOSPHERE AND TROPOSPHERE INTRODUCTION V. Guryanov, A. Fahrutdinova, S. Yurtaeva Kazan State University, Kazan, Russia When constructing empirical
Interannual Variations of the General Circulation and Polar Stratospheric Ozone Losses in a General Circulation Model
 Journal of the Meteorological Society of Japan, Vol. 80, No. 4B, pp. 877--895, 2002 877 Interannual Variations of the General Circulation and Polar Stratospheric Ozone Losses in a General Circulation Model
The general circulation in the atmosphere and oscillations in the climate system. Semjon Schimanke Summer school, Askö, 2016
 The general circulation in the atmosphere and oscillations in the climate system Semjon Schimanke Summer school, Askö, 2016 Semjon Schimanke study of meteorology at the Freie Universität of Berlin, 2001-2006
Predictability of the Stratospheric Polar Vortex Breakdown
 International Symposium on the Whole Atmosphere (ISWA) Session 4: Sudden stratospheric warming and SSW-initiated global coupling 14 September 2016 @ Ito Hall, The University of Tokyo Predictability of
Dynamical connection between tropospheric blockings and stratospheric polar vortex
 Click Here for Full Article GEOPHYSICAL RESEARCH LETTERS, VOL. 37,, doi:10.1029/2010gl043819, 2010 Dynamical connection between tropospheric blockings and stratospheric polar vortex J. M. Castanheira 1
The role of stratospheric processes in large-scale teleconnections
 The role of stratospheric processes in large-scale teleconnections Judith Perlwitz NOAA/Earth System Research Laboratory and CIRES/University of Colorado Outline Introduction Comparison of features of
Lecture #2 Planetary Wave Models. Charles McLandress (Banff Summer School 7-13 May 2005)
") Lecture #2 Planetary Wave Models Charles McLandress (Banff Summer School 7-13 May 2005) 1 Outline of Lecture 1. Observational motivation 2. Forced planetary waves in the stratosphere 3. Traveling planetary
Lecture #2 Planetary Wave Models Charles McLandress (Banff Summer School 7-13 May 2005) 1 Outline of Lecture 1. Observational motivation 2. Forced planetary waves in the stratosphere 3. Traveling planetary
Dynamical. regions during sudden stratospheric warming event (Case study of 2009 and 2013 event)
") Dynamical Coupling between high and low latitude regions during sudden stratospheric warming event (Case study of 2009 and 2013 event) Vinay Kumar 1,S. K. Dhaka 1,R. K. Choudhary 2,Shu-Peng Ho 3,M. Takahashi
Dynamical Coupling between high and low latitude regions during sudden stratospheric warming event (Case study of 2009 and 2013 event) Vinay Kumar 1,S. K. Dhaka 1,R. K. Choudhary 2,Shu-Peng Ho 3,M. Takahashi
ENSO: Recent Evolution, Current Status and Predictions. Update prepared by: Climate Prediction Center / NCEP 9 November 2015
 ENSO: Recent Evolution, Current Status and Predictions Update prepared by: Climate Prediction Center / NCEP 9 November 2015 Outline Summary Recent Evolution and Current Conditions Oceanic Niño Index (ONI)
Comparing QBO and ENSO impacts on stratospheric transport in WACCM-SD and -FR
 Comparing QBO and ENSO impacts on stratospheric transport in WACCM-SD and -FR Multivariate ENSO Index + QBO shear index based on Singapore wind U50-U25 CESM Chemistry WG Meeting Boulder, CO February 10,
Effect of Solar Activity on the Polar-night Jet Oscillation in the Northern and Southern Hemisphere Winter
 Journal of the Meteorological Society of Japan, Vol. 80, No. 4B, pp. 973--984, 2002 973 Effect of Solar Activity on the Polar-night Jet Oscillation in the Northern and Southern Hemisphere Winter Yuhji
2. Meridional atmospheric structure; heat and water transport. Recall that the most primitive equilibrium climate model can be written
 2. Meridional atmospheric structure; heat and water transport The equator-to-pole temperature difference DT was stronger during the last glacial maximum, with polar temperatures down by at least twice
Dynamical Changes in the Arctic and Antarctic Stratosphere During Spring
 Dynamical Changes in the Arctic and Antarctic Stratosphere During Spring U. Langematz and M. Kunze Abstract Short- and long-term changes in the intensity and persistence of the Arctic and Antarctic stratospheric
Steven Feldstein. The link between tropical convection and the Arctic warming on intraseaonal and interdecadal time scales
 The link between tropical convection and the Arctic warming on intraseaonal and interdecadal time scales Steven Feldstein The Pennsylvania State University Collaborators: Sukyoung Lee, Hyoseok Park, Tingting
Winter Forecast. Allan Huffman RaleighWx
 Winter 2014-15 Forecast Allan Huffman RaleighWx Winter 2014-15 Combination of weak/moderate El Nino/+PDO/-QBO and well above average snow cover and snow cover increase this Fall in Siberia point to a winter
Characteristics of the QBO- Stratospheric Polar Vortex Connection on Multi-decadal Time Scales?
 Characteristics of the QBO- Stratospheric Polar Vortex Connection on Multi-decadal Time Scales? Judith Perlwitz, Lantao Sun and John Albers NOAA ESRL Physical Sciences Division and CIRES/CU Yaga Richter
2014 Utah NASA Space Grant Consortium Symposium 1
 2014 Utah NASA Space Grant Consortium Symposium 1 Rayleigh Scatter Lidar Observations of the Midlatitude Mesosphere's Response to Sudden Stratospheric Warmings Leda Sox 1, Vincent B. Wickwar 1, Chad Fish
KUALA LUMPUR MONSOON ACTIVITY CENT
 T KUALA LUMPUR MONSOON ACTIVITY CENT 2 ALAYSIAN METEOROLOGICAL http://www.met.gov.my DEPARTMENT MINISTRY OF SCIENCE. TECHNOLOGY AND INNOVATIO Introduction Atmospheric and oceanic conditions over the tropical
warmest (coldest) temperatures at summer heat dispersed upward by vertical motion Prof. Jin-Yi Yu ESS200A heated by solar radiation at the base
 temperatures at summer heat dispersed upward by vertical motion Prof. Jin-Yi Yu ESS200A heated by solar radiation at the base") Pole Eq Lecture 3: ATMOSPHERE (Outline) JS JP Hadley Cell Ferrel Cell Polar Cell (driven by eddies) L H L H Basic Structures and Dynamics General Circulation in the Troposphere General Circulation in the
Pole Eq Lecture 3: ATMOSPHERE (Outline) JS JP Hadley Cell Ferrel Cell Polar Cell (driven by eddies) L H L H Basic Structures and Dynamics General Circulation in the Troposphere General Circulation in the
Interactions Between the Stratosphere and Troposphere
 Interactions Between the Stratosphere and Troposphere A personal perspective Scott Osprey Courtesy of Verena Schenzinger The Wave-Driven Circulation Global structure of Temperature and Wind Temperature
Is Antarctic climate most sensitive to ozone depletion in the middle or lower stratosphere?
 Click Here for Full Article GEOPHYSICAL RESEARCH LETTERS, VOL. 34, L22812, doi:10.1029/2007gl031238, 2007 Is Antarctic climate most sensitive to ozone depletion in the middle or lower stratosphere? S.
A mechanistic model study of quasi-stationary wave reflection. D.A. Ortland T.J. Dunkerton NorthWest Research Associates Bellevue WA
 A mechanistic model study of quasi-stationary wave reflection D.A. Ortland T.J. Dunkerton ortland@nwra.com NorthWest Research Associates Bellevue WA Quasi-stationary flow Describe in terms of zonal mean
Stratosphere-Troposphere Interaction and Long Range Prediction
 Stratosphere-Troposphere Interaction and Long Range Prediction Adam Scaife Head Monthly to Decadal Prediction Met Office, UK Outline Stratosphere-Troposphere interaction: Monthly Seasonal Multiannual Longer
Stratosphere Troposphere Coupling in the Southern Hemisphere
 708 J O U R N A L O F T H E A T M O S P H E R I C S C I E N C E S VOLUME 62 Stratosphere Troposphere Coupling in the Southern Hemisphere DAVID W. J. THOMPSON Department of Atmospheric Science, Colorado
North Pacific Climate Overview N. Bond (UW/JISAO), J. Overland (NOAA/PMEL) Contact: Last updated: September 2008
, J. Overland (NOAA/PMEL) Contact: Last updated: September 2008") North Pacific Climate Overview N. Bond (UW/JISAO), J. Overland (NOAA/PMEL) Contact: Nicholas.Bond@noaa.gov Last updated: September 2008 Summary. The North Pacific atmosphere-ocean system from fall 2007
North Pacific Climate Overview N. Bond (UW/JISAO), J. Overland (NOAA/PMEL) Contact: Nicholas.Bond@noaa.gov Last updated: September 2008 Summary. The North Pacific atmosphere-ocean system from fall 2007
Transient and Eddy. Transient/Eddy Flux. Flux Components. Lecture 3: Weather/Disturbance. Transient: deviations from time mean Time Mean
 Lecture 3: Weather/Disturbance Transients and Eddies Climate Roles Mid-Latitude Cyclones Tropical Hurricanes Mid-Ocean Eddies Transient and Eddy Transient: deviations from time mean Time Mean Eddy: deviations
Sunspots, the QBO, and the Stratosphere in the North Polar Region: An Update *
 Sunspots, the QBO, and the Stratosphere in the North Polar Region: An Update * K. Labitzke 1, M. Kunze 1, and S. Brönnimann 2 Abstract The 11-year sunspot cycle (SSC) strongly affects the lower stratosphere.
An Introduction to Coupled Models of the Atmosphere Ocean System
 An Introduction to Coupled Models of the Atmosphere Ocean System Jonathon S. Wright jswright@tsinghua.edu.cn Atmosphere Ocean Coupling 1. Important to climate on a wide range of time scales Diurnal to
Life cycle of the QBO-modulated 11-year solar cycle signals in the Northern Hemispheric winter
 QUARTERLY JOURNAL OF THE ROYAL METEOROLOGICAL SOCIETY Q. J. R. Meteorol. Soc. 135: 13 143 (29) Published online 9 April 29 in Wiley InterScience (www.interscience.wiley.com).419 Life cycle of the QBO-modulated
MPACT OF EL-NINO ON SUMMER MONSOON RAINFALL OF PAKISTAN
 MPACT OF EL-NINO ON SUMMER MONSOON RAINFALL OF PAKISTAN Abdul Rashid 1 Abstract: El-Nino is the dominant mod of inter- annual climate variability on a planetary scale. Its impact is associated worldwide
EPP contribution to (stratospheric and) tropospheric variations. Annika Seppälä Finnish Meteorological Institute Academy of Finland
 tropospheric variations. Annika Seppälä Finnish Meteorological Institute Academy of Finland") EPP contribution to (stratospheric and) tropospheric variations Annika Seppälä Finnish Meteorological Institute Academy of Finland A. Seppälä, HEPPA-SOLARIS Workshop, Boulder, Oct 0 So far... Energetic
EPP contribution to (stratospheric and) tropospheric variations Annika Seppälä Finnish Meteorological Institute Academy of Finland A. Seppälä, HEPPA-SOLARIS Workshop, Boulder, Oct 0 So far... Energetic
Special blog on winter 2016/2017 retrospective can be found here -
 March 4, 2019 Special blog on winter 2016/2017 retrospective can be found here - http://www.aer.com/winter2017 Special blog on winter 2015/2016 retrospective can be found here - http://www.aer.com/winter2016
The combined effects of ENSO and the 11 year solar cycle on the Northern Hemisphere polar stratosphere
 JOURNAL OF GEOPHYSICAL RESEARCH, VOL. 116,, doi:10.1029/2010jd015226, 2011 The combined effects of ENSO and the 11 year solar cycle on the Northern Hemisphere polar stratosphere Natalia Calvo 1,2 and Daniel
Influence of the quasi biennial oscillation and El Niño Southern Oscillation on the frequency of sudden stratospheric warmings
 JOURNAL OF GEOPHYSICAL RESEARCH, VOL. 116,, doi:10.1029/2011jd015757, 2011 Influence of the quasi biennial oscillation and El Niño Southern Oscillation on the frequency of sudden stratospheric warmings
Nonlinearity of the combined warm ENSO and QBO effects on the Northern Hemisphere polar vortex in MAECHAM5 simulations
 JOURNAL OF GEOPHYSICAL RESEARCH, VOL. 114,, doi:10.1029/2008jd011445, 2009 Nonlinearity of the combined warm ENSO and QBO effects on the Northern Hemisphere polar vortex in MAECHAM5 simulations Natalia
Dynamical balances and tropical stratospheric upwelling
 Dynamical balances and tropical stratospheric upwelling Bill Randel and Rolando Garcia NCAR Thanks to: Qiang Fu, Andrew Gettelman, Rei Ueyama, Mike Wallace, plus WACCM group at NCAR. Background: Well-known
Global Atmospheric Circulation
 Global Atmospheric Circulation Polar Climatology & Climate Variability Lecture 11 Nov. 22, 2010 Global Atmospheric Circulation Global Atmospheric Circulation Global Atmospheric Circulation The Polar Vortex
Lecture 5: Atmospheric General Circulation and Climate
 Lecture 5: Atmospheric General Circulation and Climate Geostrophic balance Zonal-mean circulation Transients and eddies Meridional energy transport Moist static energy Angular momentum balance Atmosphere
North Pacific Climate Overview N. Bond (UW/JISAO), J. Overland (NOAA/PMEL) Contact: Last updated: August 2009
, J. Overland (NOAA/PMEL) Contact: Last updated: August 2009") North Pacific Climate Overview N. Bond (UW/JISAO), J. Overland (NOAA/PMEL) Contact: Nicholas.Bond@noaa.gov Last updated: August 2009 Summary. The North Pacific atmosphere-ocean system from fall 2008 through
North Pacific Climate Overview N. Bond (UW/JISAO), J. Overland (NOAA/PMEL) Contact: Nicholas.Bond@noaa.gov Last updated: August 2009 Summary. The North Pacific atmosphere-ocean system from fall 2008 through
Chapter outline. Reference 12/13/2016
 Chapter 2. observation CC EST 5103 Climate Change Science Rezaul Karim Environmental Science & Technology Jessore University of science & Technology Chapter outline Temperature in the instrumental record
An Examination of Anomalously Low Column Ozone in the Southern Hemisphere Midlatitudes During 1997
 San Jose State University From the SelectedWorks of Eugene C. Cordero April, 2002 An Examination of Anomalously Low Column Ozone in the Southern Hemisphere Midlatitudes During 1997 Eugene C. Cordero, San
Lecture 8. Monsoons and the seasonal variation of tropical circulation and rainfall
 Lecture 8 Monsoons and the seasonal variation of tropical circulation and rainfall According to the second hypothesis, the monsoon is a manifestation of the seasonal variation of the tropical circulation
El Niño, South American Monsoon, and Atlantic Niño links as detected by a. TOPEX/Jason Observations
 El Niño, South American Monsoon, and Atlantic Niño links as detected by a decade of QuikSCAT, TRMM and TOPEX/Jason Observations Rong Fu 1, Lei Huang 1, Hui Wang 2, Paola Arias 1 1 Jackson School of Geosciences,
Stratospheric planetary wave reflection and its influence on the troposphere
 Stratospheric planetary wave reflection and its influence on the troposphere N. Harnik, Tel Aviv University J. Perlwitz, CIRES U. Colorado/NOAA ESRL T. A. Shaw, Columbia University, NY, NY, USA The following
Blocking precursors to stratospheric sudden warming events
 GEOPHYSICAL RESEARCH LETTERS, VOL. 36, L14806, doi:10.1029/2009gl038776, 2009 Blocking precursors to stratospheric sudden warming events O. Martius, 1 L. M. Polvani, 2 and H. C. Davies 1 Received 27 April
Delayed Response of the Extratropical Northern Atmosphere to ENSO: A Revisit *
 Delayed Response of the Extratropical Northern Atmosphere to ENSO: A Revisit * Ruping Mo Pacific Storm Prediction Centre, Environment Canada, Vancouver, BC, Canada Corresponding author s address: Ruping
Wind: Global Systems Chapter 10
 Wind: Global Systems Chapter 10 General Circulation of the Atmosphere General circulation of the atmosphere describes average wind patterns and is useful for understanding climate Over the earth, incoming
The Scientific Value of Stratospheric Wind Measurements
 Working Group on Space-based Lidar Winds, Monterey, 2008 The Scientific Value of Stratospheric Wind Measurements Ted Shepherd Department of Physics University of Toronto The distribution of ozone (important
Improved 11-year solar signal in the Freie Universität Berlin Climate Middle Atmosphere Model (FUB-CMAM)
") JOURNAL OF GEOPHYSICAL RESEARCH, VOL. 109,, doi:10.1029/2003jd004012, 2004 Improved 11-year solar signal in the Freie Universität Berlin Climate Middle Atmosphere Model (FUB-CMAM) Katja Matthes, 1 Ulrike
JOURNAL OF GEOPHYSICAL RESEARCH, VOL. 109,, doi:10.1029/2003jd004012, 2004 Improved 11-year solar signal in the Freie Universität Berlin Climate Middle Atmosphere Model (FUB-CMAM) Katja Matthes, 1 Ulrike
Vertical Coupling in Climate
 Vertical Coupling in Climate Thomas Reichler (U. of Utah) NAM Polar cap averaged geopotential height anomalies height time Observations Reichler et al. (2012) SSWs seem to cluster Low-frequency power Vortex
Research Article Impact of Stratospheric Sudden Warming on East Asian Winter Monsoons
 Advances in Meteorology Volume 21, Article ID 64912, 1 pages http://dx.doi.org/1.11/21/64912 Research Article Impact of Stratospheric Sudden Warming on East Asian Winter Monsoons Quanliang Chen, Luyang
Traveling planetary-scale Rossby waves in the winter stratosphere: The role of tropospheric baroclinic instability
 GEOPHYSICAL RESEARCH LETTERS, VOL.???, XXXX, DOI:.29/, 1 2 Traveling planetary-scale Rossby waves in the winter stratosphere: The role of tropospheric baroclinic instability Daniela I.V. Domeisen, 1 R.
Wave-driven equatorial annual oscillation induced and modulated by the solar cycle
 GEOPHYSICAL RESEARCH LETTERS, VOL. 32, L20811, doi:10.1029/2005gl023090, 2005 Wave-driven equatorial annual oscillation induced and modulated by the solar cycle Hans G. Mayr, 1 John G. Mengel, 2 and Charles
Special blog on winter 2016/2017 retrospective can be found here -
 February 11, 2019 Special blog on winter 2016/2017 retrospective can be found here - http://www.aer.com/winter2017 Special blog on winter 2015/2016 retrospective can be found here - http://www.aer.com/winter2016
Stratosphere-troposphere evolution during polar vortex intensification
 JOURNAL OF GEOPHYSICAL RESEARCH, VOL. 110,, doi:10.1029/2005jd006302, 2005 Stratosphere-troposphere evolution during polar vortex intensification Varavut Limpasuvan, 1 Dennis L. Hartmann, 2 David W. J.
Charles Jones ICESS University of California, Santa Barbara CA Outline
 The Influence of Tropical Variations on Wintertime Precipitation in California: Pineapple express, Extreme rainfall Events and Long-range Statistical Forecasts Charles Jones ICESS University of California,
Stratospheric Processes: Influence on Storm Tracks and the NAO. Mark P. Baldwin
 Stratospheric Processes: Influence on Storm Tracks and the NAO Mark P. Baldwin Mark P. Baldwin, University of Exeter Imperial College 12 December 2012 (From Baldwin and Dunkerton, Science 2001) 60 Days
On the QBO-Solar-Relationship throughout the Year
 On the QBO-Solar-Relationship throughout the Year Karin Labitzke, Institut für Meteorologie, Freie Universität Berlin SORC-Sedona-Sep-2011.ppt Today, I want to tell you about the importance of the QBO
The Impact of the Extratropical Transition of Typhoon Dale (1996) on the Early Wintertime Stratospheric Circulation
 on the Early Wintertime Stratospheric Circulation") The Impact of the Extratropical Transition of Typhoon Dale (1996) on the Early 1996-97 Wintertime Stratospheric Circulation Andrea L. Lang 1, Jason M. Cordeira 2, Lance F. Bosart 1 and Daniel Keyser 1
The Impact of the Extratropical Transition of Typhoon Dale (1996) on the Early 1996-97 Wintertime Stratospheric Circulation Andrea L. Lang 1, Jason M. Cordeira 2, Lance F. Bosart 1 and Daniel Keyser 1
Winds and Global Circulation
 Winds and Global Circulation Atmospheric Pressure Winds Global Wind and Pressure Patterns Oceans and Ocean Currents El Nino How is Energy Transported to its escape zones? Both atmospheric and ocean transport
Seasonal Climate Outlook for South Asia (June to September) Issued in May 2014
 Issued in May 2014") Ministry of Earth Sciences Earth System Science Organization India Meteorological Department WMO Regional Climate Centre (Demonstration Phase) Pune, India Seasonal Climate Outlook for South Asia (June
Ministry of Earth Sciences Earth System Science Organization India Meteorological Department WMO Regional Climate Centre (Demonstration Phase) Pune, India Seasonal Climate Outlook for South Asia (June
Temperature changes in the tropical tropopause layer
 Temperature changes in the tropical tropopause layer Kohei Yoshida Division of Earth System Science, Graduate School of Environmental Science, Hokkaido University February 011 Abstract ⅰ Abstract Temperature
Predictability of Sudden Stratospheric Warmings in sub-seasonal forecast models
 Predictability of Sudden Stratospheric Warmings in sub-seasonal forecast models Alexey Karpechko Finnish Meteorological Institute with contributions from A. Charlton-Perez, N. Tyrrell, M. Balmaseda, F.
Radiative effects of ozone waves on the Northern Hemisphere polar vortex and its modulation by the QBO
 Radiative effects of ozone waves on the Northern Hemisphere polar vortex and its modulation by the QBO Vered Silverman 1, Nili Harnik 1, Katja Matthes 2, Sandro W. Lubis 3, and Sebastian Wahl 2 1 Department
Here s what a weak El Nino usually brings to the nation with temperatures:
 Time again for my annual Winter Weather Outlook. Here's just a small part of the items I considered this year and how I think they will play out with our winter of 2018-2019. El Nino / La Nina: When looking