Exercise Part 1 - Producing Guidance and Verification -
|
|
|
- Anabel Wilkerson
- 5 years ago
- Views:
Transcription
1 Exercise Part 1 - Producing Guidance and Verification - 1
2 Objectives To understand how to produce guidance for seasonal temperature and precipitation. To think rationally and find possible predictors. To find more effective predictors. To verify the guidance based on deterministic and probabilistic methods. 2
3 Contents 1. Single Regression Model 2. Multiple Regression Model 3. Probabilistic Forecast 4. Verification 4.1 Deterministic Verification 4.2 Probabilistic Verification 3
4 Preparations Observation data (You have prepared.) Predictors (init. 28 th Sep. for DJF) GPV data over your stations GPVdata.xls Indices such as NINO3SST, Asia Monsoon, etc. indices.xls Excel software for making guidance ProducingGuidance.xls Excel software for verification Verification.xls 4


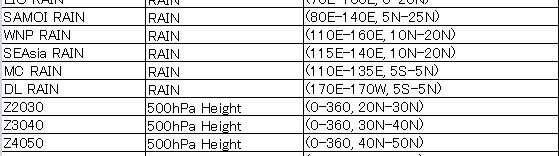
5 Indices SST RAIN Z500 Thickness
6 1. Single Regression Model Open the ProducingGuidance.xls. Paste observation data into the Temperature/Precipitation worksheet DJF means DJF of 1980/1981. In this case, the predictand is temperature and the station is Tokyo. Paste observation data. Temperature worksheet 6
7 1. Single Regression Model A graph of time series of the observation data has been automatically produced. 7
8 1. Single Regression Model Calculate the normal from 1981 to Input =AVERAGE(C4:C33) at C34. 8
9 1. Single Regression Model Rank the data from 1981 to 2010 in descending order (preparation for probabilistic forecast). Input =RANK(C4,$C$4:$C$33,0) at D4. 9
10 1. Single Regression Model Rank the data from 1981 to 2010 (preparation for probabilistic forecast). Copy D4 and paste it into D5:D33. 10
11 1. Single Regression Model Calculate the upper and lower limits of around normal (preparation for probabilistic forecast). Calculate the mean value of the rank 20 th and 21 st data (C35) Calculate the mean value of the rank 10 th and 11 th data (C36) 11
12 1. Single Regression Model Original line number Year Mean Temp Rank The upper limit of around normal can be calculated as the average of C23 and C33. The lower limit of around normal can be calculated as the average of C17 ( C11) and C24 ( C31). 12
13 1. Single Regression Model Open GPVdata.xls and indices.xls. Select a predictor and paste the data into E column. Predictors Surface temperature GPV around at the station as a predictor. Confirm the anomaly correlation coefficient (the absolute value) at E39. In case of Tokyo, the anomaly correlation is 0.32 (not so large). I will try other predictors. 13
14 1. Single Regression Model Try other predictors. Select the IOBW SST (SST in 20S-20N, E) and paste the data into E column. Correlation coefficient has increased to Please try to look for the most effective predictor. 14
15 1. Single Regression Model Calculate the forecasts using single regression equation. Input =$E$37 $E4+$E$38 at H4. Y = a x + b 15
16 1. Single Regression Model Calculate the forecasts using single regression equation. Copy H4 and paste it into H5:H33. 16
17 1. Single Regression Model The time series of the forecast data has been automatically added to the graph. I will ask you the following questions at the end of this session: 1. What predictor did you select? 2. Could you get an accurate guidance? 17
18 1. Single Regression Model How about precipitation? The histogram of temperature is generally normal (Gaussian) distribution, but that of precipitation is usually Gamma distribution and has gaps from Gaussian distribution. The error distribution of regression model is assumed normal distribution, so normalization is necessary for precipitation. JMA seasonal forecast guidance uses the 1/4-power transformation as the simplest method. The histogram of raw precipitation data has gaps from Gaussian distribution (left). The histogram of the power of 1/4 of precipitation values is similar to Gaussian distribution (right). 18


19 1. Single Regression Model How about precipitation? Temperature worksheet Precipitation worksheet Temperature worksheet Precipitation worksheet the 1/4-power transformation the 4th-power transformation Precipitation worksheet has two additional columns related with normalization. Please see the appendix slides to know the detail. 19
20 2. Multiple Regression Model Try to look for most effective combination of predictors DJF means DJF of 1980/1981. Select the most effective combination of predictors after trial and error. Correlation coefficients (the absolute values) The ITACS will help you find them. 20
21 2. Multiple Regression Model Select REGRESSION_COEFFICIENT Select UPLOAD_TXT Upload the observation data (In this case, TokyoDJFTemp.csv) Graphic Option Drawing: CONTOUR ITACS
22 2. Multiple Regression Model This is the relationship between OLR and DJF temperature in Tokyo. The OLR (convective activity) in Maritime Continent and that in the eastern Indian Ocean look possible predictors. However, it is necessary to confirm the seasonal forecast model s skill about them. ITACS

23 2. Multiple Regression Model Prediction skill evaluated by 30 years hindcast Anomaly correlation between the observed and forecasted DJF rainfall amounts in Maritime Continent is more than 0.6. Prediction skill is good. 23
24 2. Multiple Regression Model Calculate the forecasts using multiple regression equation. Input =$E$41*$E4+$F$41*$F4+$G$41*$G4+$E$42 at H4. Y = a1 x1 + a2 x2 + a3 x3 + b 24
25 2. Multiple Regression Model Calculate the forecasts using multiple regression equation. Copy H4 and paste it into H5:H33. Multiple Anomaly Correlation Coefficient 25
26 2. Multiple Regression Model The time series of the forecast data has been automatically updated. I will ask you the following questions at the end of this session: 1. What predictors did you select? 2. Is the multiple regression model guidance more accurate than the single regression model guidance? 26
27 3. Probabilistic Forecast Calculate squares of regression errors. Calculate the root mean square error DJF means DJF of 1980/1981. Input =($H4-$C4)^2 at I4 to calculate square error. 27
28 3. Probabilistic Forecast Calculate squares of regression errors. Calculate the root mean square error. Copy I4 and paste it into I5:I33. 28
29 3. Probabilistic Forecast Calculate squares of regression errors. Calculate the root mean square error. Input =SQRT(AVERAGE(I4:I33)) at I34 to calculate root mean square error. 29
30 3. Probabilistic Forecast Calculate probability of below-normal. Input TRUE: Value of cumulative distribution function for the first argument (i.e. $C$35). FALSE: Value of probability density function for the first argument (i.e. $C$35). =NORMDIST($C$35,$H4,$I$34,TRUE) at J4. Forecast probability density function (PDF)
31 3. Probabilistic Forecast Calculate probability of below-normal. Copy J4 and paste it into J5:J33. 31
32 3. Probabilistic Forecast Calculate probability of above-normal. Very important! TRUE: Value of cumulative distribution function for the first argument (i.e. $C$36). FALSE: Value of probability density function for the first argument (i.e. $C$36). Input = 1-NORMDIST($C$36,$H4,$I$34,TRUE) at L4. Forecast probability density function (PDF)
33 3. Probabilistic Forecast Calculate probability of above-normal. Copy L4 and paste it into L5:L33. 33
34 3. Probabilistic Forecast Calculate probability of around-normal. Input =1-J4-L4 at K4. Forecast probability density function (PDF)
35 3. Probabilistic Forecast Calculate probability of around-normal. Copy K4 and paste it into K5:K33. 35
36 3. Probabilistic Forecast The time series of the probabilistic forecast data has been automatically added. I will ask you the following questions at the end of this session: 1. How did the guidance predict the hottest/coldest/wettest/driest year in your country? 2. Are there any essential differences of the probability between the temperature and precipitation? 36


 Time")
37 4-1. Deterministic Verification Anomaly Correlation Root Mean Square Error (RMSE) Time Series Chart Scatter Plot 37
 Time Series Chart Scatter Plot 38")
38 4-1. Deterministic Verification Select C4:C33 Select H4:H33 (with pushing ctrl key) Select Insert Select Scatter plot Forecast Anomaly Correlation Root Mean Square Error (RMSE) Time Series Chart Scatter Plot 38 Observation
39 4-2. Probabilistic Verification Brier skill score (3-category forecast) Brier score measures mean squared error of the probability forecasts. BS 1 2N i N 1 3 m 1 ( p m i o m i ) 2 Range: 0 to 1. Perfect score: 0 Brier skill score measures skill relative to a reference forecast (usually climatology). BS BSS 1 BS reference Range: minus infinity to 1. BSS=0 indicates no skill when compared to the reference forecast. Perfect score: 1. 39
40 4-2. Probabilistic Verification Brier skill score (3-category forecast) Brier skill score = the relative skill of the probabilistic forecast to the climatology BSS BS BS BS BS clim 1 0 BSclim clim 1/3 Perfect score: 1 BSS>0 : better than the climatology. BSS=0 indicates no skill when compared to the climatology. BSS<0 : worse than the climatology. 40


41 4-2. Probabilistic Verification Brier skill score (3-category forecast) Open the Verification.xls. * If you are busy, please use BriefVerification.xls in place of Verification.xls. In this case, the predictand is temperature and the station is Tokyo DJF means DJF of 1980/1981. Paste observation data (*) into C2:C31. * These values should be copied from C4:C33 in the temperature sheet of the ProducingGuidance.xls. Paste observation data (*) into C32:C61. Paste observation data (*) into C62:C91. 41
42 4-2. Probabilistic Verification Brier skill score (3-category forecast) Paste the values of the lower and upper limits of around normal (*) into C93 and C94, respectively. * These values should be copied from the C35 and C36 cells in the temperature sheet of the ProducingGuidance.xls 42
43 4-2. Probabilistic Verification Brier skill score (3-category forecast) Paste the values of the probabilities of below normal (*) into D2:D31. Paste the values of the probabilities of around normal (**) into D32:D61. Paste the values of the probabilities of above normal (***) into D62:D91. * J4:J33 in the temperature sheet of the ProducingGuidance.xls ** K4:K33 in the temperature sheet of the ProducingGuidance.xls *** L4:L33 in the temperature sheet of the ProducingGuidance.xls 43
44 4-2. Probabilistic Verification Brier skill score (3-category forecast) * If you use BriefVerification.xls in place of Verification.xls, the procedure in this slide is unnecessary. Input =IF(C2<=$C$93,(D2-1)^2,D2^2) at E2 (*) and paste it into E3:E31. * If the observed value is below normal, If not so (around or above normal), E2 E2 ( p m i ( p m i 2 1) 2 0) Input =IF(C32<=$C$93,D32^2,IF(C32>$C$94,D32^2, (D32-1)^2)) at E32 (**) and paste it into E33:E61. ** If the observed value is below or above normal, If not so (around normal), E32 E32 ( p m i ( m pi 2 0) 2 1) Input =IF(C62>$C$94,(D62-1)^2,D62^2) at E62 (***) and paste it into E63:E91. *** If the observed value is above normal, E62 ( p m i 2 1) If not so (below or around normal), E62 ( p m i 2 0) 44
45 4-2. Probabilistic Verification Brier skill score (3-category forecast) * If you use BriefVerification.xls in place of Verification.xls, the procedure in this slide is unnecessary. Input =AVERAGE(E2:E91)*(3/2) at E92 (*). * BS 1 2N i N 1 3 m 1 ( p m i o m i ) 2 Input =((1-1/3)^2+(0-1/3)^2+(0-1/3)^2)/2 at F92 (**). ** Input =(F92-E92)/F92 at G92 (***). *** BSS BS BS clim 0 BSclim 45
46 4-2. Probabilistic Verification Reliability Diagram Continue using the Verification.xls. * If you use BriefVerification.xls in place of Verification.xls, the procedure in this slide is unnecessary. Input =ROUND(D2,1) at F2. * 10% 10%, 7% 10%, 24% 20%, and so on. Copy F2 and paste it intof3:f91. 46
47 4-2. Probabilistic Verification Reliability Diagram * If you use BriefVerification.xls in place of Verification.xls, the procedure in this slide is unnecessary. Input =IF($C2<=$C$93,"1","0") at G2 (*) and paste it into G3:G31. * If the observed value is below normal, G2=1. If not so (around or above normal), G2=0. Input =IF(C32<=$C$93,"0",IF(C32>$C$94,"0","1")) at G32 (**) and paste it into G33:E61. ** If the observed value is below or above normal, G32=0. If not so (around normal), G32=1. Input =IF(C62>$C$94,"1","0") at G62 (***) and paste it into G63:G91. *** If the observed value is above normal, G62=1. If not so (below or around normal), G62=0. 47
48 4-2. Probabilistic Verification Reliability Diagram Copy G2:G91, and paste their values into H2:H91 (functions values). 48
49 4-2. Probabilistic Verification (2) Hit frequency of forecast XXX% =SUMPRODUCT(($F$2:$F$91=J$2)*($H$2:$H$91=$H$1)) Reliability Diagram (1) Frequency of forecast XXX% =COUNTIF($F$2:$F$91, XXX%") * XXX: 0,10,,100 (3) Hit rate of forecast XXX% (observed probability) =J4/J3 (4) Ratio of forecast XXX% compared to the total number of the forecast (4) (3) =J3/90 49
50 4-2. Probabilistic Verification Reliability Diagram Ratio of Forecast XXX% (XXX: 0,10,, 100) Observed Probability The reliability diagram plots the observed probability(y-axis) against the forecast probability(x-axis). The diagonal broken line indicates perfect reliability (observed probability equal to forecast probability). Points below (above) the diagonal line indicate overforecasting (underforecasting). 50
51 Questions Single Regression Model 1. What predictor did you select? 2. Could you get an accurate guidance? Multiple Regression Model 1. What predictors did you select? 2. Is the multiple regression model guidance more accurate than the single regression model guidance? Probabilistic Forecast 1. How did the guidance predict the hottest/coldest/wettest/driest year in your country? 2. Are there any essential differences of the probability between the temperature and precipitation? Verification 1. Is your guidance skillful from the viewpoint of deterministic forecast? (Anomaly Correlation, Root Mean Square Error, Time Series Chart, and Scatter Plot) 2. Is your guidance skillful from the viewpoint of probabilistic forecast? (Brier skill score and Reliability Diagram) Please answer these questions as many as possible in your presentation time (17 minutes) after the Exercise Part 2. 51
52 Appendix 52
53 Appendix: Producing Guidance for Precipitation 1. Single Regression Model Open the ProducingGuidance.xls. Paste observation data, calculate the normal from 1981 to 2010, and calculate the power of 1/4 of precipitation values DJF means DJF of 1980/1981. (1) Paste observation data. (3) Input =C4^0.25 at D4. (4) Copy D4 and paste it into D5:D34. In this case, the predictand is precipitation and the station is Tokyo. (2) Input =AVERAGE(C4:C33) at C34. Precipitation worksheet 53
54 Appendix: Producing Guidance for Precipitation 1. Single Regression Model Rank the data from 1981 to 2010 in descending order and calculate the lower and upper limits of around normal (preparation for probabilistic forecast). (1) Input =RANK(C4,$C$4:$C$33,0) at E4. (3) Calculate the mean value of the rank 20 th and 21 st data (C35). (2) Copy E4 and paste it into E5:E33. (5) Copy D34 and paste it into D35:E36. (4) Calculate the mean value of the rank 10 th and 11 th data (C36). 54
55 Appendix: Producing Guidance for Precipitation 1. Single Regression Model Open GPVdata.xls and indices.xls. Select a predictor and paste the data into F column (1) In this case, select IOBW SST and paste the data into F column. (2) Confirm the anomaly correlation coefficient (the absolute value) between the power of the 1/4 of precipitation value and the selected data at F39. Please try to look for the most effective predictor. 55
56 Appendix: Producing Guidance for Precipitation 1. Single Regression Model Calculate the power of 1/4 of the precipitation value using single regression equation. Calculate the 4 th powers of them. (That is to say, forecasted precipitation values.) (1) Input =$F$37 $F4+$F$38 at I4. (3) Input =I4^4 at J4. (2) Copy I4 and paste it into I5:I33. (4) Copy J4 and paste it into J5:J33. 56
57 Appendix: Producing Guidance for Precipitation 1. Single Regression Model 57
58 Appendix: Producing Guidance for Precipitation 2. Multiple Regression Model Try to look for most effective combination of predictors. after trial and error. The ITACS will help you find them (see the slides 21-23) DJF means DJF of 1980/1981. (1) In this case, select IOBW, Z2030, and NINOWEST SST. Paste them to F4:F33, G4:G33, and H4:H33, respectively. (2) Check the correlation coefficients (the absolute values). 58
59 Appendix: Producing Guidance for Precipitation 2. Multiple Regression Model Calculate the power of 1/4 of the precipitation value using multiple regression equation. Calculate the 4 th powers of them. (That is to say, forecasted precipitation values.) (1) Input =$F$41*$F4+$G$41*$G4+$H$41*$H4+$F$42 at I4. (2) Copy I4 and paste it into I5:I33. (3) Input =I4^4 at J4. (4) Copy J4 and paste it into J5:J33. 59
60 Appendix: Producing Guidance for Precipitation 2. Multiple Regression Model 60
61 Appendix: Producing Guidance for Precipitation 3. Probabilistic Forecast Calculate squares of regression errors of the powers of 1/4 of precipitation values. Calculate the root mean square error DJF means DJF of 1980/1981. (1) Input =(I4-D4)^2 at K4 to calculate the square error. (2) Copy K4 and paste it into K5:K33. (3) Input =SQRT(AVERAGE(K4:K33)) at K34 to calculate root mean square error. 61
62 Appendix: Producing Guidance for Precipitation 3. Probabilistic Forecast Calculate probability of below-normal. TRUE: Value of cumulative distribution function for the first argument (i.e. $C$35). FALSE: Value of probability density function for the first argument (i.e. $C$35). (1) Input =NORMDIST($D$35,$I4,$K$34,TRUE) at L4. (2) Copy L4 and paste it into L5:L33. Forecast probability density function (PDF) 62
63 Appendix: Producing Guidance for Precipitation 3. Probabilistic Forecast Calculate probability of above-normal. Very important! (1) Input TRUE: Value of cumulative distribution function for the first argument (i.e. $C$36). FALSE: Value of probability density function for the first argument (i.e. $C$36). = 1-NORMDIST($D$36,$I4,$K$34,TRUE) at L4. (2) Copy N4 and paste it into N5:N33. Forecast probability density function (PDF) 63
64 Appendix: Producing Guidance for Precipitation 3. Probabilistic Forecast Calculate probability of around-normal. (1) Input =1-L4-N4 at M4. (2) Copy M4 and paste it into M5:M33. Forecast probability density function (PDF) 64
65 Appendix: Producing Guidance for Precipitation 3. Probabilistic Forecast 65
66 Appendix: AC and RMSE Anomaly Correlation (AC) AC i N 1 N i 1 ( F i ( F i C i ) C 2 i )( O i N i 1 ( O C i i ) C i ) 2 Range: -1 to 1. Perfect score: 1. AC measures correspondence or phase difference between forecast and observation, subtracting out the climatological mean at each point. AC AC << 66
67 Root Mean Square Error (RMSE) Appendix: AC and RMSE RMSE 1 N i N 1 F i O i 2 F : forecast O : observation N :sample size Range: 0 to infinity, Perfect score: 0. RMSE measures absolute magnitude of the forecast error. It does not indicate the direction the error. RMSE small RMSE large 67
68 Appendix: AC and RMSE AC positive ( 1) RMSE large AC negative RMSE large AC positive( 1) RMSE small AC negative RMSE small 68
Exercise for Guidance. TCC Training Seminar on Application of Seasonal Forecast GPV Data to Seasonal Forecast Products January 2011
 Exercise for Guidance TCC Training Seminar on Application of Seasonal Forecast GPV Data to Seasonal Forecast Products 18-21 January 2011 Objectives To understand how to make guidance for seasonal-mean
Akira Ito & Staffs of seasonal forecast sector
 Exercise : Producing site-specific guidance using domestic data Akira Ito & Staffs of seasonal forecast sector Climate Prediction Division Japan Meteorological Agency TCC Training Seminar on One-month
How to Use the Guidance Tool (Producing Guidance and Verification)
") How to Use the Guidance Tool (Producing Guidance and Verification) Hiroshi Ohno Tokyo Climate Center (TCC)/ Climate Prediction Division of Japan Meteorological Agency (JMA) Workflow of the Excel Guidance
How to Use the Guidance Tool (Producing Guidance and Verification) Hiroshi Ohno Tokyo Climate Center (TCC)/ Climate Prediction Division of Japan Meteorological Agency (JMA) Workflow of the Excel Guidance
What is one-month forecast guidance?
 What is one-month forecast guidance? Kohshiro DEHARA (dehara@met.kishou.go.jp) Forecast Unit Climate Prediction Division Japan Meteorological Agency Outline 1. Introduction 2. Purposes of using guidance
Introduction of Seasonal Forecast Guidance. TCC Training Seminar on Seasonal Prediction Products November 2013
 Introduction of Seasonal Forecast Guidance TCC Training Seminar on Seasonal Prediction Products 11-15 November 2013 1 Outline 1. Introduction 2. Regression method Single/Multi regression model Selection
Methods of forecast verification
 Methods of forecast verification Kiyotoshi Takahashi Climate Prediction Division Japan Meteorological Agency 1 Outline 1. Purposes of verification 2. Verification methods For deterministic forecasts For
How to use the guidance tool (Producing Guidance and Verification)
") Ex.1 How to use the guidance tool (Producing Guidance and Verification) Masayuki Hirai Tokyo Climate Center (TCC)/ Climate Prediction Division of Japan Meteorological Agency (JMA) Schedule of exercise
Ex.1 How to use the guidance tool (Producing Guidance and Verification) Masayuki Hirai Tokyo Climate Center (TCC)/ Climate Prediction Division of Japan Meteorological Agency (JMA) Schedule of exercise
Interpretation of Outputs from Numerical Prediction System
 Interpretation of Outputs from Numerical Prediction System Hiroshi OHNO Tokyo Climate Center (TCC)/ Climate Prediction Division of Japan Meteorological Agency (JMA) Procedure of Seasonal Forecast (1) 1.
JMA s Seasonal Prediction of South Asian Climate for Summer 2018
 JMA s Seasonal Prediction of South Asian Climate for Summer 2018 Atsushi Minami Tokyo Climate Center (TCC) Japan Meteorological Agency (JMA) Contents Outline of JMA s Seasonal Ensemble Prediction System
Wassila Mamadou Thiaw Climate Prediction Center
 Sub-Seasonal to Seasonal Forecasting for Africa Wassila Mamadou Thiaw Climate Prediction Center NOAA Forecast Con/nuum e.g. Disaster management planning and response e.g. Crop Selec6on, Water management
Development of Multi-model Ensemble technique and its application Daisuke Nohara
 Development of Multi-model Ensemble technique and its application Daisuke Nohara APEC Climate Center (APCC), Busan, Korea 2007/2/21 JMA Contents 1. Introduction of APCC 2. Seasonal forecast based on multi-model
Verification of the Seasonal Forecast for the 2005/06 Winter
 Verification of the Seasonal Forecast for the 2005/06 Winter Shingo Yamada Tokyo Climate Center Japan Meteorological Agency 2006/11/02 7 th Joint Meeting on EAWM Contents 1. Verification of the Seasonal
Products of the JMA Ensemble Prediction System for One-month Forecast
 Products of the JMA Ensemble Prediction System for One-month Forecast Shuhei MAEDA, Akira ITO, and Hitoshi SATO Climate Prediction Division Japan Meteorological Agency smaeda@met.kishou.go.jp Contents
Atmospheric circulation analysis for seasonal forecasting
 Training Seminar on Application of Seasonal Forecast GPV Data to Seasonal Forecast Products 18 21 January 2011 Tokyo, Japan Atmospheric circulation analysis for seasonal forecasting Shotaro Tanaka Climate
ENSO, AO, and climate in Japan. 15 November 2016 Yoshinori Oikawa, Tokyo Climate Center, Japan Meteorological Agency
 ENSO, AO, and climate in Japan 15 November 2016 Yoshinori Oikawa, Tokyo Climate Center, Japan Meteorological Agency Aims of this lecture At the end of the yesterday s lecture, Hare-run said, - In the exercise
4.3.2 Configuration. 4.3 Ensemble Prediction System Introduction
 4.3 Ensemble Prediction System 4.3.1 Introduction JMA launched its operational ensemble prediction systems (EPSs) for one-month forecasting, one-week forecasting, and seasonal forecasting in March of 1996,
Tokyo Climate Center Website (TCC website) and its products -For monitoring the world climate and ocean-
 and its products -For monitoring the world climate and ocean-") Tokyo, 14 November 2016, TCC Training Seminar Tokyo Climate Center Website (TCC website) and its products -For monitoring the world climate and ocean- Yasushi MOCHIZUKI Tokyo Climate Center Japan Meteorological
Tokyo, 14 November 2016, TCC Training Seminar Tokyo Climate Center Website (TCC website) and its products -For monitoring the world climate and ocean- Yasushi MOCHIZUKI Tokyo Climate Center Japan Meteorological
Example of the one month forecast
 Example of the one month forecast Masayuki Hirai Tokyo Climate Center (TCC)/ Climate Prediction Division of Japan Meteorological Agency (JMA) Example Note that the initial time and the forecast target
Ensemble Verification Metrics
 Ensemble Verification Metrics Debbie Hudson (Bureau of Meteorology, Australia) ECMWF Annual Seminar 207 Acknowledgements: Beth Ebert Overview. Introduction 2. Attributes of forecast quality 3. Metrics:
Verification of Probability Forecasts
 Verification of Probability Forecasts Beth Ebert Bureau of Meteorology Research Centre (BMRC) Melbourne, Australia 3rd International Verification Methods Workshop, 29 January 2 February 27 Topics Verification
Verification at JMA on Ensemble Prediction
 Verification at JMA on Ensemble Prediction - Part Ⅱ : Seasonal prediction - Yukiko Naruse, Hitoshi Sato Climate Prediction Division Japan Meteorological Agency 05/11/08 05/11/08 Training seminar on Forecasting
Introduction of climate monitoring and analysis products for one-month forecast
 Introduction of climate monitoring and analysis products for one-month forecast TCC Training Seminar on One-month Forecast on 13 November 2018 10:30 11:00 1 Typical flow of making one-month forecast Observed
Verification of Continuous Forecasts
 Verification of Continuous Forecasts Presented by Barbara Brown Including contributions by Tressa Fowler, Barbara Casati, Laurence Wilson, and others Exploratory methods Scatter plots Discrimination plots
EMC Probabilistic Forecast Verification for Sub-season Scales
 EMC Probabilistic Forecast Verification for Sub-season Scales Yuejian Zhu Environmental Modeling Center NCEP/NWS/NOAA Acknowledgement: Wei Li, Hong Guan and Eric Sinsky Present for the DTC Test Plan and
Evaluating Forecast Quality
 Evaluating Forecast Quality Simon J. Mason International Research Institute for Climate Prediction Questions How do we decide whether a forecast was correct? How do we decide whether a set of forecasts
Lecture on outline of JMA s interactive tool for analysis of climate system
 Lecture on outline of JMA s interactive tool for analysis of climate system November 4, 2008 Ushida Shingo Climate Prediction Division of JMA Introduction To announce advanced information about climate
Shuhei Maeda Climate Prediction Division Global Environment and Marine Department Japan Meteorological Agency
 Eighth Session of the Forum on Regional Climate Monitoring, Assessment and Prediction for Asia (FOCRAII) 5-7 April 2012, Beijing, China Shuhei Maeda Climate Prediction Division Global Environment and Marine
Standardized Anomaly Model Output Statistics Over Complex Terrain.
 Standardized Anomaly Model Output Statistics Over Complex Terrain Reto.Stauffer@uibk.ac.at Outline statistical ensemble postprocessing introduction to SAMOS new snow amount forecasts in Tyrol sub-seasonal
Lesson 24: True and False Number Sentences
 NYS COMMON CE MATHEMATICS CURRICULUM Lesson 24 6 4 Student Outcomes Students identify values for the variables in equations and inequalities that result in true number sentences. Students identify values
Introduction of products for Climate System Monitoring
 Introduction of products for Climate System Monitoring 1 Typical flow of making one month forecast Textbook P.66 Observed data Atmospheric and Oceanic conditions Analysis Numerical model Ensemble forecast
Towards Operational Probabilistic Precipitation Forecast
 5 Working Group on Verification and Case Studies 56 Towards Operational Probabilistic Precipitation Forecast Marco Turco, Massimo Milelli ARPA Piemonte, Via Pio VII 9, I-10135 Torino, Italy 1 Aim of the
statistical methods for tailoring seasonal climate forecasts Andrew W. Robertson, IRI
 statistical methods for tailoring seasonal climate forecasts Andrew W. Robertson, IRI tailored seasonal forecasts why do we make probabilistic forecasts? to reduce our uncertainty about the (unknown) future
Allison Monarski, University of Maryland Masters Scholarly Paper, December 6, Department of Atmospheric and Oceanic Science
 Allison Monarski, University of Maryland Masters Scholarly Paper, December 6, 2011 1 Department of Atmospheric and Oceanic Science Verification of Model Output Statistics forecasts associated with the
Experimental MOS Precipitation Type Guidance from the ECMWF Model
 Experimental MOS Precipitation Type Guidance from the ECMWF Model Phillip E. Shafer David E. Rudack National Weather Service Meteorological Development Laboratory Silver Spring, MD Development Overview:
Probabilistic seasonal forecast verification
 Probabilistic seasonal forecast verification Caio Coelho Centro de Previsão de Tempo e Estudos Climáticos (CPTEC) Instituto Nacional de Pesquisas Espaciais (INPE) Plan of lecture Introduction: Examples
The pilot real-time sub-seasonal MME prediction in WMO LC-LRFMME
 The pilot real-time sub-seasonal MME prediction in WMO LC-LRFMME Suhee Park, Jin Ho Yoo, Soonjo Yoon and Miah Kim WMO LC-LRFMME May 2016 1. Introduction WMO and many operational centers realized the necessity
Application and verification of the ECMWF products Report 2007
 Application and verification of the ECMWF products Report 2007 National Meteorological Administration Romania 1. Summary of major highlights The medium range forecast activity within the National Meteorological
Program of the morning lectures
 Program of the morning lectures 09:30~11:00 Lecture Explanation of the numerical weather prediction (NWP) system Introduction of the NWP Products 11:15~12:45 Exercise Download of the binary model outputs
Forecasting precipitation for hydroelectric power management: how to exploit GCM s seasonal ensemble forecasts
 INTERNATIONAL JOURNAL OF CLIMATOLOGY Int. J. Climatol. 27: 1691 1705 (2007) Published online in Wiley InterScience (www.interscience.wiley.com).1608 Forecasting precipitation for hydroelectric power management:
ECMWF 10 th workshop on Meteorological Operational Systems
 ECMWF 10 th workshop on Meteorological Operational Systems 18th November 2005 Crown copyright 2004 Page 1 Monthly range prediction products: Post-processing methods and verification Bernd Becker, Richard
Seasonal Climate Watch September 2018 to January 2019
 Seasonal Climate Watch September 2018 to January 2019 Date issued: Aug 31, 2018 1. Overview The El Niño-Southern Oscillation (ENSO) is still in a neutral phase and is still expected to rise towards an
operational status and developments
 COSMO-DE DE-EPSEPS operational status and developments Christoph Gebhardt, Susanne Theis, Zied Ben Bouallègue, Michael Buchhold, Andreas Röpnack, Nina Schuhen Deutscher Wetterdienst, DWD COSMO-DE DE-EPSEPS
Multi Model Ensemble seasonal prediction of APEC Climate Center
 ECMWF Seminar on Seasonal Prediction, 3-7 Sept. 2012 Multi Model Ensemble seasonal prediction of APEC Climate Center Jin Ho Yoo, Y.-M. Min, S.-J. Sohn, D.-Y. Lee, H. J. Park, J. Y. Seo and S. M. Oh Outline
Seasonal Climate Watch July to November 2018
 Seasonal Climate Watch July to November 2018 Date issued: Jun 25, 2018 1. Overview The El Niño-Southern Oscillation (ENSO) is now in a neutral phase and is expected to rise towards an El Niño phase through
Estimation of Seasonal Precipitation Tercile-Based Categorical Probabilities from Ensembles
 10 J O U R A L O F C L I M A T E VOLUME 0 Estimation of Seasonal Precipitation Tercile-Based Categorical Probabilities from Ensembles MICHAEL K. TIPPETT, ATHOY G. BARSTO, AD ADREW W. ROBERTSO International
Winter Forecast for GPC Tokyo. Shotaro TANAKA Tokyo Climate Center (TCC) Japan Meteorological Agency (JMA)
 Japan Meteorological Agency (JMA)") Winter Forecast for 2013 2014 GPC Tokyo Shotaro TANAKA Tokyo Climate Center (TCC) Japan Meteorological Agency (JMA) NEACOF 5, October 29 November 1, 2013 1 Outline 1. Numerical prediction 2. Interannual
Winter Forecast for 2013 2014 GPC Tokyo Shotaro TANAKA Tokyo Climate Center (TCC) Japan Meteorological Agency (JMA) NEACOF 5, October 29 November 1, 2013 1 Outline 1. Numerical prediction 2. Interannual
Basic Verification Concepts
 Basic Verification Concepts Barbara Brown National Center for Atmospheric Research Boulder Colorado USA bgb@ucar.edu May 2017 Berlin, Germany Basic concepts - outline What is verification? Why verify?
1.10 A NEW SPATIAL SCALE DECOMPOSITION OF THE BRIER SCORE FOR THE VERIFICATION OF PROBABILISTIC LIGHTNING FORECASTS. Abstract
 1.10 A NEW SPATIAL SCALE DECOMPOSITION OF THE BRIER SCORE FOR THE VERIFICATION OF PROBABILISTIC LIGHTNING FORECASTS B. Casati L. J. Wilson Meteorological Service of Canada, Meteorological Research Branch,
Model verification and tools. C. Zingerle ZAMG
 Model verification and tools C. Zingerle ZAMG Why verify? The three most important reasons to verify forecasts are: to monitor forecast quality - how accurate are the forecasts and are they improving over
The Australian Summer Monsoon
 The Australian Summer Monsoon Aurel Moise, Josephine Brown, Huqiang Zhang, Matt Wheeler and Rob Colman Australian Bureau of Meteorology Presentation to WMO IWM-IV, Singapore, November 2017 Outline Australian
Multi-Model Ensembles in NWS Climate Prediction Center Subseasonal to Seasonal Forecasts: Metrics for Impact Events
 Multi-Model Ensembles in NWS Climate Prediction Center Subseasonal to Seasonal Forecasts: Metrics for Impact Events Dan Collins, Climate Prediction Center Sarah Strazzo, CSIRO partners Q.J. Wang and Andrew
DISCRETE RANDOM VARIABLES EXCEL LAB #3
 DISCRETE RANDOM VARIABLES EXCEL LAB #3 ECON/BUSN 180: Quantitative Methods for Economics and Business Department of Economics and Business Lake Forest College Lake Forest, IL 60045 Copyright, 2011 Overview
Seasonal Climate Watch June to October 2018
 Seasonal Climate Watch June to October 2018 Date issued: May 28, 2018 1. Overview The El Niño-Southern Oscillation (ENSO) has now moved into the neutral phase and is expected to rise towards an El Niño
Background of Symposium/Workshop Yuhei Takaya Climate Prediction Division Japan Meteorological Agency
 Background of Symposium/Workshop Yuhei Takaya ytakaya@met.kishou.go.jp Climate Prediction Division Japan Meteorological Agency 1 Long-Range Forecast, Tokyo Japan, 8-10 December Outline Background of Dynamical
Seasonal Climate Watch April to August 2018
 Seasonal Climate Watch April to August 2018 Date issued: Mar 23, 2018 1. Overview The El Niño-Southern Oscillation (ENSO) is expected to weaken from a moderate La Niña phase to a neutral phase through
Forecasting Extreme Events
 Forecasting Extreme Events Ivan Tsonevsky, ivan.tsonevsky@ecmwf.int Slide 1 Outline Introduction How can we define what is extreme? - Model climate (M-climate); The Extreme Forecast Index (EFI) Use and
Exploring ensemble forecast calibration issues using reforecast data sets
 NOAA Earth System Research Laboratory Exploring ensemble forecast calibration issues using reforecast data sets Tom Hamill and Jeff Whitaker NOAA Earth System Research Lab, Boulder, CO tom.hamill@noaa.gov
Application and verification of ECMWF products 2013
 Application and verification of EMWF products 2013 Hellenic National Meteorological Service (HNMS) Flora Gofa and Theodora Tzeferi 1. Summary of major highlights In order to determine the quality of the
Long Range Forecasts of 2015 SW and NE Monsoons and its Verification D. S. Pai Climate Division, IMD, Pune
 Long Range Forecasts of 2015 SW and NE Monsoons and its Verification D. S. Pai Climate Division, IMD, Pune Other Contributors: Soma Sen Roy, O. P. Sreejith, Kailas, Madhuri, Pallavi, Mahendra and Jasmine
Verification of the operational NWP models at DWD - with special focus at COSMO-EU
 Verification of the operational NWP models at DWD - with special focus at COSMO-EU Ulrich Damrath Ulrich.Damrath@dwd.de Ein Mensch erkennt (und das ist wichtig): Nichts ist ganz falsch und nichts ganz
Probabilistic verification
 Probabilistic verification Chiara Marsigli with the help of the WG and Laurie Wilson in particular Goals of this session Increase understanding of scores used for probability forecast verification Characteristics,
Sixth Session of the ASEAN Climate Outlook Forum (ASEANCOF-6)
") Sixth Session of the ASEAN Climate Outlook Forum (ASEANCOF-6) Consensus Bulletin for June-July-August 2016 Season Introduction The Sixth ASEAN Climate Outlook Forum (ASEANCOF-6) was organised by the Philippine
Sixth Session of the ASEAN Climate Outlook Forum (ASEANCOF-6) Consensus Bulletin for June-July-August 2016 Season Introduction The Sixth ASEAN Climate Outlook Forum (ASEANCOF-6) was organised by the Philippine
Report on stay at ZAMG
 Report on stay at ZAMG Viena, Austria 13.05.2013 05.07.2013 Simona Tascu NMA, Romania Supervised by: Yong Wang and Theresa Gorgas Introduction The goal of the present stay was to develop and optimize the
2.6 Operational Climate Prediction in RCC Pune: Good Practices on Downscaling Global Products. D. S. Pai Head, Climate Prediction Group
 SECOND WMO WORKSHOP ON OPERATIONAL CLIMATE PREDICTION 30 May - 1 June 2018, Barcelona, Spain 2.6 Operational Climate Prediction in RCC Pune: Good Practices on Downscaling Global Products D. S. Pai Head,
The Plant-Craig stochastic Convection scheme in MOGREPS
 The Plant-Craig stochastic Convection scheme in MOGREPS R. J. Keane R. S. Plant W. J. Tennant Deutscher Wetterdienst University of Reading, UK UK Met Office Keane et. al. (DWD) PC in MOGREPS / 6 Overview
Math 95--Review Prealgebra--page 1
 Math 95--Review Prealgebra--page 1 Name Date In order to do well in algebra, there are many different ideas from prealgebra that you MUST know. Some of the main ideas follow. If these ideas are not just
Drought forecasting methods Blaz Kurnik DESERT Action JRC
 Ljubljana on 24 September 2009 1 st DMCSEE JRC Workshop on Drought Monitoring 1 Drought forecasting methods Blaz Kurnik DESERT Action JRC Motivations for drought forecasting Ljubljana on 24 September 2009
Seasonal Forecast (One-month Forecast)
") Seasonal Forecast (One-month Forecast) Hiroshi Ohno Tokyo Climate Center (TCC)/ Climate Prediction Division of Japan Meteorological Agency (JMA) Outline Introduction Predictability and Ensemble Prediction
Seasonal Forecast (One-month Forecast) Hiroshi Ohno Tokyo Climate Center (TCC)/ Climate Prediction Division of Japan Meteorological Agency (JMA) Outline Introduction Predictability and Ensemble Prediction
Optimal combination of NWP Model Forecasts for AutoWARN
 ModelMIX Optimal combination of NWP Model Forecasts for AutoWARN Tamas Hirsch, Reinhold Hess, Sebastian Trepte, Cristina Primo, Jenny Glashoff, Bernhard Reichert, Dirk Heizenreder Deutscher Wetterdienst
ALASKA REGION CLIMATE OUTLOOK BRIEFING. November 16, 2018 Rick Thoman Alaska Center for Climate Assessment and Policy
 ALASKA REGION CLIMATE OUTLOOK BRIEFING November 16, 2018 Rick Thoman Alaska Center for Climate Assessment and Policy Today s Outline Feature of the month: Southeast Drought Update Climate Forecast Basics
ENSEMBLE FLOOD INUNDATION FORECASTING: A CASE STUDY IN THE TIDAL DELAWARE RIVER
 ENSEMBLE FLOOD INUNDATION FORECASTING: A CASE STUDY IN THE TIDAL DELAWARE RIVER Michael Gomez & Alfonso Mejia Civil and Environmental Engineering Pennsylvania State University 10/12/2017 Mid-Atlantic Water
Tokyo Climate Center s activities as RCC Tokyo
 First WMO Workshop on Operational Climate Prediction Pune, India, 09-11 November 2015 Tokyo Climate Center s activities as RCC Tokyo Arata Endo Tokyo Climate Center Japan Meteorological Agency E-mail:
The Impact of Horizontal Resolution and Ensemble Size on Probabilistic Forecasts of Precipitation by the ECMWF EPS
 The Impact of Horizontal Resolution and Ensemble Size on Probabilistic Forecasts of Precipitation by the ECMWF EPS S. L. Mullen Univ. of Arizona R. Buizza ECMWF University of Wisconsin Predictability Workshop,
Orange Visualization Tool (OVT) Manual
 Manual") Orange Visualization Tool (OVT) Manual This manual describes the features of the tool and how to use it. 1. Contents of the OVT Once the OVT is open (the first time it may take some seconds), it should
Orange Visualization Tool (OVT) Manual This manual describes the features of the tool and how to use it. 1. Contents of the OVT Once the OVT is open (the first time it may take some seconds), it should
Severe storm forecast guidance based on explicit identification of convective phenomena in WRF-model forecasts
 Severe storm forecast guidance based on explicit identification of convective phenomena in WRF-model forecasts Ryan Sobash 10 March 2010 M.S. Thesis Defense 1 Motivation When the SPC first started issuing
Verification of African RCOF Forecasts
 Technical Report #09-02 RCOF Review 2008 Position Paper: Verification of African RCOF Forecasts by Dr. Simon Mason and Mr. Simbarashe Chidzambwa Dr Simon J. Mason International Research Institute for Climate
Deterministic and Probabilistic prediction approaches in Seasonal to Inter-annual climate forecasting
 RA 1 EXPERT MEETING ON THE APPLICATION OF CLIMATE FORECASTS FOR AGRICULTURE Banjul, Gambia, 9-13 December 2002 Deterministic and Probabilistic prediction approaches in Seasonal to Inter-annual climate
WMO Lead Centre activities for global sub-seasonal MME prediction
 Workshop on sub-seasonal predictability, 2-5 November 2015, ECMWF WMO Lead Centre activities for global sub-seasonal MME prediction Suhee Park Korea Meteorological Administration Contents Introduction
Five years of limited-area ensemble activities at ARPA-SIM: the COSMO-LEPS system
 Five years of limited-area ensemble activities at ARPA-SIM: the COSMO-LEPS system Andrea Montani, Chiara Marsigli and Tiziana Paccagnella ARPA-SIM Hydrometeorological service of Emilia-Romagna, Italy 11
Predicting uncertainty in forecasts of weather and climate (Also published as ECMWF Technical Memorandum No. 294)
") Predicting uncertainty in forecasts of weather and climate (Also published as ECMWF Technical Memorandum No. 294) By T.N. Palmer Research Department November 999 Abstract The predictability of weather
Predicting uncertainty in forecasts of weather and climate (Also published as ECMWF Technical Memorandum No. 294) By T.N. Palmer Research Department November 999 Abstract The predictability of weather
Motivation & Goal. We investigate a way to generate PDFs from a single deterministic run
 Motivation & Goal Numerical weather prediction is limited by errors in initial conditions, model imperfections, and nonlinearity. Ensembles of an NWP model provide forecast probability density functions
Ensemble forecasting: Error bars and beyond. Jim Hansen, NRL Walter Sessions, NRL Jeff Reid,NRL May, 2011
 Ensemble forecasting: Error bars and beyond Jim Hansen, NRL Walter Sessions, NRL Jeff Reid,NRL May, 2011 1 Why ensembles Traditional justification Predict expected error (Perhaps) more valuable justification
WMO LC-LRFMME Website User Manual
 WMO LC-LRFMME Website User Manual World Meteorological Organization Lead Centre for Long-Range Forecast Multi-Model Ensemble Last update: August 2016 Contents 1. WMO LC-LRFMME Introduction... 1 1.1. Overview
The ECMWF Extended range forecasts
 The ECMWF Extended range forecasts Laura.Ferranti@ecmwf.int ECMWF, Reading, U.K. Slide 1 TC January 2014 Slide 1 The operational forecasting system l High resolution forecast: twice per day 16 km 91-level,
Sampling Distributions of the Sample Mean Pocket Pennies
 You will need 25 pennies collected from recent day-today change Some of the distributions of data that you have studied have had a roughly normal shape, but many others were not normal at all. What kind
The 2010/11 drought in the Horn of Africa: Monitoring and forecasts using ECMWF products
 The 2010/11 drought in the Horn of Africa: Monitoring and forecasts using ECMWF products Emanuel Dutra Fredrik Wetterhall Florian Pappenberger Souhail Boussetta Gianpaolo Balsamo Linus Magnusson Slide
FORECASTING poor air quality events associated with
 A Comparison of Bayesian and Conditional Density Models in Probabilistic Ozone Forecasting Song Cai, William W. Hsieh, and Alex J. Cannon Member, INNS Abstract Probabilistic models were developed to provide
Hands-on Exercise Quantitative Precipitation Estimation
 Hands-on Exercise Quantitative Precipitation Estimation 8 February 2018 Takanori SAKANASHI Asia Pacific Severe Weather Center, Forecast Division, Forecast Department Purpose of this hands-on training To
Rainfall is the most important climate element affecting the livelihood and wellbeing of the
 Ensemble-Based Empirical Prediction of Ethiopian Monthly-to-Seasonal Monsoon Rainfall Rainfall is the most important climate element affecting the livelihood and wellbeing of the majority of Ethiopians.
Lecture 3. The Population Variance. The population variance, denoted σ 2, is the sum. of the squared deviations about the population
 Lecture 5 1 Lecture 3 The Population Variance The population variance, denoted σ 2, is the sum of the squared deviations about the population mean divided by the number of observations in the population,
The U. S. Winter Outlook
 The 2017-2018 U. S. Winter Outlook Michael Halpert Deputy Director Climate Prediction Center Mike.Halpert@noaa.gov http://www.cpc.ncep.noaa.gov Outline About the Seasonal Outlook Review of 2016-17 U. S.
Eureka Lessons for 6th Grade Unit FIVE ~ Equations & Inequalities
 Eureka Lessons for 6th Grade Unit FIVE ~ Equations & Inequalities These 2 lessons can easily be taught in 2 class periods. If you like these lessons, please consider using other Eureka lessons as well.
The U. S. Winter Outlook
 The 2018-2019 U. S. Winter Outlook Michael Halpert Deputy Director Climate Prediction Center Mike.Halpert@noaa.gov http://www.cpc.ncep.noaa.gov Outline About the Seasonal Outlook Review of 2017-18 U. S.
Jaime Ribalaygua 1,2, Robert Monjo 1,2, Javier Pórtoles 2, Emma Gaitán 2, Ricardo Trigo 3, Luis Torres 1. Using ECMWF s Forecasts (UEF2017)
") Using ECMWF s Forecasts (UEF2017) Post processing of ECMWF EPS outputs by using an analog and transference technique to improve the extreme rainfall predictability in Ebro basin (Spain) [ IMDROFLOOD ]
Using ECMWF s Forecasts (UEF2017) Post processing of ECMWF EPS outputs by using an analog and transference technique to improve the extreme rainfall predictability in Ebro basin (Spain) [ IMDROFLOOD ]
Basic Verification Concepts
 Basic Verification Concepts Barbara Brown National Center for Atmospheric Research Boulder Colorado USA bgb@ucar.edu Basic concepts - outline What is verification? Why verify? Identifying verification
Stochastic Modelling
 Stochastic Modelling Simulating Random Walks and Markov Chains This lab sheets is available for downloading from www.staff.city.ac.uk/r.j.gerrard/courses/dam/, as is the spreadsheet mentioned in section
Verification of ECMWF products at the Finnish Meteorological Institute
 Verification of ECMWF products at the Finnish Meteorological Institute by Juha Kilpinen, Pertti Nurmi and Matias Brockmann 1. Summary of major highlights The new verification system is under pre-operational
A simple method for seamless verification applied to precipitation hindcasts from two global models
 A simple method for seamless verification applied to precipitation hindcasts from two global models Matthew Wheeler 1, Hongyan Zhu 1, Adam Sobel 2, Debra Hudson 1 and Frederic Vitart 3 1 Bureau of Meteorology,
Model error and seasonal forecasting
 Model error and seasonal forecasting Antje Weisheimer European Centre for Medium-Range Weather Forecasts ECMWF, Reading, UK with thanks to Paco Doblas-Reyes and Tim Palmer Model error and model uncertainty
Estimation of seasonal precipitation tercile-based categorical probabilities. from ensembles. April 27, 2006
 Estimation of seasonal precipitation tercile-based categorical probabilities from ensembles MICHAEL K. TIPPETT, ANTHONY G. BARNSTON AND ANDREW W. ROBERTSON International Research Institute for Climate