Reservoir Control Center U. S Army Corps of Engineers Northwestern Division - Missouri River Basin Omaha, Nebraska
|
|
|
- Rodney Matthews
- 5 years ago
- Views:
Transcription


1 US Army Corps of Engineers Fort Peck Garrison Oahe Big Bend Gavins Point Ft. Randall Reservoir Control Center U. S Army Corps of Engineers Northwestern Division - Missouri River Basin Omaha, Nebraska April 2004
2 MISSOURI RIVER MAINSTEM RESERVOIRS Summary of Actual 2003 Operations List of Figures... iv List of Tables... iv List of Plates... iv List of Abbreviations and Acronyms...v Definition of Terms... vi I. FOREWORD...1 II. REVIEW OF REGULATION FROM JANUARY 2003 DECEMBER A. General...1 B. Precipitation and Water Supply Available in Plains Snowpack Mountain Snowpack...4 a. Fall b. January c. February d. March e. April f. May g. Summary Weather Conditions January December a. January b. February c. March d. April e. May f. June g. July h. August i. September j. October k. November l. December Calendar Year Runoff...15 C. System Regulation System Regulation January December Fort Peck Regulation January December a. General...19 b. Winter i
3 c. Winter River and Ice Conditions Below Fort Peck...19 d. Spring e. Summer f. Fall g. Summary Garrison Regulation January December a. General...20 b. Winter c. Winter River and Ice Conditions Below Garrison...21 d. Spring e. Summer f. Fall g. Summary Oahe and Big Bend Regulation January December a. General...22 b. Winter c. Spring d. Summer e. Fall f. Summary Fort Randall Regulation January December a. General...24 b. Winter c. Spring d. Summer e. Fall f. Summary Gavins Point Regulation January December a. General...26 b. Winter c. Winter River and Ice Conditions Below Gavins Point...27 d. Spring e. Summer f. Fall g. Summary...29 D. Non-Routine Regulation and Other Items Pertaining to System Regulation Lawsuits...29 a. 8 th Circuit Court Ruling...29 b. Settlement Agreement with Lower Brule and Crow Creek Sioux...30 c. Multi-district Litigation Panel...30 d. North Dakota Water Quality...30 e. American Rivers Fort Peck Mini-Test and Intrasystem Unbalancing Water Supply Issues Consultation on the 2003 AOP...33 E. Reservoir Releases and Storage...35 ii
4 F. Summary of Results Flood Control Irrigation Water Supply and Water Quality Control Navigation Power Eastern Division, Pick-Sloan Missouri Basin Program (P-S MBP) Fish Management Threatened and Endangered Species Recreation and Resource Management...55 iii
5 LIST OF FIGURES Mountain Snowpack Palmer Drought Severity Maps Percent Normal Precipitation Maps Missouri River Main Stem Annual Runoff at Sioux City, Iowa Missouri River Runoff Above Sioux City, Iowa A Cumulative Flood Damages Prevented B Annual Flood Damages Prevented Sioux City, Nebraska City, and St. Joseph Regulated and Unregulated Flows A End-of-July Lake Elevations for Fort Peck and Garrison B End-of-July Lake Elevations for Oahe and Total System Storage Missouri River Total Tonnage and Commercial Tonnage Missouri River Flows at Sioux City, Nebraska City and Kansas City Main Stem Power Generation Missouri River Main Stem Project Visitor Hours...58 LIST OF TABLES Calendar Year Runoff for Selected Reaches Upper Missouri River Basin Runoff for Calendar Year Reservoir Levels and Storages July 31, Reservoir Levels and Storages December 31, Water Quality Issues and Concerns Tonnage by Commodities Navigation Season Target Flows Missouri River Navigation Tonnage and Season Length Gross Power System Generation Historical Generation and Load Data Historical Generation and Load Data Missouri River Main Stem Least Tern and Piping Plover Survey Data Visitation of System Reservoirs...57 LIST OF PLATES 1 Missouri River Basin Map 2A Summary of Engineering Data Missouri River Main Stem Reservoirs 2B Summary of Engineering Data Missouri River Main Stem Reservoirs 3 Precipitation Radar Image June 22-23, Mainstem Dissolved Oxygen Profiles iv
6 LIST OF ABBREVIATIONS AOP - annual operating plan ac.ft. - acre-feet AF - acre-feet B - Billion cfs - cubic feet per second COE - Corps of Engineers CY - calendar year (January 1 to December 31) EA - Environmental Assessment EIS - Environmental Impact Statement elev - elevation ESA - Endangered Species Act of 1978 ft - feet FWS - U.S. Fish and Wildlife Service FY - fiscal year (October 1 to September 30) GIS - Geographic Information System GWh - gigawatt hour KAF - 1,000 acre-feet Kcfs - 1,000 cubic feet per second kw - kilowatt kwh - kilowatt hour M - million MAF - million acre-feet MRBA - Missouri River Basin Association MRNRC - Missouri River Natural Resources Committee msl - mean sea level MW - megawatt MWh - megawatt hour NEPA - National Environmental Policy Act plover - piping plover pp - powerplant RM - river mile SWE - snow water equivalent tern - interior least tern tw - tailwater T&E - threatened and endangered USGS - United States Geological Survey yr - year v
7 DEFINITION OF TERMS Acre-foot (AF, ac-ft) is the quantity of water required to cover 1 acre to a depth of 1 foot and is equivalent to 43,560 cubic feet or 325,850 gallons. Cubic foot per second (cfs) is the rate of discharge representing a volume of 1 cubic foot passing a given point during 1 second and is equivalent to approximately 7.48 gallons per second or gallons per minute. The volume of water represented by a flow of 1 cubic foot per second for 24 hours is equivalent to 86,400 cubic feet, approximately acre-feet, or 646,272 gallons. Discharge is the volume of water (or more broadly, volume of fluid plus suspended sediment) that passes a given point within a given period of time. Drainage area of a stream at a specific location is that area, measured in a horizontal plane, enclosed by a topographic divide from which direct surface runoff from precipitation normally drains by gravity into the river above the specified point. Figures of drainage area given herein include all closed basins, or noncontributing areas, within the area unless otherwise noted. Drainage basin is a part of the surface of the earth that is occupied by drainage system, which consists of a surface stream or body of impounded surface water together with all tributary surface streams and bodies of impounded water. Gaging station is a particular site on a stream, canal, lake, or reservoir where systematic observations of hydrologic data are obtained. Runoff in inches shows the depth to which the drainage area would be covered if all the runoff for a given time period were uniformly distributed on it. Streamflow is the discharge that occurs in a natural channel. Although the term "discharge" can be applied to the flow of a canal, the word "streamflow" uniquely describes the discharge in a surface stream course. The term "streamflow" is more general than "runoff" as streamflow may be applied to discharge whether or not it is affected by diversion or regulation. vi
8 MISSOURI RIVER MAINSTEM RESERVOIR SYSTEM Summary of Actual 2003 Operations I. FOREWORD This document contains a summary of the actual regulation of the Missouri River Mainstem Reservoir System (System) for the 2003 Calendar Year (CY). Two other reports related to System regulation are also available. All three reports, this Summary of Actual Calendar Year 2003 Operation, System Description and Operation, and 2004 Annual Operating Plan can be obtained by contacting the Missouri River Basin Water Management Division at West Center Road, Omaha, Nebraska , phone (402) The reports will also be available on the Northwestern Division website at < A basin map is presented on Plate 1 and the pertinent data for the Missouri River System is shown on Plate 2A and Plate 2B. A. GENERAL II. REVIEW OF REGULATION JANUARY - DECEMBER 2003 During the 2003 Calendar Year (CY), the System was regulated in accordance with the applicable provisions of the AOP, which was made available for review and comment by representatives of State and Federal agencies, the general public and specific interest groups. A summary of the significant events during this past year is given in the following paragraphs. B. PRECIPITATION AND WATER SUPPLY AVAILABLE IN 2003 The 2003 runoff year was the fourth consecutive drought year experienced in the Missouri River Basin. Table 1 shows the calendar year runoff totals for CY 2003 above Sioux City, Iowa as well as runoff in reaches from Sioux City to Hermann, Missouri. Table 2 shows the 2003 CY monthly runoff for selected reaches. 1. Plains Snowpack The months of November and December 2002 were very dry across the Missouri River basin plains areas. Three locations, Faith (0.00 inch) and Winner (trace), South Dakota and Miles City, Montana (0.02 inch) recorded their lowest November precipitation totals since the 1950 s and 1960 s. A very dry pattern persisted across the northern and central High Plains during December. Kansas City, Missouri endured a 41-day dry spell from November 15 to December 26. West central Iowa and southwest Iowa were below normal with respect to precipitation for the month of December. West central Iowa averaged 0.03 inch of precipitation or a departure from normal of a 0.98 inch. Average December snowfall across west central Iowa was 0.6 1
9 inch. In the Norfolk, Nebraska area, the month of December was the driest since 1943 and the 4 driest December on record. The monthly snowfall total was 0.5 inch, with tied for the 8 lowest. TABLE CALENDAR YEAR RUNOFF FOR SELECTED REACHES Reach Average Runoff Volume (in 1000 AF) Calendar Year 2003 Runoff Volume (in 1000 AF) Percent of Average Runoff Above Fort Peck 7,395 4, Fort Peck to Garrison 10,840 8, Garrison to Oahe 2,430 1, Oahe to Fort Randall Fort Randall to Gavins Point 1,675 1, Gavins Point to Sioux City 1,940 1, TOTAL ABOVE SIOUX CITY 25,190 17, Sioux City to Nebraska City 7,800 4, Nebraska City to Kansas City 12,530 3, Kansas City to Hermann 24,460 8, TOTAL BELOW SIOUX CITY* 44,790 16, * Runoff in the reaches from Sioux City to Hermann is not adjusted to 1949 depletion levels. Averages are taken from USGS Water Data Reports for the period The new year began similar to how 2002 ended with continued dry and warm temperatures in the northern and central High Plains. Kansas City, Missouri completed its third-driest 3-month period on record. Kansas City totaled just 0.82 inch (16 percent of normal) from November to January. In central Nebraska, the snowfall was about 9 inches, near normal for January. On January 27, snow depths over the plains of South Dakota and Nebraska varied from 1-3 inches. Snow depths over the North Dakota, Montana and Wyoming plains varied from 3-5 inches. There was no plains snow accumulation in Kansas and Colorado. The dry conditions persisted through the month of February. On February 24, snow depths over the Nebraska, Kansas, and South Dakota plains measured 1-2 inches. In the North Dakota, Montana, Wyoming and Colorado plains, snow depths varied from 3-5 inches. Early March brought snowfall to the plains area. March 5-8 snowfall in Montana included 15.4 inches in Billings and 5.8 inches in Glasgow. As of March 10 plains snow depths in eastern Montana had risen to the inch range. Snow depths in North Dakota were 4-7 inches and 1-5 inches in the South Dakota plains area. Eastern and central Nebraska totaled 1-2 inches for March. There was very little plains snow evident in western Nebraska, eastern Wyoming, eastern Colorado or the entire state of Kansas. By March 17 very warm weather had melted all the plains snow in the basin. From March snow fell in the Rockies and western plains. Denver, Colorado recorded 31.8 inches in the 3-day period, Cheyenne, Casper and Lander, Wyoming recorded totals of 18.3 inches, 13.3 inches and 12.0 inches, respectively. 2
10 TABLE 2 Missouri River Basin Final Calendar Year 2003 Runoff Historic 2-Jan-04 Reach Fort Garrison Oahe Fort Gavins Sioux Summation Summation Accumulated Above Peck Randall Point City above above Summation Gavins Sioux above Point City Sioux City Values in 1000 Acre Feet (History) JAN NORMAL DEPARTURE % OF NORM 67% 71% -130% -5% 46% 169% 61% 66% 66% FEB ,186 NORMAL ,075 1,815 DEPARTURE % OF NORM 47% 41% 49% 208% 102% 122% 60% 65% 65% MAR , ,809 2,985 4,171 NORMAL 610 1, ,625 2,925 4,740 DEPARTURE % OF NORM 102% 147% 84% 35% 65% 59% 107% 102% 88% APR ,522 1,678 5,849 NORMAL 665 1, ,605 2,945 7,685 DEPARTURE ,083-1,267-1,836 % OF NORM 80% 62% 20% 58% 63% 46% 58% 57% 76% MAY ,350 2,594 8,443 NORMAL 1,120 1, ,050 3,325 11,010 DEPARTURE ,567 % OF NORM 70% 70% 119% 89% 83% 89% 77% 78% 77% JUN ,097 2, ,173 4,420 12,863 NORMAL 1,655 2, ,145 5,415 16,425 DEPARTURE ,562 % OF NORM 66% 98% 40% 48% 84% 91% 81% 82% 78% JUL ,540 1,760 14,623 NORMAL 835 1, ,025 3,240 19,665 DEPARTURE ,485-1,480-5,042 % OF NORM 33% 54% 58% 95% 86% 102% 51% 54% 74% AUG ,038 NORMAL ,205 1,335 21,000 DEPARTURE ,962 % OF NORM 40% 14% 66% 95% 62% 25% 32% 31% 72% SEP ,533 NORMAL ,080 1,175 22,175 DEPARTURE ,642 % OF NORM 40% 25% 54% 45% 68% 87% 38% 42% 70% OCT ,107 NORMAL ,125 1,200 23,375 DEPARTURE ,268 % OF NORM 53% 44% 71% -170% 58% 35% 49% 48% 69% NOV ,678 NORMAL ,070 24,445 DEPARTURE ,767 % OF NORM 56% 45% -26% 10% 108% 72% 52% 53% 68% DEC ,594 NORMAL ,190 DEPARTURE ,596 % OF NORM 92% 131% 11250% 140% 116% 224% 97% 123% 70% Calendar Year Totals 4,713 8,028 1, ,305 1,502 16,092 17,594 NORMAL 7,395 10,840 2, ,675 1,940 23,250 25,190 DEPARTURE -2,682-2, ,158-7,596 % OF NORM 64% 74% 60% 64% 78% 77% 69% 70% 3
11 2. Mountain Snowpack a. Fall 2002 In Montana, the snowfall season got off to a very slow start, even slower than in The mountain snowpack distribution consisted of low and mid-elevation mountain snowpack that was generally less than the high elevation mountain snowpack. For the first part of the winter season, the El Nino-influenced forecast for above average temperatures and below average precipitation held true. Mountain snowpack amounts in Montana were quite variable across the state and totaled generally 20 to 30 percent below the previous year s totals for this time of the year. Mountain snow water content statewide was 63 percent of average and 77 percent of Fall Snowpack in Montana in the headwaters of the Missouri River was 66 percent of average and 88 percent of last year. In Wyoming, snow water equivalent (SWE) across the state was below normal in the beginning of the snowpack season. The northwest portion of the state was 73 percent of normal. Northeast Wyoming was 79 percent of normal, and the southeast part of the state was 76 percent of average. Although the state received quite a bit of snow early this fall, little snowfall occurred in November and December SWE was generally below average for the entire State. b. January 2003 Montana had several storms move across areas of the state during January adding much needed mountain snow. Regions with the largest gains were in the southern half of the state. There were several rain events during January but there was no significant snowpack loss from the rains. January average temperature departures state-wide were generally 5 to 6 degrees above normal. Mountain snowpack statewide was 73 percent of average and 81 percent of the previous year. In the headwaters of the Missouri River basin, snowpack was 74 percent of average and 95 percent of the previous year. In Wyoming, SWE across the state was generally below normal for this time of the year, about 76 percent of normal. Precipitation for December varied from 18 to 74 percent below average for the State. Year-to-date precipitation was also below average for the year. Although the state received quite a bit of snow in the early fall, little snowfall had occurred in January. SWE was generally below average for the entire State. c. February 2003 February storm activity in the southern half of Montana added significant amounts of mountain snow. After a slow start in mountain snow accumulation, February snowpack increases were observed in many river basins by 10 to 15 percent. Storms in the first half of February were associated with warm and very moist air. Towards the end of the month, record cold air pushed across Montana and the associated snowfall had much less moisture, but improvements still occurred. By March 1 there are normally about four to six weeks remaining in the annual snowfall accumulation season. Statewide, mountain snow water content was 79 percent of 4
12 average and 91 percent of last year. In the headwaters of the Missouri River basin, snowpack was 84 percent of average and 109 percent of last year. Snow accumulation in the Upper Clark Fork, Jefferson, and Gallatin River basins had improved significantly, reaching into the 80 percent of average, or more, after having a snowpack at or below 60 percent on January 1. In comparative years, this level of accumulation has occurred about one third of the time. On the other hand, when the March 1 snowpack is 60 percent of average, or less, recovery to 80 percent or greater by April has occurred only 8 percent of the time. Unfortunately, this is what the Sun, Teton, and Marias River basins were facing. In Wyoming, SWE amounts for the Deer, LaPrelle, North Platte, Laramie, and Little Laramie River basins all remained below normal, ranging from 59 to 81 percent of normal. d. March 2003 In Montana, March was the second consecutive month in which mountain snowfall made significant increases in the snow water content. March mountain precipitation was generally above to well above average with several basins about twice of normal. Temperatures were somewhat variant causing low land flooding during a warm spell the second week of March. Valley temperatures generally near to below average in the Missouri River headwaters. By the end of the month, mountain snow water contents statewide were 93 percent of average and 97 percent of last year. In the headwaters, snowpack was 96 percent of average and 115 percent of last year. In Wyoming, precipitation, generally in the form of snow, fell at an above average rate during March. However, the SWE of 96 percent of normal across the state was below normal for this time of the year. Precipitation for the month was above average. Precipitation varied from 1 percent above normal to 104 percent above normal. Except for the northwest and north central part of the State, basins reported year-to-date precipitation below average. Reservoir levels varied for this time of year from below average to average in the northeast. Many of the larger reservoirs were below average. Forecasted runoff varied from 24 to 101 percent of average. There were concerns that some reservoirs would not fill with the spring runoff, especially in the eastern portion of the State. Snowfall had occurred at an above average rate during March. Although conditions did improve greatly, SWE was below normal for some portions of the State. SWE in the northwestern portion of the State was at 94 percent of average (103 percent of last year). Northeast Wyoming SWE was currently about 105 percent of average (131 percent of last year). March precipitation was generally very good across the State. The entire State received above average precipitation for the month. The northeast and the southwest were just above average while the rest of the State received well above average precipitation. e. April 2003 In Montana, April precipitation varied across the state. The Missouri River basin experienced 126 percent of average precipitation and the Yellowstone River basin experienced 76 percent of average precipitation. April temperatures were generally near average in the southwest portion of the state and above average across other areas of Montana. Mountain snowmelt that occurred during April was near average and most low elevation snow melted 5
13 during April. Higher mountain areas did receive additional snow through the month. Mountain snow water contents ranged from a low of 60 percent of average in the Teton River basin to a high of 118 percent of average in the West Fork Bitterroot River basin. Statewide, mountain snow water content was 92 percent of average and 91 percent of last year. Snowpack in the Missouri River basin was 91 percent of average and 101 percent of last year. Snowpack in the Yellowstone River basin was 87 percent of average and 111 percent of last year. In Wyoming, SWE across the state was below normal for this time of the year, about 83 percent of normal. Precipitation for the month was mixed, with some better than average and some well below average. Generally, the south and south central portion of the state faired better than the remaining. All basins, except the Shoshone, Clarks Fork, and upper North Platte River, reported water year-to-date precipitation below average. Many of the larger reservoirs still had reservoir levels that were below average. Forecasted runoff varied from 38 to 88 percent of average, with the average for the state being about 68 percent. It was forecasted that some irrigated areas would be short of water. In some cases, reservoirs were not expected to fill with the spring runoff, especially in the southern portion of the State. April precipitation was generally below average. Most of the State received well below average precipitation over the past month. The Upper North Platte and Little Snake were the only basins in the State with above average precipitation for the month. The southwest portion of Wyoming received less than 40 percent of normal for April. Year to date precipitation was generally below average across the State. f. May 2003 In Montana, May was a month of extremes. Early in the month, snow was accumulating in the mountains and record low temperatures were experienced in southwest Montana. By the end of the month, temperatures rebounded to record highs with snowmelt well above average. The cold temperatures early in the month held on to snow that melted rapidly with the high temperatures later in the month. With above average temperatures there were several areas that had flooding. Flooding was generally minor and occurred mainly on farmland. With the rapid snowmelt, most streams and rivers had reached their snowmelt peaks for this year. As of June 1, the remaining mountain snow water contents generally ranged from near average to severely below average. Statewide, the mountain snow water content was 85 percent of average and 75 percent of the previous year. In the Missouri River headwaters, snowpack was 73 percent of average and 93 percent of last year. In Wyoming, SWE amounts for the Deer, LaPrelle, North Platte, Laramie, and Little Laramie River basins were all below normal. The SWE totals ranged from 0 percent in the Deer and LaPrelle Creek basins to 88 percent in the Laramie River basin. g. Summary Overall snow water content totals recorded during the entire snow season ending July 1, 2003 were near normal. The mountain snowpack in the reach above Fort Peck peaked on April 8 at 92 percent of the normal peak accumulation. The mountain snowpack in the reach between Fort Peck and Garrison peaked on April 9 at 101 percent of the normal peak accumulation. The 6
14 mountain snow accumulation and melt above Fort Peck and Garrison are illustrated in Figure Weather Conditions The following weather summaries are from the USDA Weekly Weather and Crop Bulletins. a. January 2003 Mild, dry weather prevailed on the Plains, where weekly temperatures averaged 4 to 16 F above normal. Drought-related concerns on the northern and central High Plains included soil moisture shortages and no protective snow cover. Warmth overspread the Plains and Midwest on January 7-8, boosting the national tally of daily-record highs to nearly 200 for the week. Omaha, Nebraska missed their monthly record high temperature by 1 F. By mid-month, from Montana to Nebraska, low temperatures that ranged from 0 to 30 F. On January 19, daily records were posted at Valentine, Nebraska (low of 23 F), Salina, Kansas (high of 68 F) and Sheridan, Wyoming (high of 61 F). A day later, temperatures as low as 20 F were reported across the upper Midwest. Kansas City, Missouri ended January as the third driest 3-month period (November 2002 January 2003) with just 0.82 inches of precipitation. The end of January saw high temperatures in the High Plains. On January 26, Great Falls, Montana noted a low of 0 F and a high of 56 F. In Nebraska, North Platte attained a daily-record high of 67 F on January 27, just days after their lowest reading of the month of 3 F on January 23. b. February 2003 In early February, some of the coldest air of the season (temperatures as low as 10 F) spread over the drought-affected central High Plains. The second week of February produced beneficial showers on the eastern Plains, especially across the eastern half of Kansas. By the middle of February mild weather prevailed across the Plains and Midwest. However, the end of the month saw the Plains and Midwest affected by the last Arctic outbreak of the year. On February 24, cold conditions emerged in the northern and central Plains and upper Midwest as temperature readings ranged from 0 to 30 F. Weekly temperatures ranging from 10 to 24 F below normal were observed. Some locations in Montana and Wyoming noted their lowest temperatures in 4 to 6 years. c. March 2003 The month began as another strong push of frigid air swept across the Plains. The southward and eastward push of Arctic air kept weekly temperatures more than 6 F below normal throughout the Plains. From March 5-8 highly beneficial snow accumulation occurred on the northern Plains. Snowfall totals in Montana included 15.4 inches at Billings and 5.8 inches in Glasgow. During the second week of March spring-like weather suddenly replaced a wintery pattern from the Plains into the Midwest, as very warm conditions in the West expanded to encompass much of the Nation. Temperatures were boosted to 80 F as far north as South 7
15 Missouri River Basin Mountain Snowpack Water Content Total Above Fort Peck Total Fort Peck to Garrison 20 Inches of Water Equivalent 20 Inches of Water Equivalent Oct Nov Dec Jan Feb Mar Apr May Jun Jul Aug Sep Historic Average Computed Average 0 Oct Nov Dec Jan Feb Mar Apr May Jun Jul Aug Sep Historical Average Computed Average The Mountain snowpack in the reach above Fort Peck peaked at 92% of the normal peak accumulation on April 8. Currently 0.2% of this year's peak accumulation remains. The Mountain snowpack in the reach between Fort Peck and Garrison peaked at 101% of the normal peak accumulation on April 9. Currently 9% of this year's peak accumulation remains. Missouri River basin Mountain Snowpack normally peaks near April 15 and 25% normally remains on June 15. June 20, 2003
16 Dakota. These higher temperatures further reduced soil moisture reserves across the Plains. The warm weather resulted in more than 100 daily-record highs across the Plains and Front Range. Valentine, Nebraska posted highs of 74 and 82 F on March 13 and 14, respectively. Salina, Kansas posted highs of 81 F on both March 14 and 15. A major spring storm system produced heavy snow in parts of the West and central High Plains and severe thunderstorms in portions of the Plains and Midwest from March On the Plains, rain and snow improved soil moisture reserves, although local dry pockets persisted. Rainfall was heaviest in portions of south-central Kansas (in excess of 4 inches) while more than 2 feet of snow blanketed part of the Colorado High Plains. On March 16, a daily-record precipitation of 0.48 inches was recorded in Kalispell, Montana. On March 17, a rainfall total of 1.39 inches in Williston, North Dakota represented their wettest March day of record. The March storm ended Denver, Colorado s streak of below-normal monthly precipitation at 19 (August 2001 February 2003), dropping 2.80 inches of water equivalent in the form of 31.8 inches of snow. This snowfall marked Denver s secondgreatest storm total on record, behind 45.7 inches from December 1-6, d. April 2003 The month started with generally light precipitation, which provided an improvement to topsoil moisture. This precipitation provided little relief from long-term drought conditions in the northern and central Plains. April opened with consecutive daily-record highs in Omaha, Nebraska (90 and 87 F). A few days later cooler air spread over the West and Plains and was accompanied by rain and snow. Snowfall in Omaha totaled 0.2 on April 4 and 2.2 inches on April 6. In Grand Island and Kearney, Nebraska, April 6 snowfalls totaled 7.3 and 8.0 inches, respectively. Sioux City, Iowa received 9.5 inches on April 6-7, breaking the daily snowfall record on both days (6.3 and 3.2 inches, respectively). Even with this snow, long-term drought and subsoil moisture shortages remained a concern on the northern and central Plains. Within a few days, record warmth developed across the Intermountain West and spread onto the northern and central Plains. Daily-record highs on April 12 included 86 F in Rapid City, South Dakota, 85 F in Chadron, Nebraska and 83 F in Miles City, Montana. By mid-month widespread showers maintained generally favorable conditions in the northern and central Plains. The heaviest rain (2 inches or more) fell across northern Missouri and in a band from eastern South Dakota to central Wisconsin. Record warmth spread from the Plains to the Northeast, resulting in well over 100 daily-record highs. With a high of 92 F on April 13, Bismarck, North Dakota marked its earliest 90-degree heat on record. The Nation s highest recorded temperature on April 13 was 93 F in Mobridge, South Dakota. On April 16 snowfall totaled 3.5 inches in Williston, North Dakota. On April 19 a daily-record rain total of 2.5 inches was recorded at Kansas City, Missouri. On April 30, at least 2 inches of rain soaked eastern Nebraska. e. May 2003 Heavy rains and locally severe thunderstorms returned to portions of the Plains and Midwest on May 4. Weekly rainfall totaled at least 2 inches across large portions of the northern Plains and Midwest. A late-season snowfall blanketed some areas of the west. In Colorado, Denver received 7.0 inches in a 24-hour period on May On May 18, snow accumulated at Great Falls, Montana to a daily-record of 4.3 inches. By May 20, cold weather overspread areas as far 9
17 south as Nebraska, where Valentine (24 F) collected a daily-record low. By the end of the month high temperature returned to the basin. The Western and High Plains heat wave peaked from May 28-30, resulting in several monthly record highs. Scottsbluff, Nebraska saw a record high 103 F on May 29. f. June 2003 Local heavy showers hit several areas of the basin in the first half of the month. In Missouri, St. Louis netted 6.65 inches (354 percent of normal) during the first half of the month, aided by total of 2.68 inches on June 10 and 2.09 inches on June 12. Also on June 12, Lincoln, Nebraska recorded a daily-record high of 3.01 inches. During the second half of the month, diminishing topsoil reserves were a concern in a broad belt from South Dakota to area bordering Lake Michigan. In Montana, record highs for June 18 included 97 F in Missoula and 93 F in Great Falls. Elsewhere on the High Plains, Denver, Colorado noted consecutive daily-record totals on June 18-19, with totals of 1.50 and 0.95 inches of rain, respectively. On June 21, Aberdeen, SD (1.74 inches) collected a daily-record total. Severe thunderstorms erupted across the Plains and upper Midwest from June 22-25, resulting in more than 75 tornadoes and dozen of reports of damaging winds and large hail. Some of the largest U.S. hailstones on record fell in Aurora, Hamilton County, Nebraska on June 22. Preliminary tests indicated that the largest stone measured 7.0 inches in diameter and had a circumference of inches. A slightly smaller stone nearby had a diameter of 6.5 inches and a circumference of 17.3 inches, and weight 1.33 pounds, compared with the U.S. record (observed in Coffeyville, Kansas on September 3, 1970) of 1.67 pounds. A graphic of the storm is shown as Plate 3. St. Louis, Missouri observed a monthly rainfall total of inches (328 percent of normal) surpassing its June 1875 record of inches. g. July 2003 Record heat reached North Dakota on July 1 and resulted in daily-record highs in locations such as Williston (98 F) and Dickinson (97 F). In Kansas, daily-record highs on July 3 included 109 F in Hill City, 108 F in Hays, and 106 F in Concordia. Local heavy showers and thunderstorms persisted for most of the first week. Rainfall totals for July 8 in Mobridge, South Dakota totaled 1.41 inches. In the west, Grand Junction, Colorado tied its daily-record high of 105 F on July 12 and 13. During the middle of July temperatures averaged at least 2 to 10 F above normal throughout the Plains. Conditions were especially harsh in the central Plains where high temperatures peaked from 100 to 110 F. Denver, Colorado (100 F on July 13 and 101 F on July 16) reached triple digits for the first time since August 16, On July 14, the high of 113 F in Ashland, Kansas tied its July record set on July 31, 1922 and Cheyenne, Wyoming observed 8 consecutive days of 90 F or higher temperatures, nearly breaking the 9-day record set in July Cheyenne did reach 90 F or higher on 22 of the 26 days of July, breaking its all-time monthly record of 18 days established in July 1936 and The oppressive heat in the west was balanced with some unusually cool weather in the Plains. On July 23-24, St. Joseph, Missouri observed highs of 53 and 54 F. Near the boundary between the cool and hot air, Kansas City, Missouri followed consecutive daily record-tying lows (57 and 59 F) on July with its first triple-digit reading of the year (102 F) on July 26. The end of 10
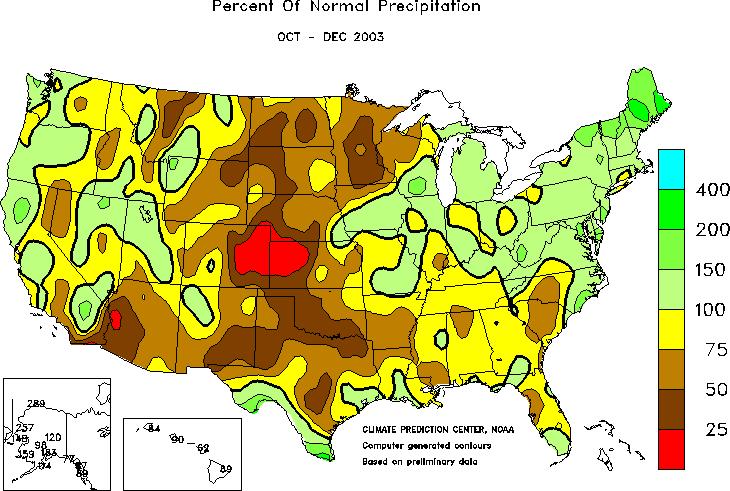
18 the month brought hot, dry weather across the western Dakotas and Montana High Plains, where weekly temperatures averaged up to 8 F above normal. In contrast, favorable temperatures (as much as 4 F below normal) accompanied isolated showers in eastern Nebraska and the Dakotas. h. August 2003 Hot weather persisted on the northern High Plains. In Montana, Billings dry spell stretched to 52 days (June 26 - August 16), breaking the record of consecutive days with no measurable precipitation of 51 days, from October 31 December 20, Billings also observed minimum temperatures of 60 F or higher on 38 consecutive days from July 11 August 17, obliterating its former record of 19 days, set from August 4-22, Billings also experience 18 consecutive days with high temperatures of 90 F or greater from July 30 August 16, edging its July 1960 record of 17 days. In Great Falls, Montana a high of 100 F was posted on August 10. It was Great Falls eighth triple-digit reading of the year, tying its annual record established in Meanwhile, Glasgow, Montana posted highs of 100 F or greater on 6 consecutive days from August 11-16, breaking its July 1936 record of 5 days in a row. Farther east, Bismarck, North Dakota experienced four consecutive triple-digit readings from August including a high of 106 F on the final day eclipsing its August record of 3 such days, set from August 17-19, Farther south, high temperatures in Kansas City, Missouri reached or exceeded 100 F on 6 consecutive days from August 16-21, its longest such streak since June 20-25, Cheyenne, Wyoming reported 32 days this year of high temperature 90 F or higher eclipsing its former annual standard of 31 days, set in On August 23, a daily-record high of 107 F was observed in Huron, South Dakota and 108 F in Mobridge, South Dakota. It was the highest temperature on record so late in the summer at Huron, where the previous latest observance of a reading of 107 F or higher had been August 15, August did see some rain showers in the western portion of the basin. On August 17, daily-record totals in Casper and Riverton, Wyoming totaled 1.00 and 0.40 inches, respectively. On the last day of August a daily-record total of 2.97 inches fell at St. Joseph, Missouri. Farther north, however, extremely dry conditions persisted in the upper Midwest, where Waterloo, Iowa (0.08 inch, or 2 percent of normal), completed its driest August on record. Figure 2 displays the drought magnitude and Figure 3 displays percent of normal precipitation experienced by the basin at 3-month increments during the calendar year. i. September 2003 The month began with continued hot weather in the northern High Plains tying or breaking daily-record highs. Miles City, Montana had a record-tying high of 97 F on September 6. During the second week of the month a slow-moving storm and its attendant cold front moved across the western two-thirds of the Nation. Denver, Colorado noted a low of 29 F on September 14. Denver s low represented its earliest autumn reading below 30 F, previously established with a minimum of 23 F on September 18, On September 10, daily-record totals in the Dakotas included 2.63 inches in Sioux Falls, South Dakota, and 2.41 inches in Dickinson, North Dakota. On September 17, Casper, Wyoming (0.75 inch, including 2.5 inches of snow) netted a daily-record precipitation. A day later, Cut Bank, Montana (23 F) posted a 11

19 Figure 2 12

20 Figure 3 13
21 daily-record low. On September 19, daily-record lows on the central High Plains included 31 F in McCook, Nebraska and 33 F in Hill City, Kansas. Although no records were broken, low temperature on September 25 included 28 F in Fargo, North Dakota, 29 F in Broken Bow, Nebraska and 32 F in Sioux City, Iowa. Farther west, Billings, Montana completed its driest June 21 September 21 period on record (0.60 inch), breaking the 1936 standard of 0.87 inch. By the end of the month Billings had completed its driest water year (October 1 September 30) on record (8.71 inches, or 59 percent of normal), breaking its 1988 record of 8.80 inches. j. October 2003 The month began with continued unfavorably dry conditions from eastern Colorado and western Kansas northward into Montana. Farther east, the temperature in Huron, South Dakota rebounded to 90 F October 7, up from 20 F on October 1. Both of Huron s readings were daily records. Although precipitation was spotty, Billings, Montana received a daily-record total (0.71 inch) on October 10, which exceeded the city s rainfall during the preceding 111 day (0.60 inch fell from June 21 October 9). It was also Billings greatest daily rainfall since 2.27 inches fell on June 13, As mid-month approached on the northern and central High Plains, weekly temperatures average as much as 6 F above normal. Soil moisture conditions were most critical from eastern Colorado and western Kansas northward into Montana. As the month ended highly beneficial rain showers preceded a cold outbreak across the northern Plains. Light snow followed the arrival of cold weather in parts of Montana. Late-October snowfall in Wyoming totaled 21.0 inches in Casper and 18.5 inches in Lander. On October 31, the 6-inch snow depth in Great Falls, Montana was a record for the date. Elsewhere, snow depths on the final day of October included 5 inches in Rapid City (Ellsworth AFB), South Dakota, and 3 inches in Billings, Montana. Elsewhere in Montana, Cut Bank closed the month with lows of -7 F on October 31. Also on October 31, Williston, North Dakota featured a daily-record low of -2 F. k. November 2003 The month began with heavy rain falling in parts of the Midwest in advance of a strong cold front. On November 3, a daily-record 2.05 inches fell in Lincoln, Nebraska. Farther north and west, a November 3 snowfall totaled 5.8 inches in Huron, South Dakota. A few days later, at least 250 daily-record lows were set or tied in the North and West. Cut Bank, Montana posted a trio of daily-record lows (-12, -17 and -8 F) from November 4-6, then notched another record low (-10 F) on November 8. Elsewhere in Montana, daily-record lows on November 5 included -22 F in West Yellowstone, -19 F in Butte, -15 F in Jordan, -12 F in Havre, and -10 F in Great Falls. Temperatures plunged to 0 F or lower as far east as the upper Midwest, where dailyrecord lows were established in locations such as Aberdeen, South Dakota (-6 F on November 5) and Grand Forks, North Dakota (-9 and -13 F on November 7-8). During the next few days a gradual increase in temperatures melted most of the north High Plains snow cover. On the Plains, November 19 high reached 72 F in Miles City, Montana, Kennebec, South Dakota and Grand Island, Nebraska, resulting in daily records at all three locations. On November 19, colder air and high winds swept across the Northern Plains. Winds were clocked to 72 m.p.h. in Great Falls, Montana, where it was the highest November wind gust since December 12, Snow 14
22 spread over the northern Plains and upper Midwest from November totaling 16.5 inches in Watertown, South Dakota, 14.8 inches in East Rapid City, South Dakota and 4.0 inches in Valentine, Nebraska. On November 23, temperatures as low as -20 F in Montana and -5 F as far south as eastern Colorado were recorded. The chilly conditions resulted in more than 50 dailyrecord lows in the Midwest and Plains westward. In Colorado, records established on November 23 included -6 F in Pueblo. Farther east, daily-record lows on November 24 included -13 F in Valentine, Nebraska and -10 F in Mobridge, South Dakota. A daily-record snowfall of 2.5 inches in Huron, South Dakota boosted its November total to 8.0 inches. A day later, record highs on central High Plains reached 75 F in Goodland, Kansas and 73 F in McCook, Nebraska. The last day of November resulted in a smattering of daily-record highs. Ashland, Kansas recorded a high of 77 F on November 30. l. December 2003 The month began with warm weather producing several daily-record highs on the Plains in advance of an approaching storm. On December 7, Valentine, Nebraska recorded a high of 66 F. The first storm sparked heavy precipitation in the Midwest beginning on December 9. Sioux Falls, South Dakota netted 8.0 inches on December 9, a record for the date. The warm weather continued to mid-month. A record high for December 20 included 68 F in McCook, Nebraska and 54 F in Cut Bank, Montana. On December 26 heavy snow blanketed parts of western and central Montana, including 20 inches in Lewistown. The year ended with two winter storms that dumped heavy snows in parts of Montana. Weekly temperatures in Montana averaged as much as 16 F below normal. Glasgow, Montana noted its snowiest December on record of 18.8 inches. The previous record was 16.5 inches in Most of Glasgow s snow was observed from December 26-28, when 14.4 inches fell Calendar Year Runoff Calendar Year runoff for the period January through December 2003 for the area above Sioux City, Iowa, totaled 17.6 MAF, 70 percent of normal runoff based on the historical period of , as shown in Table 1. The 17.6 MAF in 2003 represents a runoff midway between the lower decile and the lower quartile runoff as shown on Figure 4. This runoff was in the lower quartile of historical runoff above Sioux City, Iowa, in the 105 years of runoff recorded in the basin, as shown in Figure 4. Monthly runoff during 2003 above Sioux City, Iowa varied from a low of 31 percent of normal in August to approximately 123 percent of normal in December. Figure 5 indicates the monthly variation of runoff for CY The historic and forecasted monthly runoffs for CY 2003 from Fort Peck downstream to Sioux City, Iowa by major river reach are presented in Table 2. The table describes the annual runoff by month and is the basic compilation of the month-by-month runoff into the System. This forecast forms a basis for intrasystem balancing of storage accumulated in the projects and is updated by the Reservoir Control Center on the first of each month to forecast the runoff for the remainder of the year. The monthly accumulation of actual runoff through July and the monthly forecasts through December are shown under the "Summation above Sioux City" column. As the season progresses and the actual runoff accumulates, the forecast becomes more 15
23 Missouri River Main Stem Annual Runoff at Sioux City, Iowa 60 Million Acre-Feet 50 Historic Drought Periods 2003 = 17.6 MAF Figure % 25% 50% 75% 90% U.D MAF U.Q MAF MED MAF L.Q MAF L.D MAF Years
24 Figure Missouri River Runoff Above Sioux City, Iowa 6 Million Acre-Feet (MAF) Jan Feb Mar Apr May Jun Jul Aug Sep Oct Nov Dec 66% 65% 102% 57% 78% 82% 54% 31% 42% 48% 53% 123% 2003 Runoff : 17.6 MAF - 70% of normal Normal Runoff : 25.2 MAF
25 reliable. The majority of the annual runoff has usually occurred by the end of July, and the remainder of the year can be estimated with a greater degree of accuracy. C. SYSTEM REGULATION 1. System Regulation January to December 2003 System storage on January 1, 2003 was 42.7 MAF, 6.1 MAF less than the System storage on January 1, Winter System releases were established at 13,000 cfs, the minimum releases necessary to provide adequate water supply downstream of the System. The System storage dropped slightly during January, with storage of 42.4 MAF on February 1. The System storage on March 1 was 42.4 MAF, 14.7 MAF below the desired 57.1 MAF top of carryover multiple use zone level. The plan for System releases to support 2003 navigation season was the result of a consultation between the Corps and U.S. Fish and Wildlife Service in response to the Service s 2003 Biological Opinion. This steady release-flow-to target plan is discussed in detail in Section II.D.4 of this report. Based on 2002 nesting season results, it was anticipated that sufficient habitat would be available above the release rates to provide for successful nesting. An analysis of previous drought years indicated a 30,000 cfs Gavins Point Dam release would provide minimum service or greater flows at Kansas City 90 percent of the time. Flow support for the 2003 navigation season began on March 23 at Sioux City, Iowa; March 25 at Omaha, Nebraska; March 26 at Nebraska City, Nebraska; March 28 at Kansas City, Missouri; and April 1 at the mouth of the Missouri River near St. Louis, Missouri. System releases on March 21 were 23,500 cfs in order to meet minimum service flow targets at the four downstream target locations of Sioux City and Omaha (25,000 cfs), Nebraska City (31,000 cfs) and Kansas City (35,000 cfs). Releases were increased to 26,000 cfs on April 28 th when the interior least terns and piping plovers began to initiate nesting activities below Gavins Point Dam. On April 1st System storage was 44.0 MAF, 7.9 MAF less than the previous year s April 1 System storage (51.9 MAF). The plains snowmelt produced a March-April runoff of 4.7 MAF above Sioux City, which is 80% of normal. Runoff volumes above Sioux City for May, June and July were 2.6, 4.4, and 1.7 MAF, respectively. Normal runoff for those months is 3.3, 5.4, and 3.2 MAF. The actual May-July runoff above Sioux City was 73% of normal. For the 2003 calendar year, System storage peaked on June 28 at 45.2 MAF. The System storage peak for the previous year was 48.9 MAF. The end-of-july System storage was 44.4 MAF, 16.8 MAF less than average (61.2 MAF). System storage began a steady decline through the late summer and fall months. End-of-month storages were: August, 42.9 MAF; September, 41.4 MAF; October, 40.0 MAF; November, 38.9 MAF; and December, 38.7 MAF. The end of December System storage was 4.0 MAF less than the previous year and 16.2 MAF less than average. The end of month water storage for December was 38.7 MAF, the lowest end of year System storage since the system filled in The lowest System storage during the calendar year occurred on December 23 at 38.7 MAF. 18
26 Energy generation at the six mainstem powerplants totaled 7.6 billion kilowatt hours (kwh) for the period January 1, 2003 to December 31, 2003, 2.4 billion kwh hours below the average since the System first filled in The below normal generation was due to the drought conservation during the winter and low system releases to support minimum service downstream flows during the navigation season. 2. Fort Peck Regulation January to December 2003 a. General Fort Peck, the third largest Corps of Engineers (Corps) storage reservoir, serves all authorized purposes. Fort Peck s primary functions are: (1) to capture the mountain and plains snow and localized rainfall runoff from the large drainage area above Fort Peck, which are metered out at controlled release rates to meet the System-authorized purposes while reducing flood damages in the Fort Peck to Garrison reach; (2) to serve as a secondary storage location for water accumulated in the System from reduced System releases due to major downstream flood control regulation, thus helping to alleviate large pool increases in Garrison, Oahe, and Fort Randall; and (3) to provide the extra water needed to meet all System authorized purposes that draft storage during low-water years. b. Winter 2003 Fort Peck releases averaged 9,800 cfs for January and 10,100 cfs for February. These were 4,800 and 5,000 cfs above last years record low winter releases for January and February respectively, and 1,500 and 1,700 cfs below average. The Fort Peck reservoir level began 2003 at elevation feet mean sea level (msl), 19.5 feet below the annual flood control zone and 4.7 feet below the elevation for this same date the previous year. By the end of February, the reservoir elevation declined to feet msl, which was 7.5 feet lower than on the same date the previous year. The reservoir reached the season low of feet msl on September 28, 2003, 24.4 feet below the base of the annual flood control zone and the lowest September pool elevation. c. Winter River and Ice Conditions Below Fort Peck No special release reductions were required to prevent ice-jam flooding, because it was not a threat with the low flows downstream from Fort Peck. Ice cover formation on the Missouri River began on January 13, 2003, when the Missouri River stage rose over 5.0 feet in the Wolf Point, Montana area. The stage peaked near 9.0 feet on January 29, 2003, which is 2.0 feet below flood stage. The Missouri River at Culbertson, Montana rose over 3.0 feet as the ice cover formed in this portion of the Missouri River during December 25-26, The Missouri River stage peaked at 10.4 feet on December 30, 2002 at Culbertson, which was 4.2 feet above the previous year's peak stage. No reports of ice-affected flooding on the Missouri River below Fort Peck Dam were recorded during the winter season. 19
Summary of Actual Operations
 Missouri River Region US Army Corps of Engineers Since 1953 Reservoir Control Center Northwestern Division Missouri River Region Reservoir Control Center Missouri River Basin Fort Peck Montana Garrison
January 2011 Calendar Year Runoff Forecast
 January 2011 Calendar Year Runoff Forecast 2010 Runoff Year Calendar Year 2010 was the third highest year of runoff in the Missouri River Basin above Sioux City with 38.8 MAF, behind 1978 and 1997 which
Upper Missouri River Basin February 2018 Calendar Year Runoff Forecast February 6, 2018
 Upper Missouri River Basin February 2018 Calendar Year Runoff Forecast February 6, 2018 Calendar Year Runoff Forecast Explanation and Purpose of Forecast U.S. Army Corps of Engineers, Northwestern Division
Missouri River Basin Water Management
 Missouri River Basin Water Management US Army Corps of Engineers Missouri River Navigator s Meeting February 12, 2014 Bill Doan, P.E. Missouri River Basin Water Management US Army Corps of Engineers BUILDING
Upper Missouri River Basin December 2017 Calendar Year Runoff Forecast December 5, 2017
 Upper Missouri River Basin December 2017 Calendar Year Runoff Forecast December 5, 2017 Calendar Year Runoff Forecast Explanation and Purpose of Forecast U.S. Army Corps of Engineers, Northwestern Division
Summary of Actual 2006 Regulation
 US Army Corps of Engineers Northwestern Division Missouri River Mainstem Reservoir System Summary of Actual 2006 Regulation Missouri River Basin Fort Peck Garrison Oahe Big Bend Gavins Point Ft. Randall
Summary of Actual 2008 Regulation
 US Army Corps of Engineers Northwestern Division Missouri River Mainstem Reservoir System Summary of Actual 2008 Regulation Missouri River Basin Fort Peck Garrison Oahe Big Bend Gavins Point Ft. Randall
Upper Missouri River Basin January 2018 Calendar Year Runoff Forecast January 3, 2018
 Calendar Year Runoff Forecast Upper Missouri River Basin January 2018 Calendar Year Runoff Forecast January 3, 2018 Explanation and Purpose of Forecast U.S. Army Corps of Engineers, Northwestern Division
Summary of Actual 2010 Regulation
 US Army Corps of Engineers Northwestern Division Missouri River Mainstem Reservoir System Summary of Actual 2010 Regulation Missouri River Basin Fort Peck Garrison Oahe Big Bend Gavins Point Fort Randall
January 25, Summary
 January 25, 2013 Summary Precipitation since the December 17, 2012, Drought Update has been slightly below average in parts of central and northern Illinois and above average in southern Illinois. Soil
Missouri River Basin Water Management Monthly Update
 Missouri River Basin Water Management Monthly Update Participating Agencies 255 255 255 237 237 237 0 0 0 217 217 217 163 163 163 200 200 200 131 132 122 239 65 53 80 119 27 National Oceanic and Atmospheric
Missouri River Basin Water Management Monthly Update
 Missouri River Basin Water Management Monthly Update Participating Agencies 255 255 255 237 237 237 0 0 0 217 217 217 163 163 163 200 200 200 131 132 122 239 65 53 80 119 27 National Oceanic and Atmospheric
MISSOURI RIVER BASIN WATER MANAGEMENT SPRING 2019 PUBLIC MEETINGS
 MISSOURI RIVER BASIN WATER MANAGEMENT SPRING 2019 PUBLIC MEETINGS April 9 11:00 a.m. Fort Peck, MT April 9 6:00 p.m. Bismarck, ND April 10 10:00 a.m. Pierre, SD April 10 4:00 p.m. Sioux City, IA April
Upper Missouri River Basin May 2018 Calendar Year Runoff Forecast May 4, 2018
 Calendar Year Runoff Forecast Explanation and Purpose of Forecast Upper Missouri River Basin May 2018 Calendar Year Runoff Forecast May 4, 2018 U.S. Army Corps of Engineers, Northwestern Division Missouri
Summary of Actual 2007 Regulation
 US Army Corps of Engineers Northwestern Division Missouri River Mainstem Reservoir System Summary of Actual 2007 Regulation Missouri River Basin Fort Peck Garrison Oahe Big Bend Gavins Point Ft. Randall
Missouri River Basin Water Management Monthly Update
 Missouri River Basin Water Management Monthly Update Participating Agencies 255 255 255 237 237 237 0 0 0 217 217 217 163 163 163 200 200 200 131 132 122 239 65 53 80 119 27 National Oceanic and Atmospheric
May 2016 Volume 23 Number 5
 The Weather Wire May 2016 Volume 23 Number 5 Contents: Winter Summary Current Colorado and West-wide Snow Pack Drought Monitor April Summary/Statistics May Preview Snowfall Totals Winter Summary The Front
Monthly Long Range Weather Commentary Issued: February 15, 2015 Steven A. Root, CCM, President/CEO
 Monthly Long Range Weather Commentary Issued: February 15, 2015 Steven A. Root, CCM, President/CEO sroot@weatherbank.com JANUARY 2015 Climate Highlights The Month in Review During January, the average
Missouri River Basin Climate Outlook 1 May Dr. Dennis Todey State Climatologist South Dakota State Univ.
 Missouri River Basin Climate Outlook 1 May 2014 Dr. Dennis Todey State Climatologist South Dakota State Univ. dennis.todey@sdstate.edu 605-688-5141 Photo taken Feb 19, 2013 General Information Providing
Monthly Long Range Weather Commentary Issued: APRIL 18, 2017 Steven A. Root, CCM, Chief Analytics Officer, Sr. VP,
 Monthly Long Range Weather Commentary Issued: APRIL 18, 2017 Steven A. Root, CCM, Chief Analytics Officer, Sr. VP, sroot@weatherbank.com MARCH 2017 Climate Highlights The Month in Review The average contiguous
Champaign-Urbana 2001 Annual Weather Summary
 Champaign-Urbana 2001 Annual Weather Summary ILLINOIS STATE WATER SURVEY 2204 Griffith Dr. Champaign, IL 61820 wxobsrvr@sws.uiuc.edu Maria Peters, Weather Observer January: After a cold and snowy December,
2012 Growing Season Weather Summary for North Dakota. Adnan Akyüz and Barbara A. Mullins Department of Soil Science October 30, 2012
 2012 Growing Season Weather Summary for North Dakota Adnan Akyüz and Barbara A. Mullins Department of Soil Science October 30, 2012 Introduction The 2012 growing season (the period from April through September)
Monthly Long Range Weather Commentary Issued: APRIL 1, 2015 Steven A. Root, CCM, President/CEO
 Monthly Long Range Weather Commentary Issued: APRIL 1, 2015 Steven A. Root, CCM, President/CEO sroot@weatherbank.com FEBRUARY 2015 Climate Highlights The Month in Review The February contiguous U.S. temperature
The hydrologic service area (HSA) for this office covers Central Kentucky and South Central Indiana.
 for this office covers Central Kentucky and South Central Indiana.") January 2012 February 13, 2012 An X inside this box indicates that no flooding occurred within this hydrologic service area. January 2012 continued the string of wet months this winter. Rainfall was generally
January 2012 February 13, 2012 An X inside this box indicates that no flooding occurred within this hydrologic service area. January 2012 continued the string of wet months this winter. Rainfall was generally
Champaign-Urbana 1999 Annual Weather Summary
 Champaign-Urbana 1999 Annual Weather Summary ILLINOIS STATE WATER SURVEY 2204 Griffith Dr. Champaign, IL 61820 wxobsrvr@sws.uiuc.edu Maria Peters, Weather Observer A major snowstorm kicked off the new
Champaign-Urbana 1998 Annual Weather Summary
 Champaign-Urbana 1998 Annual Weather Summary ILLINOIS STATE WATER SURVEY Audrey Bryan, Weather Observer 2204 Griffith Dr. Champaign, IL 61820 wxobsrvr@sparc.sws.uiuc.edu The development of the El Nìno
Central Region Climate Outlook May 15, 2014
 Central Region Climate Outlook May 15, 2014 Dr. Jim Angel State Climatologist IL State Water Survey University of Illinois jimangel@illinois.edu 217-333-0729 Chicago-area flooding General Information Providing
Missouri River Basin Water Management Monthly Update
 Missouri River Basin Water Management Monthly Update Participating Agencies 255 255 255 237 237 237 0 0 0 217 217 217 163 163 163 200 200 200 131 132 122 239 65 53 80 119 27 National Oceanic and Atmospheric
A Review of the 2007 Water Year in Colorado
 A Review of the 2007 Water Year in Colorado Nolan Doesken Colorado Climate Center, CSU Mike Gillespie Snow Survey Division, USDA, NRCS Presented at the 28 th Annual AGU Hydrology Days, March 26, 2008,
SEPTEMBER 2013 REVIEW
 Monthly Long Range Weather Commentary Issued: October 21, 2013 Steven A. Root, CCM, President/CEO sroot@weatherbank.com SEPTEMBER 2013 REVIEW Climate Highlights The Month in Review The average temperature
Midwest/Great Plains Climate-Drought Outlook September 20, 2018
 Midwest/Great Plains Climate-Drought Outlook September 20, 2018 Brian Fuchs National Drought Mitigation Center University of Nebraska-Lincoln School of Natural Resources September 20, 2018 General Information
The Pennsylvania Observer
 The Pennsylvania Observer January 5, 2009 December 2008 Pennsylvania Weather Recap The final month of 2008 was much wetter than average and a bit colder than normal. In spite of this combination, most
Great Lakes Update. Volume 191: 2014 January through June Summary. Vol. 191 Great Lakes Update August 2014
 Great Lakes Update Volume 191: 2014 January through June Summary The U.S. Army Corps of Engineers (USACE) monitors the water levels of each of the Great Lakes. This report provides a summary of the Great
Webinar and Weekly Summary February 15th, 2011
 Webinar and Weekly Summary February 15th, 2011 -Assessment of current water conditions - Precipitation Forecast - Recommendations for Drought Monitor Upper Colorado Normal Precipitation Upper Colorado
Great Lakes Update. Volume 199: 2017 Annual Summary. Background
 Great Lakes Update Volume 199: 2017 Annual Summary Background The U.S. Army Corps of Engineers (USACE) tracks and forecasts the water levels of each of the Great Lakes. This report is primarily focused
National Wildland Significant Fire Potential Outlook
 National Wildland Significant Fire Potential Outlook National Interagency Fire Center Predictive Services Issued: September, 2007 Wildland Fire Outlook September through December 2007 Significant fire
The Pennsylvania Observer
 The Pennsylvania Observer April 2, 2009 March 2009 Pennsylvania Weather Recap Prepared by Curt Harpster For the month of March the saying, In like a lion and out like a lamb really fit the pattern quite
Midwest and Great Plains Drought and Climate Summary 20 February 2014
 Midwest and Great Plains Drought and Climate Summary 20 February 2014 Wendy Ryan Assistant State Climatologist Colorado Climate Center Colorado State University wendy.ryan@colostate.edu 970-491-8506 General
Missouri River Flood Task Force River Management Working Group Improving Accuracy of Runoff Forecasts
 Missouri River Flood Task Force River Management Working Group Improving Accuracy of Runoff Forecasts Kevin Grode, P.E. Reservoir Regulation Team Lead Missouri River Basin Water Management Northwestern
Illinois Drought Update, December 1, 2005 DROUGHT RESPONSE TASK FORCE Illinois State Water Survey, Department of Natural Resources
 Illinois Drought Update, December 1, 2005 DROUGHT RESPONSE TASK FORCE Illinois State Water Survey, Department of Natural Resources For more drought information please go to http://www.sws.uiuc.edu/. SUMMARY.
The Colorado Drought of 2002 in Perspective
 The Colorado Drought of 2002 in Perspective Colorado Climate Center Nolan Doesken and Roger Pielke, Sr. Prepared by Tara Green and Odie Bliss http://climate.atmos.colostate.edu Known Characteristics of
Monthly Long Range Weather Commentary Issued: SEPTEMBER 19, 2016 Steven A. Root, CCM, Chief Analytics Officer, Sr. VP,
 Monthly Long Range Weather Commentary Issued: SEPTEMBER 19, 2016 Steven A. Root, CCM, Chief Analytics Officer, Sr. VP, sroot@weatherbank.com SEPTEMBER 2016 Climate Highlights The Month in Review The contiguous
Minnesota s Climatic Conditions, Outlook, and Impacts on Agriculture. Today. 1. The weather and climate of 2017 to date
 Minnesota s Climatic Conditions, Outlook, and Impacts on Agriculture Kenny Blumenfeld, State Climatology Office Crop Insurance Conference, Sep 13, 2017 Today 1. The weather and climate of 2017 to date
Colorado s 2003 Moisture Outlook
 Colorado s 2003 Moisture Outlook Nolan Doesken and Roger Pielke, Sr. Colorado Climate Center Prepared by Tara Green and Odie Bliss http://climate.atmos.colostate.edu How we got into this drought! Fort
January 2008 Climate Summary
 Joseph Mays (765) 494-6574 Feb 5, 2008 http://www.iclimate.org Summary January 2008 Climate Summary January was a mix bag of conditions, with an oscillatory pattern developing. We experienced phases of
HyMet Company. Streamflow and Energy Generation Forecasting Model Columbia River Basin
 HyMet Company Streamflow and Energy Generation Forecasting Model Columbia River Basin HyMet Inc. Courthouse Square 19001 Vashon Hwy SW Suite 201 Vashon Island, WA 98070 Phone: 206-463-1610 Columbia River
Monthly Long Range Weather Commentary Issued: May 15, 2014 Steven A. Root, CCM, President/CEO
 Monthly Long Range Weather Commentary Issued: May 15, 2014 Steven A. Root, CCM, President/CEO sroot@weatherbank.com APRIL 2014 REVIEW Climate Highlights The Month in Review The average temperature for
Drought in Southeast Colorado
 Drought in Southeast Colorado Nolan Doesken and Roger Pielke, Sr. Colorado Climate Center Prepared by Tara Green and Odie Bliss http://climate.atmos.colostate.edu 1 Historical Perspective on Drought Tourism
The Colorado Drought : 2003: A Growing Concern. Roger Pielke, Sr. Colorado Climate Center.
 The Colorado Drought 2001-2003: 2003: A Growing Concern Roger Pielke, Sr. Colorado Climate Center Prepared by Tara Green and Odie Bliss http://climate.atmos.colostate.edu 2 2002 Drought History in Colorado
Water Supply Conditions and Outlook June 4, 2018
 Water Supply Conditions and Outlook June 4, 2018 Flow Forecasting & Operations Planning Water Security Agency Overview Water supply conditions across Saskatchewan are generally good with most reservoir
PRELIMINARY DRAFT FOR DISCUSSION PURPOSES
 Memorandum To: David Thompson From: John Haapala CC: Dan McDonald Bob Montgomery Date: February 24, 2003 File #: 1003551 Re: Lake Wenatchee Historic Water Levels, Operation Model, and Flood Operation This
Monthly Long Range Weather Commentary Issued: July 18, 2014 Steven A. Root, CCM, President/CEO
 Monthly Long Range Weather Commentary Issued: July 18, 2014 Steven A. Root, CCM, President/CEO sroot@weatherbank.com JUNE 2014 REVIEW Climate Highlights The Month in Review The average temperature for
Great Lakes Update. Volume 188: 2012 Annual Summary
 Great Lakes Update Volume 188: 2012 Annual Summary Background The U.S. Army Corps of Engineers (USACE) tracks the water levels of each of the Great Lakes. This report highlights hydrologic conditions of
The hydrologic service area (HSA) for this office covers Central Kentucky and South Central Indiana.
 for this office covers Central Kentucky and South Central Indiana.") MONTH YEAR January 2011 February 15, 2011 X An X inside this box indicates that no flooding occurred within this hydrologic service area. January 2011 was drier than normal in all locations in the area.
MONTH YEAR January 2011 February 15, 2011 X An X inside this box indicates that no flooding occurred within this hydrologic service area. January 2011 was drier than normal in all locations in the area.
Wind River Indian Reservation and Surrounding Area Climate and Drought Summary
 Northern Arapaho Tribe Wind River Indian Reservation and Surrounding Area Climate and Drought Summary Spring Events & Summer Outlook 2015 Spring Was Warm And Very Wet Across The Region The spring season
2003 Moisture Outlook
 2003 Moisture Outlook Nolan Doesken and Roger Pielke, Sr. Colorado Climate Center Prepared by Tara Green and Odie Bliss http://climate.atmos.colostate.edu Through 1999 Through 1999 Fort Collins Total Water
Great Lakes Update. Volume 193: 2015 January through June Summary. Vol. 193 Great Lakes Update August 2015
 Great Lakes Update Volume 193: 2015 January through June Summary The U.S. Army Corps of Engineers (USACE) monitors the water levels of each of the Great Lakes. This report provides a summary of the Great
Flood Risk Assessment
 Flood Risk Assessment February 14, 2008 Larry Schick Army Corps of Engineers Seattle District Meteorologist General Assessment As promised, La Nina caused an active winter with above to much above normal
The following information is provided for your use in describing climate and water supply conditions in the West as of April 1, 2003.
 Natural Resources Conservation Service National Water and Climate Center 101 SW Main Street, Suite 1600 Portland, OR 97204-3224 Date: April 8, 2003 Subject: April 1, 2003 Western Snowpack Conditions and
The Weather Wire. Current Colorado Snowpack. Contents:
 The Weather Wire January 2019 Volume 26 Number 1 Contents: Current Colorado Snowpack Denver Snowfall Since 1999-2000 Denver 2018 Climate Review Drought Monitor December Summary/Statistics January Preview
The Weather Wire. Current Colorado Snowpack. Contents:
 The Weather Wire December 2018 Volume 25 Number 12 Contents: Current Colorado Snowpack Drought Monitor November Summary/Statistics December Preview Snowfall Totals Current Colorado Snowpack Although snowfall
but 2012 was dry Most farmers pulled in a crop
 After a winter that wasn t, conditions late in the year pointed to a return to normal snow and cold conditions Most farmers pulled in a crop but 2012 was dry b y M i k e Wr o b l e w s k i, w e a t h e
NIDIS Intermountain West Drought Early Warning System April 18, 2017
 1 of 11 4/18/2017 3:42 PM Precipitation NIDIS Intermountain West Drought Early Warning System April 18, 2017 The images above use daily precipitation statistics from NWS COOP, CoCoRaHS, and CoAgMet stations.
Colorado CoCoRaHS. Colorado CoCoRaHS. Because Every Drop Counts! November 2014 Volume 2, Issue 11
 U.S. PRECIPITATION (% OF AVERAGE) LOOKING BACK AT OCTOBER 2014 October was a fairly dry month for much of the nation with the exception of the Pacific Northwest, portions of New England and the Tennessee
Champaign-Urbana 2000 Annual Weather Summary
 Champaign-Urbana 2000 Annual Weather Summary ILLINOIS STATE WATER SURVEY 2204 Griffith Dr. Champaign, IL 61820 wxobsrvr@sws.uiuc.edu Maria Peters, Weather Observer January: January started on a mild note,
The Weather Wire. Contents: Summer 2018 Outlook. Summer 2018 Outlook Drought Monitor May Summary/Statistics June Preview Rainfall Totals
 The Weather Wire June 2018 Volume 25 Number 6 Contents: Summer 2018 Outlook Drought Monitor May Summary/Statistics June Preview Rainfall Totals Summer 2018 Outlook June 1 st marked the first day of meteorological
-Assessment of current water conditions. - Precipitation Forecast. - Recommendations for Drought Monitor
 April 27, 2010 -Assessment of current water conditions - Precipitation Forecast - Recommendations for Drought Monitor 7 Day Precipitation 19-25 April 2010 Month-to-Date Precipitation 1-25 April 2010
REDWOOD VALLEY SUBAREA
 Independent Science Review Panel Conceptual Model of Watershed Hydrology, Surface Water and Groundwater Interactions and Stream Ecology for the Russian River Watershed Appendices A-1 APPENDIX A A-2 REDWOOD
3.0 TECHNICAL FEASIBILITY
 3.0 TECHNICAL FEASIBILITY 3.1 INTRODUCTION To enable seasonal storage and release of water from Lake Wenatchee, an impoundment structure would need to be constructed on the lake outlet channel. The structure
PRECIPITATION. Last Week Precipitation:
 2/24/2015 NIDIS Drought and Water Assessment PRECIPITATION The images above use daily precipitation statistics from NWS COOP, CoCoRaHS, and CoAgMet stations. From top to bottom, and left to right: most
Midwest and Great Plains Climate- Drought Outlook 17 April 2014
 Midwest and Great Plains Climate- Drought Outlook 17 April 2014 Dr. Dennis Todey State Climatologist South Dakota State Univ. dennis.todey@sdstate.edu 605-688-5141 Photo taken Feb 19, 2013 Tornado-Trenton,
NATIONAL WEATHER SERVICE
 January 2016 February 9, 2016 This was a dry month across the HSA despite one large and several smaller snowfalls. Most locations ended up 1-2 inches below normal for the month. The driest locations at
Monthly Long Range Weather Commentary Issued: APRIL 25, 2016 Steven A. Root, CCM, Chief Analytics Officer, Sr. VP, sales
 Monthly Long Range Weather Commentary Issued: APRIL 25, 2016 Steven A. Root, CCM, Chief Analytics Officer, Sr. VP, sales sroot@weatherbank.com MARCH 2016 Climate Highlights The Month in Review The March
9. PROBABLE MAXIMUM PRECIPITATION AND PROBABLE MAXIMUM FLOOD
 9. PROBABLE MAXIMUM PRECIPITATION AND PROBABLE MAXIMUM FLOOD 9.1. Introduction Due to the size of Watana Dam and the economic importance of the Project to the Railbelt, the Probable Maximum Flood (PMF)
Doug Kluck NOAA Kansas City, MO National Center for Environmental Information (NCEI) National Integrated Drought Information System (NIDIS)
 National Integrated Drought Information System (NIDIS)") National Integrated Drought Information System (NIDIS) for the Missouri River Basin Drought Early Warning Information System (DEWS) & Runoff Trends in the Missouri Basin & Latest Flood Outlook Doug Kluck
National Integrated Drought Information System (NIDIS) for the Missouri River Basin Drought Early Warning Information System (DEWS) & Runoff Trends in the Missouri Basin & Latest Flood Outlook Doug Kluck
NIDIS Weekly Climate, Water and Drought Assessment Summary. Upper Colorado River Basin July 31, 2012
 NIDIS Weekly Climate, Water and Drought Assessment Summary Upper Colorado River Basin July 31, 2012 Fig. 1: July month-to-date precipitation in inches. Fig. 2: SNOTEL WYTD precipitation percentiles (50%
Weather and Climate Summary and Forecast Winter
 Weather and Climate Summary and Forecast Winter 2016-17 Gregory V. Jones Southern Oregon University February 7, 2017 What a difference from last year at this time. Temperatures in January and February
Wind River Indian Reservation and Surrounding Area Climate and Drought Summary
 Northern Arapaho Tribe Wind River Indian Reservation and Surrounding Area Climate and Drought Summary Winter Events & Spring Outlook 2015-2016 Winter Was Warm And Dry Winter was warm and dry for the Wind
Arizona Climate Summary February 2012
 Arizona Climate Summary February 2012 Summary of conditions for January 2012 January 2012 Temperature and Precipitation Summary January 1 st 20 th : The New Year has started on a very dry note. The La
2011 Year in Review TORNADOES
 2011 Year in Review The year 2011 had weather events that will be remembered for a long time. Two significant tornado outbreaks in April, widespread damage and power outages from Hurricane Irene in August
Weather and Climate Summary and Forecast March 2018 Report
 Weather and Climate Summary and Forecast March 2018 Report Gregory V. Jones Linfield College March 7, 2018 Summary: The ridge pattern that brought drier and warmer conditions from December through most
National Wildland Significant Fire Potential Outlook
 National Wildland Significant Fire Potential Outlook National Interagency Fire Center Predictive Services Issued: April 1, 2008 Next Issue: May 1, 2008 Wildland Fire Outlook April 2008 through July 2008
NIDIS Intermountain West Drought Early Warning System February 12, 2019
 NIDIS Intermountain West Drought Early Warning System February 12, 2019 Precipitation The images above use daily precipitation statistics from NWS COOP, CoCoRaHS, and CoAgMet stations. From top to bottom,
NIDIS Drought and Water Assessment
 NIDIS Drought and Water Assessment PRECIPITATION The images above use daily precipitation statistics from NWS COOP, CoCoRaHS, and CoAgMet stations. From top to bottom, and left to right: most recent 7-days
North Central U.S. Climate Summary & Outlook May 19, 2016
 North Central U.S. Climate Summary & Outlook May 19, 2016 Golf course Lincoln, NE Image courtesy Terry Sohl Hailstones Lincoln, NE Image courtesy Andrew Ozaki EF1 tornado Lincoln, NE May 9 Photo by Bill
2. PHYSICAL SETTING FINAL GROUNDWATER MANAGEMENT PLAN. 2.1 Topography. 2.2 Climate
 FINAL GROUNDWATER MANAGEMENT PLAN 2. PHYSICAL SETTING Lassen County is a topographically diverse area at the confluence of the Cascade Range, Modoc Plateau, Sierra Nevada and Basin and Range geologic provinces.
Preliminary Runoff Outlook February 2018
 Preliminary Runoff Outlook February 2018 Prepared by: Flow Forecasting & Operations Planning Water Security Agency General Overview The Water Security Agency (WSA) is preparing for 2018 spring runoff including
Highlights of the 2006 Water Year in Colorado
 Highlights of the 2006 Water Year in Colorado Nolan Doesken, State Climatologist Atmospheric Science Department Colorado State University http://ccc.atmos.colostate.edu Presented to 61 st Annual Meeting
The Climate of Payne County
 The Climate of Payne County Payne County is part of the Central Great Plains in the west, encompassing some of the best agricultural land in Oklahoma. Payne County is also part of the Crosstimbers in the
Great Lakes Update. Great Lakes Winter and Spring Summary January June Vol. 187 Great Lakes Update August 2012
 Great Lakes Update Great Lakes Winter and Spring Summary January June 2012 The US Army Corps of Engineers (USACE) Detroit District monitors hydraulic and hydrologic conditions of the Great Lakes. This
March 1, 2003 Western Snowpack Conditions and Water Supply Forecasts
 Natural Resources Conservation Service National Water and Climate Center 101 SW Main Street, Suite 1600 Portland, OR 97204-3224 Date: March 17, 2003 Subject: March 1, 2003 Western Snowpack Conditions and
Nebraska experienced a wide
 Issue 1 August 2016 CLIMATE UPDATE A MONTHLY SUMMARY FROM THE neclimate.unl.edu August saw reprieve from dryness, cooler temps Overview Nebraska experienced a wide range of conditions across the state
Climate Update. Wendy Ryan and Nolan Doesken Colorado Climate Center. Atmospheric Science Department Colorado State University
 Climate Update Wendy Ryan and Nolan Doesken Colorado Climate Center Atmospheric Science Department Colorado State University Presented to Water Availability Task Force June 26, 2008 Denver, CO Prepared
The Pennsylvania Observer
 The Pennsylvania Observer May 31, 2012 May 2012 - Pennsylvania Weather Recap By: Paul Knight The majority of the fifth month had temperatures averaging well above seasonal levels with two distinct hot
Variability of Reference Evapotranspiration Across Nebraska
 Know how. Know now. EC733 Variability of Reference Evapotranspiration Across Nebraska Suat Irmak, Extension Soil and Water Resources and Irrigation Specialist Kari E. Skaggs, Research Associate, Biological
ACCUMULATED PRECIPITATION IN INCHES
 4 3 CUMULATIVE PRECIPITATION WATER YEAR 7 COLUMBIA BASIN ABOVE GRAND COULEE 18% of Normal 1971- Average ACCUMULATED PRECIPITATION IN INCHES 1 3 1 4 3 1 8 6 4 94% of Normal 17% of Normal 118% of Normal
Great Lakes Update. Volume 194: 2015 Annual Summary
 Great Lakes Update Volume 194: 2015 Annual Summary Background The U.S. Army Corps of Engineers (USACE) tracks and forecasts the water levels of each of the Great Lakes. This report summarizes the hydrologic
Weather and Climate Summary and Forecast March 2019 Report
 Weather and Climate Summary and Forecast March 2019 Report Gregory V. Jones Linfield College March 2, 2019 Summary: Dramatic flip from a mild winter to a top five coldest February on record in many locations
Water Supply Conditions and Outlook October 1, 2018
 Water Supply Conditions and Outlook October 1, 2018 Flow Forecasting & Operations Planning Water Security Agency Overview Water supply conditions across Saskatchewan remain near normal, with most reservoirs
PRECIPITATION. Last Week Precipitation:
 12/3/2014 NIDIS Drought and Water Assessment PRECIPITATION The images above use daily precipitation statistics from NWS COOP, CoCoRaHS, and CoAgMet stations. From top to bottom, and left to right: most