A MODEL FOR RISES AND DOWNS OF THE GREATEST LAKE ON EARTH
|
|
|
- Rachel Harrison
- 5 years ago
- Views:
Transcription
1 A MODEL FOR RISES AND DOWNS OF THE GREATEST LAKE ON EARTH Parviz Tarikhi Iranian Remote Sensing Center, Iran May 2005

2 1 Figure 1: West of Novshahr in the Iranian coast of Caspian; the dam constructed to protect the coast from sea rise
3 2 FORWARD Rising of the water surface at Caspian Sea causes difficulties and damages. This endangers installations and the people living in the vicinity. The environmental changes of such a wide region cross over national boundaries and extend to many fields of research. This provides a broad opportunity for space technologies, specially remote sensing to link these fields for better understanding, monitoring and well-managing the region for sustainable development. As the largest lake on Earth sited in Asia, Caspian covers an area of nearly 371,794 sq. km. It is so large that is called sea. Caspian covers an area from 46 degrees and 38 minutes to 54 degrees and 34 minutes East, and 36 degrees and 34 minutes to 47 degrees and 13 minutes North.
4 3 Over the recent five million years Caspian has sometimes been a lake and other times a true sea linked to free oceans through the Black and Mediterranean Seas and the Sea of Azov. It is the biggest remaining part of the greater sea named Thetis that was fragmented due to the generation of mountain chains Alborz and Caucus. Researchers agree that its shoreline has been shaped by global climate shifts that determine sea levels and rainfall. Once being the exclusive domain of Iran and the USSR, five littoral countries since the disintegration of the Soviet Union in 1991 have surrounded Caspian. In addition to Iran these new states include Russia, Azerbaijan, Kazakhstan and Turkmenistan. The water volume of Caspian is estimated to be cubic km that consists 40 percent of the total water of all the lakes in the world.


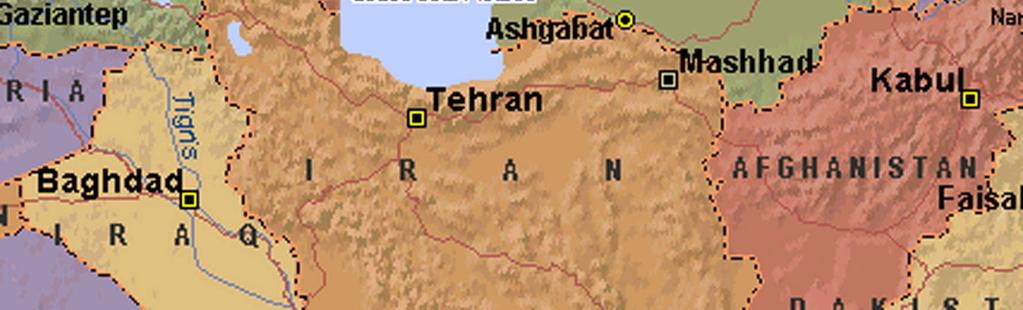
5 4 Figure 2: Map of the Caspian Region
6 5 THE PROBLEM THAT CONTINUES Surface level change of Caspian is one of its important characteristics since very ancient times. Its water level has seesawed dramatically for millennia. But recently, increasingly warm weather and wider uses of irrigation have lowered the sea level. Although chronic degradation of soil, water, and air plagues the region, in current century human activities have become an important factor with dams, irrigation systems, and industrial applications that rapidly changes all of its major tributaries. Volga is the greatest watershed of Caspian. Of all water withdrawn from natural sources in Russia, 33 percent comes from the Volga, which drains two-third of European Russia. In addition to Volga, Ural, and Terek rivers each with an extensively developed delta empty into northern Caspian.
7 6 In south Sefid Rud and other Iranian rivers that empty to southern Caspian comprises 5 percent of all water entering the Sea. Due to sea surface rise there is the danger that 1 million hectares of its coastline, including Volga River delta, will be flooded, and based on a report 300,000 hectares in Dagestan already had been inundated. Since 3500 years ago the average sea level has been minus 28 m. In the early years of the 20th Century between the years 1900 and 1929 the sea level reached minus 26.2 m and minus 29m by By 1993 the average water level of the sea had risen by more than 2 m. Since 1995 the sea level has been decreasing but there are evidences that the Sea s water surface has begun to rise since Between 1978 and 1995 the Caspian rose 2.4 m causing flooding and washing oil from lowland wells into the water.
8 7 MONITORING FROM SPACE Sea level change has had physical, chemical, biological as well as economical and social impacts on the Caspian's littoral countries. For estimating the damages and monitoring the process of sea rise at Caspian there is a realization that remote sensing data can be used. Although monitoring the damaged ecosystem of Caspian caused by sea surface fluctuations as well as the pollution and other human careless activities is much less expensive than the work of mending them, most of the littoral states are mostly ill-equipped to monitor it. Due to the importance of sea level rise at Caspian and its influence on environment especially the coastal areas there has been proposed some couples of projects by the relevant organizations in Iran that uses earth space data. This project proposes setting up a model for monitoring the fluctuations of Caspian for incorporation to a forecast and warning system.
9 8 DATA The main input to the system is frequent satellite data of region. This requires to be combined with parameters such as topographic, land-cover and land-use maps, to create useful and objective predictions that could be produced exactly and regularly. Either the visible and near infrared or microwave parts of EM spectrum can be used for remote sensing of water bodies. Water is highly reflective in the microwave range. It is nearly the same for good extent in visible range. Using Medium Resolution Optical Image (MROI) as well as High Resolution Optical Image (HROI) data are applicable. Advanced Very High-Resolution Radiometer (AVHRR) sensor of NOAA provides MROI data, while the data of Landsat-TM, High Resolution Visible and InfraRed (HRVIR) of SPOT and Indian IRS-Pan data are HROI data useful to differentiate water bodies.
10 9 HROI data taken from Landsat-TM gives a spatial resolution of nearly 30 m and temporal resolution of about 16 days. SPOT, with the resolution of 20m in spectral and 10m in panchromatic mode has a 26-day temporal resolution, but IRS-Pan mode has the spatial resolution of 10 m and temporal resolution of 5 days. The IRS-Pan and SPOT data are more suitable in comparison to Landsat-TM data. However, the problem of cloud cover in this case should not be ignored. MROI data acquired by NOAA-AVHRR has the spatial resolution of 1 km and temporal resolution of 12 hours. In microwave spectrum Synthetic Aperture Radar (SAR) images can be used. The two European ERS satellites with spatial resolution of 30 m and temporal resolution of 16 days and the Canadian RADARSAT with spatial resolution of m in standard mode for four looks and the temporal resolution of 24 days are suitable.
11 10 The choice of which earth observing sensors to be used for the model is determined by a number of factors including spatial resolution and repeat cycle as well as spectral characteristics. AVHRR as a typical MROI sensor, generally provides several highlatitude images every day suitable for observing the Caspian region. Although cloud cover is still a problem, increasing the frequency of coverage will increase likelihood of obtaining the cloud-free images. With SAR data the sensors operate at wavelengths where signals travel almost unaffected through clouds. The main reason for using MROI data is their much higher and more suitable repetition rates. The relatively long repeat period of HROI data ranging from 5 to 26 days, combined with the high likelihood of cloud cover in many places of interest means that for applying such kind of data the necessary cares should be taken. HORI and SAR data can be used for the areas of less than 10 sq.km.
12 11 The resolution of MROI sensors ranging from hundreds of meters to tens of kilometers limits the size of the area to be monitored. For AVHRR with nadir resolution of 1.1 km an area of at least 200 sq. km is needed that can provide an overall view of the area of interest. For HROI data the limits of the area under study ranges between 25 to 1000 sq. m, that is much convenient for studying the details of water level fluctuations. SAR, MROI and HROI in combination are the most reliable sensors for this mean, with SAR's cloud penetration capability, MROI's daily image acquisition and HROI's high resolution. The project uses MROI and HROI data in visible and near infrared range including NOAA-AVHRR, SPOT and IRS, and the European ERS or Canadian RADARSAT data in microwave range. Geo-coding, information extraction, modeling, quality control and forecasts would then all have to be completed within the scheduled period.
13 12 Figure 3: Medium resolution image of Caspian Region collected by NOAA-AVHRR
14 13 MODEL In the mentioned research program, the study area is situated in the southern coastal area of the Caspian in northern Iran that can be extended to all the coastal area of Caspian. The program consists of two phases. In the first phase a mathematical model of the rate of sinking the coastal lands due to sea surface rise will be set up. Based on this model the rate of sinking the lands will be determined for monthly and yearly periods. The respective graphs will be prepared then. Using the obtained graphs the most risky periods during which the probability of sea rise is the highest will be determined accurately. To make the first phase to operate the multi-date high-resolution images of SPOT or IRS from the study area is necessary.
15 14 In addition the model uses a variety of GIS and image analysis tools including ER-Mapper, Erdas Imagine to combine the remote sensing data with other parameters such as land-use, land-cover and topographic data and will carry out subsequent modeling work. Then the changes will be detected in the progressive images and using topographic data and the Digital Terrain Model of the area and volume of the raised water will be determined. Comparison of the resulted information from the progressive images will give the rate of sinking of the lands, and the most risky places exposed to damages of sea surface rise will be determined. In the second phase the places likely exposed to highest risk will be identified using land-use, land-cover and topographic data. The data thus acquired will be useful in preventing the damages, which may be caused due to sea surface raising. This information of course will be much reliable when validated by the ground truth.
16 15 IMPIRICAL WORK The investigations by the experts and specialists in IRSC shows the results confirming the proposed model. Applying the data of the southern area of Caspian situated in Iran for sea level fluctuations one can easily see the ups and downs of the sea level in different periods. The data included processed and geo-corrected MSS-1976, TM-1984 and TM-1998 imagery for the south-eastern area of Caspian and MSS-1977, TM-1991 and TM-1998 imagery for the south-western and southern area of Caspian. Comparing the images reveals the sea surface changes and map of the changes is produced for the period of 1976 to This study aimed to find and highlight the environmental impacts of sea surface rising and its consequent water transgression along nearly 1000 km of the Iranian coastline in south of the Caspian Sea.

17 16 Figure 4: Topographic map of the south-eastern Caspian

18 17 Figure 5-a: MSS-1976 data of the southeastern Caspian, the changes can be seen clearly comparing with the two other images.

19 18 Figure 5-b: TM-1984 data of the southeastern Caspian, the changes can be seen clearly comparing with the two other images.

20 19 Figure 5-c: TM-1998 data of the southeastern Caspian, the changes can be seen clearly comparing with the two other images.

21 20 Figure 6: Map of changes for the period of 1976 to 1998


22 21 Figure 7-a: The composite image generated from the MSS-1977 and TM-1991 data showing meters of water transgression


23 22 Figure 7-b: The composite image generated from the MSS-1977 and TM-1998 data showing the water transgression
24 23 The ER Mapper software was employed successfully for geometric correction and image Mosaic generation as well as other processing. The boundary between water and land was extracted through water masking of infrared and visible bands on the MSS and TM data. Then extracted boundaries were mapped on the digitized map of the area to delineate a sharp contact between water body and the land. Finally all maps in vector format were overlaid on the latest image to show changes in coastline. Applying the distance tool in ER Mapper coastline changes were easily detected on composite map. The results of this study shows about meters of water transgression along south-western coastlines of Caspian Sea (Rasht to Astara area), which is due to very steep slope in this area, while because of very gentle slope along south-eastern coast (Ghomishan and Bandar-e-Turkman area) the rate of transgression even reaches to about 10 kilometers.
25 24 EMERGING CONDITIONS AND POTENTIALS Not only the study of sea surface rise at Caspian, but also the results acquired through this project can lead to a joint co-operation between Caspian's littoral states. The results can be used for sustainable development of region and its environmental management as well. Recommending the instructions based on the results of the project to the respective countries, they can take economic and convenient actions that may prevent the damages or diminish their effects. The results of the project will enable decision-makers and planners to suggest the beneficial uses of the sea surface rise for industrial, technical and environmental concerns. The potential users of the results of project include the organizations in governmental as well as private sector, including the organizations involved in urban, housing, fishing, forestry, agriculture, environment, tourism issues and many more.
!"#$%&' #(!()* +,-'.,$ &%!/(%)!'%
* +,-'.,$ &%!/(%)!'%") !"#$%&' #(!()* +,-'.,$ &%!/(%)!'% /01234 5013673 Iranian Remote Sensing Center (IRSC) No. 22, 14 th Street, Saadat-Abad Tehran 19979, Iran Tel: +98 21 2063207 Fax: +98 21 2064474 E-mail: irsc@www.dci.co.ir
!"#$%&' #(!()* +,-'.,$ &%!/(%)!'% /01234 5013673 Iranian Remote Sensing Center (IRSC) No. 22, 14 th Street, Saadat-Abad Tehran 19979, Iran Tel: +98 21 2063207 Fax: +98 21 2064474 E-mail: irsc@www.dci.co.ir
MONITORING RISES AND DOWNS OF THE GREATEST LAKE ON EARTH
 MONITORING RISES AND DOWNS OF THE GREATEST LAKE ON EARTH Over the recent decade, raising of the water surface at Caspian Sea in different times causes many difficulties and damages to the installations
Outline. Remote Sensing, GIS and DEM Applications for Flood Monitoring. Introduction. Satellites and their Sensors used for Flood Mapping
 Outline Remote Sensing, GIS and DEM Applications for Flood Monitoring Prof. D. Nagesh Kumar Chairman, Centre for Earth Sciences Professor, Dept. of Civil Engg. Indian Institute of Science Bangalore 560
Investigation of Relationship Between Rainfall and Vegetation Index by Using NOAA/AVHRR Satellite Images
 World Applied Sciences Journal 14 (11): 1678-1682, 2011 ISSN 1818-4952 IDOSI Publications, 2011 Investigation of Relationship Between Rainfall and Vegetation Index by Using NOAA/AVHRR Satellite Images
The use of satellite images to forecast agricultural production
 The use of satellite images to forecast agricultural production Artur Łączyński Central Statistical Office, Agriculture Department Niepodległości 208 Warsaw, Poland E-mail a.laczynski@stat.gov.pl DOI:
Monitoring and Change Detection along the Eastern Side of Qena Bend, Nile Valley, Egypt Using GIS and Remote Sensing
 Advances in Remote Sensing, 2013, 2, 276-281 http://dx.doi.org/10.4236/ars.2013.23030 Published Online September 2013 (http://www.scirp.org/journal/ars) Monitoring and Change Detection along the Eastern
Introduction. Elevation Data Strategy. Status and Next Steps
 1 2 Introduction Elevation Data Strategy Status and Next Steps 3 Canada is the 2nd largest country in the world - 9.9 million sq km Surrounded by 3 oceans with 202 000 km of coastline Population over 35
Explain the impact of location, climate, natural resources, and population distribution on Europe. a. Compare how the location, climate, and natural
 SS6G10 Explain the impact of location, climate, natural resources, and population distribution on Europe. a. Compare how the location, climate, and natural resources of Germany, the United Kingdom and
Effective Utilization of Synthetic Aperture Radar (SAR) Imagery in Rapid Damage Assessment
 Imagery in Rapid Damage Assessment") Effective Utilization of Synthetic Aperture Radar (SAR) Imagery in Rapid Damage Assessment Case Study Pakistan Floods SUPARCO M. Maisam Raza, Ahmad H. Rabbani SEQUENCE Flood Monitoring using Satellite
Effective Utilization of Synthetic Aperture Radar (SAR) Imagery in Rapid Damage Assessment Case Study Pakistan Floods SUPARCO M. Maisam Raza, Ahmad H. Rabbani SEQUENCE Flood Monitoring using Satellite
CHANGE DETECTION USING REMOTE SENSING- LAND COVER CHANGE ANALYSIS OF THE TEBA CATCHMENT IN SPAIN (A CASE STUDY)
") CHANGE DETECTION USING REMOTE SENSING- LAND COVER CHANGE ANALYSIS OF THE TEBA CATCHMENT IN SPAIN (A CASE STUDY) Sharda Singh, Professor & Programme Director CENTRE FOR GEO-INFORMATICS RESEARCH AND TRAINING
CHANGE DETECTION USING REMOTE SENSING- LAND COVER CHANGE ANALYSIS OF THE TEBA CATCHMENT IN SPAIN (A CASE STUDY) Sharda Singh, Professor & Programme Director CENTRE FOR GEO-INFORMATICS RESEARCH AND TRAINING
Quick Response Report #126 Hurricane Floyd Flood Mapping Integrating Landsat 7 TM Satellite Imagery and DEM Data
 Quick Response Report #126 Hurricane Floyd Flood Mapping Integrating Landsat 7 TM Satellite Imagery and DEM Data Jeffrey D. Colby Yong Wang Karen Mulcahy Department of Geography East Carolina University
Droughts are normal recurring climatic phenomena that vary in space, time, and intensity. They may affect people and agriculture at local scales for
 I. INTRODUCTION 1.1. Background Droughts are normal recurring climatic phenomena that vary in space, time, and intensity. They may affect people and agriculture at local scales for short periods or cover
FLOOD HAZARD MAPPING OF DHAKA-NARAYANGANJ-DEMRA (DND) PROJECT USING GEO-INFORMATICS TOOLS
 PROJECT USING GEO-INFORMATICS TOOLS") FLOOD HAZARD MAPPING OF DHAKA-NARAYANGANJ-DEMRA (DND) PROJECT USING GEO-INFORMATICS TOOLS Md. Aminul Islam MEE07178 Supervisor: Prof. Kuniyoshi TAKEUCHI ABSTRACT Dhaka-Narayanganj-Demra (DND) Project is
FLOOD HAZARD MAPPING OF DHAKA-NARAYANGANJ-DEMRA (DND) PROJECT USING GEO-INFORMATICS TOOLS Md. Aminul Islam MEE07178 Supervisor: Prof. Kuniyoshi TAKEUCHI ABSTRACT Dhaka-Narayanganj-Demra (DND) Project is
ACCURACY ASSESSMENT OF ASTER GLOBAL DEM OVER TURKEY
 ACCURACY ASSESSMENT OF ASTER GLOBAL DEM OVER TURKEY E. Sertel a a ITU, Civil Engineering Faculty, Geomatic Engineering Department, 34469 Maslak Istanbul, Turkey sertele@itu.edu.tr Commission IV, WG IV/6
Module 3, Investigation 1: Briefing 2 The ENSO game: Predicting and managing for El Niño and La Niña
 Part 5. The ENSO game How can prediction help avoid ENSO s tragic human consequences? Scientists from around the world are involved in forecasting, with computer models and sophisticated measurements,
What is the largest country in the world? Russia
 What is the largest country in the world? #1 Russia CSCOPE 2007 2 Russia Dimensions #2-3 Spans 11 Time Zones From East to West: Gulf of Finland to Alaska From North to South: Above the Arctic Circle to
Fundamentals of Remote Sensing
 Division of Spatial Information Science Graduate School Life and Environment Sciences University of Tsukuba Fundamentals of Remote Sensing Prof. Dr. Yuji Murayama Surantha Dassanayake 10/6/2010 1 Fundamentals
Newsletter # 2. Pilot sites in Greece. December 2018
 A HarmonizEd framework to Mitigate coastal EroSion promoting ICZM protocol implementation Newsletter # 2 December 2018 View of a beach in Ammolofi ( Paggaio Municipality ) Pilot sites in Greece 1. Name
Title. Author(s)Radiarta, I Nyoman; Saitoh, Sei-Ichi. Issue Date Doc URL. Type. Note. File Information
Radiarta, I Nyoman; Saitoh, Sei-Ichi. Issue Date Doc URL. Type. Note. File Information") Title Spatial information systems approach toward sustaina Author(s)Radiarta, I Nyoman; Saitoh, Sei-Ichi International Symposium on "Sustainability Science o Citation2009. Hakodate, Japan. Issue Date 2009-11-07
Title Spatial information systems approach toward sustaina Author(s)Radiarta, I Nyoman; Saitoh, Sei-Ichi International Symposium on "Sustainability Science o Citation2009. Hakodate, Japan. Issue Date 2009-11-07
2.- Area of built-up land
 2.- Area of built-up land Key message Over recent decades, built-up areas have been steadily increasing all over Europe. In Western European countries, built-up areas have been increasing faster than the
Part : General Situation of Surveying and Mapping. The Development of Surveying and Mapping in China. The contents
 The Development of Surveying and Mapping in China Dr. Ping Xiao China.P.R The contents Part : General Situation of Surveying and Mapping 1. The legal systems of surveying and mapping 2. The technologies
DROUGHT RISK EVALUATION USING REMOTE SENSING AND GIS : A CASE STUDY IN LOP BURI PROVINCE
 DROUGHT RISK EVALUATION USING REMOTE SENSING AND GIS : A CASE STUDY IN LOP BURI PROVINCE K. Prathumchai, Kiyoshi Honda, Kaew Nualchawee Asian Centre for Research on Remote Sensing STAR Program, Asian Institute
Validation of sea ice concentration in the myocean Arctic Monitoring and Forecasting Centre 1
 Note No. 12/2010 oceanography, remote sensing Oslo, August 9, 2010 Validation of sea ice concentration in the myocean Arctic Monitoring and Forecasting Centre 1 Arne Melsom 1 This document contains hyperlinks
WHAT IS THE EARTH MADE OF? LITHOSPHERE AND HYDROSPHERE
 UNIT 8 WHAT IS THE EARTH MADE OF? LITHOSPHERE AND HYDROSPHERE TABLE OF CONTENTS 1 THE STRUCTURE OF THE EARTH... 2 2 THE FORMATION OF THE RELIEF: INTERNAL AND EXTERNAL FORCES.... 2 2.1 Internal forces:
Navigable maritime and river waterways in the seaside - Danube Delta area and the connected rural development
 SUMMARY OF Ph-D Thesis, with title RESEARCH STUDIES ON MANAGEMENT IMPROVEMENT OF MARITIME AND RIVER TRANSPORT ACTIVITY IN THE COASTAL AND DANUBE DELTA AREA FROM AN ENVIROMENTAL, ECONOMIC AND SOCIAL PERSPECTIVE
Weather Satellite Data Applications for Monitoring and Warning Hazard at BMKG
 The 5th Meeting of the Coordinating Group of the RA II WIGOS Satellite Project 21 October 2017, Vladivostok city, Russky Island, Russia Far Eastern Federal University Weather Satellite Data Applications
Greening of Arctic: Knowledge and Uncertainties
 Greening of Arctic: Knowledge and Uncertainties Jiong Jia, Hesong Wang Chinese Academy of Science jiong@tea.ac.cn Howie Epstein Skip Walker Moscow, January 28, 2008 Global Warming and Its Impact IMPACTS
DAMAGE DETECTION OF THE 2008 SICHUAN, CHINA EARTHQUAKE FROM ALOS OPTICAL IMAGES
 DAMAGE DETECTION OF THE 2008 SICHUAN, CHINA EARTHQUAKE FROM ALOS OPTICAL IMAGES Wen Liu, Fumio Yamazaki Department of Urban Environment Systems, Graduate School of Engineering, Chiba University, 1-33,
Overview of Remote Sensing in Natural Resources Mapping
 Overview of Remote Sensing in Natural Resources Mapping What is remote sensing? Why remote sensing? Examples of remote sensing in natural resources mapping Class goals What is Remote Sensing A remote sensing
Studying the role of Caspian Sea on Precipitation condition in the shores of the north of Iran
 Proceedings of The Fourth International Iran & Russia Conference 0 Studying the role of Caspian Sea on Precipitation condition in the shores of the north of Iran Moradi Hamid Reza Assistant professor of
Caspian Rapid Sea Level Changing Impact on Estuaries Morphodynamic Deformation
 2013, TextRoad Publication ISSN 2090-4304 Journal of Basic and Applied Scientific Research www.textroad.com Caspian Rapid Sea Level Changing Impact on Estuaries Morphodynamic Deformation Naser Ebadati
URBAN CHANGE DETECTION OF LAHORE (PAKISTAN) USING A TIME SERIES OF SATELLITE IMAGES SINCE 1972
 USING A TIME SERIES OF SATELLITE IMAGES SINCE 1972") URBAN CHANGE DETECTION OF LAHORE (PAKISTAN) USING A TIME SERIES OF SATELLITE IMAGES SINCE 1972 Omar Riaz Department of Earth Sciences, University of Sargodha, Sargodha, PAKISTAN. omarriazpk@gmail.com ABSTRACT
URBAN CHANGE DETECTION OF LAHORE (PAKISTAN) USING A TIME SERIES OF SATELLITE IMAGES SINCE 1972 Omar Riaz Department of Earth Sciences, University of Sargodha, Sargodha, PAKISTAN. omarriazpk@gmail.com ABSTRACT
PRINCIPLES OF REMOTE SENSING. Electromagnetic Energy and Spectral Signatures
 PRINCIPLES OF REMOTE SENSING Electromagnetic Energy and Spectral Signatures Remote sensing is the science and art of acquiring and analyzing information about objects or phenomena from a distance. As humans,
FIG Working Week May, Bulgaria From the wisdom of the ages to the challanges of modern world
 FIG Working Week 17-21 May, Bulgaria From the wisdom of the ages to the challanges of modern world COASTAL RISK ANALYSIS OF THE BLACK SEA UNDER THE SEA LEVEL RISE N e v i n B e t u l A V S A R, S e n o
Chapter 32. Australia & New Zealand
 Chapter 32 Australia & New Zealand Lesson 1: Physical Geography of Australia & New Zealand Landforms Australia lies between the Pacific and Indian Oceans in the Southern Hemisphere. Although an island,
Satellite Remote Sensing for Ocean
 Satellite Remote Sensing for Ocean August 17, 2017 Masatoshi Kamei RESTEC All rights reserved RESTEC 2015 Contents 1. About RESTEC and Remote Sensing 2. Example of Remote Sensing Technology 3. Remote Sensing
Monthly Overview. Rainfall
 Monthly Overview Rainfall during August occurred mainly over the Western and Eastern Cape provinces, and KwaZulu- Natal. Rain in these provinces were regularly accompanied by cold fronts as they made landfall
2015 Record breaking temperature anomalies
 2015 Record breaking temperature anomalies June 2015 global temperature was the highest in 136 (since 1880) years reaching an average of 0.88 C above the 20 th century average. This is an increase of 0.12
Japanese Programs on Space and Water Applications
 Japanese Programs on Space and Water Applications Tamotsu IGARASHI Remote Sensing Technology Center of Japan June 2006 COPUOS 2006 Vienna International Centre Water-related hazards/disasters may occur
VISUALIZATION URBAN SPATIAL GROWTH OF DESERT CITIES FROM SATELLITE IMAGERY: A PRELIMINARY STUDY
 CO-439 VISUALIZATION URBAN SPATIAL GROWTH OF DESERT CITIES FROM SATELLITE IMAGERY: A PRELIMINARY STUDY YANG X. Florida State University, TALLAHASSEE, FLORIDA, UNITED STATES ABSTRACT Desert cities, particularly
Yanbo Huang and Guy Fipps, P.E. 2. August 25, 2006
 Landsat Satellite Multi-Spectral Image Classification of Land Cover Change for GIS-Based Urbanization Analysis in Irrigation Districts: Evaluation in Low Rio Grande Valley 1 by Yanbo Huang and Guy Fipps,
UNITED NATIONS E/CONF.96/CRP. 5
 UNITED NATIONS E/CONF.96/CRP. 5 ECONOMIC AND SOCIAL COUNCIL Eighth United Nations Regional Cartographic Conference for the Americas New York, 27 June -1 July 2005 Item 5 of the provisional agenda* COUNTRY
Physical Geography: Patterns, Processes, and Interactions, Grade 11, University/College Expectations
 Geographic Foundations: Space and Systems SSV.01 explain major theories of the origin and internal structure of the earth; Page 1 SSV.02 demonstrate an understanding of the principal features of the earth
Application of Wavelet Spectrum Analysis to Oil Spill Detection by Using Satellite Observation Data
 PAJ Oil Spill Symposium 2008 Application of Wavelet Spectrum Analysis to Oil Spill Detection by Using Satellite Observation Data February 21, 2008 Tokyo, Japan Masanao Hara Dr., VisionTech Inc. 1. Background
Leveraging Sentinel-1 time-series data for mapping agricultural land cover and land use in the tropics
 Leveraging Sentinel-1 time-series data for mapping agricultural land cover and land use in the tropics Caitlin Kontgis caitlin@descarteslabs.com @caitlinkontgis Descartes Labs Overview What is Descartes
Government GIS and its Application for Decision Support
 Government GIS and its Application for Decision Support Zhang Qingpu (Chinese Academy of Surveying and Mapping, Email: zhangqp@casm.ac.cn) Abstract: Application of GIS in government agencies is called
Spanish national plan for land observation: new collaborative production system in Europe
 ADVANCE UNEDITED VERSION UNITED NATIONS E/CONF.103/5/Add.1 Economic and Social Affairs 9 July 2013 Tenth United Nations Regional Cartographic Conference for the Americas New York, 19-23, August 2013 Item
sentinel-3 A BIGGER PICTURE FOR COPERNICUS
 sentinel-3 A BIGGER PICTURE FOR COPERNICUS SATELLITES TO SERVE By providing a set of key information services for a wide range of practical applications, Europe s Copernicus programme has been put in place
CHAPTER EXIT CHAPTER. Models of Earth. 3.1 Modeling the Planet. 3.2 Mapmaking and Technology. 3.3 Topographic Maps CHAPTER OUTLINE
 EXIT CHAPTER.1 Modeling the Planet.2 Mapmaking and Technology. Topographic Maps CHAPTER OUTLINE CHAPTER.1 Modeling the Planet A flat of Earth is a convenient tool, but it can distort the shape, distance,
GIS and Remote Sensing
 Spring School Land use and the vulnerability of socio-ecosystems to climate change: remote sensing and modelling techniques GIS and Remote Sensing Katerina Tzavella Project Researcher PhD candidate Technology
Chapter 32. Australia & New Zealand
 Chapter 32 Australia & New Zealand Lesson 1: Physical Geography of Australia & New Zealand Landforms Australia lies between the Pacific and Indian Oceans in the Southern Hemisphere. Although an island,
THE CANADIAN CENTRE FOR CLIMATE MODELLING AND ANALYSIS
 THE CANADIAN CENTRE FOR CLIMATE MODELLING AND ANALYSIS As Canada s climate changes, and weather patterns shift, Canadian climate models provide guidance in an uncertain future. CANADA S CLIMATE IS CHANGING
Mapping Coastal Change Using LiDAR and Multispectral Imagery
 Mapping Coastal Change Using LiDAR and Multispectral Imagery Contributor: Patrick Collins, Technical Solutions Engineer Presented by TABLE OF CONTENTS Introduction... 1 Coastal Change... 1 Mapping Coastal
SEASONAL CLIMATE OUTLOOK VALID FOR JULY-AUGUST- SEPTEMBER 2013 IN WEST AFRICA, CHAD AND CAMEROON
 SEASONAL CLIMATE OUTLOOK VALID FOR JULY-AUGUST- SEPTEMBER 2013 IN WEST AFRICA, CHAD AND CAMEROON May 29, 2013 ABUJA-Federal Republic of Nigeria 1 EXECUTIVE SUMMARY Given the current Sea Surface and sub-surface
VILLAGE INFORMATION SYSTEM (V.I.S) FOR WATERSHED MANAGEMENT IN THE NORTH AHMADNAGAR DISTRICT, MAHARASHTRA
 FOR WATERSHED MANAGEMENT IN THE NORTH AHMADNAGAR DISTRICT, MAHARASHTRA") VILLAGE INFORMATION SYSTEM (V.I.S) FOR WATERSHED MANAGEMENT IN THE NORTH AHMADNAGAR DISTRICT, MAHARASHTRA Abstract: The drought prone zone in the Western Maharashtra is not in position to achieve the agricultural
VILLAGE INFORMATION SYSTEM (V.I.S) FOR WATERSHED MANAGEMENT IN THE NORTH AHMADNAGAR DISTRICT, MAHARASHTRA Abstract: The drought prone zone in the Western Maharashtra is not in position to achieve the agricultural
Land Use MTRI Documenting Land Use and Land Cover Conditions Synthesis Report
 Colin Brooks, Rick Powell, Laura Bourgeau-Chavez, and Dr. Robert Shuchman Michigan Tech Research Institute (MTRI) Project Introduction Transportation projects require detailed environmental information
Monitoring of Forest Cover Change in Sundarban mangrove forest using Remote sensing and GIS
 Monitoring of Forest Cover Change in Sundarban mangrove forest using Remote sensing and GIS By Mohammed Monirul Alam April 2008 Content 1: INTRODUCTION 2: OBJECTIVES 3: METHODOLOGY 4: RESULTS & DISCUSSION
Contribution to global Earth observation from satellites
 Contribution to global Earth observation from satellites - JAXA s Earth Observation strategy - April 16, 2008 Makoto Kajii Japan Aerospace Exploration Agency Earth Observation Summits and GEOSS 1 st EO
Land Use/Land Cover Mapping in and around South Chennai Using Remote Sensing and GIS Techniques ABSTRACT
 Land Use/Land Cover Mapping in and around South Chennai Using Remote Sensing and GIS Techniques *K. Ilayaraja, Abhishek Singh, Dhiraj Jha, Kriezo Kiso, Amson Bharath institute of Science and Technology
CLIMATE READY BOSTON. Climate Projections Consensus ADAPTED FROM THE BOSTON RESEARCH ADVISORY GROUP REPORT MAY 2016
 CLIMATE READY BOSTON Sasaki Steering Committee Meeting, March 28 nd, 2016 Climate Projections Consensus ADAPTED FROM THE BOSTON RESEARCH ADVISORY GROUP REPORT MAY 2016 WHAT S IN STORE FOR BOSTON S CLIMATE?
COUNTRY PRESENTATION ON MR JAYNAL ABEDIN JOINT SECRETARY ( WORKS & DEVELOPMENT ) MINISTRY OF DEFENCE
 MINISTRY OF DEFENCE") COUNTRY PRESENTATION ON By MR JAYNAL ABEDIN JOINT SECRETARY ( WORKS & DEVELOPMENT ) MINISTRY OF DEFENCE Bangladesh Geographical Location of Bangladesh Bangladesh Country at a Glance Physical Features 1,230
COUNTRY PRESENTATION ON By MR JAYNAL ABEDIN JOINT SECRETARY ( WORKS & DEVELOPMENT ) MINISTRY OF DEFENCE Bangladesh Geographical Location of Bangladesh Bangladesh Country at a Glance Physical Features 1,230
Journal of Environment and Earth Science ISSN (Paper) ISSN (Online) Vol.5, No.3, 2015
 ISSN (Online) Vol.5, No.3, 2015") Application of GIS for Calculate Normalize Difference Vegetation Index (NDVI) using LANDSAT MSS, TM, ETM+ and OLI_TIRS in Kilite Awulalo, Tigray State, Ethiopia Abineh Tilahun Department of Geography and
Application of GIS for Calculate Normalize Difference Vegetation Index (NDVI) using LANDSAT MSS, TM, ETM+ and OLI_TIRS in Kilite Awulalo, Tigray State, Ethiopia Abineh Tilahun Department of Geography and
Range of Opportunities
 Geograhy Curriculum Cropwell Bishop Primary School Range of Opportunities Year 1 Year 2 Year 3 Year 4 Year 5 Year 6 All Key Stage 1 Key Stage 2 Investigate the countries and capitals of the United Kingdom.
RADAR Remote Sensing Application Examples
 RADAR Remote Sensing Application Examples! All-weather capability: Microwave penetrates clouds! Construction of short-interval time series through cloud cover - crop-growth cycle! Roughness - Land cover,
sentinel-2 COLOUR VISION FOR COPERNICUS
 sentinel-2 COLOUR VISION FOR COPERNICUS SATELLITES TO SERVE By providing a set of key information services for a wide range of practical applications, Europe s Copernicus programme is providing a step
TOWARDS CLIMATE-RESILIENT COASTAL MANAGEMENT: OPPORTUNITIES FOR IMPROVED ICZM IN BELIZE
 TOWARDS CLIMATE-RESILIENT COASTAL MANAGEMENT: OPPORTUNITIES FOR IMPROVED ICZM IN BELIZE CHANTALLE SAMUELS Coastal Zone Management Authority and Institute The Caribbean Community Climate Change Centre VULNERABILITY
REVIEW MAPWORK EXAM QUESTIONS 31 JULY 2014
 REVIEW MAPWORK EXAM QUESTIONS 31 JULY 2014 Lesson Description In this lesson we: Focus on key concepts and exam questions relating to GIS. Question 1 Test Yourself The most important component of a GIS
Climatic Extreme Events over Iran: Observation and Future Projection
 3rd Meeting of COMSATS International Thematic Research Group on Climate Change and Environmental Protection (22nd January 2014, Islamabad, Pakistan) Climatic Extreme Events over Iran: Observation and Future
Activity 2.2: Recognizing Change (Observation vs. Inference)
") Activity 2.2: Recognizing Change (Observation vs. Inference) Teacher Notes: Evidence for Climate Change PowerPoint Slide 1 Slide 2 Introduction Image 1 (Namib Desert, Namibia) The sun is on the horizon
Activity 2.2: Recognizing Change (Observation vs. Inference) Teacher Notes: Evidence for Climate Change PowerPoint Slide 1 Slide 2 Introduction Image 1 (Namib Desert, Namibia) The sun is on the horizon
Flood management in Namibia: Hydrological linkage between the Kunene River and the Cuvelai Drainage System: Cuvelai-Etosha Basin
 Flood management in Namibia: Hydrological linkage between the Kunene River and the Cuvelai Drainage System: Cuvelai-Etosha Basin By: Leonard Hango Department of Water Affairs and Forestry Ministry of Agriculture
Advanced Image Analysis in Disaster Response
 Advanced Image Analysis in Disaster Response Creating Geographic Knowledge Thomas Harris ITT The information contained in this document pertains to software products and services that are subject to the
Developed in Consultation with Florida Educators
 Developed in Consultation with Florida Educators Table of Contents Next Generation Sunshine State Standards Correlation Chart... 7 Benchmarks Chapter 1 The Practice of Science...................... 11
Journal of Asian Scientific Research STUDYING OF THE ENVIRONMENTAL CHANGES IN MARSH AREA USING LANDSAT SATELLITE IMAGES
 Journal of Asian Scientific Research journal homepage: http://aessweb.com/journal-detail.php?id=5003 STUDYING OF THE ENVIRONMENTAL CHANGES IN MARSH AREA USING LANDSAT SATELLITE IMAGES Salah A. H. Saleh
Appendix 1: UK climate projections
 Appendix 1: UK climate projections The UK Climate Projections 2009 provide the most up-to-date estimates of how the climate may change over the next 100 years. They are an invaluable source of information
Report. Developing a course component on disaster management
 Report Developing a course component on disaster management By Chira Prangkio Tawee Chaipimonplin Department of Geography, Faculty of Social Sciences, Chiang Mai University Thailand Presented at Indian
Yev Kontar. Illinois State Geological Survey, University of Illinois at Urbana-Champaign
 Addressing Caribbean Geophysical Hazards through the Continuously Operating Caribbean GPS Observational Network (COCONet) and International Ocean Drilling Program (IODP) Yev Kontar Illinois State Geological
Abstract: Introduction: 10 th ESRI India User Conference 2009 Geography in Action
 Mitigation of Thermal Pollution to enhance urban air quality through Remote Sensing and GIS Anshu Gupta, Lecturer, Centre of Remote Sensing and GIS, MANIT, Bhopal, E- mail: anshugupta20002001@gmail.com
Existing GIS Resources on the Indus Basin
 Existing GIS Resources on the Indus Basin Workshop on Spatial Information Analysis for the Sustainable Management of the Indus Basin in Pakistan May 26-27, 2003 Elements of Existing GIS Resources Data
Vulnerability of Bangladesh to Cyclones in a Changing Climate
 Vulnerability of Bangladesh to Cyclones in a Changing Climate Susmita Dasgupta Kiran Pandey Mainul Huq Zahirul Huq Khan M.M. Zahid Ahmed Nandan Mukherjee Malik Fida Khan 2010 Bangladesh: Tropical Cyclone
Identifying Audit, Evidence Methodology and Audit Design Matrix (ADM)
") 11 Identifying Audit, Evidence Methodology and Audit Design Matrix (ADM) 27/10/2012 Exercise XXX 2 LEARNING OBJECTIVES At the end of this session participants will be able to: 1. Identify types and sources
11 Identifying Audit, Evidence Methodology and Audit Design Matrix (ADM) 27/10/2012 Exercise XXX 2 LEARNING OBJECTIVES At the end of this session participants will be able to: 1. Identify types and sources
Assessment Objectives Grid for Geography - G1. Summer Application Skills Total. (a) (b) (c) (a)
 (b) (c) (a)") Assessment Objectives Grid for Geography - G1 Summer 2014 Question 1 Knowledge and Understanding Application Skills Total Key Question (a) 0 2 3 5 1.5 (b) 8 2 10 1.3 (c) 7 3 10 1.4 15 7 3 25 Question 2
Assessment Objectives Grid for Geography - G1 Summer 2014 Question 1 Knowledge and Understanding Application Skills Total Key Question (a) 0 2 3 5 1.5 (b) 8 2 10 1.3 (c) 7 3 10 1.4 15 7 3 25 Question 2
Graduate Courses Meteorology / Atmospheric Science UNC Charlotte
 Graduate Courses Meteorology / Atmospheric Science UNC Charlotte In order to inform prospective M.S. Earth Science students as to what graduate-level courses are offered across the broad disciplines of
Land Use Changing Scenario at Kerniganj Thana of Dhaka District Using Remote Sensing and GIS
 Research Paper Land Use Changing Scenario at Kerniganj Thana of Dhaka District Using Remote Sensing and GIS Farzana Raihan 1 * and Nowrine Kaiser 1 1 Assistant Professor, Department of Forestry and Environment
Integrated Space Applications in Transport, Energy & Safety Oil & Gas Exploration
 Exploration & Production Technology delivering breakthrough solutions Integrated Space Applications in Transport, Energy & Safety Oil & Gas Exploration Dr Colin Grant Engineering Technical Authority, Metocean
Human Activities and Environmental Risks Natural Hazards and Urban Development Issues Vallée de la Bruche, Alsace
 STER 98 Remote Sensing Project Tutorials 1 Human Activities and Environmental Risks Natural Hazards and Urban Development Issues Vallée de la Bruche, Alsace Stephen Clandillon, SERTIT, Parc d'innovation,
UNITED NATIONS E/CONF.97/6/IP. 33
 UNITED NATIONS E/CONF.97/6/IP. 33 ECONOMIC AND SOCIAL COUNCIL Seventeenth United Nations Regional Cartographic Conference for Asia and the Pacific Bangkok, 18-22 September 2006 Item 7 of the provisional
Dr. Biliana Cicin-Sain President, Global Ocean Forum 1
 Towards a Sustainable Development Goal on Oceans and Seas: Healthy, Productive and Resilient Oceans and Seas- Prosperous and Resilient Peoples and Communities Dr. Biliana Cicin-Sain President, Global Ocean
Module 7, Lesson 1 Water world
 Module 7, Lesson 1 Water world Imagine that the year is 2100. Scientists have determined that the rapidly warming climate of the earth will cause the ice sheets of Antarctica to break apart and melt at
Investigation of the Effect of Transportation Network on Urban Growth by Using Satellite Images and Geographic Information Systems
 Presented at the FIG Congress 2018, May 6-11, 2018 in Istanbul, Turkey Investigation of the Effect of Transportation Network on Urban Growth by Using Satellite Images and Geographic Information Systems
Excel Geomatics: Offering Excellence with Unique Consultancy & Services
 Excel Geomatics: Offering Excellence with Unique Consultancy & Services Providing consultancy and value Added Services using Remote Sensing, Photogrammetry and LiDAR in areas such as Agriculture, Forestry,
The known requirements for Arctic climate services
 The known requirements for Arctic climate services based on findings described in STT White paper 8/2015 Johanna Ekman / EC PHORS STT Regional drivers The Arctic region is home to almost four million people
Delimiting the Flood Risk Zones in Cuddalore District, Tamil Nadu, India
 Delimiting the Flood Risk Zones in Cuddalore District, Tamil Nadu, India P. Ravikumar 1, Dr. G. Baskaran 2 1 Research Scholar, 2 Assistant Professor, Department of Geography, University of Madras, Chennai
Remote Sensing for Climate Change Effect on Lake Tahoe. Shobha Sriharan Professor of Environmental Science Virginia State University
 Remote Sensing for Climate Change Effect on Lake Tahoe Shobha Sriharan Professor of Environmental Science Virginia State University Table of Contents Lake Tahoe s Climate Issues Discussion on the issues
EQ: Discuss main geographic landforms of the U.S. & Canada and examine varied landforms in relation to their lifestyles.
 EQ: Discuss main geographic landforms of the U.S. & Canada and examine varied landforms in relation to their lifestyles. Places & Terms for Discussion Appalachian Mountains Great Plains Canadian Shield
Urban Tree Canopy Assessment Purcellville, Virginia
 GLOBAL ECOSYSTEM CENTER www.systemecology.org Urban Tree Canopy Assessment Purcellville, Virginia Table of Contents 1. Project Background 2. Project Goal 3. Assessment Procedure 4. Economic Benefits 5.
Determination of flood risks in the yeniçiftlik stream basin by using remote sensing and GIS techniques
 Determination of flood risks in the yeniçiftlik stream basin by using remote sensing and GIS techniques İrfan Akar University of Atatürk, Institute of Social Sciences, Erzurum, Turkey D. Maktav & C. Uysal
New NASA Ocean Observations and Coastal Applications
 New NASA Ocean Observations and Coastal Applications Duane Armstrong Chief, Applied Science & Technology Project Office August 20, 2014 1 Outline NASA s new Earth Science Ocean Science Missions for 2014
INVESTIGATION LAND USE CHANGES IN MEGACITY ISTANBUL BETWEEN THE YEARS BY USING DIFFERENT TYPES OF SPATIAL DATA
 INVESTIGATION LAND USE CHANGES IN MEGACITY ISTANBUL BETWEEN THE YEARS 1903-2010 BY USING DIFFERENT TYPES OF SPATIAL DATA T. Murat Celikoyan, Elif Sertel, Dursun Zafer Seker, Sinasi Kaya, Uğur Alganci ITU,
Use of Geospatial data for disaster managements
 Use of Geospatial data for disaster managements Source: http://alertsystemsgroup.com Instructor : Professor Dr. Yuji Murayama Teaching Assistant : Manjula Ranagalage What is GIS? A powerful set of tools
In the space provided, write the letter of the description that best matches the term or phrase. a. any form of water that falls to Earth s
 Skills Worksheet Concept Review In the space provided, write the letter of the description that best matches the term or phrase. 1. condensation 2. floodplain 3. watershed 4. tributary 5. evapotranspiration