What drives snowstorms and seasonal snowfall amounts in Colorado?
|
|
|
- Reginald Bradford
- 5 years ago
- Views:
Transcription

1 What drives snowstorms and seasonal snowfall amounts in Colorado? Russ S. Schumacher Colorado State Climatologist Director, Colorado Climate Center Department of Atmospheric Science, Colorado State University Along with: Becky Bolinger, Peter Goble, Zach Schwalbe, Nolan Doesken Western Snow and Ice Conference 27 September 2018

2 Annual average precipitation Data: PRISM climate group prism.oregonstate.edu COLORADO CLIMATE CENTER

3 Cheyenne Ridge Platte Valley Palmer Divide Arkansas Valley Raton Mesa COLORADO CLIMATE CENTER
4 What are our data sources? COLORADO CLIMATE CENTER
5 NWS Cooperative observer program long-term measurements COLORADO CLIMATE CENTER

6 COLORADO CLIMATE CENTER


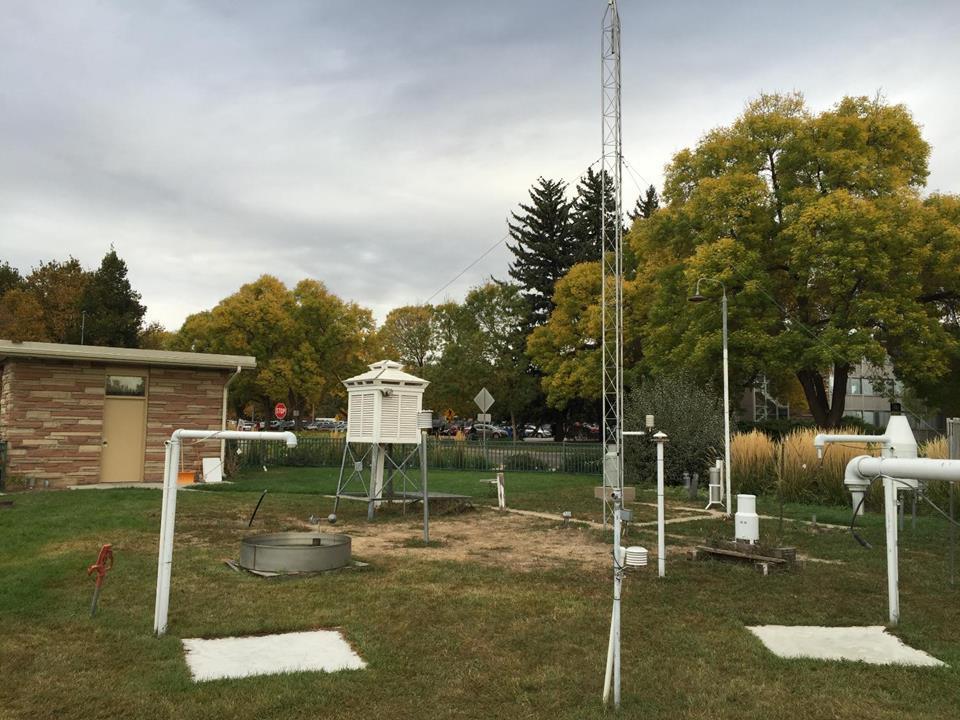
7 National Weather Service automated stations Photo of an ASOS station Map showing NWS stations (from mesowest.utah.edu) COLORADO CLIMATE CENTER

8 Mesonets Oklahoma Mesonet COLORADO CLIMATE CENTER

9 CoAgMET COLORADO CLIMATE CENTER 75 stations 10 coming soon on west slope 44 5-minute stations interactive mapping through erams includes time series charts site photos coagmet.colostate.edu

10 Note: precipitation data is only good in the warm season! CoAgMET COLORADO CLIMATE CENTER 75 stations 10 coming soon on west slope 44 5-minute stations interactive mapping through erams includes time series charts site photos coagmet.colostate.edu

11 CoAgMET COLORADO CLIMATE CENTER 75 stations 10 coming soon on west slope 44 5-minute stations interactive mapping through erams includes time series charts site photos coagmet.colostate.edu
12 National Weather Service automated stations Map showing NWS stations (from mesowest.utah.edu) COLORADO CLIMATE CENTER

13 NWS stations + CoAgMET + other networks COLORADO CLIMATE CENTER (from mesowest.utah.edu)
14 The problem with most of these networks: no reliable measurements of frozen precipitation! COLORADO CLIMATE CENTER
 https://www.")

15 SNOTEL (Snow telemetry) Tower SNOTEL site (10,500 ft, near Steamboat) COLORADO CLIMATE CENTER Note: not current data!!
 each year!")
16 COLORADO CLIMATE CENTER Precipitation from the Tower SNOTEL site Nearly 60 of precipitation (liquid equivalent) each year! Almost all comes from snow at this elevation

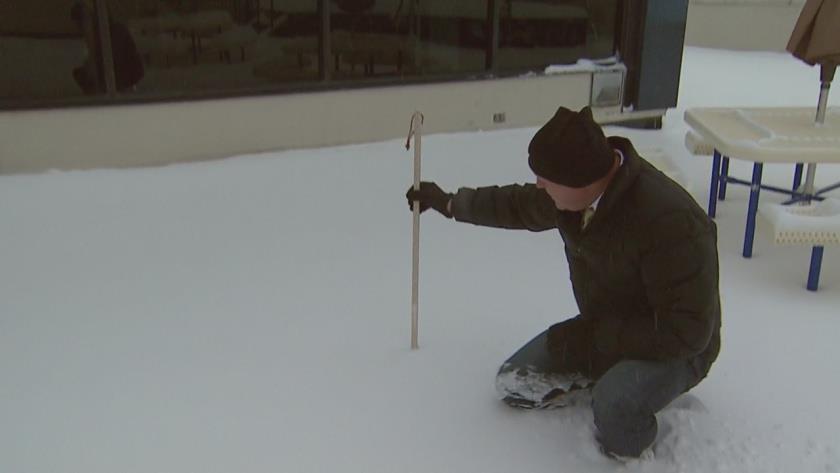
17 Plus the old-fashioned way A different kind of snowboard COLORADO CLIMATE CENTER
18 Putting it all together Data: PRISM climate group prism.oregonstate.edu COLORADO CLIMATE CENTER

19 In every month, it s the wettest month somewhere in Colorado! Data: PRISM climate group prism.oregonstate.edu COLORADO CLIMATE CENTER
20 What do we want to know about the snow? In Colorado, we re usually most concerned about snow-water equivalent (SWE): this is what provides the water for rivers, reservoirs, agriculture, drinking water, etc., etc. The general public mostly wants to know how deep it will be But in your business, surely it s not just the depth, but also other characteristics: Wet or dry How fast is it accumulating? Drifting? And these things are difficult to measure, and even harder to predict! COLORADO CLIMATE CENTER

21 The forecast funnel COLORADO CLIMATE CENTER The forecast funnel In weather forecasting, we are always thinking about the different scales (both time and space) that are important to whatever it is we re trying to predict We ll usually start at the very large scales, and then funnel down to the smaller scales Let s use that approach today for understanding snowstorms

22 COLORADO CLIMATE CENTER Scales of motion in the atmosphere Planetary scale: broad, often slow-moving waves through the middle and high latitudes But fast-moving winds in the jet streams through those waves! earth.nullschool.net
 earth.nullschool.")
23 COLORADO CLIMATE CENTER Scales of motion in the atmosphere Synoptic scale: the jet stream, large storm systems (cyclones) earth.nullschool.net

24 COLORADO CLIMATE CENTER Scales of motion in the atmosphere Mesoscale (middle scale): fronts; thunderstorms; interactions with mountain ranges and land/sea contrasts weather.cod.edu/satrad/exper

25 COLORADO CLIMATE CENTER Scales of motion in the atmosphere Microscale: local effects owing to small variations in terrain; land cover; instabilities in the atmosphere; etc.
26 Seasonal drivers: El Niño-Southern Oscillation (ENSO) One of the biggest drivers of seasonal climate over North America is ENSO, the periodic variation of ocean temperatures in the Pacific Ocean Its effect is to shift where the jet stream tends to be, how wavy it is, etc. We are currently in neutral conditions, but most forecasts point to El Niño conditions being in place by late fall/early winter COLORADO CLIMATE CENTER
.")
27 Example of a strong El Niño ( ) COLORADO CLIMATE CENTER Seasonal drivers: El Niño-Southern Oscillation (ENSO) El Niño refers to the waters in the central and eastern Pacific being warmer than normal (La Niña is when waters in this region are cooler than normal). In turn, this affects where large thunderstorm complexes develop in the tropics, which then affects the jet stream pattern over North America
.")
28 COLORADO CLIMATE CENTER Seasonal drivers: El Niño-Southern Oscillation (ENSO) El Niño refers to the waters in the central and eastern Pacific being warmer than normal (La Niña is when waters in this region are cooler than normal). In turn, this affects where large thunderstorm complexes develop in the tropics, which then affects the jet stream pattern over North America
.")
29 COLORADO CLIMATE CENTER Seasonal drivers: El Niño-Southern Oscillation (ENSO) El Niño refers to the waters in the central and eastern Pacific being warmer than normal (La Niña is when waters in this region are cooler than normal). In turn, this affects where large thunderstorm complexes develop in the tropics, which then affects the jet stream pattern over North America
30 What about for Colorado? We sit in between the more robust signals of warm/dry to the north, and cool/wet to the south Therefore, the ENSO phase just isn t that reliable of a predictor for our seasonal snowfall totals If the jet stream position (on average) pushes slightly one direction or the other, it can have a big influence on our winter! Last winter was La Niña conditions, and it turned out to follow the usual pattern: relatively cool and snowy to the north, and warm and dry to the south But El Niño winters seem to have even more variability... COLORADO CLIMATE CENTER
31 COLORADO CLIMATE CENTER Correlation of ENSO phase to seasonal snowfall Fort Collins: a slight tendency for snowier winters during El Niño, but lots of variability
32 COLORADO CLIMATE CENTER Correlation of ENSO phase to seasonal snowfall Similar at Denver: slight tendency for snowier winters during El Niño, but lots of variability
33 COLORADO CLIMATE CENTER Correlation of ENSO phase to seasonal snowfall In most mountain areas, the correlation is even weaker At Copper Mountain, a very slight tendency toward less-snowy winters during El Niño
34 COLORADO CLIMATE CENTER Correlation of ENSO phase to seasonal snowfall The one mountain area with a reasonably strong signal is in the Sangre de Cristos, which usually see more snow in El Niño winters
35 ENSO phase ENSO phase Averaged over the Upper Colorado River Basin Wet years tend to come during El Niño, but it s no guarantee... A case study of a wet and a dry year (with similar ENSO/PDO conditions) shows that the occurrence of a few large accumulating events is what drives the seasonal variability -Bolinger et al. (2014, Journal of Climate) COLORADO CLIMATE CENTER
36 COLORADO CLIMATE CENTER What about big snowstorms along the Front Range? At Fort Collins (and similar for other Front Range locations), big snowstorms occur more frequently during El Niño winters, but the relationship isn t particularly strong
37 El Niño summary The phase of ENSO does slightly tilt the odds in terms of snow seasons in Colorado: Southern Colorado tends to be cooler and snowier than average The Front Range and Plains are somewhat more likely to see a big snowstorm The relationship in the central mountains is not especially strong But there are many more factors than ENSO that affect the frequency of snowstorms, and the seasonal snow accumulations in Colorado (as opposed to north and south of us, where connections are stronger) COLORADO CLIMATE CENTER

38 COLORADO CLIMATE CENTER Winter outlook from Climate Prediction Center December-January-February outlook shows slightly increased chances of warmer and wetter conditions compared to normal

39 COLORADO CLIMATE CENTER Winter outlook from Climate Prediction Center December-January-February outlook shows slightly increased chances of warmer and wetter conditions compared to normal

40 COLORADO CLIMATE CENTER Synoptic-scale drivers: how does a big Front Range snowstorm come together? Let s look at the March 2003 snowstorm: the biggest one in recent memory
 Bottom: lowerlevel winds and temperature")

41 Top: upperlevel winds and vorticity ( spin ) Bottom: lowerlevel winds and temperature March 14 (3 days before): Warm on the plains, no sign yet of the storm at upper levels


42 Top: upperlevel winds and vorticity ( spin ) Bottom: lowerlevel winds and temperature March 15 (2 days before): Still warm on the plains, the first signs of the wave that will develop into the big storm
 Bottom: lowerlevel winds and")

43 Top: upperlevel winds and vorticity ( spin ) Bottom: lowerlevel winds and temperature March 16 (1 day before): Still warm on the plains, wave just starting to develop
: Upper-level storm just now")

44 Top: upperlevel winds and vorticity ( spin ) March 17 (day the storm starts): Upper-level storm just now developed over the 4 corners Bottom: lowerlevel winds and temperature Surface cyclone over southeast Colorado
: Upper-level low has")

45 Top: upperlevel winds and vorticity ( spin ) March 18 (snow continues): Upper-level low has hardly moved Bottom: lowerlevel winds and temperature Surface cyclone remains over southeast Colorado

46 Water vapor loop of March 2003 storm, courtesy Dan Lindsey
47 Upper-level low over 4 corners Surface low over southeast CO Plunger lows COLORADO CLIMATE CENTER Although the March 2003 storm was a particularly extreme case, situations where the upper-level low pressure plunges southward are the most common pattern for Front Range snowstorms The fact that the storm system doesn t even exist 1-2 days before the snow flies makes the forecasting difficult!
48 CONTRASTING SURFACE PRESSURE PATTERNS FOR DENVER AND FORT COLLINS SNOWSTORMS Local effects COLORADO CLIMATE CENTER FCL experiences downslope flow off Cheyenne Ridge DEN experiences upslope north of Palmer Lake Divide FCL DEN SURFACE PRESSURE FCL DEN FCL experiences upslope flow south of Cheyenne Ridge DEN experiences downslope off Palmer Lake Divide We have many localized influences on snowfall in Colorado because of our mountains and other terrain variations! DEN SNOWSTORM FCL SNOWSTORM
49 b between arch. The and clearly gime was a dy. developed therly flow is structure s shown in the urban anced flow ost surface t that time 5 10 m s m s -1 extremely ch through r gusts. As Barrier jets and cold-air damming Sometimes, cold air near the surface will pile up east of the Front Range, and lift of the upslope flow over the cold air can provide an additional source of ascent farther out on the Plains; along with sufficient cooling to allow for snow Figure From 12. Wesley (a, top) et Surface al. (2013), METAR study of observations the March 2003 for snowstorm 1800 UTC 17 March (b, bottom) Schematic of the cold-air-damming
 From Bauer et al. (2015) COLORADO CLIMATE CENTER")
50 The quiet revolution of numerical weather prediction Forecast skill (500-hPa height anomaly correlation) From Bauer et al. (2015) COLORADO CLIMATE CENTER

51 Weather forecasting and chaos One example of a chaotic system Lorenz explains is a ski run with moguls he suggested Cat s Meow at Loveland COLORADO CLIMATE CENTER

52 Develop a model for a ski or board pushed from the top of the slope at a specified velocity From Lorenz, The Essence of Chaos
53 Space the boards 10 cm apart and push down the slope at identical velocity From Lorenz, The Essence of Chaos
54 Now space them 1 millimeter apart It takes more time/distance, but the boards eventually diverge even in this situation From Lorenz, The Essence of Chaos

55 Ensemble weather forecasts COLORADO CLIMATE CENTER

56 Ensemble weather forecasts COLORADO CLIMATE CENTER

57 Forecast skill for the February and March 2016 Front Range snowstorms COLORADO CLIMATE CENTER Forecasts of snowstorms In 2016, we had two big snowstorms along the Front Range, one in early February and one in mid- March Forecasts of the first one were spot-on: about as good as we could hope for! For this skill score, higher numbers are better, 1 is a perfect forecast The second one...not so much.


58 Example of National Weather Service snow forecast scenarios, December 2016 Low-end: Expect at least this much Most likely High-end: Potential for this much COLORADO CLIMATE CENTER
 COLORADO CLIMATE CENTER")
59 And finally, the all-important question: Do you have a rain gauge? (and a snowboard!) COLORADO CLIMATE CENTER

60 If you are interested in weather and the variations in precipitation, please join the Community Collaborative Rain, Hail and Snow Network or see me today
61 CoCoRaHS snowfall data, 23 March 2016 Front Range snowstorm Some of the sharp changes from place to place are apparent and we always need more observers! COLORADO CLIMATE CENTER

62 CoCoRaHS snowfall data, 23 March 2016 Front Range snowstorm Some of the sharp changes from place to place are apparent and we always need more observers! (prototype interactive maps, coming soon!) COLORADO CLIMATE CENTER
63 CoCoRaHS data in Hurricane Florence, September in 7 days Swansboro, NC COLORADO CLIMATE CENTER


64 CoCoRaHS data in Hurricane Florence, September in 7 days Swansboro, NC COLORADO CLIMATE CENTER
65 Thank you! Follow us on Facebook and
66 COLORADO CLIMATE CENTER
Colorado weather and climate update: a bit more than halfway through the water year (Or: What s going on with the weather?? )
") Colorado weather and climate update: a bit more than halfway through the water year (Or: What s going on with the weather?? ) Russ S. Schumacher Colorado State Climatologist Director, Colorado Climate
Colorado weather and climate update: a bit more than halfway through the water year (Or: What s going on with the weather?? ) Russ S. Schumacher Colorado State Climatologist Director, Colorado Climate
Weather and Climate Summary and Forecast March 2018 Report
 Weather and Climate Summary and Forecast March 2018 Report Gregory V. Jones Linfield College March 7, 2018 Summary: The ridge pattern that brought drier and warmer conditions from December through most
Weather and Climate Summary and Forecast January 2018 Report
 Weather and Climate Summary and Forecast January 2018 Report Gregory V. Jones Linfield College January 5, 2018 Summary: A persistent ridge of high pressure over the west in December produced strong inversions
Weather and Climate Summary and Forecast February 2018 Report
 Weather and Climate Summary and Forecast February 2018 Report Gregory V. Jones Linfield College February 5, 2018 Summary: For the majority of the month of January the persistent ridge of high pressure
Here s what a weak El Nino usually brings to the nation with temperatures:
 Time again for my annual Winter Weather Outlook. Here's just a small part of the items I considered this year and how I think they will play out with our winter of 2018-2019. El Nino / La Nina: When looking
NIDIS Intermountain West Drought Early Warning System January 15, 2019
 NIDIS Drought and Water Assessment NIDIS Intermountain West Drought Early Warning System January 15, 2019 Precipitation The images above use daily precipitation statistics from NWS COOP, CoCoRaHS, and
Winter. Here s what a weak La Nina usually brings to the nation with tempseraures:
 2017-2018 Winter Time again for my annual Winter Weather Outlook. Here's just a small part of the items I considered this year and how I think they will play out with our winter of 2017-2018. El Nino /
INVISIBLE WATER COSTS
 Every Drop Every Counts... Drop Counts... INVISIBLE WATER COSTS Corn - 108.1 gallons per pound How much water it takes to produce... Apple - 18.5 gallons to grow Beef - 1,581 gallons per pound Oats - 122.7
Weather and Climate Summary and Forecast December 2017 Report
 Weather and Climate Summary and Forecast December 2017 Report Gregory V. Jones Linfield College December 5, 2017 Summary: November was relatively cool and wet from central California throughout most of
Becky Bolinger Water Availability Task Force November 13, 2018
 Colorado Climate Center WATF Climate Update Becky Bolinger Water Availability Task Force November 13, 2018 COLORADO CLIMATE CENTER Water Year 2018 Colorado s Climate in Review COLORADO CLIMATE CENTER
Weather and Climate Summary and Forecast April 2018 Report
 Weather and Climate Summary and Forecast April 2018 Report Gregory V. Jones Linfield College April 4, 2018 Summary: A near Miracle March played out bringing cooler and wetter conditions to the majority
Weather and Climate Summary and Forecast October 2017 Report
 Weather and Climate Summary and Forecast October 2017 Report Gregory V. Jones Linfield College October 4, 2017 Summary: Typical variability in September temperatures with the onset of fall conditions evident
MET Lecture 20 Mountain Snowstorms (CH16)
") MET 4300 Lecture 20 Mountain Snowstorms (CH16) Learning Objectives Provide an overview of the importance and impacts of mountain snowstorms in the western US Describe how topography influence precipitation
MET 4300 Lecture 20 Mountain Snowstorms (CH16) Learning Objectives Provide an overview of the importance and impacts of mountain snowstorms in the western US Describe how topography influence precipitation
Climate Outlook through 2100 South Florida Ecological Services Office Vero Beach, FL September 9, 2014
 Climate Outlook through 2100 South Florida Ecological Services Office Vero Beach, FL September 9, 2014 Short Term Drought Map: Short-term (
JEFF JOHNSON S Winter Weather Outlook
 JEFF JOHNSON S 2017-2018 Winter Weather Outlook TABLE OF CONTENTS ABOUT THE AUTHOR Components of the seasonal outlook... 2 ENSO state/ocean temperatures... 3 Sub-seasonal outlooks... 4 Forecast models...
Colorado CoCoRaHS. Colorado CoCoRaHS. Because Every Drop Counts! November 2014 Volume 2, Issue 11
 U.S. PRECIPITATION (% OF AVERAGE) LOOKING BACK AT OCTOBER 2014 October was a fairly dry month for much of the nation with the exception of the Pacific Northwest, portions of New England and the Tennessee
Colorado s 2003 Moisture Outlook
 Colorado s 2003 Moisture Outlook Nolan Doesken and Roger Pielke, Sr. Colorado Climate Center Prepared by Tara Green and Odie Bliss http://climate.atmos.colostate.edu How we got into this drought! Fort
Weather and Climate Summary and Forecast November 2017 Report
 Weather and Climate Summary and Forecast November 2017 Report Gregory V. Jones Linfield College November 7, 2017 Summary: October was relatively cool and wet north, while warm and very dry south. Dry conditions
RaysWeather.Com Winter Fearless Forecast
 Author: Dr. Ray Russell Founder and President of RaysWeather.Com Date: October 19, 2017 RaysWeather.Com 2018-2019 Winter Fearless Forecast Background Unseasonably warm weather continues this fall no frost
Pacific Decadal Oscillation ( PDO ):
:") Time again for my annual Winter Weather Outlook. Here's just a small part of the items I considered this year and how I think they will play out with our winter of 2015-2016. El Nino / La Nina: When looking
Time again for my annual Winter Weather Outlook. Here's just a small part of the items I considered this year and how I think they will play out with our winter of 2015-2016. El Nino / La Nina: When looking
2003 Moisture Outlook
 2003 Moisture Outlook Nolan Doesken and Roger Pielke, Sr. Colorado Climate Center Prepared by Tara Green and Odie Bliss http://climate.atmos.colostate.edu Through 1999 Through 1999 Fort Collins Total Water
Climate Outlook through 2100 South Florida Ecological Services Office Vero Beach, FL January 13, 2015
 Climate Outlook through 2100 South Florida Ecological Services Office Vero Beach, FL January 13, 2015 Short Term Drought Map: Short-term (
Upper Missouri River Basin December 2017 Calendar Year Runoff Forecast December 5, 2017
 Upper Missouri River Basin December 2017 Calendar Year Runoff Forecast December 5, 2017 Calendar Year Runoff Forecast Explanation and Purpose of Forecast U.S. Army Corps of Engineers, Northwestern Division
Highlights of the 2006 Water Year in Colorado
 Highlights of the 2006 Water Year in Colorado Nolan Doesken, State Climatologist Atmospheric Science Department Colorado State University http://ccc.atmos.colostate.edu Presented to 61 st Annual Meeting
A Review of the 2007 Water Year in Colorado
 A Review of the 2007 Water Year in Colorado Nolan Doesken Colorado Climate Center, CSU Mike Gillespie Snow Survey Division, USDA, NRCS Presented at the 28 th Annual AGU Hydrology Days, March 26, 2008,
NIDIS Intermountain West Drought Early Warning System February 6, 2018
 NIDIS Intermountain West Drought Early Warning System February 6, 2018 Precipitation The images above use daily precipitation statistics from NWS COOP, CoCoRaHS, and CoAgMet stations. From top to bottom,
An ENSO-Neutral Winter
 An ENSO-Neutral Winter This issue of the Blue Water Outlook newsletter is devoted towards my thoughts on the long range outlook for winter. You will see that I take a comprehensive approach to this outlook
Weather and Climate Summary and Forecast Winter
 Weather and Climate Summary and Forecast Winter 2016-17 Gregory V. Jones Southern Oregon University February 7, 2017 What a difference from last year at this time. Temperatures in January and February
Colorado CoCoRaHS. Colorado CoCoRaHS. December 2013 Volume 1, Issue 8 NOVEMBER PRECIPITATION NOVEMBER TEMPERATURES
 NOVEMBER PRECIPITATION The month of November brought a flip-flop in precipitation patterns to some areas compared to the previous month, especially for locations in the foothills north of I-70 and in south-central
Weather and Climate Summary and Forecast March 2019 Report
 Weather and Climate Summary and Forecast March 2019 Report Gregory V. Jones Linfield College March 2, 2019 Summary: Dramatic flip from a mild winter to a top five coldest February on record in many locations
Weather and Climate Summary and Forecast January 2019 Report
 Weather and Climate Summary and Forecast January 2019 Report Gregory V. Jones Linfield College January 4, 2019 Summary: December was mild and dry over much of the west, while the east was much warmer than
PRECIPITATION. Last Week Precipitation:
 12/3/2014 NIDIS Drought and Water Assessment PRECIPITATION The images above use daily precipitation statistics from NWS COOP, CoCoRaHS, and CoAgMet stations. From top to bottom, and left to right: most
What a Hurricane Needs to Develop
 Weather Weather is the current atmospheric conditions, such as air temperature, wind speed, wind direction, cloud cover, precipitation, relative humidity, air pressure, etc. 8.10B: global patterns of atmospheric
Weather and Climate Summary and Forecast Winter
 Weather and Climate Summary and Forecast Winter 2016-17 Gregory V. Jones Southern Oregon University December 5, 2016 Well after an October that felt more like November, we just finished a November that
Weather and Climate Summary and Forecast August 2018 Report
 Weather and Climate Summary and Forecast August 2018 Report Gregory V. Jones Linfield College August 5, 2018 Summary: July 2018 will likely go down as one of the top five warmest July s on record for many
Seasonal Outlook through September 2007
 Seasonal Outlook through September 2007 Klaus Wolter (15may) University of Colorado, CIRES & NOAA-ESRL Climate Analysis Branch klaus.wolter@noaa.gov http://www.cdc.noaa.gov/people/klaus.wolter/swcasts/
Weather and Climate Summary and Forecast Summer 2017
 Weather and Climate Summary and Forecast Summer 2017 Gregory V. Jones Southern Oregon University August 4, 2017 July largely held true to forecast, although it ended with the start of one of the most extreme
Seasonal Outlook through September 2007
 Seasonal Outlook through September 2007 Klaus Wolter (18apr07) University of Colorado, CIRES & NOAA-ESRL Climate Analysis Branch klaus.wolter@noaa.gov http://www.cdc.noaa.gov/people/klaus.wolter/swcasts/
NIDIS Intermountain West Regional Drought Early Warning System February 7, 2017
 NIDIS Drought and Water Assessment NIDIS Intermountain West Regional Drought Early Warning System February 7, 2017 Precipitation The images above use daily precipitation statistics from NWS COOP, CoCoRaHS,
Colorado CoCoRaHS. Colorado CoCoRaHS. Because Every Drop Counts! October 2014 Volume 2, Issue 10
 U.S. PRECIPITATION (% OF AVERAGE) LOOKING BACK AT SEPTEMBER 2014 September was dry for much of the nation with a few exceptions; one of those being the central Rockies. In Colorado, it was wetter-than-average
Applications/Users for Improved S2S Forecasts
 Applications/Users for Improved S2S Forecasts Nolan Doesken Colorado Climate Center Colorado State University WSWC Precipitation Forecasting Workshop June 7-9, 2016 San Diego, CA First -- A short background
Weather and Climate Summary and Forecast October 2018 Report
 Weather and Climate Summary and Forecast October 2018 Report Gregory V. Jones Linfield College October 4, 2018 Summary: Much of Washington, Oregon, coastal California and the Bay Area and delta region
Assessment of Snowpack-Influencing climate Change in the Colorado Rockies and Oregon Cascades using a Simple Winter Precipitation Index
 Assessment of Snowpack-Influencing climate Change in the Colorado Rockies and Oregon Cascades using a Simple Winter Precipitation Index Has recent climate change benefited mountain snowpack? Mark Losleben,
2003 Water Year Wrap-Up and Look Ahead
 2003 Water Year Wrap-Up and Look Ahead Nolan Doesken Colorado Climate Center Prepared by Odie Bliss http://ccc.atmos.colostate.edu Colorado Average Annual Precipitation Map South Platte Average Precipitation
Funding provided by NOAA Sectoral Applications Research Project CLIMATE. Basic Climatology Colorado Climate Center
 Funding provided by NOAA Sectoral Applications Research Project CLIMATE Basic Climatology Colorado Climate Center Remember These? Factor 1: Our Energy Source Factor 2: Revolution & Tilt Factor 3: Rotation!
Drought in Southeast Colorado
 Drought in Southeast Colorado Nolan Doesken and Roger Pielke, Sr. Colorado Climate Center Prepared by Tara Green and Odie Bliss http://climate.atmos.colostate.edu 1 Historical Perspective on Drought Tourism
DEPARTMENT OF EARTH & CLIMATE SCIENCES Name SAN FRANCISCO STATE UNIVERSITY Nov 29, ERTH 360 Test #2 200 pts
 DEPARTMENT OF EARTH & CLIMATE SCIENCES Name SAN FRANCISCO STATE UNIVERSITY Nov 29, 2018 ERTH 360 Test #2 200 pts Each question is worth 4 points. Indicate your BEST CHOICE for each question on the Scantron
The Pennsylvania Observer
 The Pennsylvania Observer April 2, 2010 March 2010 Pennsylvania Weather Recap Prepared by: Katelyn Johnson March did come in as a lion cub this year. The 1 st proved to be a calm day; however most of Pennsylvania
 October 16 th, 2012 2010-12 La Niña event reached its biggest peak since the mid-70s in late 2010, followed by a brief excursion to ENSOneutral conditions during mid-2011; it reached a second peak last
PRECIPITATION. Last Week Precipitation:
 2/24/2015 NIDIS Drought and Water Assessment PRECIPITATION The images above use daily precipitation statistics from NWS COOP, CoCoRaHS, and CoAgMet stations. From top to bottom, and left to right: most
California 120 Day Precipitation Outlook Issued Tom Dunklee Global Climate Center
 California 120 Day Precipitation Outlook Issued 11-01-2008 Tom Dunklee Global Climate Center This is my second updated outlook for precipitation patterns and amounts for the next 4 s of the current rainy
NIDIS Intermountain West Drought Early Warning System April 18, 2017
 1 of 11 4/18/2017 3:42 PM Precipitation NIDIS Intermountain West Drought Early Warning System April 18, 2017 The images above use daily precipitation statistics from NWS COOP, CoCoRaHS, and CoAgMet stations.
Weather and Climate Summary and Forecast Fall/Winter 2016
 Weather and Climate Summary and Forecast Fall/Winter 2016 Gregory V. Jones Southern Oregon University November 5, 2016 After a year where we were seemingly off by a month in terms of temperatures (March
Upper Missouri River Basin February 2018 Calendar Year Runoff Forecast February 6, 2018
 Upper Missouri River Basin February 2018 Calendar Year Runoff Forecast February 6, 2018 Calendar Year Runoff Forecast Explanation and Purpose of Forecast U.S. Army Corps of Engineers, Northwestern Division
November 28, 2017 Day 1
 November 28, 2017 Day 1 Air Masses & Fronts Teachers- please out the sheet (right) for the students to fill in as we go! Review: Clouds & Precipitation? What are the 4 different clouds? Status, Cumulus,
Wind River Indian Reservation and Surrounding Area Climate and Drought Summary
 Northern Arapaho Tribe Wind River Indian Reservation and Surrounding Area Climate and Drought Summary Winter Events & Spring Outlook 2016-2017 Cool Temperatures and Record-Breaking Wetness During Winter
Climate Forecast Applications Network (CFAN)
") Forecast of 2018 Atlantic Hurricane Activity April 5, 2018 Summary CFAN s inaugural April seasonal forecast for Atlantic tropical cyclone activity is based on systematic interactions among ENSO, stratospheric
Forecast of 2018 Atlantic Hurricane Activity April 5, 2018 Summary CFAN s inaugural April seasonal forecast for Atlantic tropical cyclone activity is based on systematic interactions among ENSO, stratospheric
Weather and Climate Summary and Forecast Summer 2016
 Weather and Climate Summary and Forecast Summer 2016 Gregory V. Jones Southern Oregon University June 6, 2016 May 2016 continued the warm trend for portions of the west, while providing some relief for
The Weather Wire. Contents: Summer 2018 Outlook. Summer 2018 Outlook Drought Monitor May Summary/Statistics June Preview Rainfall Totals
 The Weather Wire June 2018 Volume 25 Number 6 Contents: Summer 2018 Outlook Drought Monitor May Summary/Statistics June Preview Rainfall Totals Summer 2018 Outlook June 1 st marked the first day of meteorological
NIDIS Intermountain West Drought Early Warning System December 11, 2018
 NIDIS Drought and Water Assessment NIDIS Intermountain West Drought Early Warning System December 11, 2018 Precipitation The images above use daily precipitation statistics from NWS COOP, CoCoRaHS, and
Seasonal Climate Watch January to May 2016
 Seasonal Climate Watch January to May 2016 Date: Dec 17, 2015 1. Advisory Most models are showing the continuation of a strong El-Niño episode towards the latesummer season with the expectation to start
NIDIS Intermountain West Drought Early Warning System October 17, 2017
 NIDIS Drought and Water Assessment NIDIS Intermountain West Drought Early Warning System October 17, 2017 Precipitation The images above use daily precipitation statistics from NWS COOP, CoCoRaHS, and
Name: Climate Date: EI Niño Conditions
 Name: Date: Base your answers to questions 1 and 2 on the maps and the passage below. The maps show differences in trade wind strength, ocean current direction, and water temperature associated with air-pressure
CLIMATE. UNIT TWO March 2019
 CLIMATE UNIT TWO March 2019 OUTCOME 9.2.1Demonstrate an understanding of the basic features of Canada s landscape and climate. identify and locate major climatic regions of Canada explain the characteristics
NIDIS Intermountain West Drought Early Warning System December 30, 2018
 1/2/2019 NIDIS Drought and Water Assessment NIDIS Intermountain West Drought Early Warning System December 30, 2018 Precipitation The images above use daily precipitation statistics from NWS COOP, CoCoRaHS,
Impacts of the April 2013 Mean trough over central North America
 Impacts of the April 2013 Mean trough over central North America By Richard H. Grumm National Weather Service State College, PA Abstract: The mean 500 hpa flow over North America featured a trough over
Analysis of Fall Transition Season (Sept-Early Dec) Why has the weather been so violent?
 Why has the weather been so violent?") WEATHER TOPICS Analysis of Fall Transition Season (Sept-Early Dec) 2009 Why has the weather been so violent? As can be seen by the following forecast map, the Fall Transition and early Winter Season of
WEATHER TOPICS Analysis of Fall Transition Season (Sept-Early Dec) 2009 Why has the weather been so violent? As can be seen by the following forecast map, the Fall Transition and early Winter Season of
Weather and Climate Summary and Forecast Summer 2016
 Weather and Climate Summary and Forecast Summer 2016 Gregory V. Jones Southern Oregon University August 5, 2016 The month of July saw the continued flip, flop of the western US temperatures. It was warm
NIDIS Intermountain West Drought Early Warning System February 12, 2019
 NIDIS Intermountain West Drought Early Warning System February 12, 2019 Precipitation The images above use daily precipitation statistics from NWS COOP, CoCoRaHS, and CoAgMet stations. From top to bottom,
Precipitation. Standardized Precipitation Index. NIDIS Intermountain West Regional Drought Early Warning System January 3, 2017
 1/3/2017 NIDIS Drought and Water Assessment NIDIS Intermountain West Regional Drought Early Warning System January 3, 2017 Precipitation The images above use daily precipitation statistics from NWS COOP,
National Wildland Significant Fire Potential Outlook
 National Wildland Significant Fire Potential Outlook National Interagency Fire Center Predictive Services Issued: September, 2007 Wildland Fire Outlook September through December 2007 Significant fire
NIDIS Intermountain West Drought Early Warning System November 21, 2017
 NIDIS Drought and Water Assessment NIDIS Intermountain West Drought Early Warning System November 21, 2017 Precipitation The images above use daily precipitation statistics from NWS COOP, CoCoRaHS, and
Drought Impacts in the Southern Great Plains. Mark Shafer University of Oklahoma Norman, OK
 Drought Impacts in the Southern Great Plains Mark Shafer University of Oklahoma Norman, OK Causes of Drought: Large-Scale, Stationary High Pressure Air rotates clockwise around high pressure steers storms
Office of the Washington State Climatologist
 Office of the Washington State Climatologist May 3, 2013 April Event Summary Average April temperatures were below normal for a majority of the state. Total precipitation was above normal for western and
THE ATMOSPHERE IN MOTION
 Funding provided by NOAA Sectoral Applications Research Project THE ATMOSPHERE IN MOTION Basic Climatology Oklahoma Climatological Survey Factor 1: Our Energy Source Hi, I m the Sun! I provide 99.9999+
The Pennsylvania Observer
 The Pennsylvania Observer January 5, 2016 December 2015 - Pennsylvania Weather Recap By: Arthur Person December is the first of the three coldest months of the year. Sometimes it can be naughty, and sometimes
Precipitation. Standardized Precipitation Index. NIDIS Intermountain West Regional Drought Early Warning System December 6, 2016
 12/9/2016 NIDIS Drought and Water Assessment NIDIS Intermountain West Regional Drought Early Warning System December 6, 2016 Precipitation The images above use daily precipitation statistics from NWS COOP,
Fire Weather Drivers, Seasonal Outlook and Climate Change. Steven McGibbony, Severe Weather Manager Victoria Region Friday 9 October 2015
 Fire Weather Drivers, Seasonal Outlook and Climate Change Steven McGibbony, Severe Weather Manager Victoria Region Friday 9 October 2015 Outline Weather and Fire Risk Environmental conditions leading to
Tracking the Climate Of Northern Colorado Nolan Doesken State Climatologist Colorado Climate Center Colorado State University
 Tracking the Climate Of Northern Colorado Nolan Doesken State Climatologist Colorado Climate Center Colorado State University Northern Colorado Business Innovations November 20, 2013 Loveland, Colorado
Let s Talk Climate! Nolan Doesken Colorado Climate Center Colorado State University. Yampatika Seminar February 16, 2011 Steamboat Springs, Colorado
 Let s Talk Climate! Nolan Doesken Colorado Climate Center Colorado State University Yampatika Seminar February 16, 2011 Steamboat Springs, Colorado First -- A short background In 1973 the federal government
Summer 2018 Southern Company Temperature/Precipitation Forecast
 Scott A. Yuknis High impact weather forecasts, climate assessment and prediction. 14 Boatwright s Loop Plymouth, MA 02360 Phone/Fax 508.927.4610 Cell: 508.813.3499 ClimateImpact@comcast.net Climate Impact
2015: A YEAR IN REVIEW F.S. ANSLOW
 2015: A YEAR IN REVIEW F.S. ANSLOW 1 INTRODUCTION Recently, three of the major centres for global climate monitoring determined with high confidence that 2015 was the warmest year on record, globally.
NIDIS Intermountain West Drought Early Warning System December 4, 2018
 12/4/2018 NIDIS Drought and Water Assessment NIDIS Intermountain West Drought Early Warning System December 4, 2018 Precipitation The images above use daily precipitation statistics from NWS COOP, CoCoRaHS,
3) What is the difference between latitude and longitude and what is their affect on local and world weather and climate?
 What is the difference between latitude and longitude and what is their affect on local and world weather and climate?") www.discoveryeducation.com 1) Describe the difference between climate and weather citing an example of each. Describe how water (ocean, lake, river) has a local effect on weather and climate and provide
www.discoveryeducation.com 1) Describe the difference between climate and weather citing an example of each. Describe how water (ocean, lake, river) has a local effect on weather and climate and provide
1 What Is Climate? TAKE A LOOK 2. Explain Why do areas near the equator tend to have high temperatures?
 CHAPTER 17 1 What Is Climate? SECTION Climate BEFORE YOU READ After you read this section, you should be able to answer these questions: What is climate? What factors affect climate? How do climates differ
Impacts of Climate on the Corn Belt
 Impacts of Climate on the Corn Belt Great Lakes Crop Summit 2015 2015 Evelyn Browning Garriss Conclusions Climate change is not linear. It ebbs and flows. Recent polar volcano eruptions created a cool
Weather Outlook for Spring and Summer in Central TX. Aaron Treadway Meteorologist National Weather Service Austin/San Antonio
 Weather Outlook for Spring and Summer in Central TX Aaron Treadway Meteorologist National Weather Service Austin/San Antonio Outline A Look Back At 2014 Spring 2015 So Far El Niño Update Climate Prediction
ATMOSPHERIC MODELLING. GEOG/ENST 3331 Lecture 9 Ahrens: Chapter 13; A&B: Chapters 12 and 13
 ATMOSPHERIC MODELLING GEOG/ENST 3331 Lecture 9 Ahrens: Chapter 13; A&B: Chapters 12 and 13 Agenda for February 3 Assignment 3: Due on Friday Lecture Outline Numerical modelling Long-range forecasts Oscillations
Montana Drought & Climate
 Montana Drought & Climate MARCH 219 MONITORING AND FORECASTING FOR AGRICULTURE PRODUCERS A SERVICE OF THE MONTANA CLIMATE OFFICE IN THIS ISSUE IN BRIEF PAGE 2 REFERENCE In a Word PAGE 3 REVIEW Winter 219:
Eastern Shore Weather and Climate. Bill Sammler Warning Coordination Meteorologist National Weather Service Wakefield, VA
 Eastern Shore Weather and Climate Bill Sammler Warning Coordination Meteorologist National Weather Service Wakefield, VA About The NWS The National Weather Service is: A Federal Government Agency Part
Wind: Global Systems Chapter 10
 Wind: Global Systems Chapter 10 General Circulation of the Atmosphere General circulation of the atmosphere describes average wind patterns and is useful for understanding climate Over the earth, incoming
Flood Risk Assessment
 Flood Risk Assessment February 14, 2008 Larry Schick Army Corps of Engineers Seattle District Meteorologist General Assessment As promised, La Nina caused an active winter with above to much above normal
Storm and Storm Systems Related Vocabulary and Definitions. Magnitudes are measured differently for different hazard types:
 Storm and Storm Systems Related Vocabulary and Definitions Magnitude: this is an indication of the scale of an event, often synonymous with intensity or size. In natural systems, magnitude is also related
Weather Atmospheric condition in one place during a limited period of time Climate Weather patterns that an area typically experiences over a long
 Weather Atmospheric condition in one place during a limited period of time Climate Weather patterns that an area typically experiences over a long period of time Many factors influence weather & climate
WINTER FORECAST NY Metro
 2015-2016 WINTER FORECAST NY Metro Weather @NY_WX DISCLAIMER: Seasonal forecasting is difficult and this is my first attempt at a Winter Forecast. I ve looked at all factors and put them together to create
The New Normal or Was It?
 The New Normal or Was It? by Chuck Coffey The recent drought has caused many to reflect upon the past and wonder what is in store for the future. Just a couple of years ago, few agricultural producers
MDA WEATHER SERVICES AG WEATHER OUTLOOK. Kyle Tapley-Senior Agricultural Meteorologist May 22, 2014 Chicago, IL
 MDA WEATHER SERVICES AG WEATHER OUTLOOK Kyle Tapley-Senior Agricultural Meteorologist May 22, 2014 Chicago, IL GLOBAL GRAIN NORTH AMERICA 2014 Agenda Spring Recap North America Forecast El Niño Discussion
Weather Atmospheric condition in one place during a limited period of time Climate Weather patterns that an area typically experiences over a long
 Weather Atmospheric condition in one place during a limited period of time Climate Weather patterns that an area typically experiences over a long period of time Many factors influence weather & climate
Climate Impacts to Southwest Water Sector. Dr. Dave DuBois New Mexico State Climatologist
 Climate Impacts to Southwest Water Sector Dr. Dave DuBois New Mexico State Climatologist Presented at EPA Extreme Events and Climate Adaptation Planning Workshop June 3, 2015 Water Year Precip. % of Average
Global Wind Patterns
 Name: Earth Science: Date: Period: Global Wind Patterns 1. Which factor causes global wind patterns? a. changes in the distance between Earth and the Moon b. unequal heating of Earth s surface by the Sun