Appendix B2 Hydraulics
|
|
|
- Darcy Davidson
- 5 years ago
- Views:
Transcription
1 Westchester County Streams, Byram River Basin Flood Risk Management Fairfield County, Connecticut and Westchester County, New York Draft Integrated Feasibility Report & Environmental Impact Statement Appendix B2 Hydraulics
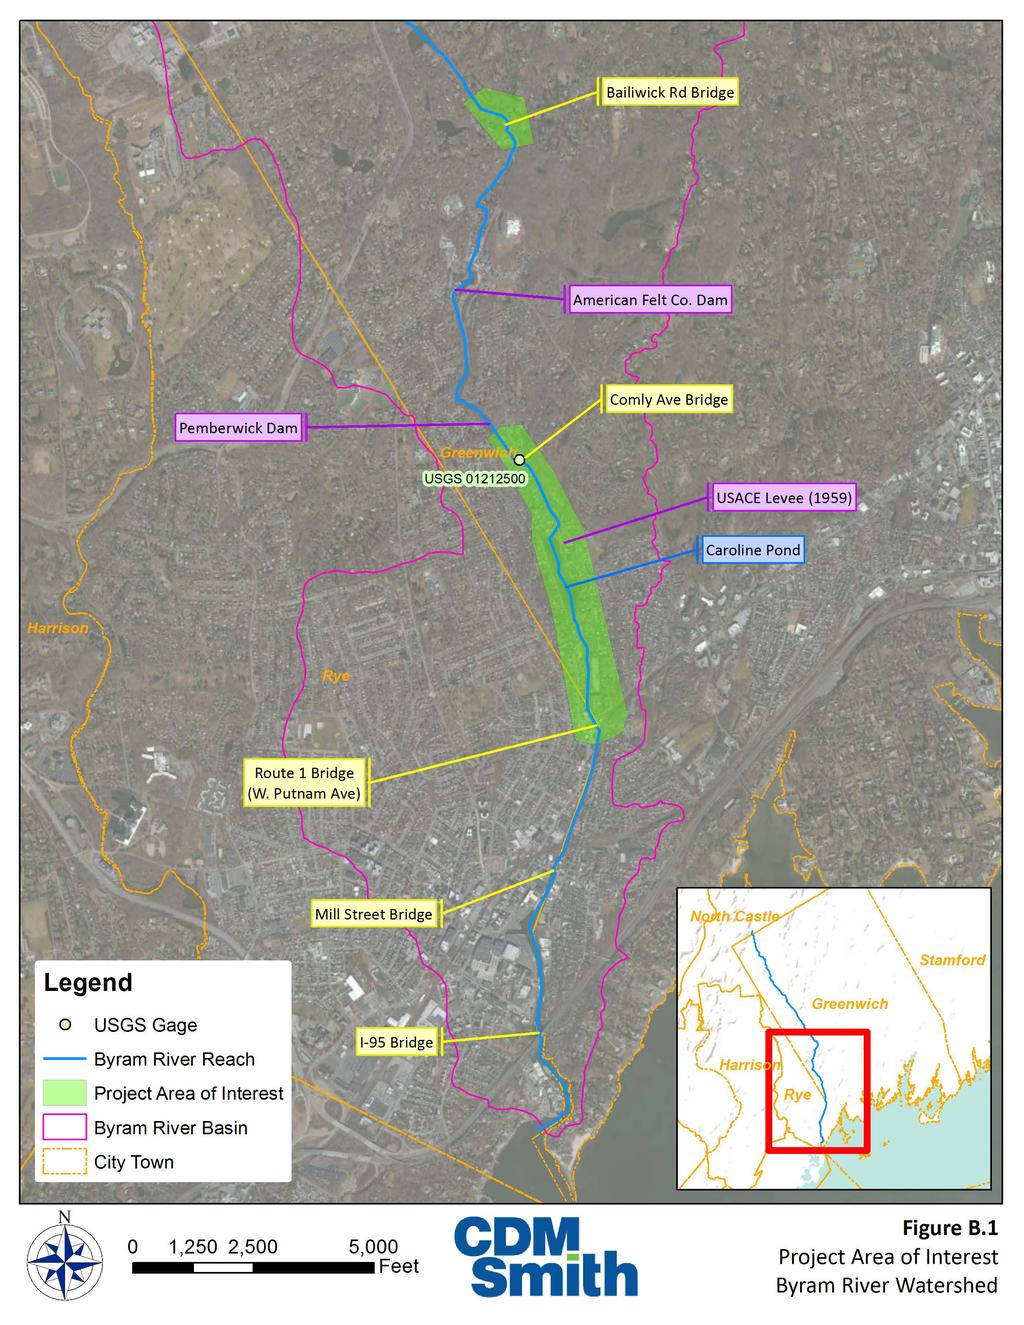
2 This Appendix documents the activities performed in support of Task 2.2.a - Existing and Future without Project Conditions Hydraulics in the Project Management Plan. The purpose of Task 2.2.a is to develop the inundation extents and peak water surface profiles associated with a set of design flood conditions: 100-, 50-, 20-, 10-, 4-, 2-, 1-, 0.5-, and 0.2-percent events. The flows developed in Appendix B1 are the basis of the flow regimes used in the hydraulic simulations. This Appendix also analyzes the impacts of climate change and sea level rise as well as a sediment transport for conditions with and without the Route 1 Bridge removals. 1. Project Area of Interest and Approach The Byram River basin is almost entirely within the extents of the City of Greenwich, Connecticut with headwaters north across the border in New York state. The total contributing area at the river mouth is 30 square miles. The riparian zone of the lower three miles of the Byram River is populated with suburban housing and commercial buildings. In the upper reach, upstream of the bridge at Bailiwick Road, the area is less densely developed. The project area of interest is the main branch of the Byram River from the Route 1 bridge crossings upstream to the Comly Ave bridge and the area directly upstream of the Bailiwick Ave bridge. There has been historic flooding during extreme rainfall events in the Caroline Pond area just upstream of the Route 1 bridges. Figure 1 shows the area of interest. A flood control levee completed by the U.S. Army Corps of Engineers (USACE) in August 1961 on the east bank of the Byram River downstream of the Comly Ave bridge and adjacent to Halock Drive is also shown on Figure 1. The flood control project includes an earthen levee and approximately 3,000 feet of channel widening and deepening modifications. It was constructed under Public Law 685, 84 th Congress. A HEC-RAS model of the entire Byram River extending beyond the project area extents was built from prior studies and recent survey. This model was used to represent the hydraulic routing of historic floods and design discharge regimes described in Appendix B1 of this report. 2. Prior Hydraulic Analyses The analysis documented in this Appendix represents a refinement of prior hydraulic analyses conducted on the Byram River. These reports served as a source of model input data and parameter validation. 2.1 USACE Flood Plain Information Summary Report (1964) In 1964, USACE prepared a Flood Plain Information Report for the Byram River from the NYNH&H railroad bridge to about a mile upstream of the Merritt Parkway (USACE, 1964). The analysis included hydraulic modeling of the main reach to generate water surface profiles for design discharges, and estimates of the peak discharge associated with the October 1955 Flood. 2.2 USACE Detailed Study (1975) and Feasibility Report (1977) In 1975, USACE built a HEC-2 model of the Byram River from the Mill Street Bridge to the Toll Gate Pond Dam under Inter-Agency Agreement No. IAA-H-17-74, Project No. 15 (FEMA, 2010). The model was used to create flood profiles for the 1986 Flood Insurance Study (FIS) report published by the Federal Emergency Management Agency (FEMA). The results of the detailed study are also reported in Appendix B of the 1977 Feasibility Report for Flood Control also published by the USACE. Appendix B2-2 Draft Feasibility Report & Environmental Impact Statement June 2018 Byram River Basin, CT & NY
3 2.3 CDM Drainage Study (2008) In 2008 CDM completed a detailed study of the main branch of the Byram River. The hydraulic analysis was performed with a HEC-RAS model built in the HEC-GeoRAS environment (CDM, 2008). The 2008 model was an update of the 1975 HEC-2 detailed study in the effective FEMA FIS and used many of the same cross sections. Field survey was used to improve cross section accuracy and add detail to the original HEC-2 geometry. The model extents were also lengthened upstream by more than 4 miles ending at the Interstate 684 culvert. Record drawings from the Town of Greenwich and ConnDOT were used for verification of bridge and culvert geometry. 3. Hydraulic Model As part of Task 2.2.b in this project, the HEC-RAS model built by CDM in 2008 was further updated with additional detail based on field survey collected in 2012 and new cross sections added with HEC-GeoRAS using recent LiDAR information collected by USACE in 2012 (Post-Sandy Coastal LiDAR). The Route 1 bridge crossings are a key feature in the project area of interest. Due to inconsistencies in data on the openings for these structures they were surveyed in early Under Task 242a CDM Smith incorporated the conceptual Route 1 bridge replacement plan into the HEC-RAS model and reviewed the effects on existing hydraulic conditions. 3.1 Cross Sections The 250 cross sections in the updated HEC-RAS model are constructed from a variety of data sources summarized in Table 1. Table 1 HEC-RAS Cross Section Data Source Number of Cross Sections Bathymetry in Channel Overbank Elevations Original geometry from 1975 USACE HEC-2 model. Survey conducted in 2007 for CDM Drainage Study Trapezoidal channels added in the 2008 CDM Drainage Study based on thalwag interpolation between surveyed cross sections. Survey conducted in 2012 for this CDM Smith updated analysis. The survey focused on reach between Comly Ave Bridge and Mill Street Bridge Interpolated bathymetry shape and thalwag between surveyed cross sections 2012 LiDAR (ft NAVD88) 2012 LiDAR (ft NAVD88) 2012 LiDAR (ft NAVD88) 2012 LiDAR (ft NAVD88) 2012 LiDAR (ft NAVD88) The overbank elevations for all cross sections were developed with HEC-GeoRAS using the Town of Greenwich 2 ft contours developed from LiDAR collected by USACE in In this way even the historic cross sections from the 1975 USACE used the most recent elevation data for the overbanks. Since the available LiDAR does not have ground elevations below the water surface, the bathymetry of cross sections was taken from the best available source listed in Table 1 and stitched into the overbank elevations. Channel survey transects taken either in 2007 for the CDM Drainage Study or in 2012 for the analysis presented in this Appendix were the basis of 71 cross sections. The original HEC-2 bathymetry was available at 37 cross sections. Appendix B2-3 Draft Feasibility Report & Environmental Impact Statement June 2018 Byram River Basin, CT & NY
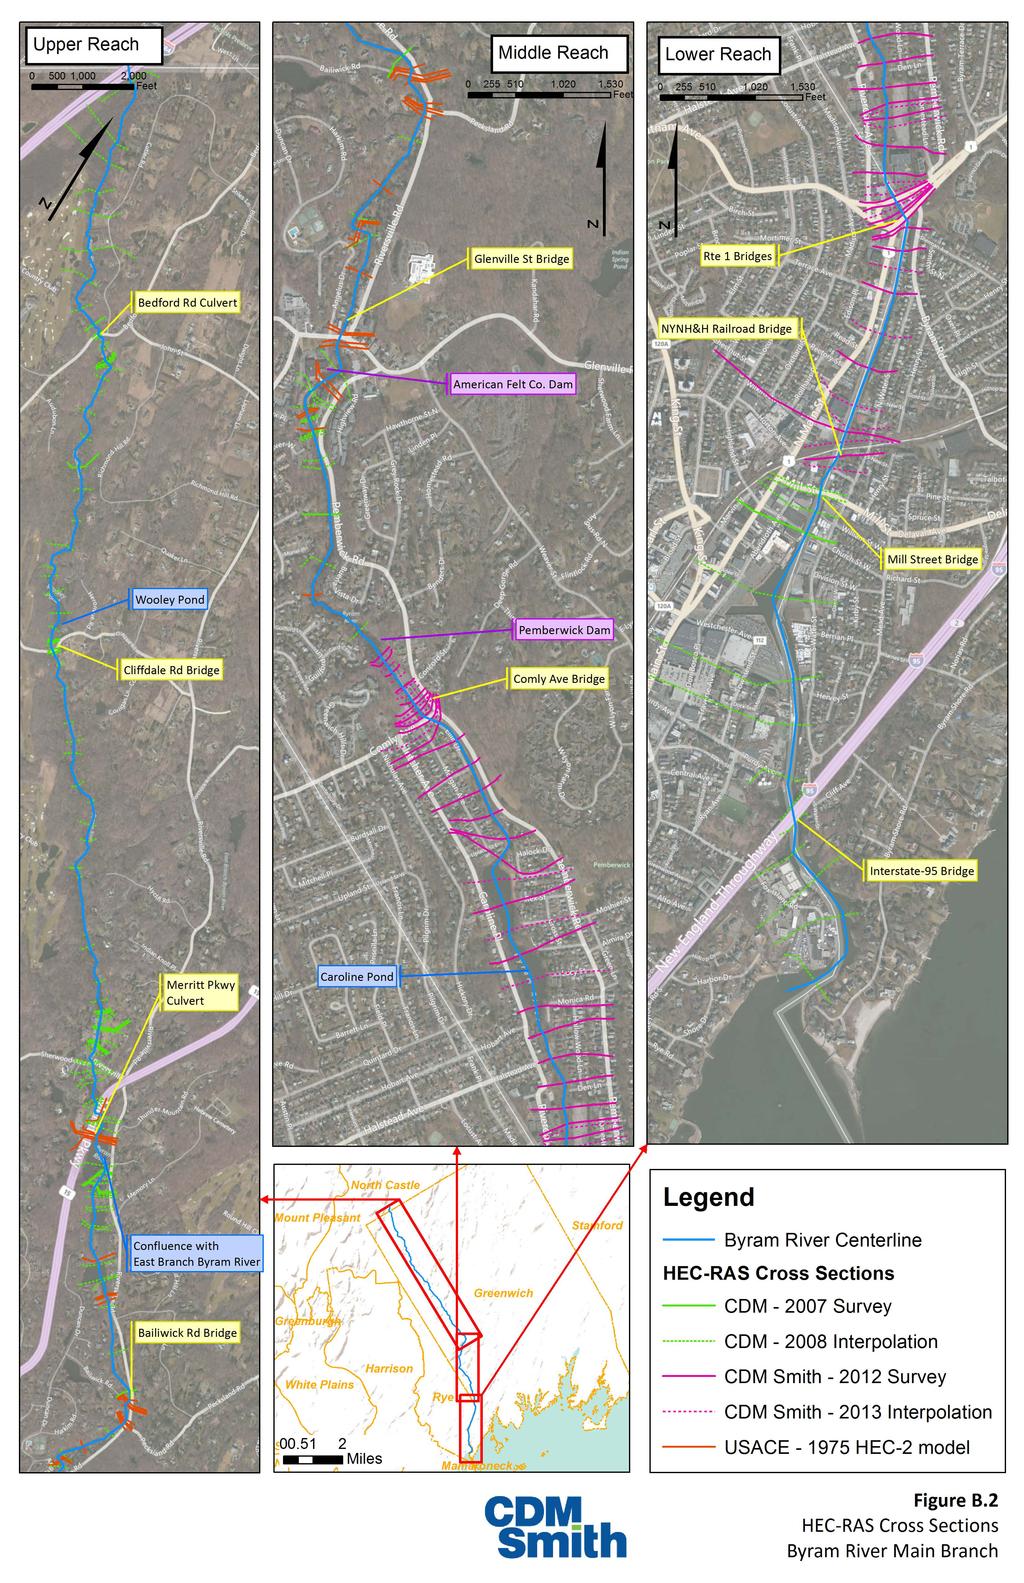
4 For cross sections where survey was not taken the bathymetry was interpolated from upstream and downstream survey or HEC-2 data. Those cross sections created without survey or HEC-2 data during the 2008 CDM Drainage Evaluation are trapezoidal cross sections with a linearly interpolated thalwag. Cross sections interpolated from the 2012 survey between Comly Ave and Mill Street are based on both the thalwag and cross section shape of the upstream and downstream survey transects. Figure 2 shows a map of all cross sections in the updated HEC-RAS model. 3.2 Bridges and Culverts The updated HEC-RAS model includes 22 bridges and culverts which were either added or refined during the 2008 CDM Drainage Evaluation, during which structure geometry was obtained from field survey and record drawings obtained from the Town of Greenwich and ConnDOT and converted to the NAVD88 datum. Table 2 on the following page lists the bridges and culverts in the updated HEC-RAS model. The energy equation was selected for bridge modeling on all low flow computations. For bridges with highly constrained channels where WSEL reaches decking during design storms, high flow computations were performed using Pressure and/or Weir methods. For bridges with larger conveyance openings and higher decking, the energy equation was used. Only the Merritt Parkway crossing was modeled with a HEC-RAS culvert. The three rectangular culverts are approximately 90 feet long. All other bridges were modeled using deck/roadway geometry. Appendix B2-4 Draft Feasibility Report & Environmental Impact Statement June 2018 Byram River Basin, CT & NY
5 Table 2 HEC-RAS Bridges and Culverts River Station (ft) HEC- RAS Node Name Channel Bottom and Low Structure Name and Chord Elevation Location (NAVD88 ft) 46,846.4 BR_30 Bedford Rd Culvert Crown = ft Invert = ft 39,666.6 BR_27 Cliffdale Rd Bridge Low Chord = ft Channel = ft 30,923.6 BR_25 29,836.2 BR_24 Sherwood Ave Culvert Merritt Parkway - Rte 15 29,270.2 BR_23 Abandoned Bridge 28,537.0 BR_22 Footbridge 28,169.9 BR_21 Footbridges 23,650.8 BR_19 Bailiwick Rd Bridge 23,232.1 BR_18 Pecksland Rd Bridge 20,342.8 BR_16 Glenville St Bridge 19,590.1 BR_14 Footbridge 19,252.7 BR_12 Footbridge 19,099.0 BR_11 Utility Line Crossing 15,813.0 BR_09 Footbridge 15,587.8 BR_08 Footbridge 15,401.4 BR_07 Comly Ave Bridge 10,474.1 BR_06 Footbridge 9,444.3 BR_05 W. Putnam Ave SB 9,230.4 BR_04 W. Putnam Ave NB 6,609.8 BR_03 Amtrak RR Bridge 6,082.7 BR_02 Mill St Bridge Crown = ft Invert = ft Crown = ft Invert = ft Low Chord = ft Channel = ft Low Chord = ft Channel = ft Low Chord = ft Channel = ft Low Chord = Channel = ft Low Chord = ft Channel = ft Low Chord = ft Channel = ft Low Chord = ft Channel = ft Low Chord = ft Channel = ft Low Chord = ft Channel = ft Low Chord = ft Channel =28.85 ft Low Chord = ft Channel = ft Low Chord = ft Channel = ft Low Chord = 7.00 ft Channel = 1.66 ft Low Chord = ft Channel = 1.78 ft Low Chord = ft Channel = ft Low Chord = ft Channel = ft Low Chord = 7.00 ft Channel = ft 2,447.5 BR_01 I-95 Overpass Low Chord = 64.2 ft Channel = ft Flow Area (ft²) Opening ~ 90 ft² One arched opening ~ 900 ft² One large opening ~ 170 ft² Box culvert with angled edges ~ 500 ft² Three box culverts 15 W x 11 H ~ 270 ft² One arched opening ~ 200 ft² Small footbridge ~ 240 ft² Three small footbridges ~ 250 ft² One arched opening ~ 310 ft² One opening ~ 575 ft² One arched opening ~ 400 ft² Small footbridge ~ 610 ft² Small opening ~ 500 ft² Small footbridge ~ 310 ft² Small footbridge ~ 450 ft² Small footbridge ~ 525 ft² One opening ~ 140 ft² Small footbridge ~ 500 ft² Double arched opening ~ 560 ft² Double arched opening ~ 1,400 ft² Double arched opening ~ 1,800 ft² Two 4 ft wide piers ~ 25,000 ft² Four 7 ft wide piers Appendix B2-5 Draft Feasibility Report & Environmental Impact Statement June 2018 Byram River Basin, CT & NY
6 3.3 Inline Structures The updated HEC-RAS model includes 9 inline structures which were either added or refined during the 2008 CDM Drainage Evaluation, during which structure geometry was obtained from field survey, and record drawings obtained from the Town of Greenwich and ConnDOT and converted to the NAVD88 datum. Table 3 lists the inline structures in the updated HEC-RAS model. Table 3 HEC-RAS Inline Structures River Station (ft) HEC-RAS Node Name Structure Name CT Dam # Spillway Length (ft) Spillway Elev (ft NAVD88) Height (ft) Hazard Classification 46,220.4 BR_29 Dam near Bedford Rd N/A N/A 39,867.1 BR_28 Wooley Pond Dam BB 31,994.6 BR_26 Wilcox Pond Dam BB 31,369.5 BR_26B Private Dam (Applecrest) N/A N/A 25,919.5 BR_20 Toll Gate Pond Dam A 21,626.0 BR_17 Dam near Angelus Drive BB 19,750.6 BR_15 American Felt Co. Dam C 19,330.5 BR_13 System Pond Dam A 16,211.1 BR_10 Pemberwick Dam C A = Low Hazard BB = Moderate Hazard C = High Hazard In the 2012 survey completed in support of this Appendix, the spillway elevation and length was confirmed for two dams: (1) American Felt Co. Dam 500 feet downstream of the Glenville Street Dam, and (2) Pemberwick Dam, 800 feet upstream of Comly Ave Bridge. 3.4 Ineffective Flow Areas There are three applications of ineffective flow area in the model: (1) the upstream and downstream face of bridge structures, (2) the upstream face of an inline structure, and (3) low-lying portions of a cross section that may create backwater inundation and some storage, but does not convey flow. 3.5 Energy Loss Coefficients Manning s roughness was used for energy loss calculations. In each cross section, roughness coefficients were assigned to the main channel defined by the bank stations selected from cross section geometry and the left and right banks. Manning s roughness coefficients for the main channel of the Byram River ranged from n = 0.03 to n = 0.06 based on field observations of the size of rocks in channel and vegetation, and the associated coefficients described by Chow (1959) and Arcement and Schneider (1989). The overbank Manning s coefficients ranged from n=0.035 to In some reaches, the Manning s coefficients were calibrated slightly to match the observed high-water marks as described in Section 4.0. The 1975 USACE used the same range of roughness coefficients in the effective FEMA FIS study for the main channel, and n=0.035 to n=0.125 for the overbanks (FEMA, 2010). For the majority of channel cross sections, expansion and contraction loss coefficients of K expansion = 0.1 and K contraction = 0.3 were used. Where channel geometry created a rapid expansion or contraction between two Appendix B2-6 Draft Feasibility Report & Environmental Impact Statement June 2018 Byram River Basin, CT & NY
7 cross sections, loss coefficients as high as K expansion = 0.5 and K contraction = 0.7 were used. Upstream of inline structures, loss coefficients as high as K expansion = 0.5 and K contraction = 0.7 were used. For the two cross sections upstream of a bridge and the cross section immediately downstream of a bridge, loss coefficients as high as K expansion = 0.3 and K contraction = 0.5 were used. For some cross sections, the Manning s coefficients were calibrated slightly to match the observed high-water marks as described in Section Boundary Conditions The downstream boundary condition for the Byram River hydraulic model is the stillwater elevation of Long Island Sound coinciding with the peak discharge routed in the main reach. The still water elevation is the project elevation of coastal floodwaters in the absence of waves resulting from wind, and include storm surge associated with hurricanes. The stillwater at the mouth of the Byram river is the boundary condition for the simulation of historic floods and design storm floods. Table 4 shows the stillwater elevation boundary condition used in the HEC-RAS simulations described in this Appendix. Table 4 Observed and Predicted Stillwater Elevation Scenario Stillwater Elevation Source of data (ft NAVD88) Historic Events (Observed) Hurricane Sandy (10/2012) 10.7 Hurricane Irene (8/2011) 9.3 Nor easter of April Flood of June 1972 Flood of September 1975 Peak not recorded Peak not recorded Extrapolated from USACE 30-minute sea level record at the USACE operated Stamford Hurricane Barrier ~ 6 miles up the Long Island Sound coast. Data obtained at the USACE Remote Sensing GIS Research Group website. Extrapolation based on relative stillwater elevations in the effective FIS (FEMA, 2010) Flood of October Design Storm Events (Predicted) 50% Flood Stillwater 6.9 Interpolated (log) from effective stillwater 20% Flood Stillwater 7.9 Interpolated (log) from effective stillwater 10% Flood Stillwater 8.7 Effective stillwater (FEMA, 2010) 4% Flood Stillwater 9.7 Interpolated (log) from effective stillwater 2% Flood Stillwater 10.4 Effective stillwater (FEMA, 2010) 1% Flood Stillwater 11.2 Effective stillwater (FEMA, 2010) 0.5% Flood Stillwater 12.0 Interpolated (log) from effective stillwater 0.2% Flood Stillwater 13.0 Effective stillwater (FEMA, 2010) HEC-RAS Downstream Boundary Condition Downstream Boundary Condition % Flood Stillwater For the historic calibration and validation events estimates of the observed stillwater elevations at the mouth of the Byram River were used. The observed record of stillwater peaks at the USACE operated Stamford Hurricane Barrier was obtained from the USACE Remote Sensing GIS Research Group website. The Stamford Hurricane Barrier is approximately 6 miles up the Long Island Coast from the mouth of the Byram River. In the effective FEMA FIS (FEMA, 2010), stillwater elevations are given for the 1-percent annual chance at both the Stamford Hurricane Barrier (11.4 ft NGVD29 at transects 11-14) and the mouth of the Byram River (12.2 ft NGVD29 transects 1-6). This relative difference (+0.8 ft) was used to estimate the Appendix B2-7 Draft Feasibility Report & Environmental Impact Statement June 2018 Byram River Basin, CT & NY
8 historic stillwater elevation at the mouth of the Byram River from the observed stillwater at the Stamford Hurricane Barrier. The design storm stillwater elevations are based on the effective FEMA FIS (FEMA, 2010) at the mouth of the Byram River (transect 1). For those design intervals that are not reported in the FIS including the 50-, 20-, 4-, and 0.5-percent flood interval, a logarithmic interpolation was used to estimate the stillwater. The design storm downstream boundary condition used for all of the return intervals is the 2-year return interval (6.9 ft. NAVD88). Extreme flood conditions which are generally on the Byram River have not shown to coincide with the most extreme stillwater elevation. In the 1977 Feasibility Report for Flood Control (USACE, 1977), the U.S. Army Corps of Engineers assumed a downstream boundary condition of 7 ft MSL (5.9 ft. NAVD88) for the 1-percent design flood. 3.7 Route 1 Bridge Replacement Hydraulic Model To analyze the effect of the Route 1 bridge replacement on the current flood conditions, a new HEC-RAS model was developed to reflect a proposed condition geometry. Route 1, also known as Putnam Avenue, traverses Byram River as two separate bridges for northbound and southbound traffic. In the existing condition, both the north and south Route 1 bridges experience overtopping in the 2-percent flood event according to the HEC-RAS model. Since the bridges carry highway traffic, it is necessary to replace them after they are removed to reduce flooding. The bridge replacements will be in the same location as the original bridges but with a higher roadway profile. The north and south bridge will have lengths of 82 feet and 93 feet, respectively. Each bridge will have a total depth of 4.5 feet which includes a 6-inch deck, 9-inch cross slope, and 3.25-foot beam depth. Barrier walls, matching the existing barrier wall height, will be incorporated on both sides of each bridge for pedestrian and vehicular safety. The low chord of the proposed north bridge replacement is approximately feet and the low chord of the south bridge is feet. The Route 1 bridge replacements will not experience overtopping until the 0.2-percent flood event, based on the six simulated events within the HEC-RAS model. Figure 3 provides the flood profile for the existing condition flows at the proposed Route 1 bridge for all simulated events. As reflected in Table 5, on the following page, the Route 1 bridge replacements will significantly reduce peak stages in the vicinity of the bridges. There are negligible increases on the downstream side of the bridge as a result of the proposed bridges. All stage comparisons are with respect to vertical datum NAVD88 and are based on the existing condition flows. Figure 4 displays the below information in a water surface profile. Appendix B2-8 Draft Feasibility Report & Environmental Impact Statement June 2018 Byram River Basin, CT & NY
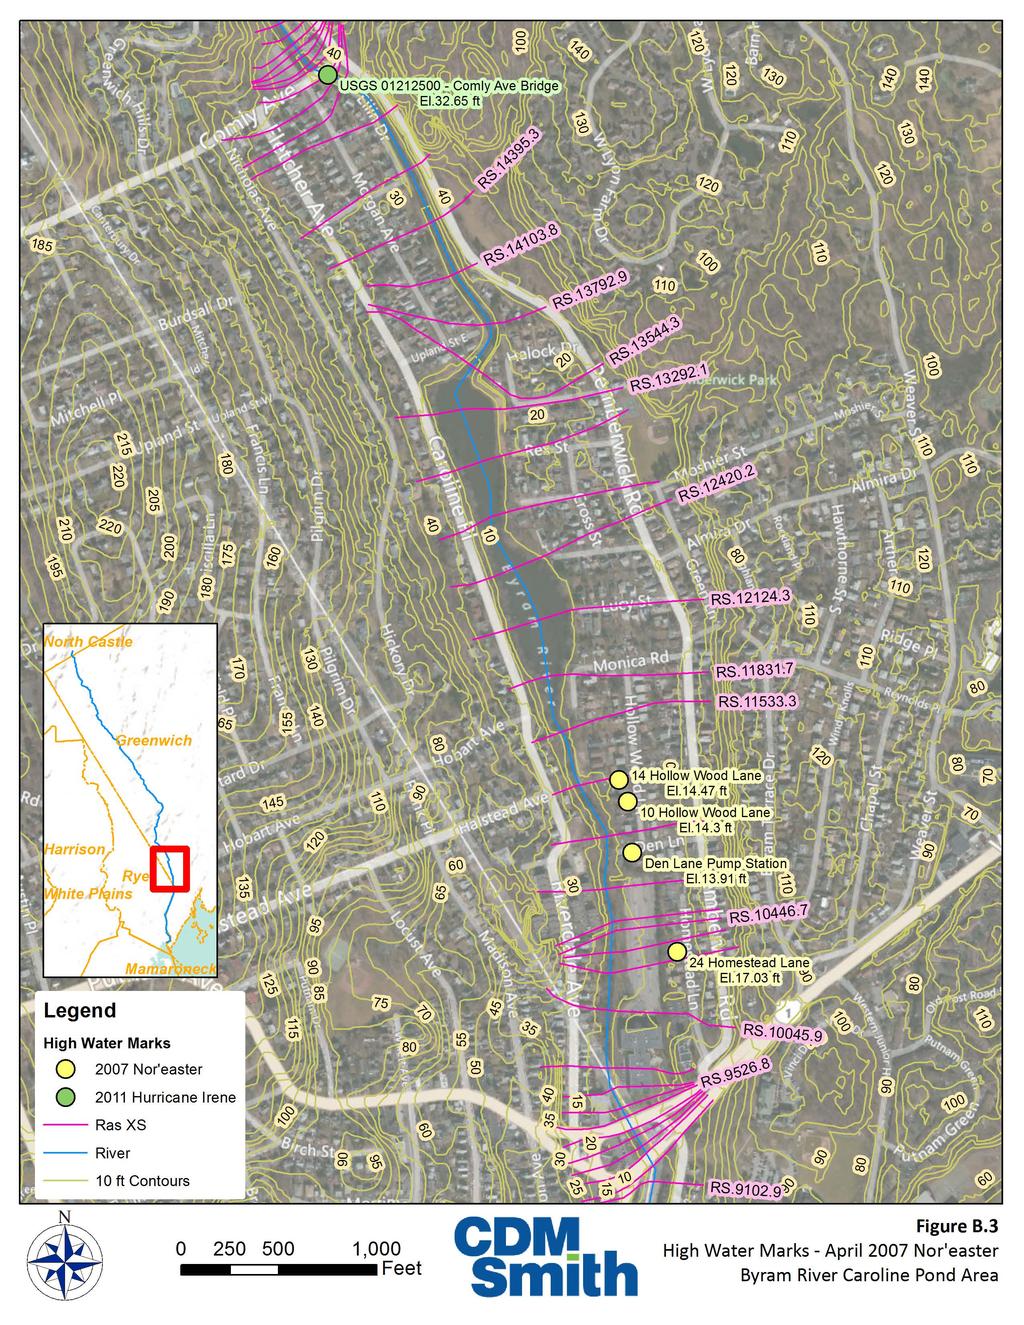
9 Table 5 Existing vs Proposed Stages at Route 1 Bridge Location HEC- RAS Cross section Existing Condition Stage (ft) Proposed Condition Stage (ft) 50% Flood 2% Flood 1% Flood 50% Flood 2% Flood 1% Flood Upstream of North bridge Upstream of North bridge Immediately upstream of North Bridge North Bridge ** ** - - * In between bridges In between bridges In between bridges In between bridges In between bridges South Bridge ** ** Immediately downstream of South Bridge Downstream of South bridge *Indicates stage at or above low chord but no bridge overtopping **Indicates bridge overtopping 4. Model Calibration, Validation, and Uncertainty Analysis High water marks were available for three historic flood events, and two were used to calibrate and validate the HEC-RAS model. Several of the reported high-water marks are questionable and appear to be unreasonable in that they yield wildly inconsistent rating curves. These high-water marks may have been incorrectly recorded and/or result from an error in the reference elevation. Each of these questionable highwater marks are described in detail and were not used to calibrate the hydraulics of the model. In addition to calibration and validation efforts, an uncertainty analysis of stages at the Route 1 proposed bridges was conducted in accordance with Section 5-5 of USACE EM April 2007 Flood (Nor easter) The April 2007 Nor easter caused major flooding along the banks of the Byram River. Milone and MacBroom collected high water marks at 5 locations listed in Table 6. The first 4 high water marks were collected in the neighborhood adjacent to Caroline Pond as shown in the map in Figure 5. There is one additional high-water mark recorded just upstream of the American Felt Co. Dam at Glenville Street as shown in Figure 6. The HEC-RAS simulation of the 2007 Nor easter flooding shows that only 2 of the 12 major crossings were overtopped during the peak discharge. The major crossings do not include privately owned footbridges, an abandoned stone archway, and a utility crossing, many of which were overtopped during the 2007 event. The two major bridges shown to have overtopped in the simulation of the 2007 flood are, the Sherwood Ave Appendix B2-9 Draft Feasibility Report & Environmental Impact Statement June 2018 Byram River Basin, CT & NY
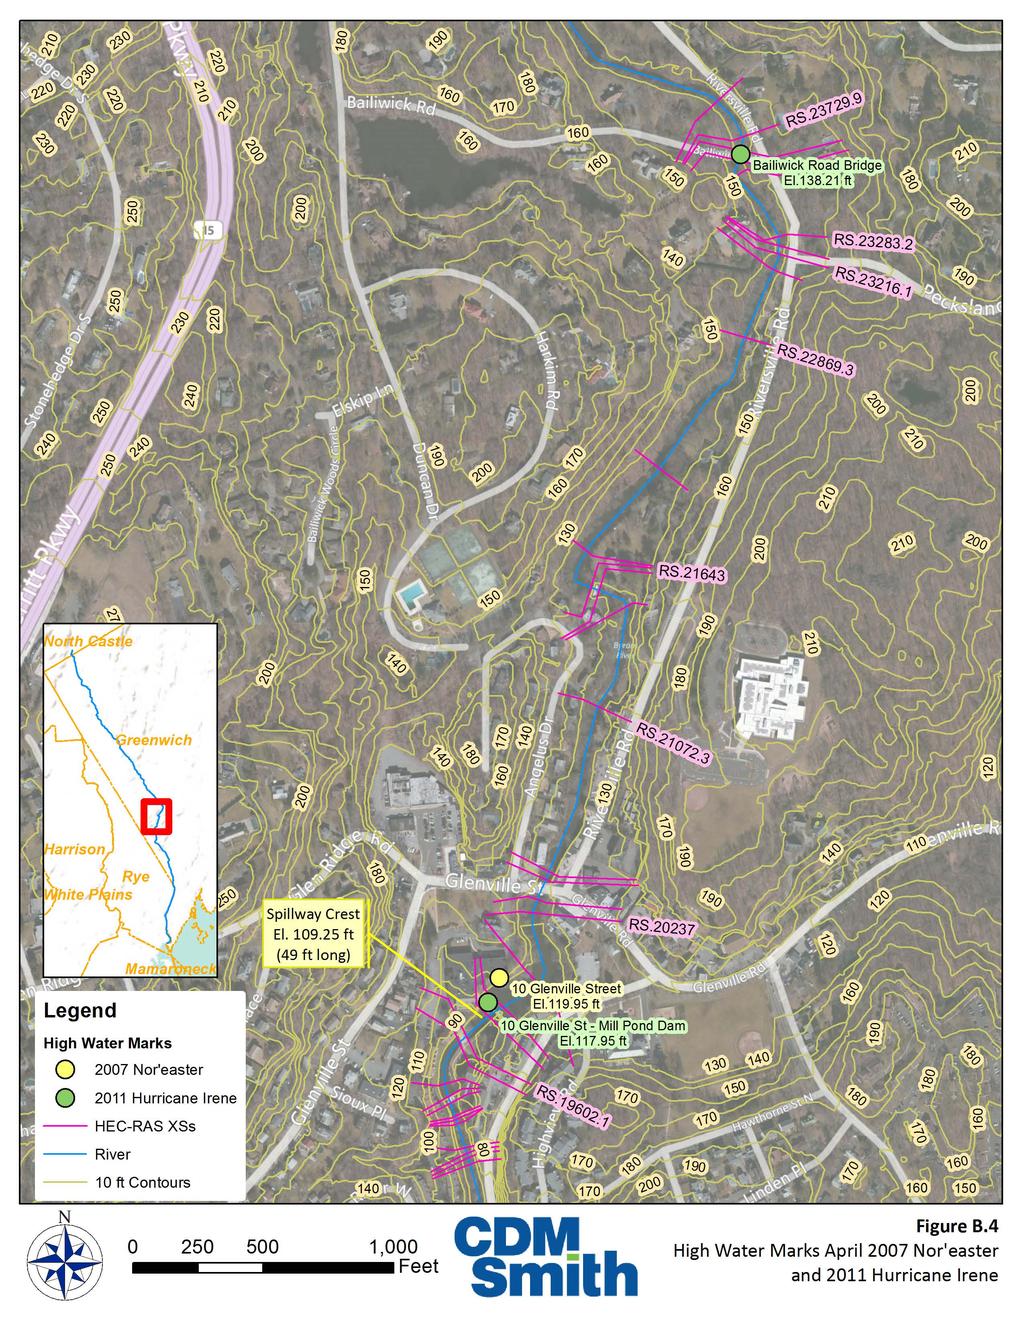
10 Culvert and the Bailiwick Road bridge. The backwater elevation from the observed storm surge (El. 7.9 ft NAVD88) extended upstream as far as the Mill Street Bridge. Table 6 High Water Marks from April 2007 Flood on Byram River Location Greenwich, CT No. Description of Flood Mark Address Homestead Lane Den Lane Pump Station 10 Hollow Wood Lane 14 Hollow Wood Lane 10 Glenville Street Flood mark is below siding on white wall, measuring down from siding distance of 1 ¼ siding boards for flood mark. Flood mark is middle bar on chain link fence at front left side of fence behind utility pole. Flood Mark is top of bottom panel in white garage door located to left of concrete staircase. Flood Mark is on 3rd garage door from back of buildingmiddle of 2nd panel (from bottom) of garage door, just above door handle. Flood Mark is on rear wall of brick building near entrance door at ground level. Yellow keel mark is at mortar joint at bottom of 7th brick below ledge of window (with screen), between window and downspout. Reference Light green house with white trim. Mark was on left side of house (adjacent to driveway) Small yellow building with dark trim; w/chain link fence enclosure 2-Fam. Dwelling- Photo provided is at garage door on left side of building. 2 story building (Yellow siding w/green shutters)- bldg. is on left side of driveway Yellow keel mark on building between window and downspout. Flood Elevation (ft NAVD88) Computed Elevation (ft NAVD88) Approximate HEC-RAS Station (ft) Note El El ,290 Suspect El El ,840 Used El El ,250 Used El El ,130 Used El El ,850 Suspect The simulated 2007 Flood profile in the vicinity of the recorded high-water marks at Locations 1 through 4 is shown in Figure 7. Observed water surface elevations at Locations 2, 3, and 4 are close to the simulated water surface with a difference of ft, ft, and ft respectively. Although Location 1 is about 600 ft downstream of the other observed high-water marks with no significant hydraulic structures or changes in channel geometry, the recorded elevation there is more than 3 ft higher than those recorded upstream. The simulated water surface elevation is 3 ft lower. This high-water mark was not considered in model validation. The simulated 2007 Flood profile in the vicinity of the American Felt Co. Dam is shown in Figure 8 along with the 2007 high water mark at Location 5. High water mark observations from 2011 Hurricane Irene, which are described in Section 4.2, are also shown. The high-water mark recorded for the 2007 flood (El feet) is more than 10 feet higher than the 49-foot-long spillway crest (El feet), which was surveyed in 2012 as mentioned in Section 3.3. The high-water mark at Location 5 is also more than 3 feet above the simulated water surface elevation upstream of the dam (El feet) for the peak discharge simulated at the dam (3,180 cfs). Assuming the geometry from the 2012 survey is correct, including the embankments (El feet), it would take a discharge of 13,000 cfs equivalent to twice the estimated 0.2- percent flood to create such a water surface elevation directly upstream of the dam. The rating curve for the American Felt Co. Dam spillway used in the effective FIS is similar to that in in this study (FEMA, 2010). The effective 0.2-percent flood discharge is 8,780 cfs resulting in an upstream water surface of at cross section-g, one foot lower than the observed high-water mark at more than twice the discharge rate. This study assumes that the elevation associated with the Location 5 high water mark does not represent the 2007 peak flood profile. Appendix B2-10 Draft Feasibility Report & Environmental Impact Statement June 2018 Byram River Basin, CT & NY
11 4.2 Hurricane Irene (August 2011) In August 2011 Hurricane Irene caused major flooding along the banks of the Byram River. Milone and MacBroom collected high water marks at 2 locations listed in Table 7. Table 7 High Water Marks from Hurricane Irene (2011) on Byram River Location Greenwich, CT No. Description of Flood Mark Address 6 7 USGS 10 Glenville Flood Mark is on top of the Street American dam structure behind brick Felt Co. Dam office building. Bailiwick Road Bridge Comly Ave Bridge Flood Mark is the bottom of the bridge railing on North side of bridge, located at the 3rd post from the stone wall on West side. Depth records at USGS gage on Byram River at Pemberwick, CT (USGS ) Reference See photos of top of dam structure behind 2-story brick office building. See bridge photo- flood mark is where debris is piled up on upstream side of bridge. Datum = ft NAVD88 from 2012 survey and field measurements of depth gage Flood Elevation (ft NAVD88) Computed Elevation (ft NAVD88) Approximate HEC-RAS Station (ft) Note ,750 Suspect ,660 Suspect ,358 Used Figure 8 shows the simulated 2011 Flood profile along with the two high water marks recorded during the same event. The high-water mark at Location 6 recorded for the 2011 flood (El feet) at the American Felt Co. Dam is more than 8 feet higher than the 49-foot-long spillway crest (El feet), surveyed in Assuming the geometry from the survey is accurate, including the embankments (El ), this corresponds to a discharge of approximately 8,000 cfs, more than twice the estimated discharge from the hydrologic analysis for this event (2,940 cfs), and greater than the estimated 0.2-percent flood discharge at this location. The rating curve for the American Felt Co. Dam spillway used in the effective FIS is similar to that in in this study (FEMA, 2010). While the high-water mark is very close to the effective 1-percent flood elevation just upstream of the dam (El at cross section G), the associated discharge from the FEMA study (5,850 cfs) is more than twice the estimated peak discharge during Hurricane Irene. Additionally, the exact location of the flood mark for Location 6 is unclear. The surveyor recorded the elevation on top of the [embankment] structure approximately 3.7 feet higher than the top of the embankment. If the high-water mark was reported from debris observed on the railing, it is possible that this represents wave action or debris pushed up higher than the actual water surface elevation. This study assumes that the elevation with Location 6 does not represent the 2011 peak flood profile. The high-water mark at Location 7 recorded for the 2011 flood (El ) upstream of the Bailiwick Road Bridge is more than 5 feet above the top deck of the Bailiwick Road Bridge where it was taken where debris [was] piled up on [the] upstream side of bridge. The bridge deck and elevations of the approaching roadway are based on 2-foot contours from the Town of Greenwich and checked against bridge inspection reports and field measurements. This study assumes that the elevation with Location 7 does not represent the 2011 peak flood profile. The calibration also made use of the depth observations recorded at the USGS gage on the Byram River at Pemberwick (USGS ) at the Comly Ave bridge. The gage was operational at the time of Hurricane Irene. The peak water surface elevation (El ft NAVD88) is shown in Table 7. Appendix B2-11 Draft Feasibility Report & Environmental Impact Statement June 2018 Byram River Basin, CT & NY
12 The datum listed for USGS gage in the official USGS record (El. 40 NAVD88) is a very rough estimate based on the general area topography. For the purposes of estimating a high-water mark elevation a more accurate datum was required. The survey collected in fall 2012 for the model cross sections included survey of the Comly Ave bridge. The Town of Greenwich took field measurements of the USGS depth gage relative to features of the bridge on August 15, From the survey of the top of the west bank wing-wall (El ft NAVD88), the bottom of the USGS depth gage was reported to be El ft NAVD88. Using this refined datum, the peak water surface elevation from Hurricane Irene was calculated. 4.3 Stage Uncertainty Analysis The following approaches were taken to adjust specific input parameters, as described in USACE EM , to a low and high range. Adjustments are with respect to the Route 1 bridge replacement HEC-RAS geometry. Parameters were adjusted both independently and altogether to determined combined effects of an all low or all high scenario. Manning s roughness: For each cross section, roughness coefficients were adjusted to represent either the low or high end of the acceptable range of values by cover characteristic described by Chow (1959). Contraction and Expansion Coefficients o o Low Parameters: Cross sections outside of bridge transitions were revised to have K expansion = 0.0 and K contraction = 0.0. Cross sections within bridge transitions were adjusted to have K expansion = 0.3 and K contraction = 0.1. High Parameters: Cross sections outside of bridge transitions were left as-is (typically K expansion = 0.3 and K contraction = 0.1). Cross sections within bridge transitions were adjusted to have K expansion = 0.8 and K contraction = 0.6. Boundary Conditions: A boundary condition representing the 100-percent stillwater (6.1 ft) was chosen for a low scenario and the boundary condition representing the 20-percent stillwater (7.9 ft) was used for the high scenario. In reviewing the independent effects of the low and high roughness coefficients, contraction and expansion coefficients, and boundary conditions, it was determined that the boundary condition adjustments had the least effect on the stages at Route 1. Adjusting the Manning s coefficients to the low end of the range had the greatest effect on lowering the stages while adjusting the expansion and contraction ratios to a higher parameter had the greatest effect on increasing the stages. Under the combined scenario of all high parameters and all low parameters, the analysis shows a stage uncertainty a range of up to 3.94 feet for the 1-percent flood event. Though, even the high parameter input model does not result in either the north or south proposed Route 1 bridge overtopping. Therefore, it is believed that the design is conservative and will adequately convey the 1-percent flood without causing roadway inundation. Results have been tabulated in Table 8 with respect to the 1-percent flood stages. Figure 9 displays the below information in a flood profile. All stage comparisons are with respect to vertical datum NAVD88 and are based on the existing condition flows. Table 8 Stages at Route 1 Bridge due to Stage Uncertainty Analysis Appendix B2-12 Draft Feasibility Report & Environmental Impact Statement June 2018 Byram River Basin, CT & NY
13 Location HEC- RAS Cross section 1-Percent Flood Stage (ft), Route 1 Bridge Replacement Proposed Model Low Parameters High Parameters Upstream of North bridge Upstream of North bridge Immediately upstream of North Bridge North Bridge * - * In between bridges In between bridges In between bridges In between bridges In between bridges South Bridge * Immediately downstream of South Bridge Downstream of South bridge *Indicates stage at or above low chord but no bridge overtopping 4.4 Summary The HEC-RAS model is based on the best available LiDAR and field survey. The focus of model calibration was the recent 2007 and 2011 storm events. Where there appear to be differences between the modeled profile and observed high water marks, sensitivity analysis of the profile and inconsistencies in the observed data may shed doubt on the quality of the high-water marks. The model is well-calibrated (+/- 0.5 feet) to the high-water marks that are consistent with the 2012 structure and cross section survey, as well as with each other. The uncertainty analysis was performed to determine effects of adjusting input parameters within the HEC- RAS model to be at the low and high end of an acceptable range. The model showed most sensitivity to roughness coefficients and expansion and contraction coefficients. All stages within the vicinity of the Route 1 proposed bridge for the high were below the low edge of pavement for the 1-percent flood event and thus the profile elevation of the conceptual design is adequate. The standard deviation for the computed stage uncertainty was determined to be approximately 0.47 feet. This was determined using the sensitivity and professional judgment methodology detailed in EM , section 5-7. This standard deviation was lower than the appropriate values in Table 5-2 (EM ) hence should be used, with a normal distribution for reaches associated with the proposed bridge design for the economic analysis. Appendix B2-13 Draft Feasibility Report & Environmental Impact Statement June 2018 Byram River Basin, CT & NY
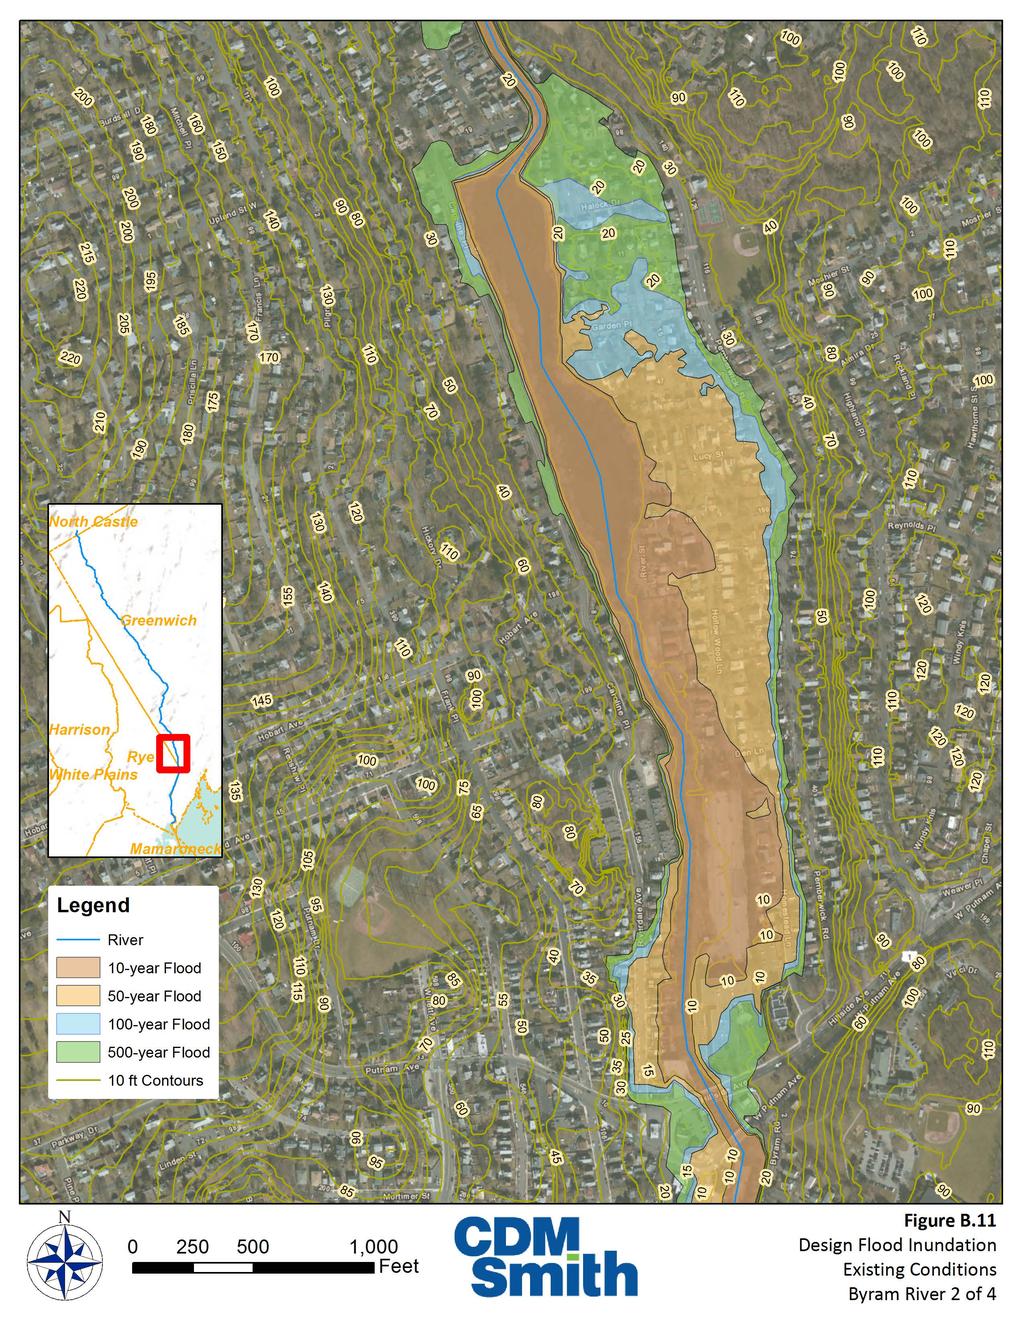
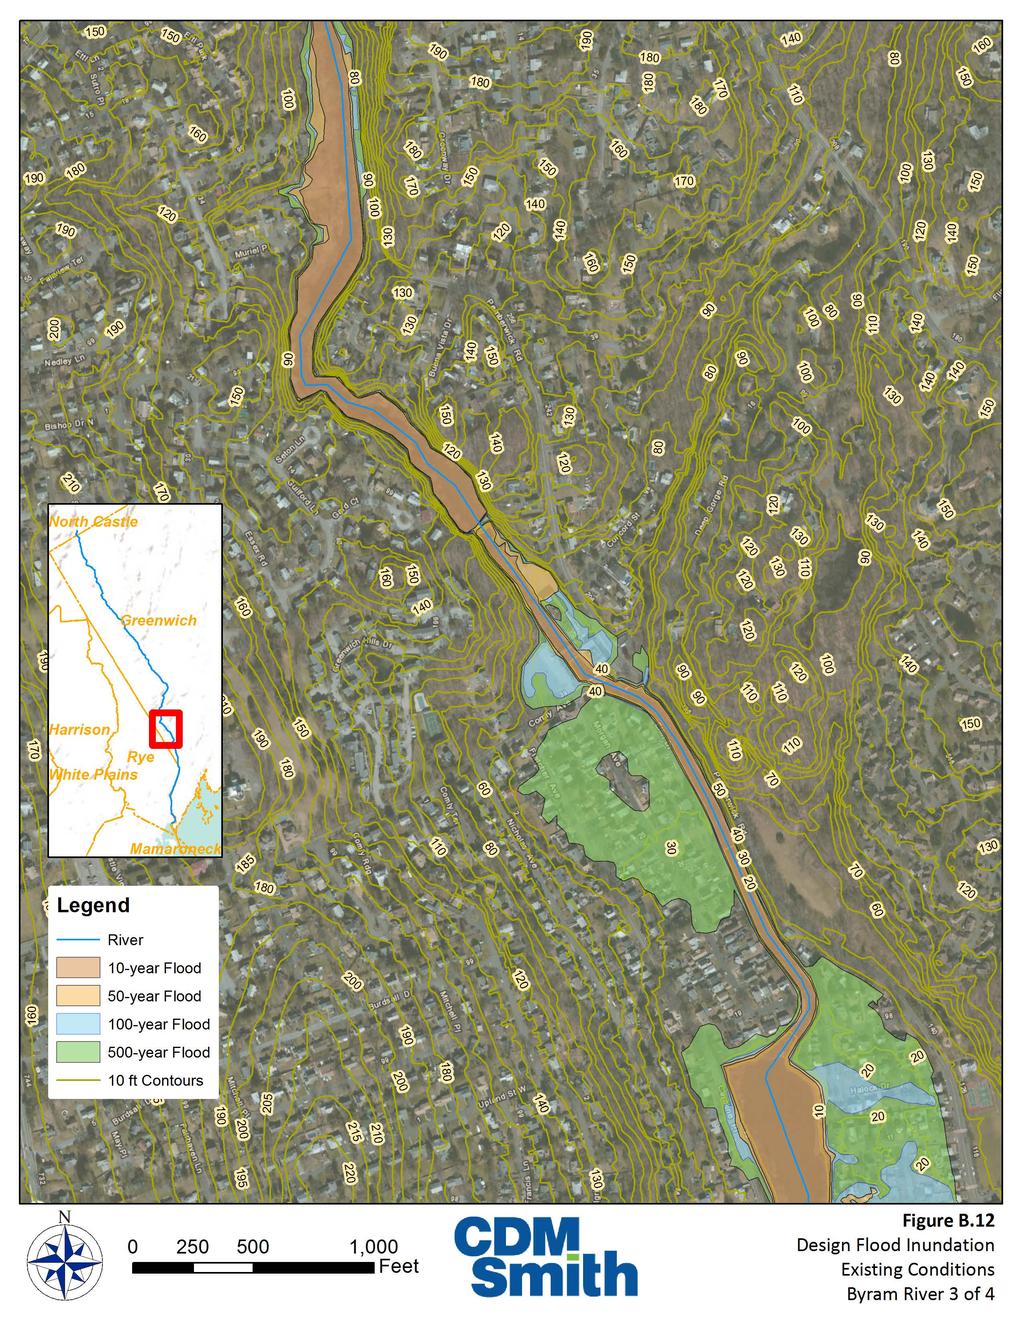
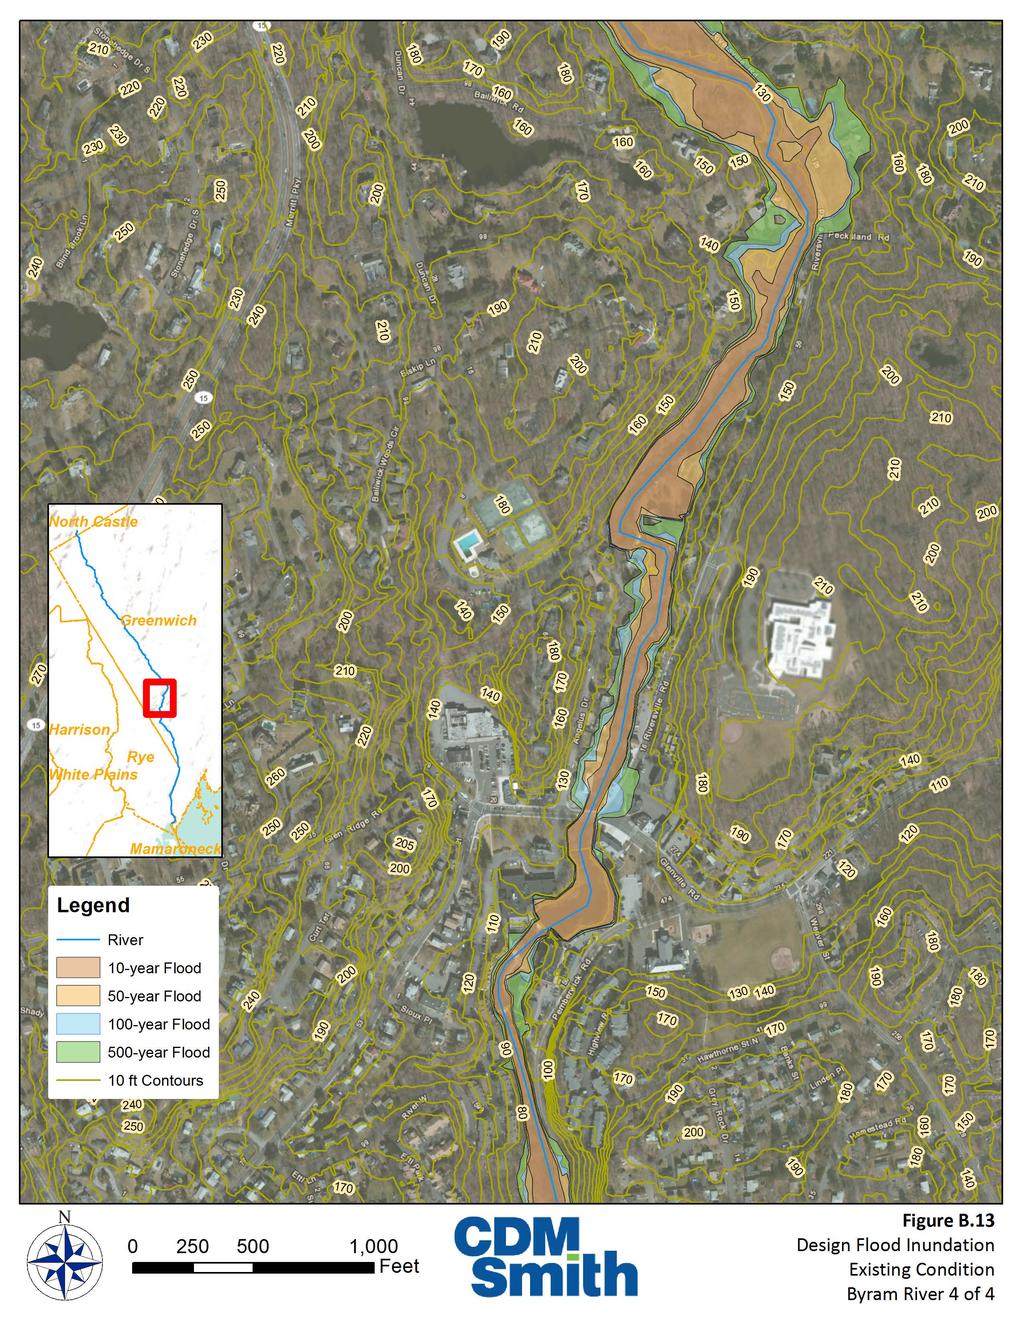
14 5. Design Storm Simulations The refined and validated HEC-RAS model was used to simulate design floods. The steady flow regime representing the peak discharge for each design condition is described in Section 7.0 of Appendix B1 Hydrology. The downstream boundary conditions are discussed in Section 3.6 of this appendix. 5.1 Peak Flow Profiles Figures 10 through 12 show the water surface profiles for the existing conditions 10-, 2-, 1-, and 0.2-percent design floods along the entire extents of the HEC-RAS model of the Byram River from Long Island Sound to the I-684 crossing near the corporate limits of the Town of Greenwich. Table 9 shows water surface Table 9 Flood Elevations (Existing Conditions) Selected Area of Interest Cross Sections Location Long Island Sound (50-percent flood stillwater) HEC-RAS Station (ft) Peak Water Surface Elevations (ft NAVD88) 50% Flood 10% Flood 4% Flood 2% Flood 1% Flood 0.2% Flood U/S of Amtrak RR Bridge 6, D/S of Northbound Rte. 1 Bridge 9, U/S of Southbound Rte. 1 Bridge 9, Caroline Pond 11, U/S of Comely Ave Bridge 15, Flood Inundation Maps Figures 13 through 16 show the peak flood inundation on the Byram River for the existing conditions 10-, 2-, 1-, and 0.2-percent design floods from the Mill Street Bridge to the Bailiwick Road Bridge. 6. Climate and Sea Level Rise Analyses Under Task 242b, CDM Smith has provided a qualitative assessment with respect to climate trends and quantitatively established the effects of sea level rise under a low, medium, and high rate of rise. The effects of these two phenomena will be discussed with respect to the project area and more specifically at the Route 1 bridges. 6.1 Climate Trend Analysis The limits of the Byram River fall just within USACE Region 02, New York District. Byram River is located at the border between the states of New York and Connecticut closest to the cities of Greenwich, CT and Port Chester, NY. This area is characterized by relatively cold winters with average lows in the low 20 s and warm summers with average highs in the low 80 s. Precipitation is generally continuous throughout the year with the area annually receiving about 49 inches. While rainfall is continuous, winter and spring tends to have higher rates, while fall has the lowest. Humidity peaks during summer and into early fall. In accordance with USACE ECB Guidance for Incorporating Climate Change Impacts to Inland Hydrology in Civil Works Studies, Designs and Projects, CDM Smith has performed a qualitative analysis to determine whether any climate trends may exist within the Byram River study area. Trend climates with reviewed with respect to temperature, precipitation, and streamflow. Increases in temperature may stimulate processes such as snowmelt and precipitation trends may affect both the frequency and intensity of rainfall Appendix B2-14 Draft Feasibility Report & Environmental Impact Statement June 2018 Byram River Basin, CT & NY
15 events. A review of streamflow trends is pertinent to determine whether the latter two trends could have a direct correlation on flows and stages experienced within the Byram River. A review of the Recent Climate Change and Hydrology Literature Applicable to USACE, Mid-Atlantic Region 02 (USACE, 2015) report indicates generally increasing trends in annual temperature and precipitation but a lack of trends regarding streamflow. USACE, 2015 discusses 13 studies with respect to temperature trends. Although some researchers agree that the southern portion of the Mid-Atlantic region is within the warming hole where cooling trends are found during cooler months rather than warming trends, most data points towards an increase in extreme heat days and annual temperatures. This is also characterized by earlier onset of Spring and fewer extreme cold days with statistically significant (p < 0.05) recorded rates of annual temperature increases of around degrees Celsius per year. 18 studies were included within USACE, 2015 with respect to precipitation trending. There is generally good consensus that precipitation and the occurrence of extreme storms has increased in the study region over the past century. This is also joined by a decrease in the occurrence of droughts and increase in soil moisture. Cook et al., 2010 found a statistically significant (p < 0.05) trend of increasing precipitation for September through November, with an overall precipitation increase of nearly 1 millimeter per year. According to three studies discussed within USACE, 2015, no statistically significantly data points towards a trend in streamflow in either direction. Results discussed suggest that the balance between increasing temperatures and increasing precipitation simultaneously may contribute to the lack of streamflow sensitivity to changes in climate. NOAA Technical Report NESDIS 142-1, Regional Climate Trends and Scenarios for the U.S. National Climate Assessment, Northeast U.S. (NOAA, 2013) analyzed spring center of volume date which represents the date at which half of the total river flow volume over the period of January through May passes a point. Trending of an earlier spring center of volume date could indicate an overall higher baseflow of the stream and/or an increase in the frequency of high flow events. A study done by Hodgkins et al analyzed 27 unregulated streams in the New England area, all of which have been experiencing earlier spring center of volume dates. Though, trends on the three rivers analyzed within Connecticut are less substantial than rivers further north in the New England region. This could be due to the more significant presence of snowmelt in the northern rivers. As outlined in USACE ECB , the USACE Climate Assessment Tool was used to review historic trends of streamflow in the Byram River project area. This tool requires use of active gages with at least 30 years of data only. The only gage on Byram River, USGS Gage Byram River at Pemberwick, CT, does not meet this criteria as it was installed in The nearest active stream gage with at least 30 years of data is USGS Gage Norwalk River at South Wilton, CT, approximately 16 miles northeast of Route 1 over Byram River. USGS Gage has a period of record of 1962 to present. Figure 17 shows the time series graph of annual peak streamflow for this gage. As exhibited on the graph, there is a slight declining trend in annual peak streamflow though the p-value indicates this is not statistically significant. Typically, a p-value less than 0.05 demonstrates a statistically significant trend which is far below the p-value of exhibited at USGS Gage The removal and replacement of the Route 1 bridges will substantially decrease stages within the vicinity of Route 1. Regardless of potential future climate changes, there will still be a net improvement in implementation of the proposed design. Though, based on the lack of correlation in climate trends climate change is expected to have none or minimal impacts on inland hydrology. Appendix B2-15 Draft Feasibility Report & Environmental Impact Statement June 2018 Byram River Basin, CT & NY
16 A table of the studies reviewed for the qualitative analysis and their outcomes is provided in Table Sea Level Rise Analysis In accordance with USACE ER , Incorporating Sea Level Change in Civil Works Programs, CDM Smith has appended the HEC-RAS model to include adjustments to the downstream tailwater condition of the Byram River outlet under three rates of sea level change (SLC). The three rates of sea level change are referred to as low, intermediate, and high scenarios. The historic rate of SLR represents the low rate and does not account for future acceleration of SLC. The intermediate rate of SLC is estimated using the modified NRC Curve I and is corrected for the local rate of vertical land movement. The high rate of SLR is estimated using the modified NRC Curve III and is also corrected for the local rate of vertical land movement. Locally experienced SLC is higher in areas where vertical land movement is downward, or sinking. These scenarios were analyzed within the USACE Sea Level Change Calculator, an online tool which provides a net change in sea level based on input of a project time, SLC rate, and NOAA gage. For purposes of the evaluation of impacts of SLC at the Route 1 bridge replacements, an estimated project life of 2100 was used. This assumes the bridges will be constructed by 2025 and will have a 75-year design life. The nearest gage to the Byram River outlet is at Kings Point, New York and was selected for input in the sea level change calculator. The SLC Rate used was the regionally corrected one, with an estimated rise of ft/yr. Results of the SLC indicated an expected rise of 0.84 feet, 1.88 feet, and 5.16 feet for the low, intermediate, and high scenario, respectively, by The boundary condition of the Byram River outlet was increased by these values within HEC-RAS to simulate potential future conditions of the Byram River. The output was specifically reviewed within the vicinity of the Route 1 bridge replacements to determine whether sea level rise will impact existing flood behavior at Route 1 over the lifetime of the proposed north and south bridge. The analysis indicates the Route 1 bridges are close enough to the Byram River outlet that tailwater fluctuations will influence water elevations. 1-percent flood stages in the vicinity of Route 1 increase between 1.48 and 1.76 feet under the SLC low scenario. The high scenario demonstrates stage increases up to 2.58 feet higher. Under both a no SLR condition and low SLC scenario, the Route 1 bridge replacements will not experience overtopping until the 0.2-percent flood event. In both the intermediate and high SLC scenario, the north proposed bridge will experience overtopping in the 0.5-percent flood event but the south bridge will not experience overtopping until the 0.2-percent flood event. Results have been tabulated in Table 11 with respect to the 1-percent flood stages. Figure 18 displays the below information in a flood profile. All stage comparisons are with respect to vertical datum NAVD88 and are based on the existing condition flows. Appendix B2-16 Draft Feasibility Report & Environmental Impact Statement June 2018 Byram River Basin, CT & NY
17 Table 11 Stages at Route 1 Bridge due to Sea Level Rise Location HEC- RAS Cross section 1-Percent Flood Stage (ft), Route 1 Bridge Replacement No SLR Low Scenario Intermediate Scenario High Scenario Upstream of North bridge Upstream of North bridge Immediately upstream of North Bridge North Bridge * * * * In between bridges In between bridges In between bridges In between bridges In between bridges South Bridge * * * Immediately downstream of South Bridge Downstream of South bridge *Indicates stage at or above low chord but no bridge overtopping 7. Sediment Transport Analysis The Byram River sediment transport analysis focused on the review of available watershed information plus review of HEC-RAS simulation results. Watershed information included a characterization of the watershed conveyance network and limited sampling data. The HEC-RAS analysis included review of velocities in the vicinity of the bridge improvements, with and without the improvements, to assess the potential for impacts. 7.1 Byram River Watershed Conveyance Network According to the Byram River Watershed Management Plan (Steven Danzer Ph.D & Associates LLC, September 2011), there are over 40 dams in the Byram River watershed conveyance network, creating impoundments of various sizes. As a result, there are a number of locations at which stream velocity is slow and sediment accumulation will occur. As a result, the sediment loads to the location of the proposed bridge improvements and the downstream portion of the river are limited under current conditions. Limited sediment monitoring data are presented in the Final Report on Byram River Watershed Model Development (Earth and Environmental Engineering Department, Columbia University, NY, NY, January 2012) for the Byram River. Sampling station BR8 in this report is located near the Putnam Avenue/Route 1 bridges that are proposed for modification. During 6 sampling events, which include 3 dry weather sampling events and three events taken with prior 24-hour rainfall of 0.5 to 2.9 inches, the measured settleable solids ranged from <0.1 to 0.4 ml/l. It is not obvious how these measurements in units of ml/l would relate to a suspended solids concentration in mg/l, Wastewater Engineering: Treatment/Disposal/Reuse (Metcalf and Eddy, 1979) tabulates typical values of settelable solids in ml/l and total suspended solids in mg/l for wastewater, and the ratio is approximately Appendix B2-17 Draft Feasibility Report & Environmental Impact Statement June 2018 Byram River Basin, CT & NY
18 20. Therefore, a settleable solids range of <0.1 to 0.4 ml/l is expected to correspond to a TSS range of < 2 to 8 mg/l. These values confirm that sediment transport in the watershed at the location of the bridge improvements is limited. Consequently, the evaluation of sediment transport will focus on the expected change in velocity in the vicinity of the proposed bridge improvements. 7.2 HEC-RAS Model Results for Proposed Bridge Improvements To evaluate the potential impacts of the proposed bridge improvements on sediment transport, the HEC- RAS model results for current conditions with and without the bridge improvements were evaluated. The model impacts include the following considerations: Model was evaluated for the 100-percent and 50-percent design storms. Typically, potential erosion impacts include the evaluations of less extreme design storms (e.g., the 100-percent and 50-percent storms). Model was evaluated for the mean high water (MHW) and mean low water (MLW) tailwater conditions. This represents a more typical range of tailwater conditions, in contrast to the high tailwater condition that is the basis for evaluating potential flooding impacts. The impacts on velocities were evaluated upstream of the bridges, between the bridges, and downstream of the bridges. The upstream evaluation considered model results from the upstream bridge to the next upstream crossing (footbridge at station ), and the downstream evaluation considered model results from the downstream bridge to the next downstream crossing (Amtrak Railroad Bridge at station ). Beyond that downstream point, any impacts of the bridge improvements will be minimal. The model results are presented in Table 12 on the following page. In general, the results show that the proposed improvements will results in a slight increase in velocity above the improved bridges and between the improved bridges, with no impact below the improved bridges. The small velocity increases are unlikely to have an adverse impact on sediment delivery to the tidal area downstream of the improved bridges. Table 12 HEC-RAS Velocity Results with and without Bridge Improvements. Design Current Bridge - Velocity (ft/s) Proposed Bridge - Velocity (ft/s) Location Storm Base MLW MHW Base MLW MHW Above bridges Between bridges 1-year Below bridges Above bridges Between bridges 2-year Below bridges Base Tailwater = 6.90 feet NAVD; MLW Tailwater = feet NAVD; MHW Tailwater = 3.40 feet NAVD 7.3 Summary of Results Review of existing watershed information indicates that there is limited sediment delivery to the proposed bridge improvement location, because of multiple dams in the watershed conveyance network. Comparison of modeled HEC-RAS velocities with and without the bridge improvements indicate little or no velocity increase would be expected. Consequently, the bridge improvements are expected to have no potential impacts to sediment delivery to the Byram River tidal area. Appendix B2-18 Draft Feasibility Report & Environmental Impact Statement June 2018 Byram River Basin, CT & NY
19 8. Summary The hydraulic simulation presented in this Appendix represents the best available information to date on the Byram River, with detailed cross sections of the bathymetry and structures in the area of interest, and a highwater mark calibration to a gaged event (Hurricane Irene, 2011) and the estimated discharge associated with a recent 20-year event (April 2007). In the 1977 Feasibility Report for Flood Control (USACE, 1977), USACE estimated that the 1-percent storm peak design flow in the vicinity of the Caroline Pond was approximately 6,920 cfs resulting in a flood elevation of 21.7 ft NAVD88. By comparison, in the updated analysis for the same reach the 1-percent storm design flow of 6,690 cfs (presented in Appendix B1) resulting in a flood elevation of 19.5 ft NAVD88. The updated 2013 analysis demonstrates design conditions which are slightly lower than those presented in the 1977 Feasibility Report. In this way the updated analysis shows that the improvements proposed in the 1977 Feasibility Report may be slightly conservative for the return interval of interest. The removal of the Route 1 bridges and their relocation at a higher profile show significant benefits at Route 1. The overtopping frequency of Route 1 is anticipated to decrease from a 2-percent event to almost a 0.2- percent event with implementation of the conceptual design. With respect to climate change, a review of temperature, precipitation, and streamflow data indicate climate change will likely have none or minimal impacts on inland hydrology for this project. Appendix B2-19 Draft Feasibility Report & Environmental Impact Statement June 2018 Byram River Basin, CT & NY
20 7. References Arcement, G.J., and Scheider, V.R. (1989) Guide for Selecting Manning s Roughness Coefficients for Natural Channels and Flood Plains. U. S. Geological Survey Water Supply Paper CDM (2008) Town of Greenwich, CT Byram River Drainage Evaluation Report September, 2008 Chow, V.T. (1959) Open-channel hydraulics McGraw-Hill Book Co., New York, Federal Emergency Management Agency (2010) Flood Insurance Study for Fairfield County Connecticut Study Number 25017CV001A 09001CV001A. Effective: June, 18, National Oceanic and Atmospheric Administration (2013) Regional Climate Trends and Scenarios for the U.S. Climate Assessment: Part 1. Climate of the Northeast U.S. Technical Report NESDIS 142-1, National Oceanic and Atmospheric Administration, January 2013 U.S. Army Corps of Engineers (1964) Flood Plain Information, Byram River, Greenwich CT., Summary Report US Army Engineer Division, New England Corps of Engineers, Waltham, MA. November, U.S. Army Corps of Engineers (1977) Feasibility Report for Flood Control Mamaroneck and Sheldrake Rivers Basin, New York and Byram River Basin, Connecticut Main Report, Volume 1, U.S. Army Corp of Engineers, October U.S. Army Corps of Engineers (1977) Feasibility Report for Flood Control Mamaroneck and Sheldrake Rivers Basin, New York and Byram River Basin, Connecticut Appendices, Volume 2, U.S. Army Corp of Engineers, October U.S. Army Corps of Engineers (2015) Recent U.S. Climate Change and Hydrology Literature Applicable to U.S. Army Corps of Engineers Missions Mid-Atlantic Region 02, U.S. Army Corp of Engineers, May Appendix B2-20 Draft Feasibility Report & Environmental Impact Statement June 2018 Byram River Basin, CT & NY
21 Appendix B2 Hydraulics Figures and Tables
22 Table X Summary of Studies Reviewed for Climate Trend Analysis Study Period of Record Anandhi et al., Catskills, southern NY Location Bonnin et al, Ohio river and most of Mid-Atlantic Region Study Results Statistical Significance Study Results Statistical Significance Study Results Statistical Significance Increasing trends in annual average daily min temps (up to 0.5C per decade) Corresponding decreasing trends in number of frost days (7 days per decade) Temperature Precipitation Streamflow Increasing trends in occurrence of large storm events p<0.05 Mixed trend for NY vs Penn., Early record = increasing stat significant number summer high heat days Latter record = exhibits primarily decreasing trends/no trend p<0.05 Not Significant Not Discussed Increasing trends in number of annual extreme wet days since 1950 Prior to 1950 there are a few decreasing trends p<0.05 Brown et al., New York and Pennsylvania Burns et al., Catskills, Southern NY Carter et al., 2014 Chen et a, Virginia Cook et al, Virginia Early part of 20th century until recent (at Southeast region time of (includes southern portions of Mid Atlantic publishing,2015) region) Decrease in number of cold spells in recent records increasing trends in mean air temperature for majority of climate stations in Catskills Average rate of increase 0.1 C per decade Mild warmings of average annual temperatures in early part 20th century Then a few decades of cooling trends Most recently there have been warming trends Increasing trends in minimum, maximum, and mean annual temperature of 0.01 C to 0.02 C per year Increasing trends in occurrence of extreme heat days Decreasing trends occurrence of extreme cold trends p<0.05 Seasonal trends for decreasing winter and summer monthly precipitation p<0.05 Not Provided p<0.05 Slightly increasing Significant trend in 12 and 6month SPI averaged over the entire study region = Not Provided higher precipitation rates and decreased drought risk Decrease in drought frequency (droughts per century over last 1000 years) General increase in soil moisture as defined by PDSI p<0.05 over same period p<0.05 Increasing trends for three month autumn (Sept- Nov) precipitation p<0.05 Delta = 1mm/ yr Not Significant p<0.05 Cook et al., Southern NY Grundstein Northern portion of Mid Atlantic Grundstein and Dowd, Mid-Atlantic Region Hodgins et al early 1900s to 2000 Connecticut, New Hampshire, Vermont, Maine No evidence of the warming hole increasing trends in number of one-day extreme minimum temperatures throughout region, No significant trends for extreme max Horton et al., Northeast Region 2 F increase in average annual temperature Huntington et al., 2009 Unknown New York State 1 F-3 F increase in average annual temperature Kalra et al, Mid-Atlantic Region Kunkel et al, ? Northeast Region Maxwell et al, (May only) Mid-Atlantic Region McRoberts and Nielsen-Gammon, Mid-Atlantic Region Not Significant Not Provided Not Provided Increasing trends in soil moisture Increasing trends in total annual precipitation 10% increase in average annual precipitation between Increase in amount of precipitation from extreme heavy events Extreme snowfall not increasing Increasing trends in occurrence of extreme low snowfall years Increased variability with disproportionate number of extreme wet and extreme dry periods for past 100 years compared to previous centuries increasing trend in May precipitation for Linear positive trends in annual precipitation for most of US Mildly increasing trends 2-10% per century p<0.05 Not Provided p<0.05 Not Provided On average over past 30 years, spring center of volume date occurs two weeks earlier No trends in either annual or seasonal streamflow Not Provided Not Significant
23 Table X Summary of Studies Reviewed for Climate Trend Analysis Study Period of Record Location Temperature Precipitation Streamflow Study Results Statistical Significance Study Results Statistical Significance Study Results Statistical Significance Warming hole Last 50 years there has been a decreasing trend (-1 C) in the warming hole In Dec-Feb WH covers entire mid Atlantic Not Provided In summer WH covers southern half of mid Atlantic Meehl et al., Eastern US Nguyen and DeGaetano, Northeast Region Palecki et al., Mid-Atlantic Region Patterson et al, Virginia/Maryland In summer the northern half mid-atlantic has an increasing trend (+1 C) the last 50 years Increasing trends in frequency and magnitude of high precipitation events characterized by closed low precipitation No trends found for storm magnitude, duration, or intensity for any season Only 1 of 15 stations exhibited statistically significant increasing trends Most others exhibited increasing trends but not General increasing total annual precipitation and days of precipitation p<0.05 Not Significant 1 station Statistically Significant other stations overall increasing trend Significant decreasing trends in streamflow for Virginia small number of stations had Significant decreasing trends Entire POR No Significant trends detected p<0.05 Not significant Mixed results for trends in extreme high precipitation events ( 90th percentile) p<0.1 Pryor et al 2009 Mid-Atlantic Region More stations exhibit significant decreasing trend for intensity Schwartz et al., 2013 POR through 2010 Mid-Atlantic Region Small et all., Mid-Atlantic Region Wang and Zhang 2008 Mid-Atlantic Region Spring onsets a few days earlier in Not Provided compared to (baseline reference decade) Warmer winter and spring Increasing trends in fall precipitation for some regional locations (none for others) No trends for total annual precipitation Significant changes for period compared to 1949 to % frequency increase p<0.05 for some regions Not Significant for others Not Provided No trends in annual flow for any of multiple stations in mid Atlantic, Small number had for increasing trends in fall low flow Not Significant Wang et al., Mid-Atlantic Region Winter, Spring, Summer: Warming ( up to 1 C), Autumn: Cooling (<1 C) Not Provided Positive trends precipitation for summer, fall, and spring Negative trends for winter precipitation Not Provided Differences in trend rates between first and second half of 20th century 0.01 C increase over entire 20th cent per year; p<0.05 Warrach et al., th century Single Station in Southern NY Rate of increase in 1st half much higher than 2nd half Westby et al., Mid-Atlantic Region General winter cooling trend Not Significant Xu et al Mid-Atlantic Region No trends in either annual Not Significant streamflow or baseflow for any Mid-Atlantic stations Legend General consensus of increasing trend Decreasing Trends No observed trends Split trends
24
25 Figure 2
26 ByramRiver Mainstem Legend WS 1yr ExCond 30 WS 2yr ExCond WS 5yr ExCond WS 10yr ExCond WS 25yr ExCond WS 50yr ExCond 20 WS 100yr ExCond WS 200yr ExCond Elevation NAVD88 (ft) 10 WS 500yr ExCond Ground Main Channel Distance (ft)
27 ByramRiver Mainstem Legend WS 2yr Existing Conditions WS 50yr Existing Conditions WS 100yr Existing Conditions WS 2yr Rte 1 Bridge Replace 20 WS 50yr Rte 1 Bridge Replace WS 100yr Rte 1 Bridge Replace Ground Elevation NAVD88 (ft) Main Channel Distance (ft)
28
29
30 Figure B. - Flood of 2011 Profile with High Water Marks Legend WS 2007 Flood 25 Ground OWS 2007 Flood Elevation NAVD88 (ft) W. Putnam Ave NB W. Putnam Ave SB Footbridge Main Channel Distance (ft)
31 Figure B. - Floods of 2007 and 2011 Profiles with High Water Marks Main Channel Distance (ft) Legend WS 2011 Flood WS 2007 Flood Ground OWS 2007 Flood OWS 2011 Flood Elevation NAVD88 (ft) Utility Line Crossing Footbridge Dam near Souix Place Footbridge American Felt Dam FEMA XS - G Glenville St Bridge FEMA XS - H Dam near Angelus Drive FEMA XS - I Pecksland Rd Bridge Bailiwick Rd Bridge
32 ByramRiver Mainstem Legend WS 100yr ExCond - High WS 100yr ExCond - Low Ground 20 Elevation NAVD88 (ft) Main Channel Distance (ft)
33 Figure B.7 - Design Flood Profiles Main Channel Distance (ft) Legend WS 1yr ExCond WS 2yr ExCond WS 5yr ExCond WS 10yr ExCond WS 25yr ExCond WS 50yr ExCond WS 100yr ExCond WS 200yr ExCond WS 500yr ExCond Ground OWS 100yr ExCond Elevation NAVD88 (ft) I-95 Overpass Mill St Bridge Amtrak RR Bridge W. Putnam Ave NB - Updated Footbridge Comly Ave Bridge Footbridge Pemberwick Dam
34 Figure B.8 - Design Flood Profiles Main Channel Distance (ft) Legend WS 1yr ExCond WS 2yr ExCond WS 5yr ExCond WS 10yr ExCond WS 25yr ExCond WS 50yr ExCond WS 100yr ExCond WS 200yr ExCond WS 500yr ExCond Ground OWS 100yr ExCond Elevation NAVD88 (ft) Pemberwick Dam Utility Line Crossing Footbridge FEMA XS - G FEMA XS - H Dam near Angelus Drive FEMA XS - I Pecksland Rd Bridge Bailiwick Rd Bridge FEMA XS - J FEMA XS - K Footbridges Footbridge FEMA XS-L Confluence with East Branch Sherwood Ave Culvert Private Dam (Applecrest) Wilcox Pond Dam
35 Figure B.9 - Design Flood Profiles Legend WS 1yr ExCond WS 2yr ExCond 350 WS 5yr ExCond WS 10yr ExCond WS 25yr ExCond WS 50yr ExCond WS 100yr ExCond WS 200yr ExCond 300 WS 500yr ExCond Ground OWS 100yr ExCond Elevation NAVD88 (ft) Wilcox Pond Dam Cliffdale Rd Bridge Dam near Bedford Rd Bedford Rd Culvert Main Channel Distance (ft)

36 Legend River 10% Flood 2% Flood 1% Flood 0.2% Flood N ,000 Feet Figure 13 Design Flood Inundation Existing Conditions Byram River 1 of 4
37
38
39

40 1)ChooseaHUC ConnecticutCoastal 2)ClickMapLocationorNametoSelectStream Gage SearchforGagewithinHUC-4byName Al 3)IncludeOnlyYears(IfDesired) 1757to2017 SiteNumber ASPETUCKRIVERATASPETUCK,CT BYRAM RIVERATPEMBERWICK EASTBRANCHHOUSATONICRIVERATCOLTSVILLE,MA FENTONRIVERATMANSFIELD,CT FIVEMILERIVERNEARNEW CANAAN,CT. FRENCHRATNGROSVENORDALE,CT. GREENRIVERNEARGREATBARRINGTON,MA HOUSATONICRIVERATFALLSVILLAGE,CT. AnnualPeakInstantaneousStreamflow,NORWALKRATSOUTHWILTON,CT.Selected (HoverOverTrendLineForSignificance(p)Value) ClimateHydrologyAssessmentToolv.1.0 Analysis:3/26/20189:12AM 12K 10K Streamflow(CFS) 8K 6K 4K ---NOGAGESELECTEDORDATAUNAVAILABLE--- Selectnew gagefrom listormapabove todisplaytrendchart Thep-valueisforthe linearregressionfitdrawn;a smalerp-valuewould indicategreaterstatistical significance.thereisno recommendedthresholdfor statisticalsignificance, buttypicaly0.05isusedas thisisassociatedwitha5% riskofatypeierororfalse positive. 2K 0K WaterYear
UPPER COSUMNES RIVER FLOOD MAPPING
 UPPER COSUMNES RIVER FLOOD MAPPING DRAFT BASIC DATA NARRATIVE FLOOD INSURANCE STUDY SACRAMENTO COUTY, CALIFORNIA Community No. 060262 November 2008 Prepared By: CIVIL ENGINEERING SOLUTIONS, INC. 1325 Howe
LOMR SUBMITTAL LOWER NEHALEM RIVER TILLAMOOK COUNTY, OREGON
 LOMR SUBMITTAL LOWER NEHALEM RIVER TILLAMOOK COUNTY, OREGON Prepared for: TILLAMOOK COUNTY DEPARTMENT OF COMMUNITY DEVELOPMENT 1510-B THIRD STREET TILLAMOOK, OR 97141 Prepared by: 10300 SW GREENBURG ROAD,
YELLOWSTONE RIVER FLOOD STUDY REPORT TEXT
 YELLOWSTONE RIVER FLOOD STUDY REPORT TEXT TECHNICAL REPORT Prepared for: City of Livingston 411 East Callender Livingston, MT 59047 Prepared by: Clear Creek Hydrology, Inc. 1627 West Main Street, #294
INFLOW DESIGN FLOOD CONTROL SYSTEM PLAN 40 C.F.R. PART PLANT YATES ASH POND 2 (AP-2) GEORGIA POWER COMPANY
 GEORGIA POWER COMPANY") INFLOW DESIGN FLOOD CONTROL SYSTEM PLAN 40 C.F.R. PART 257.82 PLANT YATES ASH POND 2 (AP-2) GEORGIA POWER COMPANY EPA s Disposal of Coal Combustion Residuals from Electric Utilities Final Rule (40 C.F.R.
INFLOW DESIGN FLOOD CONTROL SYSTEM PLAN 40 C.F.R. PART 257.82 PLANT YATES ASH POND 2 (AP-2) GEORGIA POWER COMPANY EPA s Disposal of Coal Combustion Residuals from Electric Utilities Final Rule (40 C.F.R.
PENNSYLVANIA DEPARTMENT OF TRANSPORTATION ENGINEERING DISTRICT 3-0
 PENNSYLVANIA DEPARTMENT OF TRANSPORTATION ENGINEERING DISTRICT 3-0 LYCOMING COUNTY S.R.15, SECTION C41 FINAL HYDROLOGIC AND HYDRAULIC REPORT STEAM VALLEY RUN STREAM RELOCATION DATE: June, 2006 REVISED:
LOMR SUBMITTAL LOWER NESTUCCA RIVER TILLAMOOK COUNTY, OREGON
 LOMR SUBMITTAL LOWER NESTUCCA RIVER TILLAMOOK COUNTY, OREGON Prepared for: TILLAMOOK COUNTY DEPARTMENT OF COMMUNITY DEVELOPMENT 1510-B THIRD STREET TILLAMOOK, OR 97141 Prepared by: 10300 SW GREENBURG ROAD,
Section 4: Model Development and Application
 Section 4: Model Development and Application The hydrologic model for the Wissahickon Act 167 study was built using GIS layers of land use, hydrologic soil groups, terrain and orthophotography. Within
Appendix E Guidance for Shallow Flooding Analyses and Mapping
 Appendix E Guidance for Shallow Flooding Analyses and Mapping E.1 Introduction Different types of shallow flooding commonly occur throughout the United States. Types of flows that result in shallow flooding
New Jersey Department of Transportation Extreme Weather Asset Management Pilot Study
 New Jersey Department of Transportation Extreme Weather Asset Management Pilot Study Overview Prepared for: June 26, 2018 Introduction Overview of Pilot Study New Jersey s Climate New Jersey s Transportation
Pequabuck River Flooding Study and Flood Mitigation Plan The City of Bristol and Towns of Plainville and Plymouth, CT
 Pequabuck River Flooding Study and Flood Mitigation Plan The City of Bristol and Towns of Plainville and Plymouth, CT Raymond Rogozinski and Maged Aboelata The City of Bristol and Towns of Plainville and
L OWER N OOKSACK R IVER P ROJECT: A LTERNATIVES A NALYSIS A PPENDIX A: H YDRAULIC M ODELING. PREPARED BY: LandC, etc, LLC
 L OWER N OOKSACK R IVER P ROJECT: A LTERNATIVES A NALYSIS A PPENDIX A: H YDRAULIC M ODELING PREPARED BY: LandC, etc, LLC TABLE OF CONTENTS 1 Introduction... 1 2 Methods... 1 2.1 Hydraulic Model... 1 2.2
The last three sections of the main body of this report consist of:
 Threatened and Endangered Species Geological Hazards Floodplains Cultural Resources Hazardous Materials A Cost Analysis section that provides comparative conceptual-level costs follows the Environmental
Mapping of Future Coastal Hazards. for Southern California. January 7th, David Revell, Ph.D. E.
 Mapping of Future Coastal Hazards for Southern California January 7th, 2014 David Revell, Ph.D. drevell@esassoc.com E. Vandebroek, 2012 Outline Coastal erosion hazard zones Flood hazard zones: Coastal
Chapter 5 CALIBRATION AND VERIFICATION
 Chapter 5 CALIBRATION AND VERIFICATION This chapter contains the calibration procedure and data used for the LSC existing conditions model. The goal of the calibration effort was to develop a hydraulic
JOURNAL OF ENVIRONMENTAL HYDROLOGY The Electronic Journal of the International Association for Environmental Hydrology VOLUME
 JOURNAL OF ENVIRONMENTAL HYDROLOGY The Electronic Journal of the International Association for Environmental Hydrology VOLUME 18 2010 REDUCED CHANNEL CONVEYANCE ON THE WICHITA RIVER AT WICHITA FALLS, TEXAS,
Climate. Annual Temperature (Last 30 Years) January Temperature. July Temperature. Average Precipitation (Last 30 Years)
 January Temperature. July Temperature. Average Precipitation (Last 30 Years)") Climate Annual Temperature (Last 30 Years) Average Annual High Temp. (F)70, (C)21 Average Annual Low Temp. (F)43, (C)6 January Temperature Average January High Temp. (F)48, (C)9 Average January Low Temp.
Climate Annual Temperature (Last 30 Years) Average Annual High Temp. (F)70, (C)21 Average Annual Low Temp. (F)43, (C)6 January Temperature Average January High Temp. (F)48, (C)9 Average January Low Temp.
THE NEED FOR AN ADDITIONAL SPILLWAY AT THE SANFORD DAM BOILING SPRING LAKES, NC. Presentation for The Brunswick County Commissioners April 20, 2015
 THE NEED FOR AN ADDITIONAL SPILLWAY AT THE SANFORD DAM BOILING SPRING LAKES, NC Presentation for The Brunswick County Commissioners April 20, 2015 The Sanford Dam Earth Dam constructed in 1961 Drainage
9. PROBABLE MAXIMUM PRECIPITATION AND PROBABLE MAXIMUM FLOOD
 9. PROBABLE MAXIMUM PRECIPITATION AND PROBABLE MAXIMUM FLOOD 9.1. Introduction Due to the size of Watana Dam and the economic importance of the Project to the Railbelt, the Probable Maximum Flood (PMF)
PRELIMINARY DRAFT FOR DISCUSSION PURPOSES
 Memorandum To: David Thompson From: John Haapala CC: Dan McDonald Bob Montgomery Date: February 24, 2003 File #: 1003551 Re: Lake Wenatchee Historic Water Levels, Operation Model, and Flood Operation This
USGS Flood Inundation Mapping of the Suncook River in Chichester, Epsom, Pembroke and Allenstown, New Hampshire
 USGS Flood Inundation Mapping of the Suncook River in Chichester, Epsom, Pembroke and Allenstown, New Hampshire NH Water & Watershed Conference Robert Flynn, USGS NH-VT Water Science Center March 23, 2012
COASTAL DATA APPLICATION
 2015 Coastal GeoTools Proactive By Design. Our Company Commitment COASTAL DATA APPLICATION Projecting Future Coastal Flood Risk for Massachusetts Bay Bin Wang, Tianyi Liu, Daniel Stapleton & Michael Mobile
 Red River Flooding June 2015 Caddo and Bossier Parishes Presented by: Flood Technical Committee Where the Rain Falls Matters I-30 versus I-20 I-20 Backwater and Tributary Floods (Localized) 2016 Flood
PRELIMINARY CULVERT ANALYSIS REPORT FOR CULVERT NO. 008-C OREGON AVENUE OVER PINEHURST CREEK
 PRELIMINARY CULVERT ANALYSIS REPORT FOR CULVERT NO. 008-C OREGON AVENUE OVER PINEHURST CREEK Prepared for The District of Columbia Department of Transportation Washington, D.C. Prepared by Parsons Transportation
Background and Purpose of Meeting. River Towers Meeting. Flood Risk Management Study Alternatives Overview
 1 and Purpose of Meeting River Towers Meeting Flood Risk Management Study Alternatives Overview September 23, 2014 There is no "proposed" flood risk management solution for this area at this time Fairfax
Red River Levee Panel
 Red River Levee Panel Mississippi River Commission Monday, August 9, 2017 Red River Levees in LA & AR NONE along TX & OK Boarder Red River Levee Issues Caddo Levee Cherokee Park Authorization Bossier Levee
Great Lakes Update. Volume 199: 2017 Annual Summary. Background
 Great Lakes Update Volume 199: 2017 Annual Summary Background The U.S. Army Corps of Engineers (USACE) tracks and forecasts the water levels of each of the Great Lakes. This report is primarily focused
5.2 IDENTIFICATION OF HAZARDS OF CONCERN
 5.2 IDENTIFICATION OF HAZARDS OF CONCERN 2015 HMP Update Changes The 2010 HMP hazard identification was presented in Section 6. For the 2015 HMP update, the hazard identification is presented in subsection
Great Lakes Update. Volume 194: 2015 Annual Summary
 Great Lakes Update Volume 194: 2015 Annual Summary Background The U.S. Army Corps of Engineers (USACE) tracks and forecasts the water levels of each of the Great Lakes. This report summarizes the hydrologic
IDENTIFICATION OF HAZARDS OF CONCERN
 IDENTIFICATION OF HAZARDS OF CONCERN To provide a strong foundation for mitigation strategies considered in Section 6, the Village considered a full range of hazards that could impact the area and then
Local Flood Hazards. Click here for Real-time River Information
 Local Flood Hazards Floods of the White River and Killbuck Creek are caused by runoff from general, and/or intense rainfall. Other areas of flooding concern are from the Boland Ditch and Pittsford Ditch.
Technical Memorandum No
 Pajaro River Watershed Study in association with Technical Memorandum No. 1.2.10 Task: Evaluation of Four Watershed Conditions - Sediment To: PRWFPA Staff Working Group Prepared by: Gregory Morris and
Emergency Action Plan (EAP) Tata Pond Dam
 Tata Pond Dam") For Official Use Only Not for Public Distribution 02/03/16 Emergency Action Plan (EAP) Tata Pond Dam State of Connecticut Dam ID: 0000 Town or City, County, Connecticut Name of Dam Owner Dam Hazard Classification
For Official Use Only Not for Public Distribution 02/03/16 Emergency Action Plan (EAP) Tata Pond Dam State of Connecticut Dam ID: 0000 Town or City, County, Connecticut Name of Dam Owner Dam Hazard Classification
LOCATED IN INDIAN RIVER COUNTY PREPARED FOR S.J.R.W.M.D. AND F.W.C.D. DECEMBER, 2003 Updated 2007 Updated May 2014 PREPARED BY
 FELLSMERE WATER CONTROL DISTRICT EAST MASTER DRAINAGE PLAN AND STORMWATER HYDROLOGIC ANALYSIS OF THE GRAVITY DRAINAGE SYSTEM LOCATED BETWEEN THE EAST BOUNDARY, LATERAL U, THE MAIN CANAL, AND DITCH 24 LOCATED
Appendix C Fluvial Flood Hazards
 Appendix C Fluvial Flood Hazards Sea Level Rise Vulnerability Assessment and Adaptation Project March 2019 Contents Contents... i Figures... i Tables... i Definitions, Acronyms, & Abbreviations... ii
CLIMATE READY BOSTON. Climate Projections Consensus ADAPTED FROM THE BOSTON RESEARCH ADVISORY GROUP REPORT MAY 2016
 CLIMATE READY BOSTON Sasaki Steering Committee Meeting, March 28 nd, 2016 Climate Projections Consensus ADAPTED FROM THE BOSTON RESEARCH ADVISORY GROUP REPORT MAY 2016 WHAT S IN STORE FOR BOSTON S CLIMATE?
Pompton Lakes Dam Downstream Effects of the Floodgate Facility. Joseph Ruggeri Brian Cahill Michael Mak Andy Bonner
 Pompton Lakes Dam Downstream Effects of the Joseph Ruggeri Brian Cahill Michael Mak Andy Bonner ASFPM 2013: Overview Page 2 Overview Page 3 Overview Page 4 Overview Page 5 Overview - Historical Pompton
B-1. Attachment B-1. Evaluation of AdH Model Simplifications in Conowingo Reservoir Sediment Transport Modeling
 Attachment B-1 Evaluation of AdH Model Simplifications in Conowingo Reservoir Sediment Transport Modeling 1 October 2012 Lower Susquehanna River Watershed Assessment Evaluation of AdH Model Simplifications
Highland Lake Bathymetric Survey
 Highland Lake Bathymetric Survey Final Report, Prepared For: The Town of Highland Lake 612 Lakeshore Drive Oneonta, AL 35121 Prepared By: Tetra Tech 2110 Powers Ferry Road SE Suite 202 Atlanta, GA 30339
HYDROLOGIC AND HYDRAULIC REPORT FOR SR. 0522, SECTION 5BN ALONG BLACKLOG CREEK CROMWELL TOWNSHIP HUNTINGDON COUNTY. Prepared for:
 HYDROLOGIC AND HYDRAULIC REPORT FOR SR. 0522, SECTION 5BN ALONG BLACKLOG CREEK CROMWELL TOWNSHIP Prepared for: KCI Technologies, Inc. Mechanicsburg, PA and Pennsylvania Department of Transportation Engineering
Appendix O. Sediment Transport Modelling Technical Memorandum
 Appendix O Sediment Transport Modelling Technical Memorandum w w w. b a i r d. c o m Baird o c e a n s engineering l a k e s design r i v e r s science w a t e r s h e d s construction Final Report Don
David R. Vallee Hydrologist-in-Charge NOAA/NWS Northeast River Forecast Center
 David R. Vallee Hydrologist-in-Charge NOAA/NWS Northeast River Forecast Center Record flooding along the Shawsheen River during the 2006 Mother s Day Floods Calibrate and implement a variety of hydrologic
5.2 IDENTIFICATION OF HAZARDS OF CONCERN
 5.2 IDENTIFICATION OF HAZARDS OF CONCERN 2016 HMP Update Changes The 2011 HMP hazard identification was presented in Section 3. For the 2016 HMP update, the hazard identification is presented in subsection
ASFPM - Rapid Floodplain Mapping
 ASFPM - Nicole Cominoli Hydraulic Engineer USACE - Omaha District mary.n.cominoli@usace.army.mil June 3, 2015 US Army Corps of Engineers Mitigation = Risk Informed Decisions 2 The National Flood Insurance
Analysis of Hydraulic Impacts on the Schuylkill River
 Analysis of Hydraulic Impacts on the Schuylkill River Manayunk Sewer Basin Construction Project and the Venice Island Recreation Center Reconstruction Project Venice Island, Manayunk, Philadelphia, PA
HURRICANE SANDY LIMITED REEVALUATION REPORT UNION BEACH, NEW JERSEY DRAFT ENGINEERING APPENDIX SUB APPENDIX C SEA LEVEL RISE ANALYSIS
 HURRICANE SANDY LIMITED REEVALUATION REPORT UNION BEACH, NEW JERSEY DRAFT ENGINEERING APPENDIX SUB APPENDIX C SEA LEVEL RISE ANALYSIS Rev. 18 Feb 2015 1.0 Introduction 1.1 Guidance The Department of the
January 25, Summary
 January 25, 2013 Summary Precipitation since the December 17, 2012, Drought Update has been slightly below average in parts of central and northern Illinois and above average in southern Illinois. Soil
5.2. IDENTIFICATION OF NATURAL HAZARDS OF CONCERN
 5.2. IDENTIFICATION OF NATURAL HAZARDS OF CONCERN To provide a strong foundation for mitigation strategies considered in Sections 6 and 9, County considered a full range of natural hazards that could impact
Low Low Water in Puget Sound vs. Mean Sea Level. What do the flood event gauge readings at Sedro Woolley really mean?
 Low Low Water in Puget Sound vs. Mean Sea Level What do the flood event gauge readings at Sedro Woolley really mean? When you make the adjustment of 8.93 feet to the published values and then subtract
TOWN OF FORT KENT, MAINE AROOSTOOK COUNTY
 TOWN OF FORT KENT, MAINE AROOSTOOK COUNTY PRELIMINARY: 01/07/2013 Federal Emergency Management Agency COMMUNITY NUMBER 230019V000A NOTICE TO FLOOD INSURANCE STUDY USERS Communities participating in the
PENNSYLVANIA DEPARTMENT OF TRANSPORTATION DISTRICT 6-0 HYDROLOGIC AND HYDRAULIC REPORT. for SR 3062, SECTION 29S STRASBURG ROAD.
 PENNSYLVANIA DEPARTMENT OF TRANSPORTATION DISTRICT 6-0 HYDROLOGIC AND HYDRAULIC REPORT for SR 3062, SECTION 29S STRASBURG ROAD over WEST BRANCH OF BRANDYWINE CREEK EAST FALLOWFIELD TOWNSHIP, CHESTER COUNTY
USING GIS TO MODEL AND ANALYZE HISTORICAL FLOODING OF THE GUADALUPE RIVER NEAR NEW BRAUNFELS, TEXAS
 USING GIS TO MODEL AND ANALYZE HISTORICAL FLOODING OF THE GUADALUPE RIVER NEAR NEW BRAUNFELS, TEXAS ASHLEY EVANS While the state of Texas is well-known for flooding, the Guadalupe River Basin is one of
Hydrology and Hydraulics Design Report. Background Summary
 To: National Park Services Montezuma Castle National Monument Richard Goepfrich, Facility Manager From: Multicultural Technical Engineers Date: Tuesday - February 13, 2018 Subject: 30% Hydrology and Hydraulics
Mount St. Helens Project Cowlitz River Levee Systems 2009 Level of Flood Protection Update Summary
 Mount St. Helens Project Cowlitz River Levee Systems 2009 Level of Flood Protection Update Summary Cowlitz River at Longview/Kelso, Washington February 4, 2010 Executive Summary USACE periodically updates
Rucker Pond. Background
 Rucker Pond Background The Rucker Basin consists of two subbasins (East and West) that drain to a single area known as Rucker Pond. Both subbasins have the same hydraulic parameters, but have different
Dealing with Zone A Flood Zones. Topics of Discussion. What is a Zone A Floodplain?
 Dealing with Zone A Flood Zones Topics of Discussion Overview of Zone A Floodplains Permitting Development in Zone A Floodplains Estimating Flood Elevations in Zone A Flood Insurance Implications Letters
3.0 TECHNICAL FEASIBILITY
 3.0 TECHNICAL FEASIBILITY 3.1 INTRODUCTION To enable seasonal storage and release of water from Lake Wenatchee, an impoundment structure would need to be constructed on the lake outlet channel. The structure
6.4 Sensitivity Tests
 6.4 Sensitivity Tests 6.4.1 Sensitivity of Floodplain Inundation to Width of Dry Culvert The preliminary design for the Expressway based on consideration of possible future climate effects to 2090 assumed
Chapter 7 Mudflow Analysis
 Chapter 7 Mudflow Analysis 7.0 Introduction This chapter provides information on the potential and magnitude of mud floods and mudflows that may develop in Aspen due to rainfall events, snowmelt, or rain
Folsom Dam Water Control Manual Update Joint Federal Project, Folsom Dam
 Folsom Dam Water Control Manual Update Joint Federal Project, Folsom Dam Public Workshop May 25, 2016 Sacramento Library Galleria 828 I Street, Sacramento, CA US Army Corps of Engineers BUILDING STRONG
Summary of Hydraulic and Sediment-transport. Analysis of Residual Sediment: Alternatives for the San Clemente Dam Removal/Retrofit Project,
 Appendix N SUMMARY OF HYDRAULIC AND SEDIMENT-TRANSPORT ANALYSIS OF RESIDUAL SEDIMENT: ALTERNATIVES FOR THE SAN CLEMENTE DAM REMOVAL/RETROFIT PROJECT, CALIFORNIA the San Clemente Dam Removal/Retrofit Project,
Appendix A STORM SURGE AND WAVE HEIGHT ANALYSIS
 Appendix A STORM SURGE AND WAVE HEIGHT ANALYSIS Memo To: Jeff Robinson, P.E., GEC, Inc. From: Silong Lu, Ph.D., P.E., D.WRE, Dynamic Solutions, LLC. Date: 1/9/2014 CC: Re: Chris Wallen, Vice President,
5.2 IDENTIFICATION OF HAZARDS OF CONCERN
 5.2 IDENTIFICATION OF HAZARDS OF CONCERN 2016 HMP Update Changes The 2011 HMP hazard identification was presented in Section 3. For the 2016 HMP update, the hazard identification is presented in subsection
Overview of a Changing Climate in Rhode Island
 Overview of a Changing Climate in Rhode Island David Vallee, Hydrologist in Charge, National Weather Service Northeast River Forecast Center, NOAA Lenny Giuliano, Air Quality Specialist, Rhode Island Department
SAVANNAH HARBOR EXPANSION BANK EROSION STUDY UPDATE
 CESAS-EN-GS SAVANNAH HARBOR EXPANSION BANK EROSION STUDY UPDATE GEOTECHNICAL AND HTRW BRANCH SOILS SECTION CITY FRONT, BIGHT SECTION, FORT PULASKI & NORTH TYBEE ISLAND GEORGIA 23 June 2011 CESAW-TS-EG
Monitoring Hurricane Rita Inland Storm Surge
 Monitoring Hurricane Rita Inland Storm Surge By Benton D. McGee, Roland W. Tollett, and Burl B. Goree Pressure transducers (sensors) are accurate, reliable, and cost-effective tools to measure and record
DRAFT Design Hydraulic Study. Bridge 04C-0055, Mattole Road Bridge over Mattole River at Honeydew. Humboldt County. Prepared for:
 DRAFT Design Hydraulic Study Bridge 04C-0055, Mattole Road Bridge over Mattole River at Honeydew Humboldt County Prepared for: Morrison Structures Incorporated 1890 Park Marina Drive, Suite 104 Redding,
PART 4 HURRICANE KATRINA STRIKES NEW ORLEANS AUGUST 2005
 PART 4 HURRICANE KATRINA STRIKES NEW ORLEANS AUGUST 2005 Hurricane Katrina Hurricane Katrina swept across southern Florida and lost momentum, then gained speed and water, showing the second lowest barometric
Ground Water Protection Council 2017 Annual Forum Boston, Massachusetts. Ben Binder (303)
") Ground Water Protection Council 2017 Annual Forum Boston, Massachusetts Protecting Groundwater Sources from Flood Borne Contamination Ben Binder (303) 860-0600 Digital Design Group, Inc. The Problem Houston
Ground Water Protection Council 2017 Annual Forum Boston, Massachusetts Protecting Groundwater Sources from Flood Borne Contamination Ben Binder (303) 860-0600 Digital Design Group, Inc. The Problem Houston
Embarras River Watershed Digital Floodplain Mapping, Champaign County, Illinois
 Contract Report 2002-05 Embarras River Watershed Digital Floodplain Mapping, Champaign County, Illinois by Sally A. McConkey and Mark D. Johanson Prepared for the Illinois Department of Natural Resources
North Atlantic Coast Comprehensive Study (NACCS) APPENDIX A: ENGINEERING
 APPENDIX A: ENGINEERING") North Atlantic Coast Comprehensive Study (NACCS) APPENDIX A: ENGINEERING NORTH ATLANTIC COAST COMPREHENSIVE STUDY: RESILIENT ADAPTATION TO INCREASING RISK Appendix A - Engineering Table of Contents North
North Atlantic Coast Comprehensive Study (NACCS) APPENDIX A: ENGINEERING NORTH ATLANTIC COAST COMPREHENSIVE STUDY: RESILIENT ADAPTATION TO INCREASING RISK Appendix A - Engineering Table of Contents North
REDWOOD VALLEY SUBAREA
 Independent Science Review Panel Conceptual Model of Watershed Hydrology, Surface Water and Groundwater Interactions and Stream Ecology for the Russian River Watershed Appendices A-1 APPENDIX A A-2 REDWOOD
Extreme Phenomena in Dobrogea - Floods and Droughts
 Extreme Phenomena in Dobrogea - Floods and Droughts PhD eng. Carmen Maftei Ovidius University of Constanta (Partner no 4) OUTLINES Introduction Study area Drought Floods Conclusion What is the problem?
Chapter 7 Mudflow Analysis
 Chapter 7 Mudflow Analysis 7.0 Introduction This chapter provides information on the potential and magnitude of mud floods and mudflows that may develop in Aspen due to rainfall events, snowmelt, or rain
STRUCTURAL STABILITY ASSESSMENT
 STRUCTURAL STABILITY ASSESSMENT CFR 257.73(d) Bottom Ash Pond Complex Cardinal Plant Brilliant, Ohio October, 2016 Prepared for: Cardinal Operating Company Cardinal Plant Brilliant, Ohio Prepared by: Geotechnical
Promoting Resilience to Changing Weather
 Promoting Resilience to Changing Weather Harpswell Neck Harpswell Sound Orr s Island Basin Cove Pott s Point Harpswell Conservation Commission March 30, 2017 What Does This Mean for Harpswell? Topography
Great Lakes Update. Volume 191: 2014 January through June Summary. Vol. 191 Great Lakes Update August 2014
 Great Lakes Update Volume 191: 2014 January through June Summary The U.S. Army Corps of Engineers (USACE) monitors the water levels of each of the Great Lakes. This report provides a summary of the Great
CHAPTER FIVE: THE LOWER MISSISSIPPI REGION AND PLAQUEMINES PARISH
 CHAPTER FIVE: THE LOWER MISSISSIPPI REGION AND PLAQUEMINES PARISH 5.1 Overview Plaquemines Parish is the area where the last portion of the Mississippi River flows out into the Gulf of Mexico (see Figures
Between 6 am to 4 pm the next day approximately 7.5 inches fell. Chesapeake Bay Bridge Tunnel NOAA Tide Gage
 Ocean Park Alternative Drainage Route Analysis February, 2012 November 11 14, 2009 Between 6 am to 4 pm the next day approximately 7.5 inches fell Chesapeake Bay Bridge Tunnel NOAA Tide Gage Hurricane
PECKMAN RIVER BASIN, NEW JERSEY FLOOD RISK MANAGEMENT FEASIBILITY STUDY. Hydrology Appendix. New York District
 PECKMAN RIVER BASIN, NEW JERSEY FLOOD RISK MANAGEMENT FEASIBILITY STUDY Hydrology Appendix New York District May 2018 Table of Contents 1.0 OBJECTIVE OF STUDY... 1 2.0 WATERSHED DESCRIPTION... 1 3.0 PRIOR
Illinois Drought Update, December 1, 2005 DROUGHT RESPONSE TASK FORCE Illinois State Water Survey, Department of Natural Resources
 Illinois Drought Update, December 1, 2005 DROUGHT RESPONSE TASK FORCE Illinois State Water Survey, Department of Natural Resources For more drought information please go to http://www.sws.uiuc.edu/. SUMMARY.
ENGINEERING HYDROLOGY
 ENGINEERING HYDROLOGY Prof. Rajesh Bhagat Asst. Professor Civil Engineering Department Yeshwantrao Chavan College Of Engineering Nagpur B. E. (Civil Engg.) M. Tech. (Enviro. Engg.) GCOE, Amravati VNIT,
3/3/2013. The hydro cycle water returns from the sea. All "toilet to tap." Introduction to Environmental Geology, 5e
 Introduction to Environmental Geology, 5e Running Water: summary in haiku form Edward A. Keller Chapter 9 Rivers and Flooding Lecture Presentation prepared by X. Mara Chen, Salisbury University The hydro
Case Study 2: Twenty-mile Creek Rock Fords
 Case Study : Twenty-mile Creek Rock Fords Location Crossing Description Washington. Okanagan National Forest. Methow Valley Ranger District. Chewuch river basin, East Chewuch Road. The Twenty-mile Creek
HISTORY OF CONSTRUCTION FOR EXISTING CCR SURFACE IMPOUNDMENT PLANT GASTON ASH POND 40 CFR (c)(1)(i) (xii)
(1)(i) (xii)") HISTORY OF CONSTRUCTION FOR EXISTING CCR SURFACE IMPOUNDMENT PLANT GASTON ASH POND 40 CFR 257.73(c)(1)(i) (xii) (i) Site Name and Ownership Information: Site Name: E.C. Gaston Steam Plant Site Location:
HISTORY OF CONSTRUCTION FOR EXISTING CCR SURFACE IMPOUNDMENT PLANT GASTON ASH POND 40 CFR 257.73(c)(1)(i) (xii) (i) Site Name and Ownership Information: Site Name: E.C. Gaston Steam Plant Site Location:
Attachment 3: Fragility Curve Determinations DRAFT
 Attachment 3: Fragility Curve Determinations DRAFT CELRC-TS-DG 4 October 2017 MEMORANDUM FOR PM-PL SUBJECT: Fragility Curve Determination for McCook Levee North and South of 47 th Street Introduction 1.
President s Day Weekend Storm Community Meeting and Workshop April 17, 2017
 President s Day Weekend Storm Community Meeting and Workshop April 17, 2017 Meeting outline 1. Progress update on the City of San Jose s recovery efforts 2. Water district presentation on: Weather situation
Missouri River Basin Water Management
 Missouri River Basin Water Management US Army Corps of Engineers Missouri River Navigator s Meeting February 12, 2014 Bill Doan, P.E. Missouri River Basin Water Management US Army Corps of Engineers BUILDING
APPENDIX B HYDROLOGY
 APPENDIX B HYDROLOGY TABLE OF CONTENTS 1.0 INTRODUCTION... 1 2.0 PROBABLE MAXIMUM PRECIPITATION (PMP)... 1 3.0 DESIGN FLOW CALCULATION... 1 4.0 DIVERSION CHANNEL SIZING... 2 5.0 REFERENCES... 4 LIST OF
Great Lakes Update. Volume 193: 2015 January through June Summary. Vol. 193 Great Lakes Update August 2015
 Great Lakes Update Volume 193: 2015 January through June Summary The U.S. Army Corps of Engineers (USACE) monitors the water levels of each of the Great Lakes. This report provides a summary of the Great
CASE STUDY #9 - Brushy Fork Dam, Sugar Grove, West Virginia
 CASE STUDY #9 - Brushy Fork Dam, Sugar Grove, West Virginia Brushy Fork Dam is a flood control structure built by the Soil Conservation Service southeast of the city of Franklin in Pendleton County, West
ARTICLE 5 (PART 2) DETENTION VOLUME EXAMPLE PROBLEMS
 DETENTION VOLUME EXAMPLE PROBLEMS") ARTICLE 5 (PART 2) DETENTION VOLUME EXAMPLE PROBLEMS Example 5.7 Simple (Detention Nomograph) Example 5.8 Offsite and Unrestricted Areas (HEC-HMS) Example 5.9 Ponds in Series w/ Tailwater (HEC-HMS) Example
ARTICLE 5 (PART 2) DETENTION VOLUME EXAMPLE PROBLEMS Example 5.7 Simple (Detention Nomograph) Example 5.8 Offsite and Unrestricted Areas (HEC-HMS) Example 5.9 Ponds in Series w/ Tailwater (HEC-HMS) Example
STREUVER FIDELCO CAPPELLI, LLC YONKERS DOWNTOWN DEVELOPMENT PHASE 1. DRAFT ENVIRONMENTAL IMPACT STATEMENT For: PALISADES POINT
 STREUVER FIDELCO CAPPELLI, LLC YONKERS DOWNTOWN DEVELOPMENT PHASE 1 DRAFT ENVIRONMENTAL IMPACT STATEMENT For: PALISADES POINT Prepared by: PAULUS, SOKOLOWSKI & SARTOR STORMWATER MANAGEMENT 1. Methodology
3.11 Floodplains Existing Conditions
 Other stormwater control practices may be needed to mitigate water quality impacts. In addition to detention facilities, other practices such as vegetated basins/buffers, infiltration basins, and bioswales
Swift Creek Sediment Management Action Plan (SCSMAP)
") Swift Creek Sediment Management Action Plan (SCSMAP) PHASE 2 PROJECT PLAN PROPOSAL Whatcom County Public Works Department 322 N. Commercial Street, Suite 210 Bellingham, WA 98225 (360) 676-6692 June 2013
Swift Creek Sediment Management Action Plan (SCSMAP) PHASE 2 PROJECT PLAN PROPOSAL Whatcom County Public Works Department 322 N. Commercial Street, Suite 210 Bellingham, WA 98225 (360) 676-6692 June 2013
GEOL 1121 Earth Processes and Environments
 GEOL 1121 Earth Processes and Environments Wondwosen Seyoum Department of Geology University of Georgia e-mail: seyoum@uga.edu G/G Bldg., Rm. No. 122 Seyoum, 2015 Chapter 6 Streams and Flooding Seyoum,
Floodplain Risk Management in Dungog after the April 2015 Super Storm. Presentation Outline
 Presentation Outline Floodplain Risk Management in after the April 2015 Super Storm Rohan Hudson, Royal HaskoningDHV FMA 2017 Preparing for the Next Great Flood 17th May 2017 Background and Flood Mechanisms
Issue 44: Phase II & III H&H Issues Date: 07/03/2006 Page 1
 Background Phase I of the NCFMP studies have primarily focused on the coastal plain and sandhills physiographic regions in of the State. Phase II and III study areas will focus on the piedmont, foothills,
SAN JACINTO RIVER / BAUTISTA CREEK LEVEE SYSTEM RIVERSIDE COUNTY, CALIFORNIA NLD ID #
 SAN JACINTO RIVER / BAUTISTA CREEK LEVEE SYSTEM RIVERSIDE COUNTY, CALIFORNIA NLD ID # 3805010019 PERIODIC INSPECTION REPORT NO 1 GENERALIZED EXECUTIVE SUMMARY FEBRUARY 2013 FINAL RATING: MINIMALLY ACCEPTABLE
Assessment of the Hood River Delta Hood River, Oregon
 Assessment of the Hood River Delta Hood River, Oregon Pacific Northwest Waterways Association Annual Meeting October 13, 2010 Michael McElwee, Executive Director Port of Hood River Overview U.S. Army Corps
Managing an Extreme Weather Event of Prolonged Duration May 22, 2013
 Managing an Extreme Weather Event of Prolonged Duration May 22, 2013 MISSOURI RIVER FLOOD OF 2011 M I C H A E L J. K E N N E R L Y P. E. D I R E C T O R O F T H E O F F I C E O F D E S I G N I O W A D