Monthly Long Range Weather Commentary Issued: March 06, 2012 Steven A. Root, CCM, President/CEO
|
|
|
- Gervase Allen
- 5 years ago
- Views:
Transcription


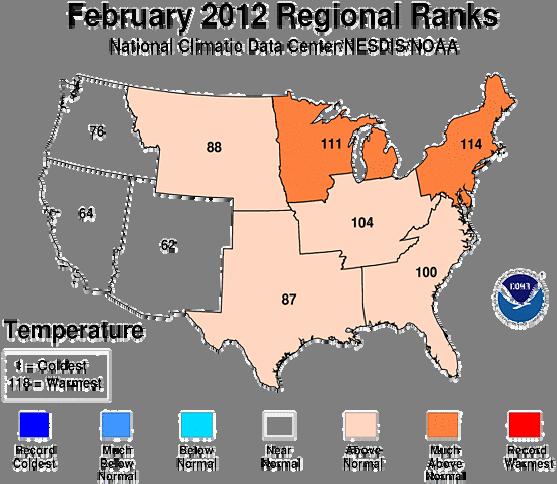
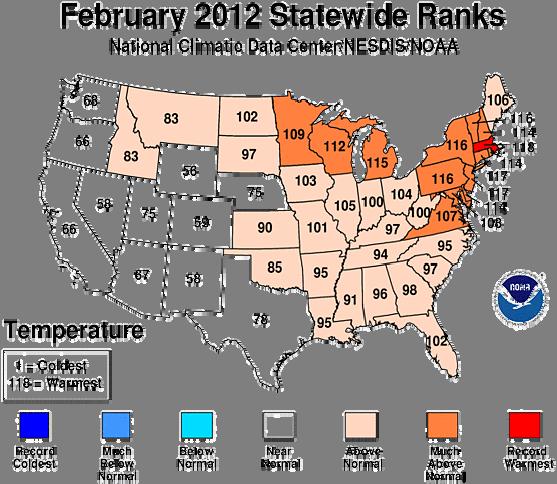
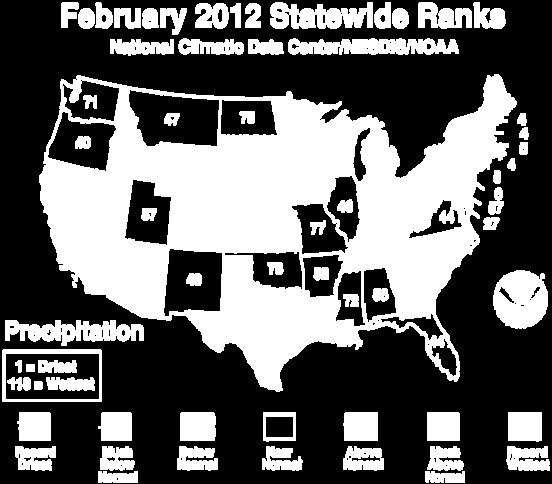
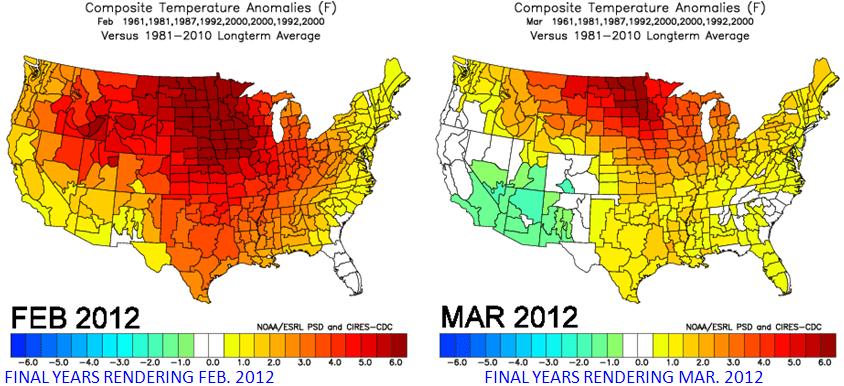
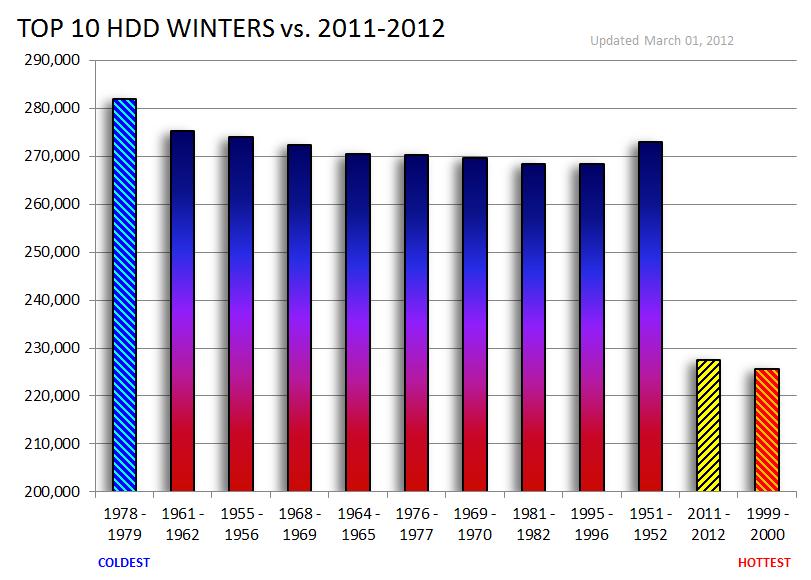
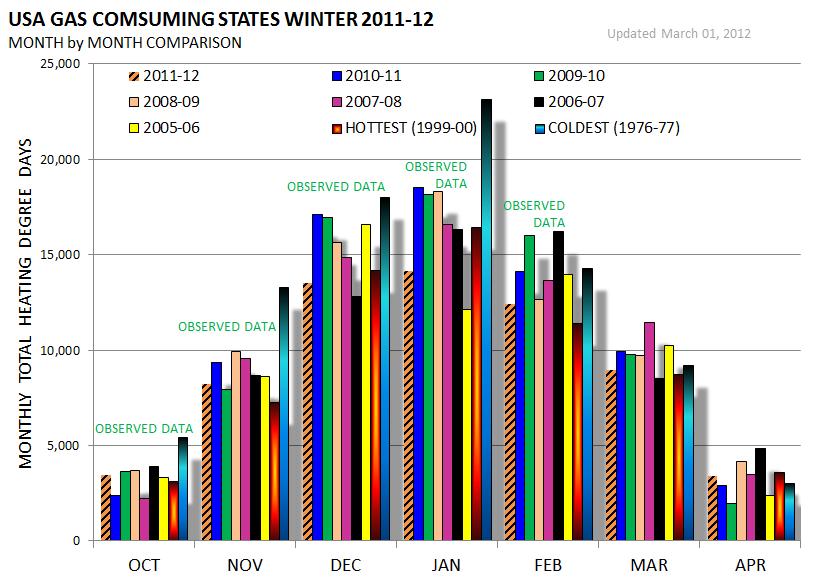
1 Monthly Long Range Weather Commentary Issued: March 06, 2012 Steven A. Root, CCM, President/CEO Warmer than average temperatures dominated the northern and eastern regions of the country in December, January and February, leading to the fourth warmest winter on record for the contiguous United States. The winter season was also drier than average for the Lower 48, with dry conditions experienced across the West and the Southeast but wetter than average conditions in the Central and Southern Plains and parts of the Ohio Valley. The average contiguous U.S. temperature during the December February period was 36.8 F, 3.9 F ABOVE the long term average the warmest since The precipitation averaged across the nation was 5.70 inches, 0.78 inch below the long term average. WARMER THAN NORMAL temperatures were widespread with twenty seven states in the Northern Plains, Midwest, Southeast and Northeast having winter temperatures ranked among their ten warmest. Only New Mexico had winter temperatures below its 20th century average. Statewide precipitation totals were mixed during the winter season. The western states were particularly dry with California having its 2nd DRIEST winter on record, at 7.82 inches BELOW NORMAL. Montana was eighth driest, and Oregon and Idaho were both tenth driest for the season.
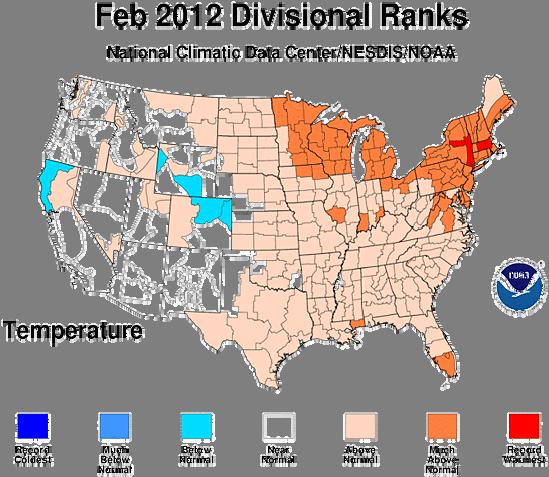
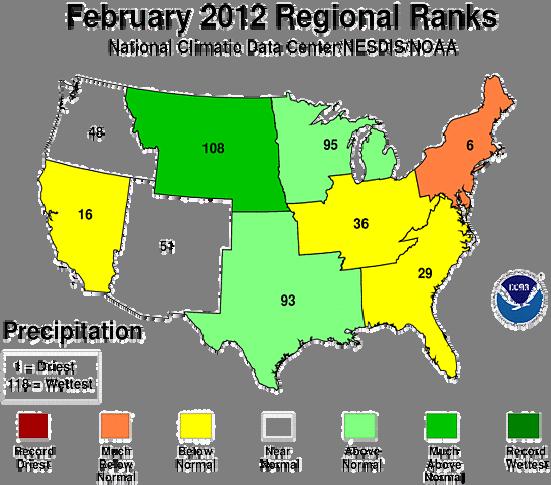
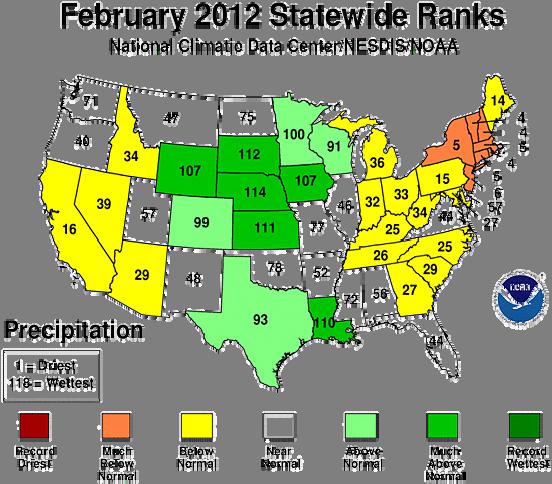
2 DRIER THAN NORMAL conditions were also present across the Northern Plains, Southwest, Southeast, and Northeast. ABOVE NORMAL precipitation occurred in the central United States, from the Ohio Valley into the Southern Plains. The warm and dry conditions during the 2011/12 winter season limited snowfall for many locations. According to data from the Rutgers Global Snow Lab, snow cover extent during winter was approximately 237,000 square miles BELOW the average the third smallest winter snow cover footprint in the 46 year satellite record. Snowpack was particularly limited across parts of the West, where parts of California, Nevada, and Arizona had snowpack less than half of average. For the winter period, NOAA s U.S. Climate Extremes Index, an index that tracks the highest 10% and lowest 10% of extremes in temperature, precipitation, drought and tropical cyclones, was the ninth highest value in the 102 year period of record, with nearly one third of the nation experiencing climate extremes as defined by this index. The elevated value was largely driven by extremes in warm daily maximum and minimum temperatures across the Southeast, Upper Midwest, and Ohio Valley. Despite having a record cold January, Alaska had a seasonally normal temperature at 1.4 F BELOW NORMAL, ranking as the 35th coldest winter in the 94 year record for the state. A WARMER THAN NORMAL December and February balanced the very cold January temperatures, resulting in a winter temperature near NORMAL. During February, the contiguous United States experienced ABOVE NORMAL temperatures with a national average temperature of 38.3 F. This was 3.6 F ABOVE NORMAL, making it the 17th warmest February on record. MUCH ABOVE NORMAL temperatures were present across the Great Lakes, Mid Atlantic, and Northeast during February. The Massachusetts statewide average temperature tied with 1998 as the warmest February on record at 7.9 F ABOVE NORMAL. In total, 12 states had February temperatures ranking among their ten warmest. Precipitation totals were mixed during February, resulting in a nationally averaged precipitation total 0.25 inch BELOW NORMAL of 2.02 inches. Dry conditions were present across the West, Southeast, and Midwest. The Northeast was particularly dry, where New York, Vermont, New Hampshire, Massachusetts, Connecticut, Rhode Island, and New Jersey each had a top ten dry February. In contrast, South Dakota, Nebraska, Kansas, and Louisiana had February precipitation totals among their ten wettest. According to the U.S. Drought Monitor, as of February 28th, about 39 percent of the contiguous United States was experiencing drought conditions, a slight increase compared to the beginning of the month. However, the percent area experiencing the worst category of drought, called D4 or exceptional drought, shrank from 3.2 percent to 2.5 percent. Drought conditions generally improved across the Southern Plains where there has been above average precipitation for several months. Drought conditions deteriorated across parts of the Southeast and the West, which had been DRIER THAN NORMAL. According to data from the Rutgers Global Snow Lab, the monthly snow cover extent across the contiguous United States was approximately 1.0 million square miles, which was 139,200 square miles BELOW the average. The small monthly snow cover extent emerges despite several large winter storms which impacted the Rockies and Northern Plains during the month.

3 According to preliminary data from NOAA s Storm Prediction Center, there were 57 tornado reports during February, nearly twice the NORMAL number of tornadoes for the month. Most of the tornadoes occurred on the 28th and 29th, when a strong storm system spawned several strong tornadoes from Nebraska to Tennessee, causing an estimated 13 fatalities.
4
5
6


7 February Station Records Location Record Type Value Previous Record (date) Denver Int l AP, CO Denver Int l AP, CO All time daily snowfall record for the month All time three(3) day snowfall record for the month 12.5 ins. FEB ins. FEB 19, ins. FEB ins. FEB 1912 Key West Int l AP, FL FEB wettest day on record 4.34 ins. FEB ins. FEB 28, 1954 Monticello, AR North Little Rock, AR Greenwood, MS Monroe, LA Valdez, AK FEB all time high temperature record All time record low sea level pressure (tied) FEB all time high temperature record FEB all time high temperature record FEB all time snow depth record 85.0 F FEB F FEB 27, ins. FEB ins. FEB 28, F FEB F FEB 24 and 27, F FEB F FEB 9, ins. FEB ins. FEB 27 and 28, 1990 Jackson, KY Warmest meteorological winter on record Average of 41.6 F Average of 41.2 F Philadelphia, PA Eighth warmest FEB on record (tied) Average of 40.9 F Average of 40.9 F 1976 the warmest occurred FEB 1925 with an average of 42.2 F

8 Philadelphia, PA Fourth warmest meteorological winter on record Average of 40.7 F Average of 40.4 F the warmest occurred in with an average of 43.4 F Allentown, NJ Fourth warmest FEB on record Average of 36.6 F Average of 36.5 F 1976 the warmest occurred FEB 1998 with an average of 38.6 F Allentown, NJ Second warmest meteorological winter on record (tied) Average of 36.1 F Average of 36.1 F the warmest occurred in with an average of 36.2 F Allentown, NJ Fourth driest FEB on record (tied) 1.11 ins ins. FEB 1987 the driest occurred FEB 2002 with 0.55 ins. The following graphic shows the upper level storm track, measured at approximately 18,000 feet above sea level, averaged for FEBRUARY 2012: Notice that the main core of the jet (5,300 to 5,400 meter heights) was shifted well north, well into central and northern Canada. As a result, no cold air intrusions were allowed to enter the continental USA, equating to wide spread warmth and large areas with ABOVE NORMAL temperatures.


9 This displacement of the main jet stream core during FEBRUARY 2012, showed this departure from normal positioning and versus normal:


10 As stated above, about 39 percent of the contiguous United States was experiencing drought conditions, a slight increase compared to the beginning of the month. The percent area experiencing the worst category of drought, called D4 or exceptional drought, shrank from 3.2 percent to 2.5 percent during FEBRUARY.

11 Our long range forecast model did well last month, more than adequately identifying the exaggerated warmth across the central states and mid continent, although understating the warmth to be across New England and the NE USA. I think the analogs, while providing strong support for temperatures, failed to provide adequate support for precipitation forecasts, as our outlooks failed to hit the mid con wetness observed during FEBRUARY. These graphics depict our model forecasts for FEBRUARY 2012 made at the end of JANUARY 2012: These graphics depict actual conditions occurring in FEBRUARY 2012: The following graphics depict FEBRUARY 2012 departure from normal temperatures compared to those of FEBRUARY 2011 (this year to last year; LY to TY ):
 MO. PRECIP. (ins.) MO. SNOWFALL (ins.) OBS NOR DFN OBS NOR DFN (%) OBS NOR DFN Honolulu HI 73.5 73.2 0.3 1.10 1.")
12 The following graphics depict FEBRUARY 2012 departure from normal precipitation compared to FEBRUARY 2011 (this year to last year; LY to TY ): Here are our regional climatic hub center weather station verifications for FEBRUARY 2012: Regional City and State MO. TEMPS ( F) MO. PRECIP. (ins.) MO. SNOWFALL (ins.) OBS NOR DFN OBS NOR DFN (%) OBS NOR DFN Honolulu HI % Seattle WA % Portland OR % Spokane Intl WA % % Pendleton OR % % Santa Rosa CA % LA Airport CA % Redding CA % Sacramento CA % Fresno CA % Winnemucca NV % % Tonopah NV % % Phoenix AZ % Albuquerque NM % % Salt Lake City UT % % Grand Junction CO % % OBS = Observed, DFN = Departure from NORMAL
13 Regional City and State MO. TEMPS ( F) MO. PRECIP. (ins.) MO. SNOWFALL (ins.) OBS NOR DFN OBS NOR DFN (%) OBS NOR DFN Great Falls MT % % Casper WY % % Denver CO % % Grand Forks ND % % Rapid City SD % % Omaha NE % % Kansas City MO % % Oklahoma City OK % % Lubbock TX % % Dallas Ft. Worth TX % % San Antonio TX % Minneapolis MN % % Green Bay WI % % Detroit MI % % OBS = Observed, DFN = Departure from NORMAL Regional City and State MO. TEMPS ( F) MO. PRECIP. (ins.) MO. SNOWFALL (ins.) OBS NOR DFN OBS NOR DFN (%) OBS NOR DFN Buffalo NY % % Burlington VT % % Boston MA % % Pittsburgh PA % % Philadelphia PA % % Baltimore MD % % Chicago O'Hare IL % % Indianapolis IN % % Louisville KY % % New Orleans LA % Raleigh Durham NC % % Wilmington NC % Atlanta GA % Tallahassee FL % Orlando FL % OBS = Observed, DFN = Departure from NORMAL
14 Regional City and State MO. TEMPS ( F) MO. PRECIP. (ins.) MO. SNOWFALL (ins.) OBS NOR DFN OBS NOR DFN (%) OBS NOR DFN Prince George BC % % Edmonton AB % % Saskatoon SK % % Winnipeg MB % % Kenora ON % % Timmins ON % % Muskoka ON % % Toronto ON % % Ottawa ON % % Barrow AK % % Nome AK % % Fairbanks AK % % Anchorage AK % % Juneau AK % Regional City and State OBS = Observed, DFN = Departure from NORMAL MO. TEMPS ( F) MO. PRECIP. (ins.) MO. SNOWFALL (ins.) OBS NOR DFN OBS NOR DFN (%) OBS NOR DFN Continental US % % So. Canada % % Alaska % % Equally Weighted Inputs of Regional Cities La Niña weakened during February 2012, as NEAR to ABOVE average sea surface temperatures (SST) emerged in the eastern equatorial Pacific Ocean. However, below average SSTs persisted in the central Pacific, as indicated by the latest weekly Niño 3.4 and Niño 4 indices which were near 0.5 C. The oceanic heat content (average temperature in the upper 300m of the ocean) anomalies also weakened notably, as reflected by a shallow lens (0m to ~25m depth) of positive temperature anomalies east of 125 W and by diminished below average temperatures east of the Date Line. These changes are partly associated with strong low level westerly wind anomalies across the eastern Pacific, which at times reflected the absence of equatorial easterlies in that region. Nonetheless, the larger scale atmospheric circulation anomalies continued to reflect the ongoing La Niña. Enhanced lowlevel equatorial easterlies persisted over the central and west central Pacific, while convection remained suppressed in the western and central Pacific, and enhanced over Malaysia and the Philippines. Collectively, these oceanic and atmospheric patterns reflect a weakening La Niña. A majority of models predict ENSO NEUTRAL conditions to return during March May 2012 and to continue through the Northern Hemisphere summer The rapid weakening of the negative surface and subsurface temperature anomalies during February 2012, combined with the historical tendency for La Niña to dissipate during the Northern Hemisphere spring, lends support to the return of ENSO neutral conditions in the coming months. Therefore, La Niña is expected to transition to ENSO NEUTRAL conditions by the end of April 2012 (see CPC/IRI consensus forecast).

15 Because impacts often lag the demise of an ENSO episode, La Niña like impacts are expected to persist into the upcoming season. Over the U.S. during March May 2012, La Niña is associated with an increased chance of above average temperatures across the south central U.S., and below average temperatures in the northwestern U.S. Also, above average precipitation is favored across western Washington, the Ohio Valley, and lower Great Lakes, while drier than average conditions are more likely across Florida, the Gulf Coast, and the southwestern U.S.


16 Predicted ENSO Values and all (multiple) NWS Model Variance WeatherBank Forecast In late FEBRUARY, I reviewed three patterns for trend mapping comparisons; those being: JAN 1 st FEB 27 th


17 JAN 15 th FEB 27 th JAN 31 st FEN 27 th Recognizing similarities in all three, I selected JAN 31 st FEB 27 th this source resulted in a number of close matches (year ID s are pasted in the lower left hand corner; 1952 = 52 ):
18


")

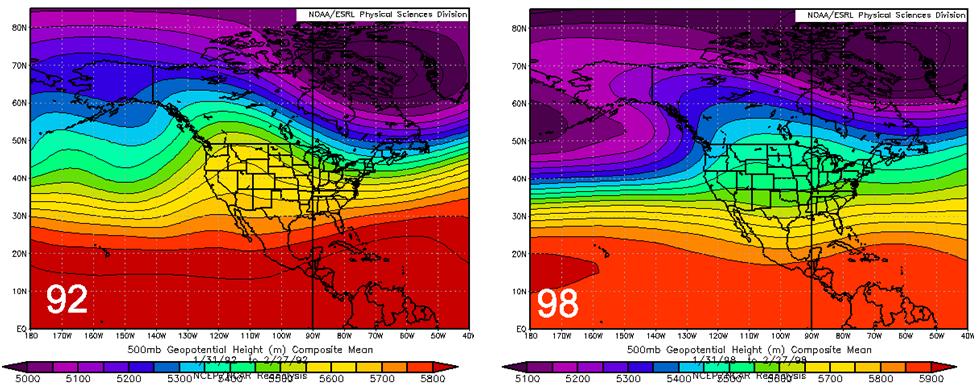
19 Next, because this first draft at analog selection yielded a large number of cases, I added 500mb (18,000 foot air flow [jet stream]) comparison to the same time period, ending Feb. 27 th.
20
21


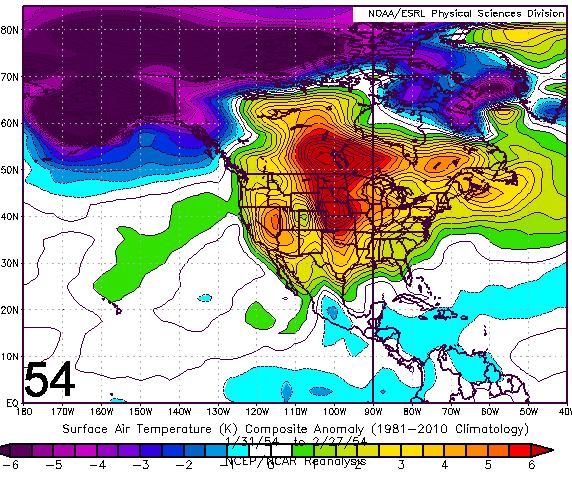
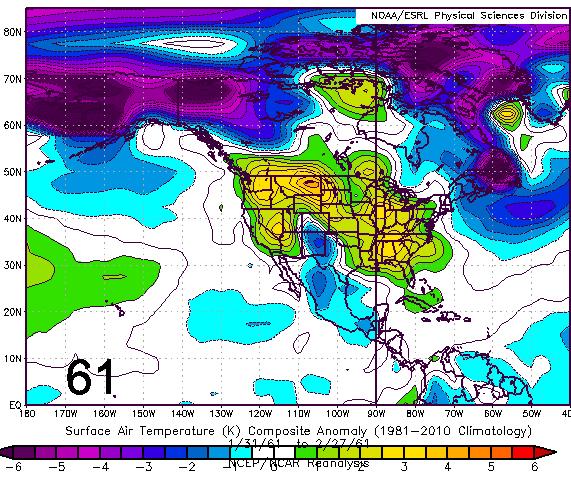
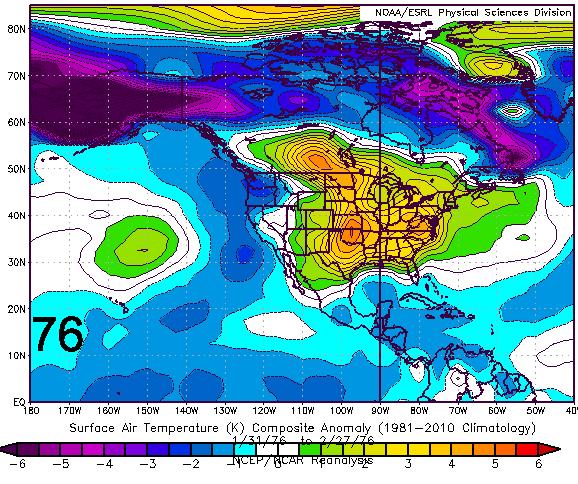
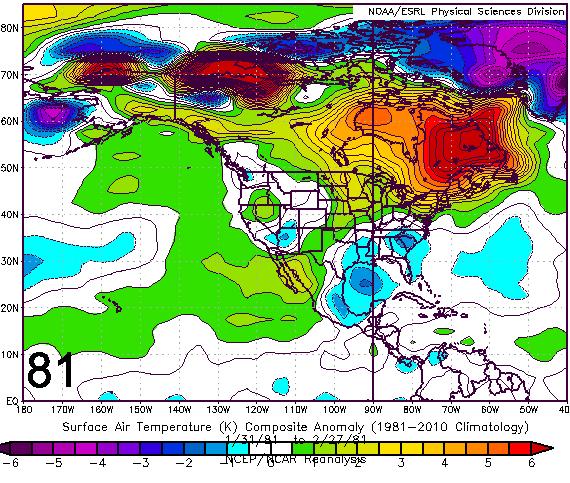
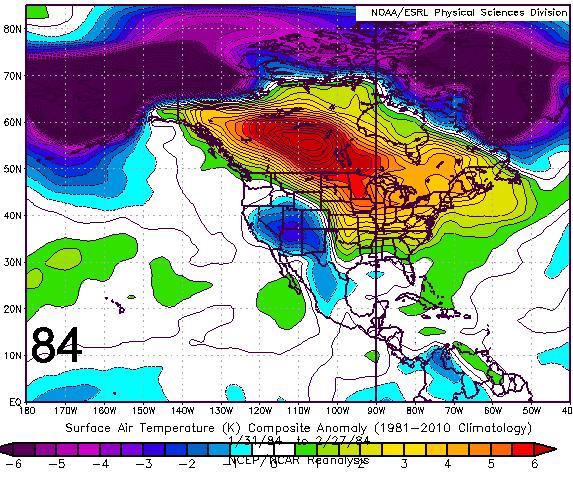
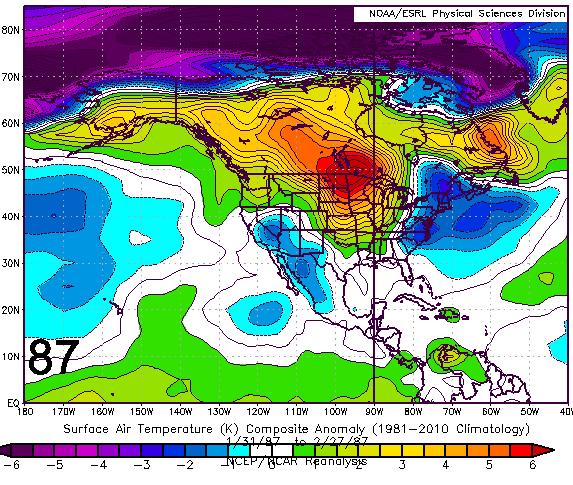
22 This procedure or additional scrutiny added clarity. Finally, by applying the projected MARCH mb pattern against each of the above years: resulted in a FINAL ANALOG SELECTION of 61 at 12.5%, 81 at 12.5%, 87 at 12.5%, 92 at 25.0%, and 00 at 37.5% (as a side note, added confidence and strong support using these analog mixes were received when I applied them backward, against FEBRUARY 2012, compared to actual conditions):
23


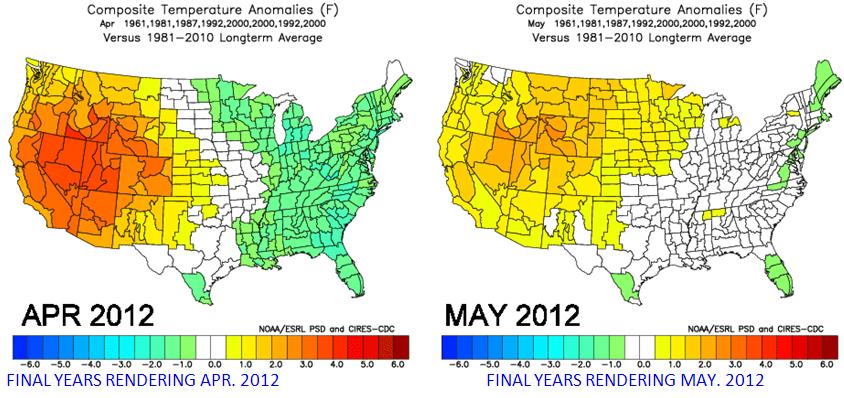
24 Thus, WeatherBank s forecast is as follows: MARCH 2012 Monthly Temperature Departures MARCH 2012 Monthly Precipitation Departures APRIL 2012 Monthly Temperature Departures APRIL 2012 Monthly Precipitation Departures MAY 2012 Monthly Temperature Departures MAY 2012 Monthly Precipitation Departures
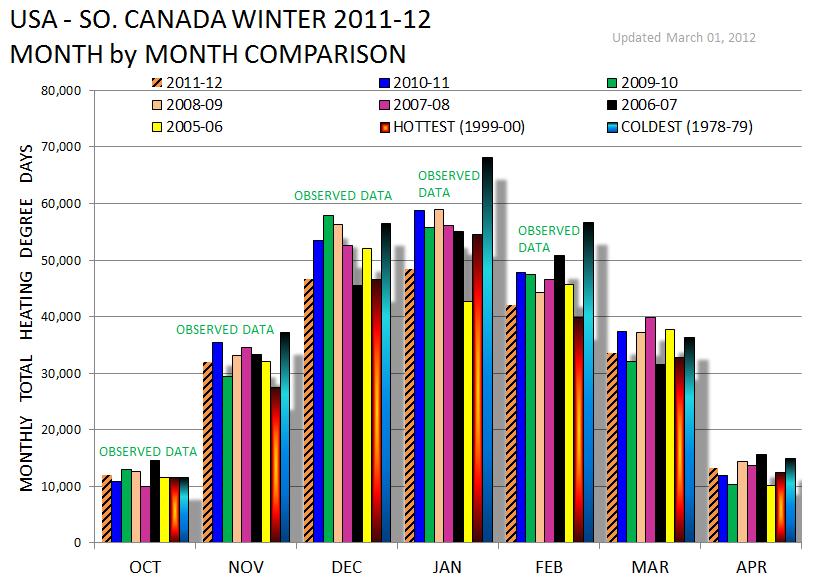
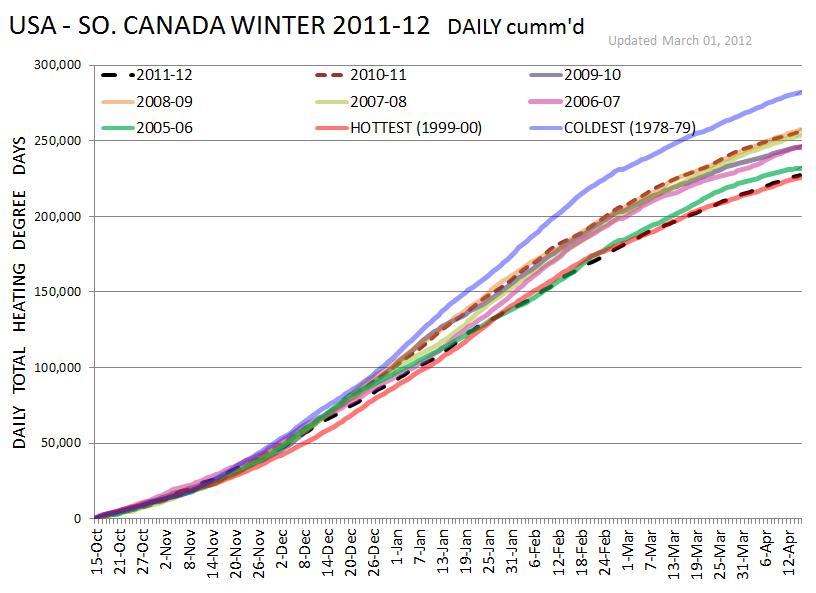
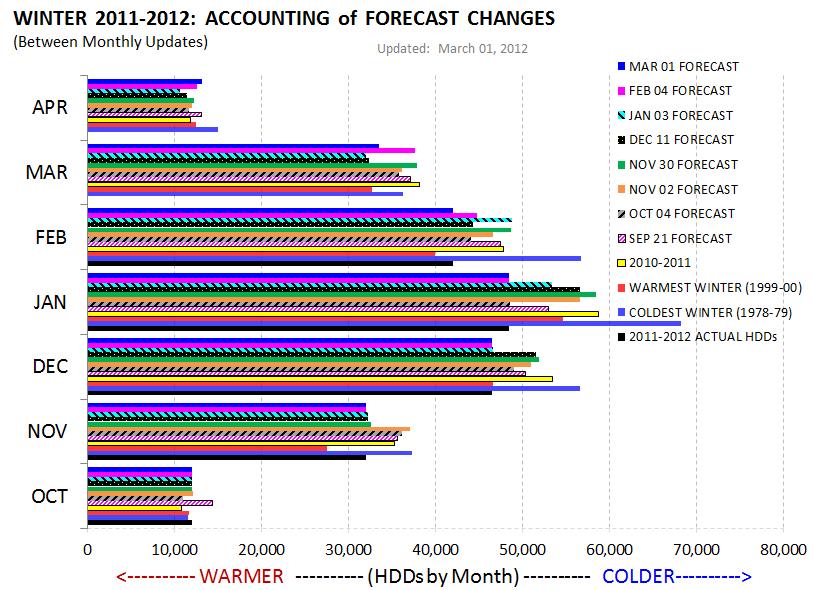
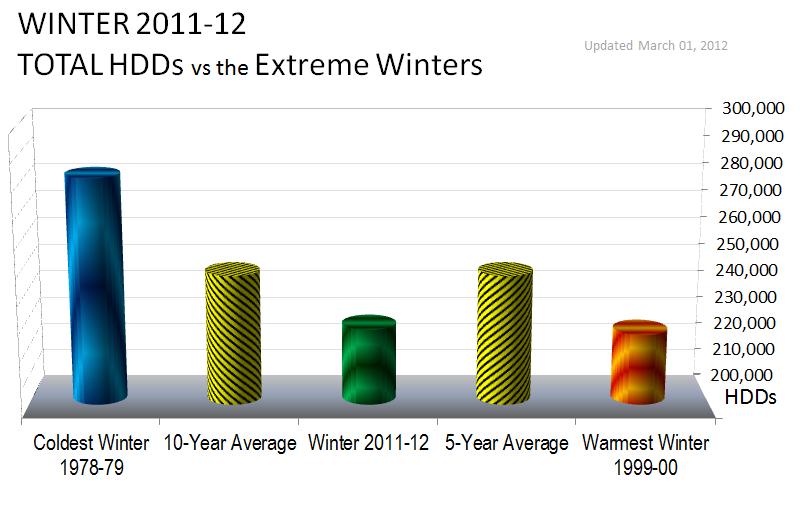
25 WeatherBank s Winter Forecast Forecast Monthly Numerical Ratings for WINTER (out of 62 past winters from ): Forecast Made Oct. 2, 2011: o Winter Full USA: 236,781 HDDs; 57 th Coldest; o Winter GCS: 67,767 HDDs; 56 th Coldest; (GCS = Gas Consuming States) Forecast Made Oct. 31, 2011: o Winter Full USA: 251,773 HDDs; 42 nd Coldest; o Winter GCS: 74,756 HDDs; 33 rd Coldest; (GCS = Gas Consuming States) Forecast Made Dec. 11, 2011: o Winter Full USA: 240,908 HDDs; 57 TH Coldest; o Winter GCS: 67,162 HDDs; 60 TH Coldest; (GCS = Gas Consuming States) Forecast Made Jan. 03, 2012: o Winter Full USA: 238,039 HDDs; 57 TH Coldest; o Winter GCS: 69,310 HDDs; 56 TH Coldest; (GCS = Gas Consuming States) Forecast Made Feb. 1, 2012: o Winter Full USA: 233,868 HDDs; 59 TH Coldest; o Winter GCS: 66,716 HDDs; 58 TH Coldest; (GCS = Gas Consuming States) Forecast Made March 4, 2012: o Winter Full USA: 227,596 HDDs; 61 st Coldest; o Winter GCS: 64,163 HDDs; 62 nd Coldest; (GCS = Gas Consuming States) Winter : 256,166 HDDs; Winter : 245,800 HDDs; Winter : 257,204 HDDs; Winter : 253,625 HDDs; Winter : 246,650 HDDs; 5-Year Winter Average: 251,889 HDDs 10-Year Winter Average: 247,137 HDDs WARMEST WINTER since : ,753 HDDs COLDEST WINTER since : ,056 HDDs
26
27
28
29
. By comparing observations of HDDs in winter and CDDs during summer, one may obtain a real time description of how warm or cold the current season is.")
30 Background Methodology for the WeatherBank LROM Using observed calendar day MAX and MIN temperatures at major cities across North America, WeatherBank generates daily Heating Degree Days (HDDs) and Daily Cooling Degree Days (CDDs). By comparing observations of HDDs in winter and CDDs during summer, one may obtain a real time description of how warm or cold the current season is. Basically, the hotter a location is in summer, or colder in winter, the more degree days that location earns. By adding all degree days from all locations, one can obtain a relative description of the current season. By comparing the current season to the degree days totals for past seasons, one obtains a ranking of the current season. WeatherBank's Long Range Outlook Model (LROM) fundamentally assumes that future weather patterns will be similar to a highly correlating, past weather pattern that was determine by trend mapping. All similar weather trends of the past are compared to the current weather trend, then analyzed using a variety of tests. Global inputs such as MEI, average upper level flow patterns, etc., are also used. Correlation coefficients for each input years are generated, and used to define the relative strength of each year and how that trend could be used in the forecast process. Since mid August 2007, strong correlations have remained between the equally weighted (same calendar 13 week period called current, to the same 13 week period of all past years; no lag applied) time periods of the past.
Monthly Long Range Weather Commentary Issued: February 04, 2012 Steven A. Root, CCM, President/CEO
 Monthly Long Range Weather Commentary Issued: February 04, 2012 Steven A. Root, CCM, President/CEO sroot@weatherbank.com Severe thunderstorms spawned tornadoes northeast of Birmingham, Alabama on January
Every state in the nation experienced a record warm daily temperature during March.
 Monthly Long Range Weather Commentary Issued: April 05, 2012 Steven A. Root, CCM, President/CEO sroot@weatherbank.com March 2012 Record and near record breaking temperatures dominated the eastern two thirds
Monthly Long Range Weather Commentary Issued: July 18, 2014 Steven A. Root, CCM, President/CEO
 Monthly Long Range Weather Commentary Issued: July 18, 2014 Steven A. Root, CCM, President/CEO sroot@weatherbank.com JUNE 2014 REVIEW Climate Highlights The Month in Review The average temperature for
SEPTEMBER 2013 REVIEW
 Monthly Long Range Weather Commentary Issued: October 21, 2013 Steven A. Root, CCM, President/CEO sroot@weatherbank.com SEPTEMBER 2013 REVIEW Climate Highlights The Month in Review The average temperature
Monthly Long Range Weather Commentary Issued: February 15, 2015 Steven A. Root, CCM, President/CEO
 Monthly Long Range Weather Commentary Issued: February 15, 2015 Steven A. Root, CCM, President/CEO sroot@weatherbank.com JANUARY 2015 Climate Highlights The Month in Review During January, the average
Monthly Long Range Weather Commentary Issued: APRIL 18, 2017 Steven A. Root, CCM, Chief Analytics Officer, Sr. VP,
 Monthly Long Range Weather Commentary Issued: APRIL 18, 2017 Steven A. Root, CCM, Chief Analytics Officer, Sr. VP, sroot@weatherbank.com MARCH 2017 Climate Highlights The Month in Review The average contiguous
Monthly Long Range Weather Commentary Issued: APRIL 1, 2015 Steven A. Root, CCM, President/CEO
 Monthly Long Range Weather Commentary Issued: APRIL 1, 2015 Steven A. Root, CCM, President/CEO sroot@weatherbank.com FEBRUARY 2015 Climate Highlights The Month in Review The February contiguous U.S. temperature
Monthly Long Range Weather Commentary Issued: May 15, 2014 Steven A. Root, CCM, President/CEO
 Monthly Long Range Weather Commentary Issued: May 15, 2014 Steven A. Root, CCM, President/CEO sroot@weatherbank.com APRIL 2014 REVIEW Climate Highlights The Month in Review The average temperature for
Monthly Long Range Weather Commentary Issued: APRIL 25, 2016 Steven A. Root, CCM, Chief Analytics Officer, Sr. VP, sales
 Monthly Long Range Weather Commentary Issued: APRIL 25, 2016 Steven A. Root, CCM, Chief Analytics Officer, Sr. VP, sales sroot@weatherbank.com MARCH 2016 Climate Highlights The Month in Review The March
Monthly Long Range Weather Commentary Issued: SEPTEMBER 19, 2016 Steven A. Root, CCM, Chief Analytics Officer, Sr. VP,
 Monthly Long Range Weather Commentary Issued: SEPTEMBER 19, 2016 Steven A. Root, CCM, Chief Analytics Officer, Sr. VP, sroot@weatherbank.com SEPTEMBER 2016 Climate Highlights The Month in Review The contiguous
Monthly Long Range Weather Commentary Issued: NOVEMBER 16, 2015 Steven A. Root, CCM, Chief Analytics Officer, Sr. VP, sales
 Monthly Long Range Weather Commentary Issued: NOVEMBER 16, 2015 Steven A. Root, CCM, Chief Analytics Officer, Sr. VP, sales sroot@weatherbank.com OCTOBER 2015 Climate Highlights The Month in Review The
Weather and Climate Summary and Forecast February 2018 Report
 Weather and Climate Summary and Forecast February 2018 Report Gregory V. Jones Linfield College February 5, 2018 Summary: For the majority of the month of January the persistent ridge of high pressure
Weather and Climate Summary and Forecast March 2018 Report
 Weather and Climate Summary and Forecast March 2018 Report Gregory V. Jones Linfield College March 7, 2018 Summary: The ridge pattern that brought drier and warmer conditions from December through most
Monthly Long Range Weather Commentary Issued: SEPTEMBER 19, 2015 Steven A. Root, CCM, Chief Analytics Officer, Sr. VP, sales
 Monthly Long Range Weather Commentary Issued: SEPTEMBER 19, 2015 Steven A. Root, CCM, Chief Analytics Officer, Sr. VP, sales sroot@weatherbank.com AUGUST 2015 Climate Highlights The Month in Review The
Weather and Climate Summary and Forecast January 2019 Report
 Weather and Climate Summary and Forecast January 2019 Report Gregory V. Jones Linfield College January 4, 2019 Summary: December was mild and dry over much of the west, while the east was much warmer than
Weather and Climate Summary and Forecast January 2018 Report
 Weather and Climate Summary and Forecast January 2018 Report Gregory V. Jones Linfield College January 5, 2018 Summary: A persistent ridge of high pressure over the west in December produced strong inversions
Monthly Long Range Weather Commentary Issued: July 9, 2012 Steven A. Root, CCM, President/CEO JUNE 2012
 Monthly Long Range Weather Commentary Issued: July 9, 2012 Steven A. Root, CCM, President/CEO sroot@weatherbank.com JUNE 2012 June Background The average temperature for the contiguous United States during
Weather and Climate Summary and Forecast April 2018 Report
 Weather and Climate Summary and Forecast April 2018 Report Gregory V. Jones Linfield College April 4, 2018 Summary: A near Miracle March played out bringing cooler and wetter conditions to the majority
Weather and Climate Summary and Forecast Winter
 Weather and Climate Summary and Forecast Winter 2016-17 Gregory V. Jones Southern Oregon University February 7, 2017 What a difference from last year at this time. Temperatures in January and February
Weather and Climate Summary and Forecast November 2017 Report
 Weather and Climate Summary and Forecast November 2017 Report Gregory V. Jones Linfield College November 7, 2017 Summary: October was relatively cool and wet north, while warm and very dry south. Dry conditions
Weather and Climate Summary and Forecast Winter
 Weather and Climate Summary and Forecast Winter 2016-17 Gregory V. Jones Southern Oregon University December 5, 2016 Well after an October that felt more like November, we just finished a November that
Weather and Climate Summary and Forecast March 2019 Report
 Weather and Climate Summary and Forecast March 2019 Report Gregory V. Jones Linfield College March 2, 2019 Summary: Dramatic flip from a mild winter to a top five coldest February on record in many locations
Weather and Climate Summary and Forecast December 2017 Report
 Weather and Climate Summary and Forecast December 2017 Report Gregory V. Jones Linfield College December 5, 2017 Summary: November was relatively cool and wet from central California throughout most of
Weather and Climate Summary and Forecast August 2018 Report
 Weather and Climate Summary and Forecast August 2018 Report Gregory V. Jones Linfield College August 5, 2018 Summary: July 2018 will likely go down as one of the top five warmest July s on record for many
Weather and Climate Summary and Forecast October 2018 Report
 Weather and Climate Summary and Forecast October 2018 Report Gregory V. Jones Linfield College October 4, 2018 Summary: Much of Washington, Oregon, coastal California and the Bay Area and delta region
Weather and Climate Summary and Forecast Fall/Winter 2016
 Weather and Climate Summary and Forecast Fall/Winter 2016 Gregory V. Jones Southern Oregon University November 5, 2016 After a year where we were seemingly off by a month in terms of temperatures (March
Weather and Climate Summary and Forecast October 2017 Report
 Weather and Climate Summary and Forecast October 2017 Report Gregory V. Jones Linfield College October 4, 2017 Summary: Typical variability in September temperatures with the onset of fall conditions evident
Weather and Climate Summary and Forecast Summer 2017
 Weather and Climate Summary and Forecast Summer 2017 Gregory V. Jones Southern Oregon University August 4, 2017 July largely held true to forecast, although it ended with the start of one of the most extreme
Weather and Climate Summary and Forecast Summer 2016
 Weather and Climate Summary and Forecast Summer 2016 Gregory V. Jones Southern Oregon University June 6, 2016 May 2016 continued the warm trend for portions of the west, while providing some relief for
Weather and Climate Summary and Forecast Summer 2016
 Weather and Climate Summary and Forecast Summer 2016 Gregory V. Jones Southern Oregon University August 5, 2016 The month of July saw the continued flip, flop of the western US temperatures. It was warm
Presentation Overview. Southwestern Climate: Past, present and future. Global Energy Balance. What is climate?
 Southwestern Climate: Past, present and future Mike Crimmins Climate Science Extension Specialist Dept. of Soil, Water, & Env. Science & Arizona Cooperative Extension The University of Arizona Presentation
Weather and Climate Summary and Forecast Summer into Harvest 2016
 Weather and Climate Summary and Forecast Summer into Harvest 2016 Gregory V. Jones Southern Oregon University September 3, 2016 With school and football season starting a hint of fall is right on time
Summary of Natural Hazard Statistics for 2008 in the United States
 Summary of Natural Hazard Statistics for 2008 in the United States This National Weather Service (NWS) report summarizes fatalities, injuries and damages caused by severe weather in 2008. The NWS Office
Climate Variability and El Niño
 Climate Variability and El Niño David F. Zierden Florida State Climatologist Center for Ocean Atmospheric Prediction Studies The Florida State University UF IFAS Extenstion IST January 17, 2017 The El
JEFF JOHNSON S Winter Weather Outlook
 JEFF JOHNSON S 2017-2018 Winter Weather Outlook TABLE OF CONTENTS ABOUT THE AUTHOR Components of the seasonal outlook... 2 ENSO state/ocean temperatures... 3 Sub-seasonal outlooks... 4 Forecast models...
2015 Summer Forecast
 2015 Summer Forecast Inside This Forecast Summer 2014 Recap 2 Implications of El Niño and the PDO on the Upcoming Summer Summary of Global Indices & Oscillations Analog Year: The Midwest a battleground
Weather Outlook: 2015 Growing Season
 Weather Outlook: 2015 Growing Season Leon F. Osborne Chester Fritz Distinguished Professor Regional Weather Information Center University of North Dakota Grand Forks, North Dakota Why Should We Be Concerned?
Seasonal Climate Outlook for South Asia (June to September) Issued in May 2014
 Issued in May 2014") Ministry of Earth Sciences Earth System Science Organization India Meteorological Department WMO Regional Climate Centre (Demonstration Phase) Pune, India Seasonal Climate Outlook for South Asia (June
Ministry of Earth Sciences Earth System Science Organization India Meteorological Department WMO Regional Climate Centre (Demonstration Phase) Pune, India Seasonal Climate Outlook for South Asia (June
National Wildland Significant Fire Potential Outlook
 National Wildland Significant Fire Potential Outlook National Interagency Fire Center Predictive Services Issued: September, 2007 Wildland Fire Outlook September through December 2007 Significant fire
Impacts of the April 2013 Mean trough over central North America
 Impacts of the April 2013 Mean trough over central North America By Richard H. Grumm National Weather Service State College, PA Abstract: The mean 500 hpa flow over North America featured a trough over
INVISIBLE WATER COSTS
 Every Drop Every Counts... Drop Counts... INVISIBLE WATER COSTS Corn - 108.1 gallons per pound How much water it takes to produce... Apple - 18.5 gallons to grow Beef - 1,581 gallons per pound Oats - 122.7
The Pennsylvania Observer
 The Pennsylvania Observer January 5, 2016 December 2015 - Pennsylvania Weather Recap By: Arthur Person December is the first of the three coldest months of the year. Sometimes it can be naughty, and sometimes
What Is the Weather Like in Different Regions of the United States?
 Learning Set 1 What Is Weather, and How Is It Measured and Described? 1.3 Explore What Is the Weather Like in Different Regions of the United States? trends: patterns or tendencies you can see over a broad
ENSO Cycle: Recent Evolution, Current Status and Predictions. Update prepared by Climate Prediction Center / NCEP 5 August 2013
 ENSO Cycle: Recent Evolution, Current Status and Predictions Update prepared by Climate Prediction Center / NCEP 5 August 2013 Outline Overview Recent Evolution and Current Conditions Oceanic Niño Index
ENSO Cycle: Recent Evolution, Current Status and Predictions. Update prepared by Climate Prediction Center / NCEP 25 February 2013
 ENSO Cycle: Recent Evolution, Current Status and Predictions Update prepared by Climate Prediction Center / NCEP 25 February 2013 Outline Overview Recent Evolution and Current Conditions Oceanic Niño Index
NOAA 2015 Updated Atlantic Hurricane Season Outlook
 NOAA 2015 Updated Atlantic Hurricane Season Outlook Dr. Gerry Bell Lead Seasonal Forecaster Climate Prediction Center/ NOAA/ NWS Collaboration With National Hurricane Center/ NOAA/ NWS Hurricane Research
ENSO Cycle: Recent Evolution, Current Status and Predictions. Update prepared by Climate Prediction Center / NCEP 11 November 2013
 ENSO Cycle: Recent Evolution, Current Status and Predictions Update prepared by Climate Prediction Center / NCEP 11 November 2013 Outline Overview Recent Evolution and Current Conditions Oceanic Niño Index
ENSO: Recent Evolution, Current Status and Predictions. Update prepared by: Climate Prediction Center / NCEP 9 November 2015
 ENSO: Recent Evolution, Current Status and Predictions Update prepared by: Climate Prediction Center / NCEP 9 November 2015 Outline Summary Recent Evolution and Current Conditions Oceanic Niño Index (ONI)
UPDATE OF REGIONAL WEATHER AND SMOKE HAZE (December 2017)
") UPDATE OF REGIONAL WEATHER AND SMOKE HAZE (December 2017) 1. Review of Regional Weather Conditions for November 2017 1.1 In November 2017, Southeast Asia experienced inter-monsoon conditions in the first
UPDATE OF REGIONAL WEATHER AND SMOKE HAZE (December 2017) 1. Review of Regional Weather Conditions for November 2017 1.1 In November 2017, Southeast Asia experienced inter-monsoon conditions in the first
Upper Missouri River Basin December 2017 Calendar Year Runoff Forecast December 5, 2017
 Upper Missouri River Basin December 2017 Calendar Year Runoff Forecast December 5, 2017 Calendar Year Runoff Forecast Explanation and Purpose of Forecast U.S. Army Corps of Engineers, Northwestern Division
Here s what a weak El Nino usually brings to the nation with temperatures:
 Time again for my annual Winter Weather Outlook. Here's just a small part of the items I considered this year and how I think they will play out with our winter of 2018-2019. El Nino / La Nina: When looking
Colorado CoCoRaHS. Colorado CoCoRaHS. Because Every Drop Counts! November 2014 Volume 2, Issue 11
 U.S. PRECIPITATION (% OF AVERAGE) LOOKING BACK AT OCTOBER 2014 October was a fairly dry month for much of the nation with the exception of the Pacific Northwest, portions of New England and the Tennessee
1. Which weather map symbol is associated with extremely low air pressure? A) B) C) D) 2. The diagram below represents a weather instrument.
 B) C) D) 2. The diagram below represents a weather instrument.") 1. Which weather map symbol is associated with extremely low air pressure? 2. The diagram below represents a weather instrument. Which weather variable was this instrument designed to measure? A) air pressure
1. Which weather map symbol is associated with extremely low air pressure? 2. The diagram below represents a weather instrument. Which weather variable was this instrument designed to measure? A) air pressure
Climate Prediction Center National Centers for Environmental Prediction
 NOAA s Climate Prediction Center Monthly and Seasonal Forecast Operations Wassila M. Thiaw Climate Prediction Center National Centers for Environmental Prediction Acknowlegement: Mathew Rosencrans, Arun
Summer 2018 Southern Company Temperature/Precipitation Forecast
 Scott A. Yuknis High impact weather forecasts, climate assessment and prediction. 14 Boatwright s Loop Plymouth, MA 02360 Phone/Fax 508.927.4610 Cell: 508.813.3499 ClimateImpact@comcast.net Climate Impact
ENSO Cycle: Recent Evolution, Current Status and Predictions. Update prepared by Climate Prediction Center / NCEP 23 April 2012
 ENSO Cycle: Recent Evolution, Current Status and Predictions Update prepared by Climate Prediction Center / NCEP 23 April 2012 Outline Overview Recent Evolution and Current Conditions Oceanic Niño Index
Upper Missouri River Basin February 2018 Calendar Year Runoff Forecast February 6, 2018
 Upper Missouri River Basin February 2018 Calendar Year Runoff Forecast February 6, 2018 Calendar Year Runoff Forecast Explanation and Purpose of Forecast U.S. Army Corps of Engineers, Northwestern Division
MDA WEATHER SERVICES AG WEATHER OUTLOOK. Kyle Tapley-Senior Agricultural Meteorologist May 22, 2014 Chicago, IL
 MDA WEATHER SERVICES AG WEATHER OUTLOOK Kyle Tapley-Senior Agricultural Meteorologist May 22, 2014 Chicago, IL GLOBAL GRAIN NORTH AMERICA 2014 Agenda Spring Recap North America Forecast El Niño Discussion
KUALA LUMPUR MONSOON ACTIVITY CENT
 T KUALA LUMPUR MONSOON ACTIVITY CENT 2 ALAYSIAN METEOROLOGICAL http://www.met.gov.my DEPARTMENT MINISTRY OF SCIENCE. TECHNOLOGY AND INNOVATIO Introduction Atmospheric and oceanic conditions over the tropical
Winter Forecast. Allan Huffman RaleighWx
 Winter 2015-16 Forecast Allan Huffman RaleighWx Disclaimer Seasonal forecasting is difficult and you are always learning. I attempt to look at all factors I understand and have seen correlate in the past
Percentage of normal rainfall for April 2018 Departure from average air temperature for April 2018
 New Zealand Climate Update No 227, May 2018 Current climate April 2018 Overall, April 2018 was characterised by lower pressure than normal over and to the southeast of New Zealand. Unlike the first three
An upper to mid level circulation (Low) in the NW Caribbean is
 in the NW Caribbean is") WEEKLY WEATHER OUTLOOK BELIZE, CENTRAL AMERICA PERIOD: Monday-Monday, Oct. 1 October 8, 2012 DATE ISSUED: Monday, Oct 1, 2012 6:00 am RFrutos EcoSolutions & Services SYNOPSIS: An upper to mid level circulation
WEEKLY WEATHER OUTLOOK BELIZE, CENTRAL AMERICA PERIOD: Monday-Monday, Oct. 1 October 8, 2012 DATE ISSUED: Monday, Oct 1, 2012 6:00 am RFrutos EcoSolutions & Services SYNOPSIS: An upper to mid level circulation
Pacific Decadal Oscillation ( PDO ):
:") Time again for my annual Winter Weather Outlook. Here's just a small part of the items I considered this year and how I think they will play out with our winter of 2015-2016. El Nino / La Nina: When looking
Time again for my annual Winter Weather Outlook. Here's just a small part of the items I considered this year and how I think they will play out with our winter of 2015-2016. El Nino / La Nina: When looking
The Weather Wire. Contents: Summer 2018 Outlook. Summer 2018 Outlook Drought Monitor May Summary/Statistics June Preview Rainfall Totals
 The Weather Wire June 2018 Volume 25 Number 6 Contents: Summer 2018 Outlook Drought Monitor May Summary/Statistics June Preview Rainfall Totals Summer 2018 Outlook June 1 st marked the first day of meteorological
Seasonal Climate Watch January to May 2016
 Seasonal Climate Watch January to May 2016 Date: Dec 17, 2015 1. Advisory Most models are showing the continuation of a strong El-Niño episode towards the latesummer season with the expectation to start
Climate Outlook through 2100 South Florida Ecological Services Office Vero Beach, FL January 13, 2015
 Climate Outlook through 2100 South Florida Ecological Services Office Vero Beach, FL January 13, 2015 Short Term Drought Map: Short-term (
The Pennsylvania Observer
 The Pennsylvania Observer April 2, 2010 March 2010 Pennsylvania Weather Recap Prepared by: Katelyn Johnson March did come in as a lion cub this year. The 1 st proved to be a calm day; however most of Pennsylvania
Champaign-Urbana 1999 Annual Weather Summary
 Champaign-Urbana 1999 Annual Weather Summary ILLINOIS STATE WATER SURVEY 2204 Griffith Dr. Champaign, IL 61820 wxobsrvr@sws.uiuc.edu Maria Peters, Weather Observer A major snowstorm kicked off the new
2012 Growing Season Weather Summary for North Dakota. Adnan Akyüz and Barbara A. Mullins Department of Soil Science October 30, 2012
 2012 Growing Season Weather Summary for North Dakota Adnan Akyüz and Barbara A. Mullins Department of Soil Science October 30, 2012 Introduction The 2012 growing season (the period from April through September)
May 2016 Volume 23 Number 5
 The Weather Wire May 2016 Volume 23 Number 5 Contents: Winter Summary Current Colorado and West-wide Snow Pack Drought Monitor April Summary/Statistics May Preview Snowfall Totals Winter Summary The Front
2011 Year in Review TORNADOES
 2011 Year in Review The year 2011 had weather events that will be remembered for a long time. Two significant tornado outbreaks in April, widespread damage and power outages from Hurricane Irene in August
2015: A YEAR IN REVIEW F.S. ANSLOW
 2015: A YEAR IN REVIEW F.S. ANSLOW 1 INTRODUCTION Recently, three of the major centres for global climate monitoring determined with high confidence that 2015 was the warmest year on record, globally.
Arizona Climate Summary February 2012
 Arizona Climate Summary February 2012 Summary of conditions for January 2012 January 2012 Temperature and Precipitation Summary January 1 st 20 th : The New Year has started on a very dry note. The La
Climate Impacts to Southwest Water Sector. Dr. Dave DuBois New Mexico State Climatologist
 Climate Impacts to Southwest Water Sector Dr. Dave DuBois New Mexico State Climatologist Presented at EPA Extreme Events and Climate Adaptation Planning Workshop June 3, 2015 Water Year Precip. % of Average
ENSO Cycle: Recent Evolution, Current Status and Predictions. Update prepared by Climate Prediction Center / NCEP 24 September 2012
 ENSO Cycle: Recent Evolution, Current Status and Predictions Update prepared by Climate Prediction Center / NCEP 24 September 2012 Outline Overview Recent Evolution and Current Conditions Oceanic Niño
Meteorology 110. Lab 1. Geography and Map Skills
 Meteorology 110 Name Lab 1 Geography and Map Skills 1. Geography Weather involves maps. There s no getting around it. You must know where places are so when they are mentioned in the course it won t be
The Pennsylvania Observer
 The Pennsylvania Observer April 2, 2009 March 2009 Pennsylvania Weather Recap Prepared by Curt Harpster For the month of March the saying, In like a lion and out like a lamb really fit the pattern quite
KANSAS CLIMATE SUMMARY February 2015
 KANSAS CLIMATE SUMMARY February 2015 Extended Cold Despite some record warm readings at a few locations, February was characterized by colder than normal conditions. This was particularly true during the
National Wildland Significant Fire Potential Outlook
 National Wildland Significant Fire Potential Outlook National Interagency Fire Center Predictive Services Issued: April 1, 2008 Next Issue: May 1, 2008 Wildland Fire Outlook April 2008 through July 2008
Oregon Water Conditions Report April 17, 2017
 Oregon Water Conditions Report April 17, 2017 Mountain snowpack continues to maintain significant levels for mid-april. By late March, statewide snowpack had declined to 118 percent of normal after starting
Climate Outlook through 2100 South Florida Ecological Services Office Vero Beach, FL September 9, 2014
 Climate Outlook through 2100 South Florida Ecological Services Office Vero Beach, FL September 9, 2014 Short Term Drought Map: Short-term (
ENSO: Recent Evolution, Current Status and Predictions. Update prepared by: Climate Prediction Center / NCEP 30 October 2017
 ENSO: Recent Evolution, Current Status and Predictions Update prepared by: Climate Prediction Center / NCEP 30 October 2017 Outline Summary Recent Evolution and Current Conditions Oceanic Niño Index (ONI)
Sierra Weather and Climate Update
 Sierra Weather and Climate Update 2014-15 Kelly Redmond Western Regional Climate Center Desert Research Institute Reno Nevada Yosemite Hydroclimate Workshop Yosemite Valley, 2015 October 8-9 Percent of
Midwest/Great Plains Climate-Drought Outlook September 20, 2018
 Midwest/Great Plains Climate-Drought Outlook September 20, 2018 Brian Fuchs National Drought Mitigation Center University of Nebraska-Lincoln School of Natural Resources September 20, 2018 General Information
Winter. Here s what a weak La Nina usually brings to the nation with tempseraures:
 2017-2018 Winter Time again for my annual Winter Weather Outlook. Here's just a small part of the items I considered this year and how I think they will play out with our winter of 2017-2018. El Nino /
New Zealand Climate Update No 226, April 2018 Current climate March 2018
 New Zealand Climate Update No 226, April 2018 Current climate March 2018 March 2018 was characterised by significantly higher pressure than normal to the east of New Zealand. This pressure pattern, in
ACCUMULATED PRECIPITATION IN INCHES
 4 3 CUMULATIVE PRECIPITATION WATER YEAR 7 COLUMBIA BASIN ABOVE GRAND COULEE 18% of Normal 1971- Average ACCUMULATED PRECIPITATION IN INCHES 1 3 1 4 3 1 8 6 4 94% of Normal 17% of Normal 118% of Normal
Northwest Outlook October 2016
 Northwest Outlook October 2016 Rainfall Opportunities and Challenges Rainfall over the month of September presented some challenges for the fall harvest while other producers benefitted. Figure 1a shows
January 2011 Calendar Year Runoff Forecast
 January 2011 Calendar Year Runoff Forecast 2010 Runoff Year Calendar Year 2010 was the third highest year of runoff in the Missouri River Basin above Sioux City with 38.8 MAF, behind 1978 and 1997 which
Percentage of normal rainfall for August 2017 Departure from average air temperature for August 2017
 New Zealand Climate Update No 219, August 2017 Current climate August 2017 Overall, mean sea level pressure was lower than normal over and to the west of New Zealand during August while higher than normal
ENSO Cycle: Recent Evolution, Current Status and Predictions. Update prepared by Climate Prediction Center / NCEP 15 July 2013
 ENSO Cycle: Recent Evolution, Current Status and Predictions Update prepared by Climate Prediction Center / NCEP 15 July 2013 Outline Overview Recent Evolution and Current Conditions Oceanic Niño Index
Satellites, Weather and Climate Module??: Polar Vortex
 Satellites, Weather and Climate Module??: Polar Vortex SWAC Jan 2014 AKA Circumpolar Vortex Science or Hype? Will there be one this year? Today s objectives Pre and Post exams What is the Polar Vortex
J8.4 TRENDS OF U.S. SNOWFALL AND SNOW COVER IN A WARMING WORLD,
 J8.4 TRENDS OF U.S. SNOWFALL AND SNOW COVER IN A WARMING WORLD, 1948-2008 Richard R. Heim Jr. * NOAA National Climatic Data Center, Asheville, North Carolina 1. Introduction The Intergovernmental Panel
The Pennsylvania Observer
 The Pennsylvania Observer October 1, 2015 September 2015 - Pennsylvania Weather Recap By: Quinn Lease The month of September will be remembered for its above normal temperatures and dry conditions that
PRMS WHITE PAPER 2014 NORTH ATLANTIC HURRICANE SEASON OUTLOOK. June RMS Event Response
 PRMS WHITE PAPER 2014 NORTH ATLANTIC HURRICANE SEASON OUTLOOK June 2014 - RMS Event Response 2014 SEASON OUTLOOK The 2013 North Atlantic hurricane season saw the fewest hurricanes in the Atlantic Basin
RaysWeather.Com Winter Fearless Forecast
 Author: Dr. Ray Russell Founder and President of RaysWeather.Com Date: October 19, 2017 RaysWeather.Com 2018-2019 Winter Fearless Forecast Background Unseasonably warm weather continues this fall no frost
New Zealand Climate Update No 223, January 2018 Current climate December 2017
 New Zealand Climate Update No 223, January 2018 Current climate December 2017 December 2017 was characterised by higher than normal sea level pressure over New Zealand and the surrounding seas. This pressure
Arizona Climate Summary February 2018 Summary of conditions for January 2018
 Arizona Climate Summary February 2018 Summary of conditions for January 2018 January 2018 Temperature and Precipitation Summary January 1 st 19 th : The new year began with a ridge of high pressure over
UPDATE OF REGIONAL WEATHER AND SMOKE HAZE (February 2018)
") UPDATE OF REGIONAL WEATHER AND SMOKE HAZE (February 2018) 1. Review of Regional Weather Conditions for January 2018 1.1 The prevailing Northeast monsoon conditions over Southeast Asia strengthened in January
UPDATE OF REGIONAL WEATHER AND SMOKE HAZE (February 2018) 1. Review of Regional Weather Conditions for January 2018 1.1 The prevailing Northeast monsoon conditions over Southeast Asia strengthened in January
The New Normal or Was It?
 The New Normal or Was It? by Chuck Coffey The recent drought has caused many to reflect upon the past and wonder what is in store for the future. Just a couple of years ago, few agricultural producers