QMT 3001 BUSINESS FORECASTING. Exploring Data Patterns & An Introduction to Forecasting Techniques. Aysun KAPUCUGİL-İKİZ, PhD.
|
|
|
- Zoe Shaw
- 5 years ago
- Views:
Transcription


1 1 QMT 3001 BUSINESS FORECASTING Exploring Data Patterns & An Introduction to Forecasting Techniques Aysun KAPUCUGİL-İKİZ, PhD. Forecasting 2 1


2 3 4 2


3 5 6 3

 Generate an autocorrelation function The pattern of the autocorrelations will usually help explain the pattern of the data.")
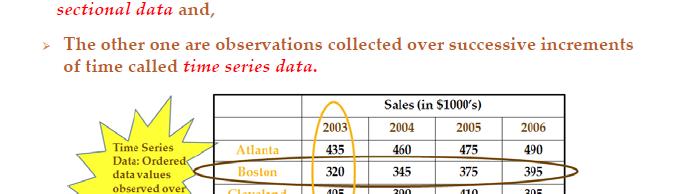
4 Time Series Data Patterns Horizontal (stationary) / Trend / Cyclical / Seasonal 7 The two steps in analyzing time series data are: (a) Graph the time series data The data should be graphed to visually see the type of pattern: is the series progressively increasing or is it decreasing through time? There are various graphing techniques available including scatter diagrams, line graphs, or bar graphs. You can choose the visual approach that is optimal for your data. (b) Generate an autocorrelation function The pattern of the autocorrelations will usually help explain the pattern of the data. The autocorrelation output will also provide you with statistical tests to determine if the autocorrelation is important (i.e., "significant" in statistical terms). 8 A stationary data series does not increase or decrease over time. 4

5 9 10 5


6 11 12 Y t = observation in time period t = observation at time period t-k Yt k 6


7


8


9 17 Stat > Time Series > Autocorrelation 18 9


10 19 randomness trend 20 seasonality Is AC significant? 10


11 21 22 The standard error is the The standard error is the difference between a predicted value and the actual value for a variable. If the autocorrelation coefficient is divided by the standard error, the outcome should be >2 for a significant outcome. 11

12 23 "Box-Ljung Statistic" (BLS) or modified Box-Pierce Q Statistic: Sa.05 or less of level of significance value of Box-Ljung, is desirable - this means the forecaster has a less than a 5% chance of being wrong in stating autocorrelation exists between two variables


13


14 27 28 r1= r2=


15 29 30 Differencing data is needed when forecasting two data patterns: 1. Data with a trend. 2. Data with a strong autocorrelation component at lag 1 (above 0.90), where the autocorrelation at subsequent lags diminishes slowly. Differencing simply generates a new time series by subtracting the current value from the previous value for the entire original series. 15


16


17


18
19 37 Examples Example: "Anna-Marie's Pools and Spas" is a chain of stores in Manitoba selling pools and pool supplies. 38 Anna-Marie is considering opening a new store in Saxon, Manitoba and has approached you as an advisor. She has a number of markets she is considering for her new store and wants to carefully examine each of these markets before making her selection. She wants to know if this is a good year to open a new store in Saxon, or if she would be better advised to wait a few years. She has asked you to examine the pattern of pool sales in Saxon in past years, using data on pool permits as a proxy for sales. Table shows this data for the last 15 years. 19
20 The first step is to graph this data over time. 39 The next step in the analysis is to generate the autocorrelation function, to see if the data is indeed random


21 Correlogram Example: Table shows the number of houses under construction (housing starts) in July in Toronto for the period 1994 to

22 Scatter graph
23 45 Housing under Construction in Toronto, Monthly, from January 1972 to May 2005 (extended the housing data series back to 1972 and include all months, rather than just July.) To illustrate a cyclical pattern 46 For forecasting purposes this indicates that the future values will depend on the last available level. However, using this approach to forecast cyclical time-series is problematic When time series data changes by small margins from period to period, the best approach is to explore how the data moves (e.g., the rate of change). "differencing". 23

24 An example of differenced data for the first five rows of the Housing Under Construction database. 47 = Differenced Data 48 24
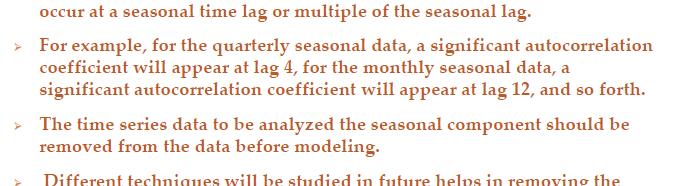
25 49 50 Example: When is the best time for the new home builder to hold open houses in order to time these with the wedding market? Table shows the number of marriages recorded in Canada from 1995 to 2004, on a quarterly basis (3 month intervals). 25

26 Side-by-side Bar Chart


27 53 The optimal forecasting technique for any given situation depends on the nature of available data and the decision to be made or problem to be solved


28


29


30 59 60 Other Factors for Choosing a Forecasting Technique: Level of Details. Time horizon. Based on judgment or data manipulation. Management acceptance. Cost. 30
31 Types of Forecasts Forecasting Techniques No single method is superior Qualitative Models: attempt to include subjective factors Time-Series Methods: include historical data over a time interval Causal Methods: include a variety of factors Delphi Methods Moving Average Regression Analysis Jury of Executive Opinion Exponential Smoothing Multiple Regression Sales Force Composite Consumer Market Survey Trend Projections Decomposition General considerations for choosing the appropriate method 62 Method Uses Considerations Jd Judgment Can C be used in the absence of Subjective Sbj i estimates are subject to the historical data (e.g. new product). Most helpful in medium- and long-term forecasts biases and motives of estimators. Causal Time series Sophisticated method Very good for medium- and long-term forecasts Easy to implement Work well when the series is relatively stable Must have historical data. Relationships can be difficult to specify Rely exclusively on past data. Most useful for short-term estimates. 31


32


33


34


35
36 72 Example: Check the quality of forecast of the data on July Housing Under Construction Compare two forecasts using: 1. the second naïve forecast (which includes a difference term) 2. moving average method The in-sample period will be 1994 to 2002, the out-of-sample check will use the years 2003 and First step: Check the errors of the forecast for autocorrelation. 36
37 Results for the naïve forecast 74 Results for the moving average forecast 75 37
38 Results for the moving average forecast 76 Second step: Check the errors for 2003 and 2004 and test which forecast produces a more accurate result
39 the "in-sample" test 78 the "out-of-sample" test 79 39
40 80 The out-of-sample test confirms the results of the in-sample test. The error measures are all much larger for the moving average forecast than they are for the naïve forecast. This confirms that the naïve forecast is superior for short-term forecasts for this data. REFERENCES 82 Business Forecasting. John E. Hanke and Dean W. Wichern, 9th Edition, Pearson Education,
Chapter 8 - Forecasting
 Chapter 8 - Forecasting Operations Management by R. Dan Reid & Nada R. Sanders 4th Edition Wiley 2010 Wiley 2010 1 Learning Objectives Identify Principles of Forecasting Explain the steps in the forecasting
Forecasting. Copyright 2015 Pearson Education, Inc.
 5 Forecasting To accompany Quantitative Analysis for Management, Twelfth Edition, by Render, Stair, Hanna and Hale Power Point slides created by Jeff Heyl Copyright 2015 Pearson Education, Inc. LEARNING
Forecasting. Chapter Copyright 2010 Pearson Education, Inc. Publishing as Prentice Hall
 Forecasting Chapter 15 15-1 Chapter Topics Forecasting Components Time Series Methods Forecast Accuracy Time Series Forecasting Using Excel Time Series Forecasting Using QM for Windows Regression Methods
Antti Salonen PPU Le 2: Forecasting 1
 - 2017 1 Forecasting Forecasts are critical inputs to business plans, annual plans, and budgets Finance, human resources, marketing, operations, and supply chain managers need forecasts to plan: output
Operations Management
 3-1 Forecasting Operations Management William J. Stevenson 8 th edition 3-2 Forecasting CHAPTER 3 Forecasting McGraw-Hill/Irwin Operations Management, Eighth Edition, by William J. Stevenson Copyright
PPU411 Antti Salonen. Forecasting. Forecasting PPU Forecasts are critical inputs to business plans, annual plans, and budgets
 - 2017 1 Forecasting Forecasts are critical inputs to business plans, annual plans, and budgets Finance, human resources, marketing, operations, and supply chain managers need forecasts to plan: output
Antti Salonen KPP Le 3: Forecasting KPP227
 - 2015 1 Forecasting Forecasts are critical inputs to business plans, annual plans, and budgets Finance, human resources, marketing, operations, and supply chain managers need forecasts to plan: output
Forecasting. Dr. Richard Jerz rjerz.com
 Forecasting Dr. Richard Jerz 1 1 Learning Objectives Describe why forecasts are used and list the elements of a good forecast. Outline the steps in the forecasting process. Describe at least three qualitative
Lecture 4 Forecasting
 King Saud University College of Computer & Information Sciences IS 466 Decision Support Systems Lecture 4 Forecasting Dr. Mourad YKHLEF The slides content is derived and adopted from many references Outline
CP:
 Adeng Pustikaningsih, M.Si. Dosen Jurusan Pendidikan Akuntansi Fakultas Ekonomi Universitas Negeri Yogyakarta CP: 08 222 180 1695 Email : adengpustikaningsih@uny.ac.id Operations Management Forecasting
Forecasting Chapter 3
 Forecasting Chapter 3 Introduction Current factors and conditions Past experience in a similar situation 2 Accounting. New product/process cost estimates, profit projections, cash management. Finance.
Chapter 5: Forecasting
 1 Textbook: pp. 165-202 Chapter 5: Forecasting Every day, managers make decisions without knowing what will happen in the future 2 Learning Objectives After completing this chapter, students will be able
Dennis Bricker Dept of Mechanical & Industrial Engineering The University of Iowa. Forecasting demand 02/06/03 page 1 of 34
 demand -5-4 -3-2 -1 0 1 2 3 Dennis Bricker Dept of Mechanical & Industrial Engineering The University of Iowa Forecasting demand 02/06/03 page 1 of 34 Forecasting is very difficult. especially about the
Forecasting. Operations Analysis and Improvement Spring
 Forecasting Operations Analysis and Improvement 2015 Spring Dr. Tai-Yue Wang Industrial and Information Management Department National Cheng Kung University 1-2 Outline Introduction to Forecasting Subjective
Copyright 2010 Pearson Education, Inc. Publishing as Prentice Hall.
 13 Forecasting PowerPoint Slides by Jeff Heyl For Operations Management, 9e by Krajewski/Ritzman/Malhotra 2010 Pearson Education 13 1 Forecasting Forecasts are critical inputs to business plans, annual
Forecasting: The First Step in Demand Planning
 Forecasting: The First Step in Demand Planning Jayant Rajgopal, Ph.D., P.E. University of Pittsburgh Pittsburgh, PA 15261 In a supply chain context, forecasting is the estimation of future demand General
Time-Series Analysis. Dr. Seetha Bandara Dept. of Economics MA_ECON
 Time-Series Analysis Dr. Seetha Bandara Dept. of Economics MA_ECON Time Series Patterns A time series is a sequence of observations on a variable measured at successive points in time or over successive
BUSI 460 Suggested Answers to Selected Review and Discussion Questions Lesson 7
 BUSI 460 Suggested Answers to Selected Review and Discussion Questions Lesson 7 1. The definitions follow: (a) Time series: Time series data, also known as a data series, consists of observations on a
Introduction to Forecasting
 Introduction to Forecasting Introduction to Forecasting Predicting the future Not an exact science but instead consists of a set of statistical tools and techniques that are supported by human judgment
Chapter 7 Forecasting Demand
 Chapter 7 Forecasting Demand Aims of the Chapter After reading this chapter you should be able to do the following: discuss the role of forecasting in inventory management; review different approaches
STAT 115: Introductory Methods for Time Series Analysis and Forecasting. Concepts and Techniques
 STAT 115: Introductory Methods for Time Series Analysis and Forecasting Concepts and Techniques School of Statistics University of the Philippines Diliman 1 FORECASTING Forecasting is an activity that
Demand and Supply Integration:
 Demand and Supply Integration: The Key to World-Class Demand Forecasting Mark A. Moon FT Press Contents Preface xxi Chapter 1 Demand/Supply Integration 1 the Idea Behind DSI 2 How DSI Is Different from
Glossary. The ISI glossary of statistical terms provides definitions in a number of different languages:
 Glossary The ISI glossary of statistical terms provides definitions in a number of different languages: http://isi.cbs.nl/glossary/index.htm Adjusted r 2 Adjusted R squared measures the proportion of the
Assistant Prof. Abed Schokry. Operations and Productions Management. First Semester
 Chapter 3 Forecasting Assistant Prof. Abed Schokry Operations and Productions Management First Semester 2010 2011 Chapter 3: Learning Outcomes You should be able to: List the elements of a good forecast
DEPARTMENT OF QUANTITATIVE METHODS & INFORMATION SYSTEMS
 DEPARTMENT OF QUANTITATIVE METHODS & INFORMATION SYSTEMS Moving Averages and Smoothing Methods ECON 504 Chapter 7 Fall 2013 Dr. Mohammad Zainal 2 This chapter will describe three simple approaches to forecasting
Chapter 13: Forecasting
 Chapter 13: Forecasting Assistant Prof. Abed Schokry Operations and Productions Management First Semester 2013-2014 Chapter 13: Learning Outcomes You should be able to: List the elements of a good forecast
Time Series Analysis -- An Introduction -- AMS 586
 Time Series Analysis -- An Introduction -- AMS 586 1 Objectives of time series analysis Data description Data interpretation Modeling Control Prediction & Forecasting 2 Time-Series Data Numerical data
Forecasting. BUS 735: Business Decision Making and Research. exercises. Assess what we have learned
 Forecasting BUS 735: Business Decision Making and Research 1 1.1 Goals and Agenda Goals and Agenda Learning Objective Learn how to identify regularities in time series data Learn popular univariate time
Diploma Part 2. Quantitative Methods. Examiner s Suggested Answers
 Diploma Part Quantitative Methods Examiner s Suggested Answers Question 1 (a) The standard normal distribution has a symmetrical and bell-shaped graph with a mean of zero and a standard deviation equal
Some Personal Perspectives on Demand Forecasting Past, Present, Future
 Some Personal Perspectives on Demand Forecasting Past, Present, Future Hans Levenbach, PhD Delphus, Inc. INFORMS Luncheon Penn Club, NYC Presentation Overview Introduction Demand Analysis and Forecasting
Year 10 Mathematics Semester 2 Bivariate Data Chapter 13
 Year 10 Mathematics Semester 2 Bivariate Data Chapter 13 Why learn this? Observations of two or more variables are often recorded, for example, the heights and weights of individuals. Studying the data
INTRODUCTION TO FORECASTING (PART 2) AMAT 167
 AMAT 167") INTRODUCTION TO FORECASTING (PART 2) AMAT 167 Techniques for Trend EXAMPLE OF TRENDS In our discussion, we will focus on linear trend but here are examples of nonlinear trends: EXAMPLE OF TRENDS If you
INTRODUCTION TO FORECASTING (PART 2) AMAT 167 Techniques for Trend EXAMPLE OF TRENDS In our discussion, we will focus on linear trend but here are examples of nonlinear trends: EXAMPLE OF TRENDS If you
The SAB Medium Term Sales Forecasting System : From Data to Planning Information. Kenneth Carden SAB : Beer Division Planning
 The SAB Medium Term Sales Forecasting System : From Data to Planning Information Kenneth Carden SAB : Beer Division Planning Planning in Beer Division F Operational planning = what, when, where & how F
Forecasting. Simon Shaw 2005/06 Semester II
 Forecasting Simon Shaw s.c.shaw@maths.bath.ac.uk 2005/06 Semester II 1 Introduction A critical aspect of managing any business is planning for the future. events is called forecasting. Predicting future
Time Series and Forecasting
 Time Series and Forecasting Introduction to Forecasting n What is forecasting? n Primary Function is to Predict the Future using (time series related or other) data we have in hand n Why are we interested?
Warwick Business School Forecasting System. Summary. Ana Galvao, Anthony Garratt and James Mitchell November, 2014
 Warwick Business School Forecasting System Summary Ana Galvao, Anthony Garratt and James Mitchell November, 21 The main objective of the Warwick Business School Forecasting System is to provide competitive
Industrial Engineering Prof. Inderdeep Singh Department of Mechanical & Industrial Engineering Indian Institute of Technology, Roorkee
 Industrial Engineering Prof. Inderdeep Singh Department of Mechanical & Industrial Engineering Indian Institute of Technology, Roorkee Module - 04 Lecture - 05 Sales Forecasting - II A very warm welcome
Time Series and Forecasting
 Time Series and Forecasting Introduction to Forecasting n What is forecasting? n Primary Function is to Predict the Future using (time series related or other) data we have in hand n Why are we interested?
3. If a forecast is too high when compared to an actual outcome, will that forecast error be positive or negative?
 1. Does a moving average forecast become more or less responsive to changes in a data series when more data points are included in the average? 2. Does an exponential smoothing forecast become more or
15 yaş üstü istihdam ( )
") Forecasting 1-2 Forecasting 23 000 15 yaş üstü istihdam (2005-2008) 22 000 21 000 20 000 19 000 18 000 17 000 - What can we say about this data? - Can you guess the employement level for July 2013? 1-3
Forecasting 1-2 Forecasting 23 000 15 yaş üstü istihdam (2005-2008) 22 000 21 000 20 000 19 000 18 000 17 000 - What can we say about this data? - Can you guess the employement level for July 2013? 1-3
Ch. 12: Workload Forecasting
 Ch. 12: Workload Forecasting Kenneth Mitchell School of Computing & Engineering, University of Missouri-Kansas City, Kansas City, MO 64110 Kenneth Mitchell, CS & EE dept., SCE, UMKC p. 1/2 Introduction
Forecasting Using Time Series Models
 Forecasting Using Time Series Models Dr. J Katyayani 1, M Jahnavi 2 Pothugunta Krishna Prasad 3 1 Professor, Department of MBA, SPMVV, Tirupati, India 2 Assistant Professor, Koshys Institute of Management
Forecasting & Predictive Analytics. with ForecastX. Seventh Edition. John Galt Solutions, Inc. Chicago
 Forecasting & Predictive Analytics with ForecastX Seventh Edition Barry Keating University ofnotre Dame J. Holton Wilson Central Michigan University John Galt Solutions, Inc. Chicago Boston Burr Ridge,
14. Time- Series data visualization. Prof. Tulasi Prasad Sariki SCSE, VIT, Chennai
 14. Time- Series data visualization Prof. Tulasi Prasad Sariki SCSE, VIT, Chennai www.learnersdesk.weebly.com Overview What is forecasting Time series & its components Smooth a data series Moving average
Lecture Prepared By: Mohammad Kamrul Arefin Lecturer, School of Business, North South University
 Lecture 15 20 Prepared By: Mohammad Kamrul Arefin Lecturer, School of Business, North South University Modeling for Time Series Forecasting Forecasting is a necessary input to planning, whether in business,
Data presented in graphs, charts, tables, lists and databases may be misleading and must be examined carefully. Largest Land Mammals.
 Analyzing Data Reasonableness of Data and Results Data presented in graphs, charts, tables, lists and databases may be misleading and must be examined carefully. Examples A) Largest Land Mammals 4 (In
TIME SERIES ANALYSIS AND FORECASTING USING THE STATISTICAL MODEL ARIMA
 CHAPTER 6 TIME SERIES ANALYSIS AND FORECASTING USING THE STATISTICAL MODEL ARIMA 6.1. Introduction A time series is a sequence of observations ordered in time. A basic assumption in the time series analysis
Forecasting Models Selection Mechanism for Supply Chain Demand Estimation
 Available online at www.sciencedirect.com ScienceDirect Procedia Computer Science 55 (2015 ) 1060 1068 Information Technology and Quantitative Management (ITQM 2015) Forecasting Models Selection Mechanism
The Art of Forecasting
 Time Series The Art of Forecasting Learning Objectives Describe what forecasting is Explain time series & its components Smooth a data series Moving average Exponential smoothing Forecast using trend models
A B C 1 Robert's Drugs 2 3 Week (t ) Sales t. Forec t
 Sales t. Forec t") Chapter 7 Forecasting Quantitative Approaches to Forecasting The Components of a Time Series Measures of Forecast Accuracy Using Smoothing Methods in Forecasting Using Seasonal Components in Forecasting
Chapter 7 Forecasting Quantitative Approaches to Forecasting The Components of a Time Series Measures of Forecast Accuracy Using Smoothing Methods in Forecasting Using Seasonal Components in Forecasting
MODELING INFLATION RATES IN NIGERIA: BOX-JENKINS APPROACH. I. U. Moffat and A. E. David Department of Mathematics & Statistics, University of Uyo, Uyo
 Vol.4, No.2, pp.2-27, April 216 MODELING INFLATION RATES IN NIGERIA: BOX-JENKINS APPROACH I. U. Moffat and A. E. David Department of Mathematics & Statistics, University of Uyo, Uyo ABSTRACT: This study
Minitab Project Report - Assignment 6
 .. Sunspot data Minitab Project Report - Assignment Time Series Plot of y Time Series Plot of X y X 7 9 7 9 The data have a wavy pattern. However, they do not show any seasonality. There seem to be an
Operations Management
 Operations Management Chapter 4 Forecasting PowerPoint presentation to accompany Heizer/Render Principles of Operations Management, 7e Operations Management, 9e 2008 Prentice Hall, Inc. 4 1 Outline Global
FORECASTING STANDARDS CHECKLIST
 FORECASTING STANDARDS CHECKLIST An electronic version of this checklist is available on the Forecasting Principles Web site. PROBLEM 1. Setting Objectives 1.1. Describe decisions that might be affected
Firstly, the dataset is cleaned and the years and months are separated to provide better distinction (sample below).
.") Project: Forecasting Sales Step 1: Plan Your Analysis Answer the following questions to help you plan out your analysis: 1. Does the dataset meet the criteria of a time series dataset? Make sure to explore
Project: Forecasting Sales Step 1: Plan Your Analysis Answer the following questions to help you plan out your analysis: 1. Does the dataset meet the criteria of a time series dataset? Make sure to explore
Solar irradiance forecasting for Chulalongkorn University location using time series models
 Senior Project Proposal 2102490 Year 2016 Solar irradiance forecasting for Chulalongkorn University location using time series models Vichaya Layanun ID 5630550721 Advisor: Assist. Prof. Jitkomut Songsiri
CHAPTER 14. Time Series Analysis and Forecasting STATISTICS IN PRACTICE:
 CHAPTER 14 Time Series Analysis and Forecasting CONTENTS STATISTICS IN PRACTICE: Nevada Occupational Health Clinic 14.1 Time Series Patterns Horizontal Pattern Trend Pattern Seasonal Pattern Trend and
CHAPTER 18. Time Series Analysis and Forecasting
 CHAPTER 18 Time Series Analysis and Forecasting CONTENTS STATISTICS IN PRACTICE: NEVADA OCCUPATIONAL HEALTH CLINIC 18.1 TIME SERIES PATTERNS Horizontal Pattern Trend Pattern Seasonal Pattern Trend and
Chapter 3: Regression Methods for Trends
 Chapter 3: Regression Methods for Trends Time series exhibiting trends over time have a mean function that is some simple function (not necessarily constant) of time. The example random walk graph from
A Dynamic Combination and Selection Approach to Demand Forecasting
 A Dynamic Combination and Selection Approach to Demand Forecasting By Harsukhvir Singh Godrei and Olajide Olugbenga Oyeyipo Thesis Advisor: Dr. Asad Ata Summary: This research presents a dynamic approach
Time Series Analysis of United States of America Crude Oil and Petroleum Products Importations from Saudi Arabia
 International Journal of Applied Science and Technology Vol. 5, No. 5; October 2015 Time Series Analysis of United States of America Crude Oil and Petroleum Products Importations from Saudi Arabia Olayan
Paper SA-08. Are Sales Figures in Line With Expectations? Using PROC ARIMA in SAS to Forecast Company Revenue
 Paper SA-08 Are Sales Figures in Line With Expectations? Using PROC ARIMA in SAS to Forecast Company Revenue Saveth Ho and Brian Van Dorn, Deluxe Corporation, Shoreview, MN ABSTRACT The distribution of
Comparing the Univariate Modeling Techniques, Box-Jenkins and Artificial Neural Network (ANN) for Measuring of Climate Index
 for Measuring of Climate Index") Applied Mathematical Sciences, Vol. 8, 2014, no. 32, 1557-1568 HIKARI Ltd, www.m-hikari.com http://dx.doi.org/10.12988/ams.2014.4150 Comparing the Univariate Modeling Techniques, Box-Jenkins and Artificial
Applied Mathematical Sciences, Vol. 8, 2014, no. 32, 1557-1568 HIKARI Ltd, www.m-hikari.com http://dx.doi.org/10.12988/ams.2014.4150 Comparing the Univariate Modeling Techniques, Box-Jenkins and Artificial
Advances in promotional modelling and analytics
 Advances in promotional modelling and analytics High School of Economics St. Petersburg 25 May 2016 Nikolaos Kourentzes n.kourentzes@lancaster.ac.uk O u t l i n e 1. What is forecasting? 2. Forecasting,
Lecture Prepared By: Mohammad Kamrul Arefin Lecturer, School of Business, North South University
 Lecture 15 20 Prepared By: Mohammad Kamrul Arefin Lecturer, School of Business, North South University Modeling for Time Series Forecasting Forecasting is a necessary input to planning, whether in business,
Time series and Forecasting
 Chapter 2 Time series and Forecasting 2.1 Introduction Data are frequently recorded at regular time intervals, for instance, daily stock market indices, the monthly rate of inflation or annual profit figures.
Suan Sunandha Rajabhat University
 Forecasting Exchange Rate between Thai Baht and the US Dollar Using Time Series Analysis Kunya Bowornchockchai Suan Sunandha Rajabhat University INTRODUCTION The objective of this research is to forecast
Time Series Analysis
 Time Series Analysis A time series is a sequence of observations made: 1) over a continuous time interval, 2) of successive measurements across that interval, 3) using equal spacing between consecutive
Rob J Hyndman. Forecasting using. 3. Autocorrelation and seasonality OTexts.com/fpp/2/ OTexts.com/fpp/6/1. Forecasting using R 1
 Rob J Hyndman Forecasting using 3. Autocorrelation and seasonality OTexts.com/fpp/2/ OTexts.com/fpp/6/1 Forecasting using R 1 Outline 1 Time series graphics 2 Seasonal or cyclic? 3 Autocorrelation Forecasting
SOLVING PROBLEMS BASED ON WINQSB FORECASTING TECHNIQUES
 SOLVING PROBLEMS BASED ON WINQSB FORECASTING TECHNIQUES Mihaela - Lavinia CIOBANICA, Camelia BOARCAS Spiru Haret University, Unirii Street, Constanta, Romania mihaelavinia@yahoo.com, lady.camelia.yahoo.com
Application of Quantitative Forecasting Models in a Manufacturing Industry
 Application of Quantitative Forecasting Models in a Manufacturing Industry Akeem Olanrewaju Salami 1* Kyrian Kelechi Okpara 2 Rahman Oladimeji Mustapha 2 1.Department of Business Administration, Federal
Forecasting using R. Rob J Hyndman. 2.3 Stationarity and differencing. Forecasting using R 1
 Forecasting using R Rob J Hyndman 2.3 Stationarity and differencing Forecasting using R 1 Outline 1 Stationarity 2 Differencing 3 Unit root tests 4 Lab session 10 5 Backshift notation Forecasting using
References. 1. Russel et al., Operations Managemnt, 4 th edition. Management 3. Dr-Ing. Daniel Kitaw, Industrial Management and Engineering Economy
 Forecasting References 1. Russel et al., Operations Managemnt, 4 th edition 2. Buffa et al., Production and Operations Management 3. Dr-Ing. Daniel Kitaw, Industrial Management and Engineering Economy
Overview. Overview. Overview. Specific Examples. General Examples. Bivariate Regression & Correlation
 Bivariate Regression & Correlation Overview The Scatter Diagram Two Examples: Education & Prestige Correlation Coefficient Bivariate Linear Regression Line SPSS Output Interpretation Covariance ou already
Decision 411: Class 9. HW#3 issues
 Decision 411: Class 9 Presentation/discussion of HW#3 Introduction to ARIMA models Rules for fitting nonseasonal models Differencing and stationarity Reading the tea leaves : : ACF and PACF plots Unit
CHAPTER 1: Decomposition Methods
 CHAPTER 1: Decomposition Methods Prof. Alan Wan 1 / 48 Table of contents 1. Data Types and Causal vs.time Series Models 2 / 48 Types of Data Time series data: a sequence of observations measured over time,
FORECASTING AND MODEL SELECTION
 FORECASTING AND MODEL SELECTION Anurag Prasad Department of Mathematics and Statistics Indian Institute of Technology Kanpur, India REACH Symposium, March 15-18, 2008 1 Forecasting and Model Selection
Using Temporal Hierarchies to Predict Tourism Demand
 Using Temporal Hierarchies to Predict Tourism Demand International Symposium on Forecasting 29 th June 2015 Nikolaos Kourentzes Lancaster University George Athanasopoulos Monash University n.kourentzes@lancaster.ac.uk
Applied Modeling & Forecasting. Chapter 1
 DEPARTMENT OF QUANTITATIVE METHODS & INFORMATION SYSTEMS Applied Modeling & Forecasting QMIS 320 Chapter 1 Fall 2010 Dr. Mohammad Zainal 2 What is Forecasting? It is the process of analyzing current and
CHAPTER 8 FORECASTING PRACTICE I
 CHAPTER 8 FORECASTING PRACTICE I Sometimes we find time series with mixed AR and MA properties (ACF and PACF) We then can use mixed models: ARMA(p,q) These slides are based on: González-Rivera: Forecasting
Forecasting models and methods
 Forecasting models and methods Giovanni Righini Università degli Studi di Milano Logistics Forecasting methods Forecasting methods are used to obtain information to support decision processes based on
3 Time Series Regression
 3 Time Series Regression 3.1 Modelling Trend Using Regression Random Walk 2 0 2 4 6 8 Random Walk 0 2 4 6 8 0 10 20 30 40 50 60 (a) Time 0 10 20 30 40 50 60 (b) Time Random Walk 8 6 4 2 0 Random Walk 0
Two-Variable Analysis: Simple Linear Regression/ Correlation
 Two-Variable Analysis: Simple Linear Regression/ Correlation 1 Topics I. Scatter Plot (X-Y Graph) II. III. Simple Linear Regression Correlation, R IV. Assessing Model Accuracy, R 2 V. Regression Abuses
Robust control charts for time series data
 Robust control charts for time series data Christophe Croux K.U. Leuven & Tilburg University Sarah Gelper Erasmus University Rotterdam Koen Mahieu K.U. Leuven Abstract This article presents a control chart
Time Series Analysis. Smoothing Time Series. 2) assessment of/accounting for seasonality. 3) assessment of/exploiting "serial correlation"
 assessment of/accounting for seasonality. 3) assessment of/exploiting serial correlation") Time Series Analysis 2) assessment of/accounting for seasonality This (not surprisingly) concerns the analysis of data collected over time... weekly values, monthly values, quarterly values, yearly values,
Time Series Analysis 2) assessment of/accounting for seasonality This (not surprisingly) concerns the analysis of data collected over time... weekly values, monthly values, quarterly values, yearly values,
STAT Regression Methods
 STAT 501 - Regression Methods Unit 9 Examples Example 1: Quake Data Let y t = the annual number of worldwide earthquakes with magnitude greater than 7 on the Richter scale for n = 99 years. Figure 1 gives
Chapter 12: An introduction to Time Series Analysis. Chapter 12: An introduction to Time Series Analysis
 Chapter 12: An introduction to Time Series Analysis Introduction In this chapter, we will discuss forecasting with single-series (univariate) Box-Jenkins models. The common name of the models is Auto-Regressive
A COMPARISON OF REGIONAL FORECASTING TECHNIQUES
 A COMPARISON OF REGIONAL FORECASTING TECHNIQUES John E. Connaughton and Ronald A. Madsen* 1. Introduction The need for regional econometric forecasting models and the uses of their results has increased
at least 50 and preferably 100 observations should be available to build a proper model
 III Box-Jenkins Methods 1. Pros and Cons of ARIMA Forecasting a) need for data at least 50 and preferably 100 observations should be available to build a proper model used most frequently for hourly or
Applied Modeling & Forecasting QMIS 320 Chapter 1
 DEPARTMENT OF QUANTITATIVE METHODS & INFORMATION SYSTEMS Applied Modeling & Forecasting QMIS 320 Chapter 1 Fall 2010 Dr. Mohammad Zainal 2 What is Forecasting? It is the process of analyzing current and
Read Section 1.1, Examples of time series, on pages 1-8. These example introduce the book; you are not tested on them.
 TS Module 1 Time series overview (The attached PDF file has better formatting.)! Model building! Time series plots Read Section 1.1, Examples of time series, on pages 1-8. These example introduce the book;
SELECTION CRITERIA TO STATISTICAL MODELS
 Dayalbagh Educational Institute From the SelectedWorks of D. K. Chaturvedi Dr. Spring February 15, 2010 SELECTION CRITERIA TO STATISTICAL MODELS D. K. Chaturvedi, Dayalbagh Educational Institute Available
Graphing Equations in Slope-Intercept Form 4.1. Positive Slope Negative Slope 0 slope No Slope
 Slope-Intercept Form y = mx + b m = slope b = y-intercept Graphing Equations in Slope-Intercept Form 4.1 Positive Slope Negative Slope 0 slope No Slope Example 1 Write an equation in slope-intercept form
Forecasting: principles and practice 1
 Forecasting: principles and practice Rob J Hyndman 2.3 Stationarity and differencing Forecasting: principles and practice 1 Outline 1 Stationarity 2 Differencing 3 Unit root tests 4 Lab session 10 5 Backshift
Business Cycle Dating Committee of the Centre for Economic Policy Research. 1. The CEPR Business Cycle Dating Committee
 Business Cycle Dating Committee of the Centre for Economic Policy Research Michael Artis Fabio Canova Jordi Gali Francesco Giavazzi Richard Portes (President, CEPR) Lucrezia Reichlin (Chair) Harald Uhlig
PhD/MA Econometrics Examination. January, 2015 PART A. (Answer any TWO from Part A)
") PhD/MA Econometrics Examination January, 2015 Total Time: 8 hours MA students are required to answer from A and B. PhD students are required to answer from A, B, and C. PART A (Answer any TWO from Part
PhD/MA Econometrics Examination January, 2015 Total Time: 8 hours MA students are required to answer from A and B. PhD students are required to answer from A, B, and C. PART A (Answer any TWO from Part
YEAR 10 GENERAL MATHEMATICS 2017 STRAND: BIVARIATE DATA PART II CHAPTER 12 RESIDUAL ANALYSIS, LINEARITY AND TIME SERIES
 YEAR 10 GENERAL MATHEMATICS 2017 STRAND: BIVARIATE DATA PART II CHAPTER 12 RESIDUAL ANALYSIS, LINEARITY AND TIME SERIES This topic includes: Transformation of data to linearity to establish relationships
HEALTHCARE. 5 Components of Accurate Rolling Forecasts in Healthcare
 HEALTHCARE 5 Components of Accurate Rolling Forecasts in Healthcare Introduction Rolling Forecasts Improve Accuracy and Optimize Decisions Accurate budgeting, planning, and forecasting are essential for
Univariate ARIMA Models
 Univariate ARIMA Models ARIMA Model Building Steps: Identification: Using graphs, statistics, ACFs and PACFs, transformations, etc. to achieve stationary and tentatively identify patterns and model components.
FORECASTING METHODS AND APPLICATIONS SPYROS MAKRIDAKIS STEVEN С WHEELWRIGHT. European Institute of Business Administration. Harvard Business School
 FORECASTING METHODS AND APPLICATIONS SPYROS MAKRIDAKIS European Institute of Business Administration (INSEAD) STEVEN С WHEELWRIGHT Harvard Business School. JOHN WILEY & SONS SANTA BARBARA NEW YORK CHICHESTER