The Success of Weather Prediction required A. MEASUREMENTS that describe the phenomena to be predicted
|
|
|
- Mavis Perry
- 5 years ago
- Views:
Transcription
1 The character Henchard in Thomas Hardyʼs novel, The Mayor of Casterbridge, has the following exchange with a man of curious repute as a forecaster or weather-prophet. Now, for instance, can ye charm away warts? Without trouble. Cure the evil? That I ve done with consideration if they will wear the toad-bag by night as well as by day. Forecast the weather? With labour and time. Then take this, said Henchard. Tis a crown-piece. Now, what is the harvest fortnight to be? When can I know? I ve worked it out already, and you can know at once. (The fact was that five farmers had already been there on the same errand from different parts of the country.) By the sun, moon, and stars, by the clouds, the winds, the trees, and grass, the candle-flame and swallows, the smell of the herbs; likewise by the cat s eyes, the ravens, the leeches, the spiders, and the dung-mixen, the last fortnight in August will be rain and tempest. You are not certain, of course? As one can be in a world where all s unsure.
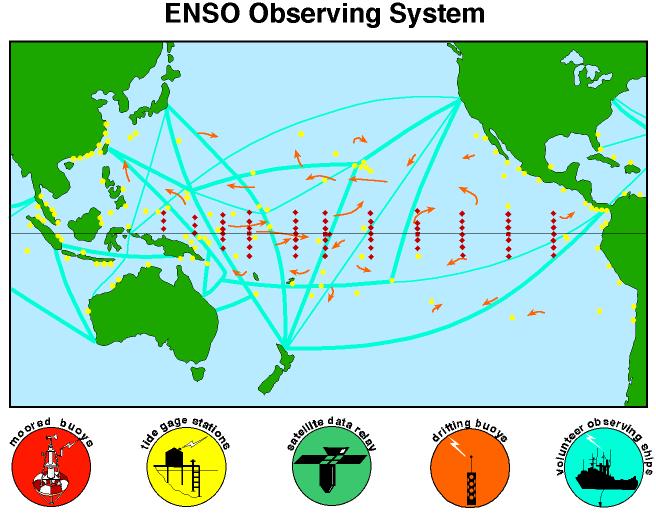
2 The Success of Weather Prediction required A. MEASUREMENTS that describe the phenomena to be predicted B. HIERARCHY of MODELS from Highly idealized models that provide explanations, and a vocabulary, by focusing on certain processes in isolation. Energy conservation convection (1860 s) Baroclinic Instability.. (1950 s) to Complex, realistic models for predictions. To develop adequate PARAMETERIZATIONS of sub-grid scale processes, it is essential to observe MANY realizations of the weather. The weather never repeats itself so that each day is a new test for the models. C. A Continual Interplay between A and B
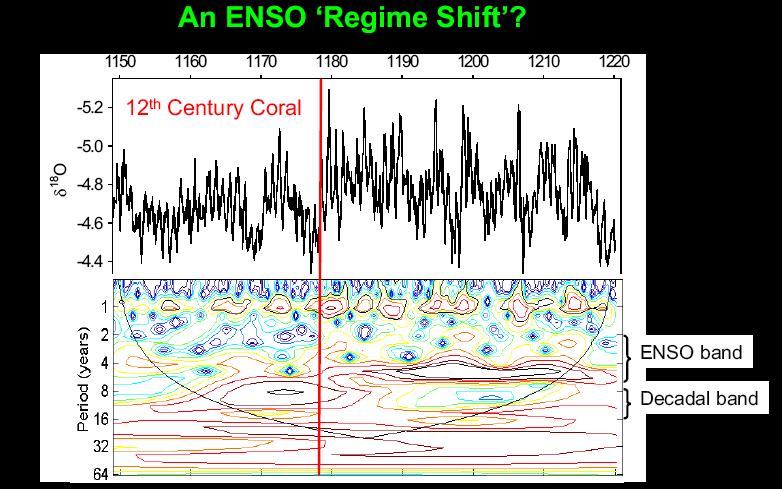
3 Today, the prediction of El Nino is where weather forecasting was in the 1960 s: (a) (b) (c) Available Measurements describe only a generic El Nino. Idealized models provide explanations for the salient features of the phenomena. Realistic models capable of reliable predictions do not exist. Proof: Thus far, every El Nino has surprised us. That was the case in 1982, 1992, 1997, and will probably be the case next time. Each El Nino is distinct and we have observed an insufficient number of realizations. Because El Nino occurs every 4 to 5 years, we are likely to see significant progress 40 to 50 years hence. Alternative: Turn to paleo-data even though there are problems measurements of proxies for temp? rainfall?. measurements at one (random?) location.
4
5
6 Tentative explanations for Rapid Changes in the properties of El Nino A. The Southern Oscillation = El Nino + La Nina correspond to natural modes of oscillation of the coupled ocean atmosphere. B. The continually changing background state alters the properties of the modes. (Stability analyses describe the dependence of mode properties on the background state.) C. Weak nonlinearities introduce an additional degree of chaos D. The presence of random noise (weather for example) interferes with the mode and severely limits deterministic predictions. (The intensity of El Nino of 1997 could not have been predicted deterministically.) ANALOGY A weakly damped pendulum that is sustained by random disturbances, while the length of the pendulum fluctuates gradually.
7 Two Ways for Inducing Similar Changes in Sea Surface Temperature Patterns ADIABATIC DIABATIC
8 SUMMARY We have a reasonably good understanding of El Nino in general, but at present the predictions by means of models have little (if any) skill. Deterministic forecasts may be possible only for very short periods. To overcome the problem of meager observations (realizations) paleo data can help. The apparent agreement between extended paleo-records, and simulations with idealized models, is questionable.

9 Sea Surface Temperature variations along the equator Longitude Time (years)
")
10 PERIOD Years Depth of Thermocline (meters) GROWTH RATE
11 Delayed Oscillator Mode: Local upwelling Mode
12
13
14

15 Precipitation (mm/day) Sea Surface Temperature
16 March El Niño October La Niña
")

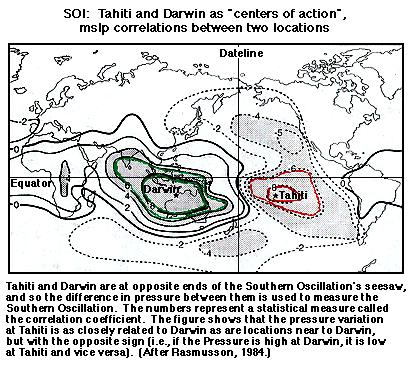
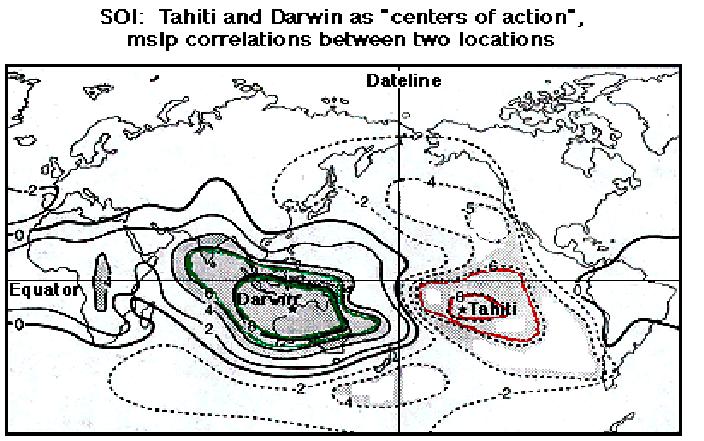
17 Atmospheric Pressure at Sea Level as measured at Darwin (Australia) and Tahiti. Sea Surface Temperature variations near the Galapagos Islands
18
19
20
21 τ H Basic State Parameters: Thermocline depth H, Winds τ

22 (m) Increase in SST of eastern equatorial Pacific in response to increase in radiation of 5watts/m2
23
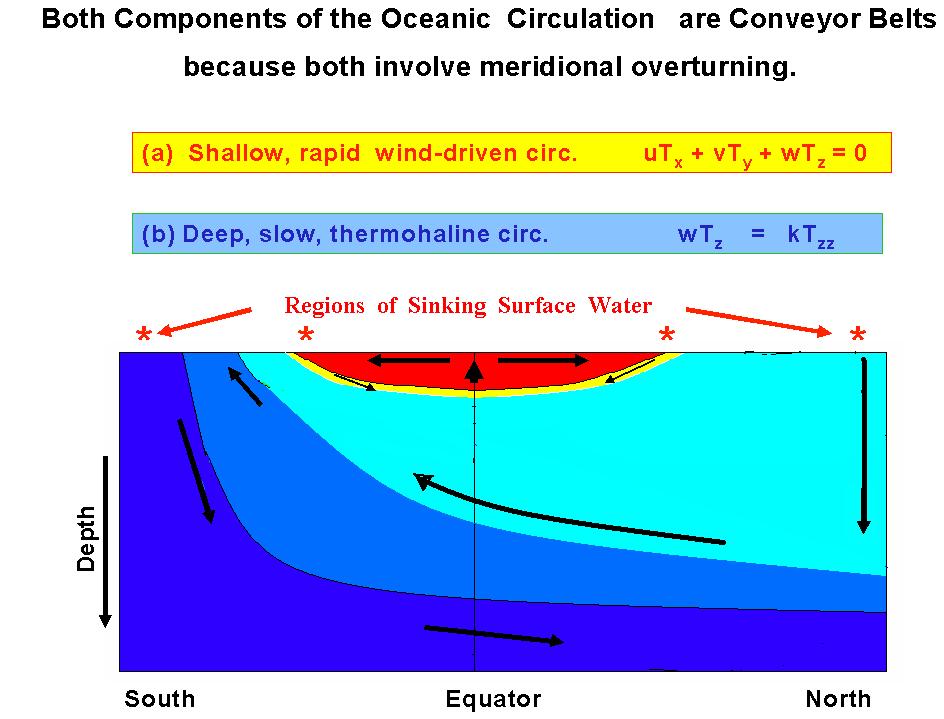
24
25
26
27
28 CONFUCIUS:


29 March El Niño October La Niña

30 Sea Surface Temperature Rainfall mm/day
31 Two Ways for Inducing Similar Changes in Sea Surface Temperature Patterns ADIABATIC DIABATIC
")
32 Identifying the processes that can cause EL Grande is equivalent to explaining why the thermocline is so shallow, and answering the question: WHY IS THE OCEAN SO COLD? Depth Temperature along a section in the mid-pacific (152W)


33 The Slow, Deep Thermohaline Circulation Antarctic Circumpolar Current The Shallow, Swift Wind-driven Circulation
34


35 Heat Flux across the Ocean Surface Watts/m 2 Da Silva
36 Boccaletti et al 2004 The constraint of a balanced heat budget for the ocean strongly influences the depth of the thermocline. Reduced heat loss implies reduced heat gain and hence a deepening of the thermocline. Increased heat loss implies increased heat and hence a shoaling of the thermocline. The oceanic heat budget can be affected by either warming or freshening the surface waters.
37 Response of the wind-driven circulation to a freshening of the extra-tropics. Temperature Along the Equator Looking Down
38 Forced Variations in heat Loss Response in Heat Gain 2 Years 5 Years 10 Years 20 Years
39 A FRESHENING or WARMING of HIGH LATITUDE SURFACE WATERS AFFECTS A. THE THERMOHALINE CIRCULATION (and thus the northern Atlantic Ocean) AND ALSO B. THE WIND-DRIVEN CIRCULATION (and thus can induce permanent EL Nino conditions) Diffusivity of the ocean = k: For large k (as in coarse resolution models) Thermohaline effects dominate. For small k.. Wind-driven effects dominate A decrease in oceanic heat loss can cause (a) a weaker thermohaline circulation and (b) a deeper equatorial thermocline a tendency towards a permanent El Nino.

40 Sea Surface Temperature How Air-Sea Interactions affect SST in response to increase in solar radiation of 5 W/sq m Thermocline depth
41 Next step: Include ocean-atmosphere interactions. A deeper equatorial thermocline implies smaller SST gradients, hence weaker winds, hence smaller SST gradients. EL Nino: The feedback between the winds and SST is limited by the delayed response of the ocean to changes in the winds. Consequence: time-dependent modes of oscillation confined to low latitudes. What determines the time-averaged intensity of the trade winds? The water that wells up at the equator comes from extra-tropical surface layers. Hence the ocean-atmosphere interactions depend on connections between low and high latitudes. Neelin and Dijkstra, Liu and Huang used highly idealized models that focus strictly on these interactions. Sophisticated climate models in principle include these interactions, BUT..
42 The change in Sea
43 At present there are two separate sets of models that simulate air-sea interactions: A. Idealized models for EL GRANDE and the climatology of the tropics. B. IPCC type models that deal with the response to higher CO2 levels radiation Suppose there exists an intermediate model with a parameter that permits simulations ranging from A to B. What is a realistic tuning for this model? PALEO-DATA!!!! The paleo- literature (Science and Nature) has many contradictory papers. eg the LGM corresponded to El Nino the LGM corresponded to La Nina eg the early Pliocene corresponded to El Nino the early Pliocene corresponded to La Nina. See the New York Times of June 28, The paleo-record is invaluable, if used with care. Response to Milankovitch forcing is of special interest.
44

45 Surface Waters in Upwelling Zones were Warm Until ~ 3 Million Years Ago
46 SUMMARY: An Overlooked Mechanism for rapid (decadal) climate changes is EL GRANDE Involving Vertical Movements of the Equatorial thermocline. A. Idealized models clarify the details of this mechanism. B. Realistic models appear to inhibit its expression, eg in response to doubling CO2. Realistic == Simulates climate of today RECOMMENDATIONS: There is a need for models that bridge A and B. Such a model is tuned realistically when it (i) simulates the climate of today; (ii) simulatesw certain past climates, especially the response Milankovitch forcing (obliquity); and the paradoxical conditions during the Pliocene.
47 The Pliocene Paradox: The world of 3 million years ago was similar to that of today. same distribution of continents, same concentration of carbon dioxide. Yet that world (of the Pliocene) was much warmer and experienced a permanent El Nino. Can we explain this? Can our Climate Models Simulate this?
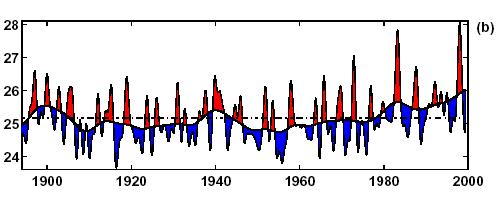
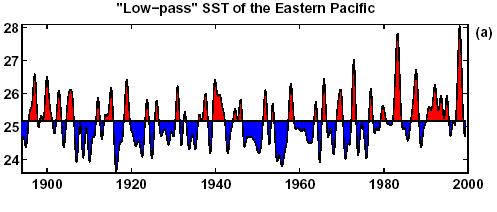
48 Sea Surface Temperature Fluctuations ( 0 C) near the Galapagos Islands. (The curvy base-line is a 10-year running mean.)
49
50 2 Years 5 Years 10 Years 20 Years
51
52 Stratus Clouds Cumulus Clouds Cloudiness Sea Surface Temperature
53 Z* Z T e T T* Surface Temperature
 Change in SST along the equator in IPCC climate models in response to a doubling of atmospheric carbondioxide concentration.")
54 Change in SST in a climate model in response to a freshening of the northern Atlantic. (Zhang and Delworth 2005) Change in SST along the equator in IPCC climate models in response to a doubling of atmospheric carbondioxide concentration. In the warm world precipitation increases, hence oceanic heat loss (evaporation) increases, hence oceanic heat gain increases, hence the equatorial thermocline remains shallow.
55
56 Contours: RMS Seasonal Cycle of Sea Surface Temperature Colors: RMS Seasonal Cycle of Sea Surface Height
An Introduction to Coupled Models of the Atmosphere Ocean System
 An Introduction to Coupled Models of the Atmosphere Ocean System Jonathon S. Wright jswright@tsinghua.edu.cn Atmosphere Ocean Coupling 1. Important to climate on a wide range of time scales Diurnal to
Fluid Circulation Review. Vocabulary. - Dark colored surfaces absorb more energy.
 Fluid Circulation Review Vocabulary Absorption - taking in energy as in radiation. For example, the ground will absorb the sun s radiation faster than the ocean water. Air pressure Albedo - Dark colored
The Climate System and Climate Models. Gerald A. Meehl National Center for Atmospheric Research Boulder, Colorado
 The Climate System and Climate Models Gerald A. Meehl National Center for Atmospheric Research Boulder, Colorado The climate system includes all components of the physical earth system that affect weather
Seasonal Climate Watch January to May 2016
 Seasonal Climate Watch January to May 2016 Date: Dec 17, 2015 1. Advisory Most models are showing the continuation of a strong El-Niño episode towards the latesummer season with the expectation to start
Lecture 28. El Nino Southern Oscillation (ENSO) part 5
 part 5") Lecture 28 El Nino Southern Oscillation (ENSO) part 5 Understanding the phenomenon Until the 60s the data was so scant that it seemed reasonable to consider El Nino as an occasional departure from normal
Lecture 28 El Nino Southern Oscillation (ENSO) part 5 Understanding the phenomenon Until the 60s the data was so scant that it seemed reasonable to consider El Nino as an occasional departure from normal
The Planetary Circulation System
 12 The Planetary Circulation System Learning Goals After studying this chapter, students should be able to: 1. describe and account for the global patterns of pressure, wind patterns and ocean currents
the 2 past three decades
 SUPPLEMENTARY INFORMATION DOI: 10.1038/NCLIMATE2840 Atlantic-induced 1 pan-tropical climate change over the 2 past three decades 3 4 5 6 7 8 9 10 POP simulation forced by the Atlantic-induced atmospheric
Please be ready for today by:
 Please be ready for today by: 1. HW out for a stamp 2. Paper and pencil/pen for notes 3. Be ready to discuss what you know about El Nino after you view the video clip What is El Nino? El Nino Basics El
Ocean-Atmosphere Interactions and El Niño Lisa Goddard
 Ocean-Atmosphere Interactions and El Niño Lisa Goddard Advanced Training Institute on Climatic Variability and Food Security 2002 July 9, 2002 Coupled Behavior in tropical Pacific SST Winds Upper Ocean
Introduction to Meteorology & Climate. Climate & Earth System Science. Atmosphere Ocean Interactions. A: Structure of the Ocean.
 Climate & Earth System Science Introduction to Meteorology & Climate MAPH 10050 Peter Lynch Peter Lynch Meteorology & Climate Centre School of Mathematical Sciences University College Dublin Meteorology
Name: Date: Hour: Comparing the Effects of El Nino & La Nina on the Midwest (E4.2c)
") Purpose: Comparing the Effects of El Nino & La Nina on the Midwest (E4.2c) To compare the effects of El Nino and La Nina on the Midwest United States. Background Knowledge: The El Nino-Southern Oscillation
Purpose: Comparing the Effects of El Nino & La Nina on the Midwest (E4.2c) To compare the effects of El Nino and La Nina on the Midwest United States. Background Knowledge: The El Nino-Southern Oscillation
Climate 1: The Climate System
 Climate 1: The Climate System Prof. Franco Prodi Institute of Atmospheric Sciences and Climate National Research Council Via P. Gobetti, 101 40129 BOLOGNA SIF, School of Energy, Varenna, July 2014 CLIMATE
Weather & Ocean Currents
 Weather & Ocean Currents Earth is heated unevenly Causes: Earth is round Earth is tilted on an axis Earth s orbit is eliptical Effects: Convection = vertical circular currents caused by temperature differences
3) What is the difference between latitude and longitude and what is their affect on local and world weather and climate?
 What is the difference between latitude and longitude and what is their affect on local and world weather and climate?") www.discoveryeducation.com 1) Describe the difference between climate and weather citing an example of each. Describe how water (ocean, lake, river) has a local effect on weather and climate and provide
www.discoveryeducation.com 1) Describe the difference between climate and weather citing an example of each. Describe how water (ocean, lake, river) has a local effect on weather and climate and provide
Link between Hurricanes and Climate Change: SST
 Link between Hurricanes and Climate Change: SST FRIDAY: PROJECT 2 Proposals due! Bring laptops on weds (at least one per group)! Discuss assessment on Weds. Roger Francois will talk on Friday about the
Energy Systems, Structures and Processes Essential Standard: Analyze patterns of global climate change over time Learning Objective: Differentiate
 Energy Systems, Structures and Processes Essential Standard: Analyze patterns of global climate change over time Learning Objective: Differentiate between weather and climate Global Climate Focus Question
The North Atlantic Oscillation: Climatic Significance and Environmental Impact
 1 The North Atlantic Oscillation: Climatic Significance and Environmental Impact James W. Hurrell National Center for Atmospheric Research Climate and Global Dynamics Division, Climate Analysis Section
ESS15 Lecture 13. End of the oceans (tropical / El Nino, thermohaline circulation) Weather vs. climate.
 Weather vs. climate.") ESS15 Lecture 13 End of the oceans (tropical / El Nino, thermohaline circulation) Weather vs. climate. Please give me feedback through the EEE midterm evaluation survey. I promise to adapt to it. Review
ESS15 Lecture 13 End of the oceans (tropical / El Nino, thermohaline circulation) Weather vs. climate. Please give me feedback through the EEE midterm evaluation survey. I promise to adapt to it. Review
Version2 Fall True/False Indicate whether the sentence or statement is true or false.
 Version2 Fall 2004 True/False Indicate whether the sentence or statement is true or false. 1. Short residence time elements are found in the greatest concentration near their point of removal from the
Topic 6: Insolation and the Seasons
 Topic 6: Insolation and the Seasons Solar Radiation and Insolation Insolation: In Sol ation The Sun is the primary source of energy for the earth. The rate at which energy is radiated is called Intensity
Chapter outline. Reference 12/13/2016
 Chapter 2. observation CC EST 5103 Climate Change Science Rezaul Karim Environmental Science & Technology Jessore University of science & Technology Chapter outline Temperature in the instrumental record
Lab 12: El Nino Southern Oscillation
 Name: Date: OCN 104: Our Dynamic Ocean Lab 12: El Nino Southern Oscillation Part 1: Observations of the tropical Pacific Ocean during a normal year The National Oceanographic and Atmospheric Administration
Answer each section in a separate booklet.
 DURATION: 3 HOURS TOTAL MARKS: 150 Internal Examiners: Dr S Pillay & Mr J Lutchmiah External Examiner: Dr J Odindi NOTE: This paper consists of 8 pages and an MCQ answer sheet. Please ensure that you have
Climate and the Atmosphere
 Climate and Biomes Climate Objectives: Understand how weather is affected by: 1. Variations in the amount of incoming solar radiation 2. The earth s annual path around the sun 3. The earth s daily rotation
At it s most extreme very low pressure off Indonesia, every high off SA, ~8 o C difference over the Pacific and ½ m water level differential) ENSO is
 ENSO is") This summer : El Niño (ENSO) and the NAO (Ocean/Atmosphere coupling teleconnections) A teleconnection (as used in the atmospheric sciences) refers to climate anomalies that are related across very large
This summer : El Niño (ENSO) and the NAO (Ocean/Atmosphere coupling teleconnections) A teleconnection (as used in the atmospheric sciences) refers to climate anomalies that are related across very large
Week: Dates: 3/2 3/20 Unit: Climate
 clementaged.weebly.com Name: EVEN Period: Week: 28 30 Dates: 3/2 3/20 Unit: Climate Monday Tuesday Wednesday Thursday Friday 2 O 3 E *Vocabulary *Water in the Atmosphere and Clouds Notes *Cloud Drawings
ESCI 344 Tropical Meteorology Lesson 7 Temperature, Clouds, and Rain
 ESCI 344 Tropical Meteorology Lesson 7 Temperature, Clouds, and Rain References: Forecaster s Guide to Tropical Meteorology (updated), Ramage Tropical Climatology, McGregor and Nieuwolt Climate and Weather
IV. Atmospheric Science Section
 EAPS 100 Planet Earth Lecture Topics Brief Outlines IV. Atmospheric Science Section 1. Introduction, Composition and Structure of the Atmosphere Learning objectives: Understand the basic characteristics
El Niño: How it works, how we observe it. William Kessler and the TAO group NOAA / Pacific Marine Environmental Laboratory
 El Niño: How it works, how we observe it William Kessler and the TAO group NOAA / Pacific Marine Environmental Laboratory The normal situation in the tropical Pacific: a coupled ocean-atmosphere system
Major climate change triggers
 Major climate change triggers Variations in solar output Milankovitch cycles Elevation & distribution of continents Ocean interactions Atmospheric composition change (CO 2 and other volcanic gasses) Biological
Twentieth-Century Sea Surface Temperature Trends M.A. Cane, et al., Science 275, pp (1997) Jason P. Criscio GEOS Apr 2006
 Jason P. Criscio GEOS Apr 2006") Twentieth-Century Sea Surface Temperature Trends M.A. Cane, et al., Science 275, pp. 957-960 (1997) Jason P. Criscio GEOS 513 12 Apr 2006 Questions 1. What is the proposed mechanism by which a uniform
Twentieth-Century Sea Surface Temperature Trends M.A. Cane, et al., Science 275, pp. 957-960 (1997) Jason P. Criscio GEOS 513 12 Apr 2006 Questions 1. What is the proposed mechanism by which a uniform
IMPLICATIONS OF THE VAST PLIOCENE WARMPOOL. Chris Brierley and Alexey Fedorov
 IMPLICATIONS OF THE VAST PLIOCENE WARMPOOL Chris Brierley and Alexey Fedorov Outline Introduction to the Early Pliocene When & why should we care? A vast warmpool in the Pacific Paleo-observations & comparison
p = ρrt p = ρr d = T( q v ) dp dz = ρg
 dp dz = ρg") Chapter 1: Properties of the Atmosphere What are the major chemical components of the atmosphere? Atmospheric Layers and their major characteristics: Troposphere, Stratosphere Mesosphere, Thermosphere
Chapter 1: Properties of the Atmosphere What are the major chemical components of the atmosphere? Atmospheric Layers and their major characteristics: Troposphere, Stratosphere Mesosphere, Thermosphere
An Introduction to Climate Modeling
 An Introduction to Climate Modeling A. Gettelman & J. J. Hack National Center for Atmospheric Research Boulder, Colorado USA Outline What is Climate & why do we care Hierarchy of atmospheric modeling strategies
1. Oceans. Example 2. oxygen.
 1. Oceans a) Basic facts: There are five oceans on earth, making up about 72% of the planet s surface and holding 97% of the hydrosphere. Oceans supply the planet with most of its oxygen, play a vital
Lecture 1. Amplitude of the seasonal cycle in temperature
 Lecture 6 Lecture 1 Ocean circulation Forcing and large-scale features Amplitude of the seasonal cycle in temperature 1 Atmosphere and ocean heat transport Trenberth and Caron (2001) False-colour satellite
Predictability of the duration of La Niña
 Predictability of the duration of La Niña Pedro DiNezio University of Texas Institute for Geophysics (UTIG) CESM Winter Meeting February 9, 2016 Collaborators: C. Deser 1 and Y. Okumura 2 1 NCAR, 2 UTIG
2013 ATLANTIC HURRICANE SEASON OUTLOOK. June RMS Cat Response
 2013 ATLANTIC HURRICANE SEASON OUTLOOK June 2013 - RMS Cat Response Season Outlook At the start of the 2013 Atlantic hurricane season, which officially runs from June 1 to November 30, seasonal forecasts
Why the Atlantic was surprisingly quiet in 2013
 1 Why the Atlantic was surprisingly quiet in 2013 by William Gray and Phil Klotzbach Preliminary Draft - March 2014 (Final draft by early June) ABSTRACT This paper discusses the causes of the unusual dearth
Earth Science Lesson Plan Quarter 2, Week 6, Day 1
 Earth Science Lesson Plan Quarter 2, Week 6, Day 1 1 Outcomes for Today Standard Focus: Earth Sciences 5.f students know the interaction of wind patterns, ocean currents, and mountain ranges results in
Winds and Currents in the Oceans
 Winds and Currents in the Oceans Atmospheric Processes Density of air is controlled by temperature, pressure, and moisture content. 1. Warm air is less dense than cold air and moist air is less dense than
lecture 10 El Niño and the Southern Oscillation (ENSO) Part I sea surface height anomalies as measured by satellite altimetry
 Part I sea surface height anomalies as measured by satellite altimetry") lecture 10 El Niño and the Southern Oscillation (ENSO) Part I sea surface height anomalies as measured by satellite altimetry SPATIAL STRUCTURE OF ENSO In 1899, the Indian monsoon failed, leading to drought
lecture 10 El Niño and the Southern Oscillation (ENSO) Part I sea surface height anomalies as measured by satellite altimetry SPATIAL STRUCTURE OF ENSO In 1899, the Indian monsoon failed, leading to drought
The surface of the ocean floor is as varied as the land. The five major oceans, from largest to smallest, are
 11.1 Ocean Basins The surface of the ocean floor is as varied as the land. The five major oceans, from largest to smallest, are w the Pacific w the Atlantic w the Indian w the Southern w the Arctic The
Seasonal to decadal climate prediction: filling the gap between weather forecasts and climate projections
 Seasonal to decadal climate prediction: filling the gap between weather forecasts and climate projections Doug Smith Walter Orr Roberts memorial lecture, 9 th June 2015 Contents Motivation Practical issues
Water mass formation, subduction, and the oceanic heat budget
 Chapter 5 Water mass formation, subduction, and the oceanic heat budget In the first four chapters we developed the concept of Ekman pumping, Rossby wave propagation, and the Sverdrup circulation as the
An Introduction to Physical Parameterization Techniques Used in Atmospheric Models
 An Introduction to Physical Parameterization Techniques Used in Atmospheric Models J. J. Hack National Center for Atmospheric Research Boulder, Colorado USA Outline Frame broader scientific problem Hierarchy
Impact of sea surface temperatures on African climate. Alessandra Giannini
 Impact of sea surface temperatures on African climate Alessandra Giannini alesall@iri.columbia.edu Outline: Intro/Motivation: demand-driven science, use of seasonal climate prediction, adaptation to climate
Section 1. Name: Class: Date: True/False Indicate whether the statement is true or false.
 Name: Class: _ Date: _ Section 1 True/False Indicate whether the statement is true or false. 1. Because of the dissolved salt in seawater its freezing point is lower than that of pure water 2. Short residence
Global Climate Patterns and Their Impacts on North American Weather
 Global Climate Patterns and Their Impacts on North American Weather By Julie Malmberg and Jessica Lowrey, Western Water Assessment Introduction This article provides a broad overview of various climate
Forecasting. Theory Types Examples
 Forecasting Theory Types Examples How Good Are Week Out Weather Forecasts? For forecasts greater than nine days out, weather forecasters do WORSE than the climate average forecast. Why is there predictability
Lecture 0 A very brief introduction
 Lecture 0 A very brief introduction Eli Tziperman Climate variability results from a very diverse set of physical phenomena and occurs on a very wide range of time scales. It is difficult to envision a
ENSO Outlook by JMA. Hiroyuki Sugimoto. El Niño Monitoring and Prediction Group Climate Prediction Division Japan Meteorological Agency
 ENSO Outlook by JMA Hiroyuki Sugimoto El Niño Monitoring and Prediction Group Climate Prediction Division Outline 1. ENSO impacts on the climate 2. Current Conditions 3. Prediction by JMA/MRI-CGCM 4. Summary
Where is all the water?
 Where is all the water? The distribution of water at the Earth's surface % of total Oceans 97.25 Ice caps and glaciers 2.05 Groundwater 0.68 Lakes 0.01 Soils 0.005 Atmosphere (as vapour) 0.001 Rivers 0.0001
Climate modeling: 1) Why? 2) How? 3) What?
 Why? 2) How? 3) What?") Climate modeling: 1) Why? 2) How? 3) What? Matthew Widlansky mwidlans@hawaii.edu 1) Why model the climate? Hawaii Fiji Sachs and Myhrvold: A Shifting Band of Rain 1 Evidence of Past Climate Change? Mean
Climate modeling: 1) Why? 2) How? 3) What? Matthew Widlansky mwidlans@hawaii.edu 1) Why model the climate? Hawaii Fiji Sachs and Myhrvold: A Shifting Band of Rain 1 Evidence of Past Climate Change? Mean
Rapid Climate Change: Heinrich/Bolling- Allerod Events and the Thermohaline Circulation. By: Andy Lesage April 13, 2010 Atmos.
 Rapid Climate Change: Heinrich/Bolling- Allerod Events and the Thermohaline Circulation By: Andy Lesage April 13, 2010 Atmos. 6030 Outline Background Heinrich Event I/Bolling-Allerod Transition (Liu et
The ocean s overall role in climate
 The ocean s overall role in climate - moderates climate in time (diurnally, annually) - redistributes heat spatially in the largescale ocean circulation - lower albedo (sea ice higher albedo) - dry atmosphere
ATMOSPHERIC MODELLING. GEOG/ENST 3331 Lecture 9 Ahrens: Chapter 13; A&B: Chapters 12 and 13
 ATMOSPHERIC MODELLING GEOG/ENST 3331 Lecture 9 Ahrens: Chapter 13; A&B: Chapters 12 and 13 Agenda for February 3 Assignment 3: Due on Friday Lecture Outline Numerical modelling Long-range forecasts Oscillations
Lecture 7: The Monash Simple Climate
 Climate of the Ocean Lecture 7: The Monash Simple Climate Model Dr. Claudia Frauen Leibniz Institute for Baltic Sea Research Warnemünde (IOW) claudia.frauen@io-warnemuende.de Outline: Motivation The GREB
2. Fargo, North Dakota receives more snow than Charleston, South Carolina.
 2015 National Tournament Division B Meteorology Section 1: Weather versus Climate Chose the answer that best answers the question 1. The sky is partly cloudy this morning in Lincoln, Nebraska. 2. Fargo,
The Formation of Precipitation Anomaly Patterns during the Developing and Decaying Phases of ENSO
 ATMOSPHERIC AND OCEANIC SCIENCE LETTERS, 2010, VOL. 3, NO. 1, 25 30 The Formation of Precipitation Anomaly Patterns during the Developing and Decaying Phases of ENSO HU Kai-Ming and HUANG Gang State Key
Climate Variability. Andy Hoell - Earth and Environmental Systems II 13 April 2011
 Climate Variability Andy Hoell - andrew_hoell@uml.edu Earth and Environmental Systems II 13 April 2011 The Earth System Earth is made of several components that individually change throughout time, interact
PRMS WHITE PAPER 2014 NORTH ATLANTIC HURRICANE SEASON OUTLOOK. June RMS Event Response
 PRMS WHITE PAPER 2014 NORTH ATLANTIC HURRICANE SEASON OUTLOOK June 2014 - RMS Event Response 2014 SEASON OUTLOOK The 2013 North Atlantic hurricane season saw the fewest hurricanes in the Atlantic Basin
Science of Global Warming and Climate Change
 Science of Global Warming and Climate Change Part 1 Science Dr. David H. Manz, P. Eng. University of Calgary May 2015 Weather vs. Climate Weather happens day to day (moment to moment) best forecast is
Homework. Oceanography and Climate Review due Friday Feb 12 th (test day!!)
") Homework Oceanography and Climate Review due Friday Feb 12 th (test day!!) Learning Targets I can define the term climate and explain the factors that influence the climate of an area. I can identify the
Homework Oceanography and Climate Review due Friday Feb 12 th (test day!!) Learning Targets I can define the term climate and explain the factors that influence the climate of an area. I can identify the
Name the surface winds that blow between 0 and 30. GEO 101, February 25, 2014 Monsoon Global circulation aloft El Niño Atmospheric water
 GEO 101, February 25, 2014 Monsoon Global circulation aloft El Niño Atmospheric water Name the surface winds that blow between 0 and 30 What is the atmospheric pressure at 0? What is the atmospheric pressure
El Niño / Southern Oscillation
 El Niño / Southern Oscillation Student Packet 2 Use contents of this packet as you feel appropriate. You are free to copy and use any of the material in this lesson plan. Packet Contents Introduction on
East Penn School District Curriculum and Instruction
 East Penn School District Curriculum and Instruction Curriculum for: Meteorology Course(s): Meteorology Grades: 10-12 Department: Science Length of Period (average minutes): 42 Periods per cycle: 6 Length
Lecture 3 questions Temperature, Salinity, Density and Circulation
 Lecture 3 questions Temperature, Salinity, Density and Circulation (1) These are profiles of mean ocean temperature with depth at various locations in the ocean which in the following (a, b, c) figures
Ocean Mixing and Climate Change
 Ocean Mixing and Climate Change Factors inducing seawater mixing Different densities Wind stirring Internal waves breaking Tidal Bottom topography Biogenic Mixing (??) In general, any motion favoring turbulent
8. Climate changes Short-term regional variations
 8. Climate changes 8.1. Short-term regional variations By short-term climate changes, we refer here to changes occurring over years to decades. Over this timescale, climate is influenced by interactions
School Name Team # International Academy East Meteorology Test Graphs, Pictures, and Diagrams Diagram #1
 School Name Team # International Academy East Meteorology Test Graphs, Pictures, and Diagrams Diagram #1 Use the map above, and the locations marked A-F, to answer the following questions. 1. The center
11/24/09 OCN/ATM/ESS The Pacific Decadal Oscillation. What is the PDO? Causes of PDO Skepticism Other variability associated with PDO
 11/24/09 OCN/ATM/ESS 587.. The Pacific Decadal Oscillation What is the PDO? Causes of PDO Skepticism Other variability associated with PDO The Pacific Decadal Oscillation (PDO). (+) ( ) EOF 1 of SST (+)
Hurricanes. April 14, 2009
 Tropical Weather & Hurricanes Chapter 15 April 14, 2009 Tropical meteorology Tropics characterized by seasonal wet and drier periods- wet when sun is nearly overhead at noon and inter-tropical convergence
Torben Königk Rossby Centre/ SMHI
 Fundamentals of Climate Modelling Torben Königk Rossby Centre/ SMHI Outline Introduction Why do we need models? Basic processes Radiation Atmospheric/Oceanic circulation Model basics Resolution Parameterizations
Oceanography Quiz 2. Multiple Choice Identify the choice that best completes the statement or answers the question.
 Oceanography Quiz 2 Multiple Choice Identify the choice that best completes the statement or answers the question. 1. The highest and lowest tides are known as the spring tides. When do these occur? a.
Climate Outlook through 2100 South Florida Ecological Services Office Vero Beach, FL September 9, 2014
 Climate Outlook through 2100 South Florida Ecological Services Office Vero Beach, FL September 9, 2014 Short Term Drought Map: Short-term (
Unit: Weather Study Guide
 Name: Period: Unit: Weather Study Guide Define each vocabulary word on a separate piece of paper or index card. Weather Climate Temperature Wind chill Heat index Sky conditions UV index Visibility Wind
Will a warmer world change Queensland s rainfall?
 Will a warmer world change Queensland s rainfall? Nicholas P. Klingaman National Centre for Atmospheric Science-Climate Walker Institute for Climate System Research University of Reading The Walker-QCCCE
MPACT OF EL-NINO ON SUMMER MONSOON RAINFALL OF PAKISTAN
 MPACT OF EL-NINO ON SUMMER MONSOON RAINFALL OF PAKISTAN Abdul Rashid 1 Abstract: El-Nino is the dominant mod of inter- annual climate variability on a planetary scale. Its impact is associated worldwide
Match (one-to-one) the following (1 5) from the list (A E) below.
 the following (1 5) from the list (A E) below.") GEO 302C EXAM 1 Spring 2009 Name UID You may not refer to any other materials during the exam. For each question (except otherwise explicitly stated), select the best answer for that question. Read all
GEO 302C EXAM 1 Spring 2009 Name UID You may not refer to any other materials during the exam. For each question (except otherwise explicitly stated), select the best answer for that question. Read all
Seasonal Climate Watch February to June 2018
 Seasonal Climate Watch February to June 2018 Date issued: Jan 26, 2018 1. Overview The El Niño-Southern Oscillation (ENSO) is expected to remain in a weak La Niña phase through to early autumn (Feb-Mar-Apr).
UPDATE OF REGIONAL WEATHER AND SMOKE HAZE (February 2018)
") UPDATE OF REGIONAL WEATHER AND SMOKE HAZE (February 2018) 1. Review of Regional Weather Conditions for January 2018 1.1 The prevailing Northeast monsoon conditions over Southeast Asia strengthened in January
UPDATE OF REGIONAL WEATHER AND SMOKE HAZE (February 2018) 1. Review of Regional Weather Conditions for January 2018 1.1 The prevailing Northeast monsoon conditions over Southeast Asia strengthened in January
Wind: Global Systems Chapter 10
 Wind: Global Systems Chapter 10 General Circulation of the Atmosphere General circulation of the atmosphere describes average wind patterns and is useful for understanding climate Over the earth, incoming
Climate Outlook through 2100 South Florida Ecological Services Office Vero Beach, FL January 13, 2015
 Climate Outlook through 2100 South Florida Ecological Services Office Vero Beach, FL January 13, 2015 Short Term Drought Map: Short-term (
Simple Mathematical, Dynamical Stochastic Models Capturing the Observed Diversity of the El Niño Southern Oscillation (ENSO)
") Simple Mathematical, Dynamical Stochastic Models Capturing the Observed Diversity of the El Niño Southern Oscillation (ENSO) Lecture 5: A Simple Stochastic Model for El Niño with Westerly Wind Bursts Andrew
Simple Mathematical, Dynamical Stochastic Models Capturing the Observed Diversity of the El Niño Southern Oscillation (ENSO) Lecture 5: A Simple Stochastic Model for El Niño with Westerly Wind Bursts Andrew
Unit Three Worksheet Meteorology/Oceanography 2 WS GE U3 2
 Unit Three Worksheet Meteorology/Oceanography 2 WS GE U3 2 Name Period Section 17.3 1. 2. 3. 4. 5. 6. 7. 8. Of the following, which is NOT a factor that controls temperature? (C) latitude (D) longitude
- air masses. Further Reading: Chapter 08 of the text book. Outline. - air masses of the world and of N. America. - fronts: warm, cold and occluded
 (1 of 10) Further Reading: Chapter 08 of the text book Outline - air masses - air masses of the world and of N. America - fronts: warm, cold and occluded (2 of 10) Previously, Introduction We discussed
Ocean cycles and climate ENSO, PDO, AMO, AO
 Ocean cycles and climate ENSO, PDO, AMO, AO 3 2.5 2 enso-index 1.5 1 0.5 0-0.5-1 enso 3.4 -index - 1996 to 1999-1.5 1996 1997 1998 1999 Bob Tisdale Bob Tisdale Bob Tisdale ENSO mechanisms animation http://esminfo.prenhall.com/science/geoanimations/animations/26_ninonina.html
Development of a Coupled Atmosphere-Ocean-Land General Circulation Model (GCM) at the Frontier Research Center for Global Change
 at the Frontier Research Center for Global Change") Chapter 1 Atmospheric and Oceanic Simulation Development of a Coupled Atmosphere-Ocean-Land General Circulation Model (GCM) at the Frontier Research Center for Global Change Project Representative Tatsushi
Chapter 1 Atmospheric and Oceanic Simulation Development of a Coupled Atmosphere-Ocean-Land General Circulation Model (GCM) at the Frontier Research Center for Global Change Project Representative Tatsushi
Most of Earth s surface water originated from outgassing of volcanoes. Icy comets bombarded early Earth, bringing with them frozen water
 Most of Earth s surface water originated from outgassing of volcanoes. Where the water came from is still uncertain Carbonaceous chondrites contain water as hydrous minerals, suggesting some water originated
Climate Outlook for March August 2018
 The APEC CLIMATE CENTER Climate Outlook for March August 2018 BUSAN, 26 February 2018 The synthesis of the latest model forecasts for March to August 2018 (MAMJJA) from the APEC Climate Center (APCC),
CHAPTER 7 Ocean Circulation Pearson Education, Inc.
 CHAPTER 7 Ocean Circulation 2011 Pearson Education, Inc. Types of Ocean Currents Surface currents Deep currents 2011 Pearson Education, Inc. Measuring Surface Currents Direct methods Floating device tracked
What a Hurricane Needs to Develop
 Weather Weather is the current atmospheric conditions, such as air temperature, wind speed, wind direction, cloud cover, precipitation, relative humidity, air pressure, etc. 8.10B: global patterns of atmospheric
WCRP/CLIVAR efforts to understand El Niño in a changing climate
 WCRP/CLIVAR efforts to understand El Niño in a changing climate Eric Guilyardi IPSL/LOCEAN, Paris & NCAS-Climate, U. Reading Thanks to Andrew Wittenberg, Mike McPhaden, Matthieu Lengaigne 2015 El Niño
Chapter 24 Tropical Cyclones
 Chapter 24 Tropical Cyclones Tropical Weather Systems Tropical disturbance a cluster of thunderstorms about 250 to 600 km in diameter, originating in the tropics or sub-tropics Tropical depression a cluster
COURSE CLIMATE SCIENCE A SHORT COURSE AT THE ROYAL INSTITUTION
 COURSE CLIMATE SCIENCE A SHORT COURSE AT THE ROYAL INSTITUTION DATE 4 JUNE 2014 LEADER CHRIS BRIERLEY Course Outline 1. Current climate 2. Changing climate 3. Future climate change 4. Consequences 5. Human
Unit 2 Meteorology Test **Please do not write on this test** 5. El Nino & La Nina 6. Photosynthesis 7. Coriolis Effect 8.
 Matching (2 points each) 1. weather 2. climate 3. Greenhouse Effect 4. Convection Unit 2 Meteorology Test **Please do not write on this test** 5. El Nino & La Nina 6. Photosynthesis 7. Coriolis Effect
SIO 210 Final Exam Dec Name:
 SIO 210 Final Exam Dec 8 2006 Name: Turn off all phones, pagers, etc... You may use a calculator. This exam is 9 pages with 19 questions. Please mark initials or name on each page. Check which you prefer
KUALA LUMPUR MONSOON ACTIVITY CENT
 T KUALA LUMPUR MONSOON ACTIVITY CENT 2 ALAYSIAN METEOROLOGICAL http://www.met.gov.my DEPARTMENT MINISTRY OF SCIENCE. TECHNOLOGY AND INNOVATIO Introduction Atmospheric and oceanic conditions over the tropical
NIWA Outlook: October - December 2015
 October December 2015 Issued: 1 October 2015 Hold mouse over links and press ctrl + left click to jump to the information you require: Overview Regional predictions for the next three months: Northland,