Write It! Students should be encouraged to do the Research and Explore station before attempting this one.
|
|
|
- Lenard French
- 5 years ago
- Views:
Transcription
1 Kesler Science Station Lab H-R Diagram Teacher Directions Explore It! I will spend much of my time at this station making sure that the students are doing the Celebrity H-R diagram correctly and not wasting time. I would definitely consider laminating the pieces and charts at this station. They will get a lot of touches throughout the day. Hotness is subjective, but I will adjust star power if necessary. Organize It! The cards for this activity are attached near the end of this file. Print several sets and then just put them in the basket for kids to pull from. This is also a good one for later in the week to demonstrate mastery too! Students should be encouraged to do the Research and Explore station before attempting this one. Illustrate It! You will need to set out map colors and markers at this station. Read It! Print several different copies (I use 6) of the reading passage so that multiple students can read at different paces Watch It! The video is on YouTube and my Google drive. Use YouTube unless your school is blocked. The original link is Note that both URL s are case-sensitive. Write It! Students should be encouraged to do the Research and Explore station before attempting this one. Research It! The goo.gl link on the task card is case-sensitive. The original link is Assess It! Students should be encouraged to do the Research and Explore station before attempting this one. If I grade anything I usually take a close look at the answers from this station.
2 Write It! Station Directions It is recommended that you have completed at least two of the following stations before working at this station. -Read It! -Explore It! -Watch It! -Research It! Answer each of the task card questions on the lab sheet in complete sentences.
3 In your own words describe what the H-R diagram is used for. Pretend a student from a lower grade asked you to explain to them how to read the H-R diagram. Write a brief summary. What is unique about the temperature on the H-R diagram compared to most of the other graphs you have looked at in the past?
4 Assess It! Station Directions It is recommended that you have completed at least two of the following stations before working at this station. -Read It! -Explore It! -Watch It! -Research It! Each member will answer the questions from the task cards on the lab sheet in the Assess It! section.
5

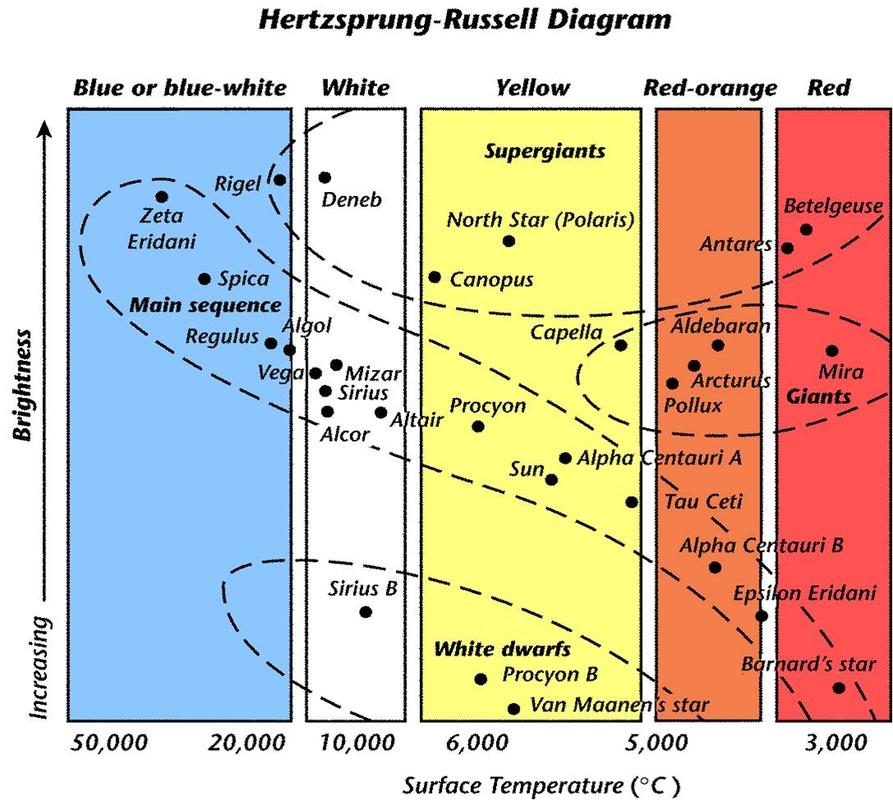
6 What do you notice about the temperature on the x-axis of the H-R diagram? A. It increases from left to right B. It increases from right to left C. It increases from bottom to top D. It increases from top to bottom Choose the best description for the Sun compared to all other stars on the H-R diagram? A. The Sun is brighter but cooler than most stars B. The Sun is hotter and brighter than most stars C. The Sun is average temperature but brighter than most stars. D. The Sun is an average temperature and average brightness. Which star is hotter and brighter than our Sun? Which statement is true about Antares and Procyon B? A. Spica B. Barnard s Star C. Betelgeuse. D. Sirius B A. Antares is brighter and hotter than Procyon B B. Antares is dimmer and hotter than Procyon B C. Antares is brighter and cooler than Procyon B D. Antares is dimmer and cooler than Procyon B
7 Read It! Station Directions Each member of the group will read the passage and answer the questions from the task cards on the lab sheet in the Read It! section. It is important to remember that the answers will come directly from the reading passage.
8
9 The Hertzsprung-Russell Diagram Are all stars the same? Not at all! Some stars are just beginning to form in nebulae while others are enjoying middle age along the main sequence, and some have even begun to die. The life cycle of a star can be compared to the life cycle of humans. The Hertzsprung-Russell Diagram is a tool that shows relationships and differences between stars. It is something of a "family portrait." It shows stars of different ages and in different stages, all at the same time. It is NOT a map of where stars are located. In the Hertzsprung-Russell (HR) Diagram, each star is represented by a dot. There are lots of stars out there, so there are lots of dots. The position of each dot on the diagram tells us two things about each star: its luminosity (absolute magnitude or brightness) and its temperature. Most of the stars lie within a region called the main sequence. It looks kind of like a curved line sloping from the upper-left to the lower-right of the HR diagram. This is where we can find out Sun. Our Sun is an average temperature and an average brightness compared to other stars on the H-R diagram. How do you read the HR diagram? Well, let s look at some basic regions on it. A star in the upper left corner of the diagram would be hot and bright. A star in the upper right corner of the diagram would be cool and bright. The Sun rests approximately in the middle of the diagram, and it is the star which we use for comparison. A star in the lower left corner of the diagram would be hot and dim. A star in the lower right corner of the diagram would be cold and dim.
10 What two things can the H-R diagram tell us about stars? A. distance and temperature B. distance and brightness C. temperature and distance D. temperature and brightness Which of the following cannot be determined by an H-R Diagram? A. Brightness (Luminosity) B. Temperature C. Color D. Location A. Main sequence B. Supergiants C. White Dwarfs D. Red Giants Where can most stars be found in the H-R diagram? A star located in the upper right corner of the diagram would be? A. Bright and Hot B. Bright and Cool C. Dim and Hot D. Dim and Cool
11 Watch It! Station Directions Each member of the group will go to the website listed on task card #1 Complete the task cards in order. Every student will answer the questions from the task cards on the lab sheet in the Watch It! section of the lab sheet.
12 Flash drive: The Hertzsprung- Russell Diagram 1. Answer questions from cards #2-4 on your lab sheet. What is interesting or different about how temperature is lined up along the x-axis? Describe the temperature and brightness for supergiants and white dwarfs. Near the end of the video he talks about what the H-R diagram can tell us about stars. List the 4 things he mentions.
13 Research It! Station Directions Each member of the group will go to the website listed on task card #1 Complete the task cards in order. Every student will answer the questions from the task cards on the lab sheet in the Research It! section.
14 1. Go to aspire.cosmic-ray.org/ Labs/StarLife/support/ HR_init.swf Categorize each of the stars according to brightness and temperature and click Check. 1. List the temperature and brightness for these 3 stars. a. Betelgeuse b. our Sun c. Sirius B 1. Compare Vega to Alpha Centauri B.
15 Explore It! Station Directions One member of the group will read the task cards in order. The group will be responsible for completing each of the tasks that are being read. Each member of the group will then write their conclusions down on the lab sheet in the Explore It! section.
16
17 Everyone Knows Them Celebrity H-R Diagram Star Power Hardly Anyone Knows Them Super Hot! Hotness Bleh!


18 Celebrity H-R Diagram Characters Michael Jackson Beyoncé Gabriel Iglesias Snaggle Tooth Taylor Swift Jason Aldean Drake Adriana Lima Seth Rogen Oprah Winfrey I would cut these out and laminate them. They will see a lot of wear and tear during this lab.
19 Use the celebrity pieces and rate them based on hotness and star power. Place each piece on the celebrity H-R diagram. In order for the celebrity to have a high star power EVERYONE in the school needs to know who that person is. Now take a look at the real H-R diagram. Stars are classified much in the same way as you classified the celebrities. Stars are classified by temperature and brightness (absolute magnitude/luminosity). Notice that the temperature is increasing from right to left on the x- axis. Temperature A. The Sun B. Zeta Eridani C. Sirius B D. Antares E. Barnard s Star Classify the following stars based on brightness and temperature. Use the words: hot, cool, bright, dim, and average
20 Illustrate It! Station Directions Each member of the group will draw a quick sketch on the lab sheet the shows they understand the concept that is being taught. Use the colored pencils and markers that are provided. The directions for the sketch are provided on the task card at the table.
21 Illustrate It! Station Directions Complete the diagram on your answer document. 1. Label the title, and both the x-axis and y- axis. 2. Label the Supergiants, White dwarfs, Main sequence and Red Giants. 3. Label the following temperature and brightness combinations on the correct area of your chart: hot/bright, hot/dim, cool/bright, cool/dim, average temp/average brightness
22 Organize It! Station Directions It is recommended that you have completed at least two of the following stations before working at this station. -Read It! -Explore It! -Watch It! -Research It! Every student will answer the questions from the task cards on the lab sheet in the Organize It! Section. Please mix up the cards again before the next group arrives at this station.
23 Use the blank H-R diagram and place the cards in the correct spot. Have the teacher check your chart to ensure it is correct. They will sign your lab sheet in the Organize It area.
24
25 Hertzsprung-Russell Diagram Hot, Bright Temperature Luminosity (Brightness or Absolute Magnitude) Hot, Dim Supergiants White Dwarfs Cool, Bright Main Sequence Cool, Dim Red Giants Average, Average
26 H-R Diagram Explore It! Name Task Card #4: A. The Sun B. Zeta Eridani C. Sirius B D. Antares E. Barnard s Star Write It! Task Card #1: Task Card #2: Task Card #3:

27 H-R Diagram Name Illustrate It! Assess It! Read It! #1 #3 #2 #4 #1 #3 #2 #4 Research It! Task Card #2: A. Sun B. Betelgeuse C. Sirius B Task Card #3: Organize It!
28 H-R Diagram Name Watch It! Task Card #2: Task Card #3: Task Card #4:
Illustrate It! You will need to set out colored pencil and markers at this station.
 Kesler Science Station Lab Comets, Meteors, and Asteroids Teacher Directions Explore It! I will spend much of my time at this station making sure that the students are doing the orbits correctly. I have
You Might Also Like. I look forward helping you focus your instruction while saving tons of time. Kesler Science Station Lab Activities 40%+ Savings!
 Thanks Thank you for downloading my product. I truly appreciate your support and look forward to hearing your feedback. Connect You can connect with me and find many free activities and strategies over
You Might Also Like. I look forward helping you focus your instruction while saving tons of time. Kesler Science Station Lab Activities 40%+ Savings!
 Thanks Connect Thank you for downloading my product. I truly appreciate your support and look forward to hearing your feedback. You can connect with me and find many free activities and strategies over
H-R Diagram Lab. Vocabulary:
 H-R Diagram Lab Vocabulary: luminosity: brightness dependent on a star s size; temperature and distance spectral class: classification of stars by their spectrum and luminosity magnitude: measure of the
You Might Also Like. Thanks. Connect
 Thanks Thank you for downloading my product. I truly appreciate your support and look forward to hearing your feedback. You can connect with me and find many free activities and strategies over at my blog
Y Centauri A 6. Alpha O Centauri B 7. Alpha
 H-R Star Spectrum Lab The H-R diagram, as it s known for short, plots a star s luminosity its true brightness against its surface temperature in Kelvin. Are there patterns that emerge and what does this
Thanks. You Might Also Like. I look forward helping you focus your instruction and save time prepping.
 Thanks Connect Thank you for downloading my product. I truly appreciate your support and look forward to hearing your feedback. You can connect with me and find many free activities and strategies over
Question: How do we use a Hertzsprung-Russell Diagram to explain star characteristics?
 The Hertzsprung-Russell Diagram Assignment Introduction: The development of the H-R Diagram began with Danish astronomer Ejnar Hertzsprung who began plotting the stars around 1911. American astronomer
The Hertzprung-Russell (HR) Diagram
 Diagram") Name: Partner(s): 1102 or 3311: Desk # Date: The Hertzprung-Russell (HR) Diagram Purpose Reproduce Hertzsprung s and Russell s simultaneous discovery Investigate the relationships between luminosity, mass,
Name: Partner(s): 1102 or 3311: Desk # Date: The Hertzprung-Russell (HR) Diagram Purpose Reproduce Hertzsprung s and Russell s simultaneous discovery Investigate the relationships between luminosity, mass,
You Might Also Like. I look forward helping you focus your instruction while saving tons of time. Kesler Science Station Lab Activities 40%+ Savings!
 Thanks Connect Thank you for downloading my product. I truly appreciate your support and look forward to hearing your feedback. You can connect with me and find many free activities and strategies over
Thanks. You Might Also Like. I look forward helping you focus your instruction and save time prepping.
 Thanks Connect Thank you for downloading my product. I truly appreciate your support and look forward to hearing your feedback. You can connect with me and find many free activities and strategies over
You Might Also Like. I look forward helping you focus your instruction while saving tons of time. Kesler Science Station Lab Activities 40%+ Savings!
 Thanks Thank you for downloading my product. I truly appreciate your support and look forward to hearing your feedback. Connect You can connect with me and find many free activities and strategies over
Thanks. You Might Also Like. I look forward helping you focus your instruction and save time prepping.
 Thanks Connect Thank you for downloading my product. I truly appreciate your support and look forward to hearing your feedback. You can connect with me and find many free activities and strategies over
Properties of Stars & H-R Diagram
 Properties of Stars & H-R Diagram What is a star? A cloud of gas, mainly hydrogen and helium The core is so hot/dense that nuclear fusion can occur. The fusion converts light nuclei (elements) into heavier
You Might Also Like. I look forward helping you focus your instruction while saving tons of time. Kesler Science Station Lab Activities 40%+ Savings!
 Thanks Connect Thank you for downloading my product. I truly appreciate your support and look forward to hearing your feedback. You can connect with me and find many free activities and strategies over
Astron 104 Laboratory #8 The H-R Diagram
 Name: Date: Section: Astron 104 Laboratory #8 The H-R Diagram Section 10.1, 10.5 Introduction The Hertzsprung-Russell diagram, or H-R diagram for short, relates two fundamental properties of stars and
Thank You! You Might Also Like. Thanks. Connect
 Assess It! Thank You! Thanks Thank you for downloading my product. I personally use all of the products that I create in my own classroom and can testify to the effectiveness them. I truly appreciate the
How can we use an H-R diagram to know where a star is in its life cycle?
 How can we use an H-R diagram to know where a star is in its life cycle? Just like humans, stars go through a life cycle. Over the course of their lives, stars change in ways that make each stage different
Exploratorium Teacher Institute page 1 Linda S. Shore
 Exploratorium Teacher Institute page 1 Growing Up A Star This activity helps students understand and interpret the Hertzsprung Russell (HR) diagram a graphical representation of how stars evolve that is
Write It! Station Directions
 Write It! Write It! Station Directions It is recommended that you have completed at least two of the following stations before working at this station. -Read It! -Explore It! -Watch It! -Research It! Answer
LAB: Star Classification
 Name: LAB: Star Classification INTRODUCTION: Like most scientists, astronomers like to categorize the Universe around them, and stars are no exception. Here s how astronomers classify stars into different
Daily Science 04/04/2017
 Daily Science 04/04/2017 Which statement best describes the difference between type A stars and type B stars as shown in the diagram? a. Type A stars burn for a shorter amount of time than type B stars.
The Hertzsprung - Russell Diagram Laboratory 11
 The Hertzsprung - Russell Diagram Laboratory 11 Objective: In this laboratory a random sample of stars will be used to create a HR Diagram. From the diagram it will be determined which category certain
Thanks. You Might Also Like. I look forward helping you focus your instruction and save time prepping.
 Thanks Connect Thank you for downloading my product. I truly appreciate your support and look forward to hearing your feedback. You can connect with me and find many free activities and strategies over
Each star is born with a specific mass. This mass is the main factor in determining the star s brightness, temperature, expected lifetime, type of
 Each star is born with a specific mass. This mass is the main factor in determining the star s brightness, temperature, expected lifetime, type of death, and spectra. Stars are classified according to
Astron 104 Laboratory #9 The H-R Diagram
 Name: Date: Section: Astron 104 Laboratory #9 The H-R Diagram Section 10.1, 10.5 If we know the temperature of a star (or its Spectral Type) and the stars intrinsic brightness (or luminosity), a great
5E Lesson Plan Template
 Handout Authors: Ashley Thornburg Austin Ross Title of Lesson: The Life Cycle of Stars Date of Lesson: Wednesday March 14, 2012 Length of Lesson: 40-45 minutes Name/Level of Course: Science 8 th Source
ACTIVITIES for Grades 9-12
 ACTIVITIES for Grades 9-12 BEFORE YOUR VISIT Online Video: Journey to the Stars Trailer and Prelude To prepare for your Museum visit, watch the trailer and the prelude with your students. Class Discussion:
Student Exploration: H-R Diagram
 Name: Date: Student Exploration: H-R Diagram Vocabulary: giant, H-R diagram, luminosity, main sequence, star, supergiant, white dwarf Prior Knowledge Questions (Do these BEFORE using the Gizmo.) 1. The
Lecture 26 The Hertzsprung- Russell Diagram January 13b, 2014
 1 Lecture 26 The Hertzsprung- Russell Diagram January 13b, 2014 2 Hertzsprung-Russell Diagram Hertzsprung and Russell found a correlation between luminosity and spectral type (temperature) 10000 Hot, bright
Stars. For Jupiter: M/Msun = 0.001
 Stars Stars are classified by spectral classes O,B,A,F,G,K,M Oh be a fine girl (or guy), kiss me! Key here is the effective temperature of the star (surface temperature) Difference in spectrum is due to
GALAXIES AND STARS. 2. Which star has a higher luminosity and a lower temperature than the Sun? A Rigel B Barnard s Star C Alpha Centauri D Aldebaran
 GALAXIES AND STARS 1. Compared with our Sun, the star Betelgeuse is A smaller, hotter, and less luminous B smaller, cooler, and more luminous C larger, hotter, and less luminous D larger, cooler, and more
A1101, Lab 5: The Hertzsprung- Russell Diagram Laboratory Worksheet
 Student Name: Lab TA Name: A1101, Lab 5: The Hertzsprung- Russell Diagram Laboratory Worksheet One of the most basic physical properties of a star is its luminosity, the rate at which it radiates energy
Imagine the Universe: Life Cycle of Stars
 Objective: To explore the similarities of stars through a Hertzsprung-Russell diagram. Grade Level: 9-12 Subject(s): Space Science Prep Time: < 10 minutes Duration: 30 minutes Materials Category: None
TAKE A LOOK 2. Identify This star is in the last stage of its life cycle. What is that stage?
 CHAPTER 15 2 SECTION Stars, Galaxies, and the Universe The Life Cycle of Stars BEFORE YOU READ After you read this section, you should be able to answer these questions: How do stars change over time?
List the layers of the Earth and provide a short description of each layer starting with the center of the Earth.
 Why does the Earth have different layers? List the layers of the Earth and provide a short description of each layer starting with the center of the Earth. How is density related to the layers of the Earth?
Lab 8: Stellar Classification and the H-R Diagram
 Name: Section: Date: Lab 8: Stellar Classification and the H-R Diagram 1 Introduction Stellar Classification As early as the beginning of the 19th century, scientists have studied absorption spectra in
Astro 301/ Fall 2006 (50405) Introduction to Astronomy
 Introduction to Astronomy") Astro 301/ Fall 2006 (50405) Introduction to Astronomy http://www.as.utexas.edu/~sj/a301-fa06 Instructor: Professor Shardha Jogee TAs: Biqing For, Candace Gray, Irina Marinova Lecture 14 Th Oct 19 Kirchhoff
Astro 301/ Fall 2006 (50405) Introduction to Astronomy http://www.as.utexas.edu/~sj/a301-fa06 Instructor: Professor Shardha Jogee TAs: Biqing For, Candace Gray, Irina Marinova Lecture 14 Th Oct 19 Kirchhoff
Test ABCDE. 1. What is the oldest era on the geological timescale? A. Precambrian B. Paleozoic C. Mesozoic D. Cenozoic
 Test - 8.8 ABCDE 1. What is the oldest era on the geological timescale? A. Precambrian B. Paleozoic C. Mesozoic D. Cenozoic 2. A light-year is defined as- F. the distance from Earth to the Sun. G. the
Lecture Outlines. Chapter 17. Astronomy Today 8th Edition Chaisson/McMillan Pearson Education, Inc.
 Lecture Outlines Chapter 17 Astronomy Today 8th Edition Chaisson/McMillan Chapter 17 Measuring the Stars Units of Chapter 17 17.1 The Solar Neighborhood 17.2 Luminosity and Apparent Brightness 17.3 Stellar
Characteristics of Stars
 Characteristics of Stars This section explains how astronomers measure distances to stars. It also describes how stars are classified. Use Target Reading Skills As you read about stars, stop and write
Lecture 10: The Hertzsprung-Russell Diagram Reading: Sections
 Lecture 10: The Hertzsprung-Russell Diagram Reading: Sections 19.7-19.8 Key Ideas The Hertzsprung-Russell (H-R) Diagram Plot of Luminosity vs. Temperature for stars Features: Main Sequence Giant & Supergiant
Wednesday 21 June 2017 Morning
 Oxford Cambridge and RSA Wednesday 21 June 2017 Morning A2 GCE PHYSICS B (ADVANCING PHYSICS) G495/01 Field and Particle Pictures ADVANCE NOTICE Duration: 2 hours *6744539949* INSTRUCTIONS TO CANDIDATES
HR Diagram Lab. Area 1 Area 4. Area 5. Area 2. Area 6 Area 3
 Name / 65 pts HR Diagram Lab Introduction Some of the greatest advances concerning the nature of stars have come about by comparing their properties using graphs. In the early 1900 s, while studying the
Wikipedia - Stellar classification:
 Stars and Hertzprung-Russell Diagram Introductory Astronomy laboratory exercise with Stellarium Mike Chu Name Stellarium is an open source and cross-platform application from www.stellarium.org. A star
OTHER MOTIONS. Just so far away they appear to move very slowly
 OTHER MOTIONS The position of a nearby star changing over a year gives us parallax Stars can also move on their own Real motion, not just our point of view They are just balls of gas and are moving around
Write It! Station Directions
 Write It! Station Directions It is recommended that you have completed at least two of the following stations before working at this station. -Read It! -Explore It! -Watch It! -Research It! Answer each
INPUT~ Explore It! Station Directions: This is one of the four INPUT stations. They may be completed in any order.
 INPUT~ Explore It! Station Directions: This is one of the four INPUT stations. They may be completed in any order. One member of the group will read the task cards in order. The group will be responsible
Directions: For numbers 1-30 please choose the letter that best fits the description.
 Directions: For numbers 1-30 please choose the letter that best fits the description. 1. The main force responsible for the formation of the universe is: a. Gravity b. Frictional force c. Magnetic force
Read It! Station Directions
 Read It! Station Directions Each member of the group will read the passage and answer the questions from the task cards on the lab sheet in the Read It! section. It is important to remember that the answers
TEK 8 Test Review. 15. Galaxies are best described as -
 TEK 8 Test Review 1. List the three subatomic particles and give each of their masses. 2. Describe and draw an illustration (Bohr Model) of the most common element in the Universe. 3. Describe and draw
Review Questions for the new topics that will be on the Final Exam
 Review Questions for the new topics that will be on the Final Exam Be sure to review the lecture-tutorials and the material we covered on the first three exams. How does speed differ from velocity? Give
Galaxies and Stars. 3. Base your answer to the following question on The reaction below represents an energy-producing process.
 Galaxies and Stars 1. To an observer on Earth, the Sun appears brighter than the star Rigel because the Sun is A) hotter than Rigel B) more luminous than Rigel C) closer than Rigel D) larger than Rigel
The Hertzsprung-Russell Diagram
 The Hertzsprung-Russell Diagram Name: Date: 1 Introduction As you may have learned in class, the Hertzsprung-Russell Diagram, or the HR diagram, is one of the most important tools used by astronomers:
Astronomy 102 Lab: Distance to the Pleiades
 Name: Astronomy 102 Lab: Distance to the Pleiades Please bring your textbook to class. Use a pencil when plotting the points on the graphs. Pre-Lab Assignment: From the planetarium, you know the Pleiades
Spectral Classification of Stars
 Department of Physics and Geology Spectral Classification of Stars Astronomy 1402 Part 1: Background Spectral Classification of Stars 1.1 Spectral Types: O, B, A, F, G, K, M On a dark, clear night far
Background and Theory
 Homework 4. Cluster HR Diagrams and the Age of Stars NAME: Due: Thursday, October 7, 2010 In Class Astro 201: Cosmology Prof. Bechtold In this assignment, we are going to measure the age of stars in star
18. Which graph best represents the relationship between the number of sunspots and the amount of magnetic activity in the Sun?
 1. Which star has a surface temperature most similar to the surface temperature of Alpha Centauri? A) Polaris B) Betelgeuse C) Procyon B D) Sirius 2. Giant stars have greater luminosity than our sun mainly
PH104 Lab 5 Stellar Classification Pre-Lab
 Name: Lab Time: 1 PH104 Lab 5 Stellar Classification Pre-Lab 5.1 Goals This is a series of labs designed to help is in understanding the nature and lives of stars. There are 3 total labs in this sequence.
Astronomy 201: Cosmology, Fall Professor Edward Olszewski and Charles Kilpatrick
 Astronomy 201: Cosmology, Fall 2013 Professor Edward Olszewski and Charles Kilpatrick Lab 3, Cluster Hertzsprung-Russell Diagrams and the Age of Stars Due October 22, Worth 32 points You may work in groups
Stars and Galaxies. Evolution of Stars
 chapter 13 3 Stars and Galaxies section 3 Evolution of Stars Before You Read What makes one star different from another? Do you think the Sun is the same as other stars? Write your ideas on the lines below.
Homework 2 AST 301, Sections and 46850, Spring NAME Student EID Score: on last page. Due Tuesday, March 1, 2016
 Homework 2 AST 301, Sections 46845 and 46850, Spring 2016 NAME Student EID Score: on last page Due Tuesday, March 1, 2016 Questions A C should help you to understand the properties of light. Show your
Lesson Plan: Star Gazing By: Darby Feldwinn
 Lesson Plan: Star Gazing By: Darby Feldwinn Target Grade: 5 th Teacher Prep Time: 10 (1 hour if you need to print and laminate star cards.) Lesson Time: 3 hours (we recommend doing this lesson over three
Hertzsprung-Russell Diagram
 Hertzsprung-Russell Diagram Objectives: To learn what a Hertzsprung-Russell Diagram is, what its major regions represent, and how to construct such a diagram. To study the evolution of star clusters. Equipment:
Mass-Luminosity and Stellar Lifetimes WS
 Name Mass-Luminosity and Stellar Lifetimes WS The graph shows the Mass-Luminosity Relationship for main sequence stars. Use it to answer questions 1-3. 1) A star with a mass of 0.5 solar masses would be
HOMEWORK - Chapter 17 The Stars
 Astronomy 20 HOMEWORK - Chapter 7 The Stars Use a calculator whenever necessary. For full credit, always show your work and explain how you got your answer in full, complete sentences on a separate sheet
Summer 2013 Astronomy - Test 3 Test form A. Name
 Summer 2013 Astronomy - Test 3 Test form A Name Do not forget to write your name and fill in the bubbles with your student number, and fill in test form A on the answer sheet. Write your name above as
Hertzprung-Russel and colormagnitude. ASTR320 Wednesday January 31, 2018
 Hertzprung-Russel and colormagnitude diagrams ASTR320 Wednesday January 31, 2018 H-R diagram vs. Color- Magnitude Diagram (CMD) H-R diagram: Plot of Luminosity vs. Temperature CMD: Plot of magnitude vs.
Measuring stellar distances.
 Measuring stellar distances This method can be used to measure distances up to 100pc Some new technology allows measuring distances up to 200pc using this method p= 1/d Stellar Parallax.htm This method
Astronomy 104: Stellar Astronomy
 Astronomy 104: Stellar Astronomy Lecture 14: Thermal Spectra to the Stars Spring Semester 2013 Dr. Matt Craig 1 1 Next Time Read Chapter 10 Focus on How we know the distance, brightness, luminosity, temperature,
Magnitudes. How Powerful Are the Stars? Luminosities of Different Stars
 How Powerful Are the Stars? Some stars are more powerful than others Power is energy output per. (Example: 00 Watts = 00 joules per second) Astronomers measure the power, or brightness of stars in ways:
AST 301 Introduction to Astronomy
 AST 301 Introduction to Astronomy John Lacy RLM 16.332 471-1469 lacy@astro.as.utexas.edu Myoungwon Jeon RLM 16.216 471-0445 myjeon@astro.as.utexas.edu Bohua Li RLM 16.212 471-8443 bohuali@astro.as.utexas.edu
a. Star A c. The two stars are the same distance b. Star B d. Not enough information
 Name: Astro 102 S17 Test 1 Multiple Choice Identify the choice that best completes the statement or answers the question. 1. Your test is Version A. Please fill in the circle for A for this question on
StarTalk. Sanjay Yengul May "To know ourselves, we must know the stars."
 StarTalk Sanjay Yengul May 2016 "To know ourselves, we must know the stars." Twinkle Twinkle How many stars are there? How big are these stars? Picture of night sky What are they made of? Why do they shine?
Astronomy 110 Homework #07 Assigned: 03/06/2007 Due: 03/13/2007. Name: (Answer Key)
") Astronomy 110 Homework #07 Assigned: 03/06/2007 Due: 03/13/2007 Name: (Answer Key) Directions: Listed below are twenty (20) multiple-choice questions based on the material covered by the lectures thus
Astronomy 110 Homework #07 Assigned: 03/06/2007 Due: 03/13/2007 Name: (Answer Key) Directions: Listed below are twenty (20) multiple-choice questions based on the material covered by the lectures thus
They developed a graph, called the H-R diagram, that relates the temperature of a star to its absolute magnitude.
 Ejnar Hertzsprung and Henry Russell noticed that stars with higher temperatures and large sizes also have brighter absolute magnitudes the actual amount of light given off by a star. (also referred to
Remember from Stefan-Boltzmann that 4 2 4
 Lecture 17 Review Most stars lie on the Main sequence of an H&R diagram including the Sun, Sirius, Procyon, Spica, and Proxima Centauri. This figure is a plot of logl versus logt. The main sequence is
Vocabulary. Section Resources
 Section 26.2 26.2 Stars 1 FOCUS Objectives 26.2.1 Demonstrate how distance to a star is measured. 26.2.2 Classify stars according to chemical and physical properties. 26.2.3 Interpret the H-R diagram.
Instructions. Students will underline the portions of the PowerPoint that are underlined.
 STARS Instructions Students will underline the portions of the PowerPoint that are underlined. Nuclear Furnace 1. A star is like a gigantic nuclear furnace. 2. The nuclear reactions inside convert hydrogen
Astronomy-part 3 notes Properties of Stars
 Astronomy-part 3 notes Properties of Stars What are Stars? Hot balls of that shine because nuclear fusion (hydrogen to helium) is happening at their cores. They create their own. Have different which allow
STUDY GUIDE FOR PHYSICAL SCIENCE EXAM
 STUDY GUIDE FOR PHYSICAL SCIENCE EXAM 1 2017 VOCABULARY: Branches of science Density Low mass star High mass star Manipulated variable Responding variable Claim Inference Precision Density Accuracy Spectroscopy
Modern Astronomy Review #1
 Modern Astronomy Review #1 1. The red-shift of light from distant galaxies provides evidence that the universe is (1) shrinking, only (3) shrinking and expanding in a cyclic pattern (2) expanding, only
LAB: Photometry of the Pleiades Cluster
 LAB: Photometry of the Pleiades Cluster ASTR 203 - Instructors Olszewski & Rigby Due IN CLASS on Oct. 30 You may work with 1 partner. If you do, only turn in 1 assignment with both your names on it! You
Classifying the stars: from dwarfs to supergiants
 Classifying the stars: from dwarfs to supergiants By SAO Encyclopedia of Astronomy, Big History Project, adapted by Newsela staff on 08.22.17 Word Count 697 Level 1170L Artist s depiction of the life cycle
What did you think of Exam 1? ! Dates: a)! Too easy b)! Too hard c)! Just right d)! A little easy e)! A little hard
! Too easy b)! Too hard c)! Just right d)! A little easy e)! A little hard") ! Good job!! Average = 83.3! Median = 84 This Class (Lecture 15): The Dying Sun Micro-meteorite lab due tonight! Next Class: Killer Sun HW 6 due next Monday. Music: Why Does the Sun Really Shine They Might
! Good job!! Average = 83.3! Median = 84 This Class (Lecture 15): The Dying Sun Micro-meteorite lab due tonight! Next Class: Killer Sun HW 6 due next Monday. Music: Why Does the Sun Really Shine They Might
High Science Earth Science Pretest: Data Analysis & Interpretation
 High Science Earth Science Pretest: Data Analysis & Interpretation Answer the set of questions that follows each table or figure. Figure 1: Hertzsprung-Russell (H-R) diagram 1. Considering Figure 1, which
Stars, Galaxies & the Universe Announcements. Stars, Galaxies & the Universe Observing Highlights. Stars, Galaxies & the Universe Lecture Outline
 Stars, Galaxies & the Universe Announcements Lab Observing Trip Next week: Tues (9/28) & Thurs (9/30) let me know ASAP if you have an official conflict (class, work) - website: http://astro.physics.uiowa.edu/~clang/sgu_fall10/observing_trip.html
Get ready for quiz # 5! Get out a ½ sheet and Calculator
 Get ready for quiz # 5! Get out a ½ sheet and Calculator The above image shows the solar eclipse earlier this month as covered and uncovered by several different solar observatories. The innermost image
Oheliocentric system.
 Name: Date: Science Period Astronomy Unit PracticeTest 2014 Sci 7 Directions: Write the letter of the BEST answer on the appropriate space on the answer sheet. 2 points each 1.The model in which SUN is
Science Period. Astronomy Unit PracticeTest 2014 Sci 7
 Name: Date: Science Period Astronomy Unit PracticeTest 2014 Sci 7 Directions: Write the letter of the BEST answer on the appropriate space on the answer sheet. 2 points each 1.The model in which SUN is
Star Magnitudes & Distances with Stellarium (Stellarium Exercise #2)
") Name Date Star Magnitudes & Distances with Stellarium (Stellarium Exercise #2) Millions of stars are scattered across the sky. Astronomers want to study these stars as carefully as possible. This means
Name Date Star Magnitudes & Distances with Stellarium (Stellarium Exercise #2) Millions of stars are scattered across the sky. Astronomers want to study these stars as carefully as possible. This means
Stars III The Hertzsprung-Russell Diagram
 Stars III The Hertzsprung-Russell Diagram Attendance Quiz Are you here today? (a) yes Here! (b) no (c) here is such a 90 s concept Today s Topics (first half) Spectral sequence and spectral types Spectral
Notepack 23 12/19/2014 Stellar Evolution: Aim: The Life Cycle of a Star
 Notepack 23 12/19/2014 Stellar Evolution: Aim: The Life Cycle of a Star Do Now: Where do stars come from? What are they made of? What is a Star? What is a Star? A star is a massive ball of gas that has
Star Gazing. Part 1. Name: What do you know about stars? Is the Sun a star? Why do we only see some stars at night?
 Star Gazing Name: Part 1 What do you know about stars? Is the Sun a star? Why do we only see some stars at night? Castor Betelgeuse Rigel Pollux Procyon Sirius The picture above shows the stars as seen
Making and Using the Hertzsprung - Russell Diagram
 Making and Using the Hertzsprung - Russell Diagram Name The Hertzsprung-Russell Diagram is one of the main tools we use to organize data describing how stars evolve, ages of star clusters, masses of stars
My God, it s full of stars! AST 248
 My God, it s full of stars! AST 248 N * The number of stars in the Galaxy N = N * f s f p n h f l f i f c L/T The Galaxy M31, the Andromeda Galaxy 2 million light years from Earth The Shape of the Galaxy
Study Guide Chapter 2
 Section: Stars Pages 32-38 Study Guide Chapter 2 Circle the letter of the best answer for each question. 1. What do scientists study to learn about stars? a. gravity c. space b. starlight d. colors COLOR
Introduction to the Night Sky
 Slide 1 / 106 Slide 2 / 106 New Jersey Center for Teaching and Learning Progressive Science Initiative This material is made freely available at www.njctl.org and is intended for the non-commercial use