Properties of Stars & H-R Diagram
|
|
|
- Molly Matthews
- 6 years ago
- Views:
Transcription

1 Properties of Stars & H-R Diagram
2 What is a star? A cloud of gas, mainly hydrogen and helium The core is so hot/dense that nuclear fusion can occur. The fusion converts light nuclei (elements) into heavier ones (H+H=He)

3 Properties of Stars 4 major properties of stars that we study: Distance Stellar brightness Color and Temperature Stellar mass
4 Stellar Distance Measuring a star's distance can be very difficult Distances to the stars are very large Units of measurement Kilometers or astronomical units are too cumbersome to use Light-year is used most often
")
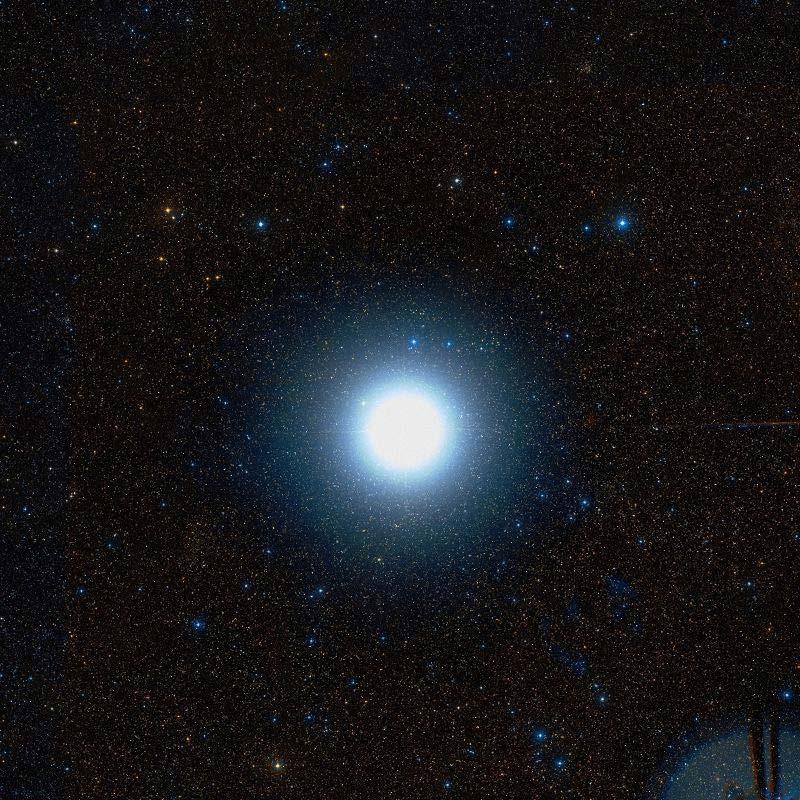
5 Quick Check WHAT IS THE CLOSEST STAR? The closest star to us is the sun! The next closest star is Proxima Centauri, AKA Alpha Centauri C (the dimmest star in the Alpha Centauri system) Proxima Centauri is 4.2 light-years from the Sun
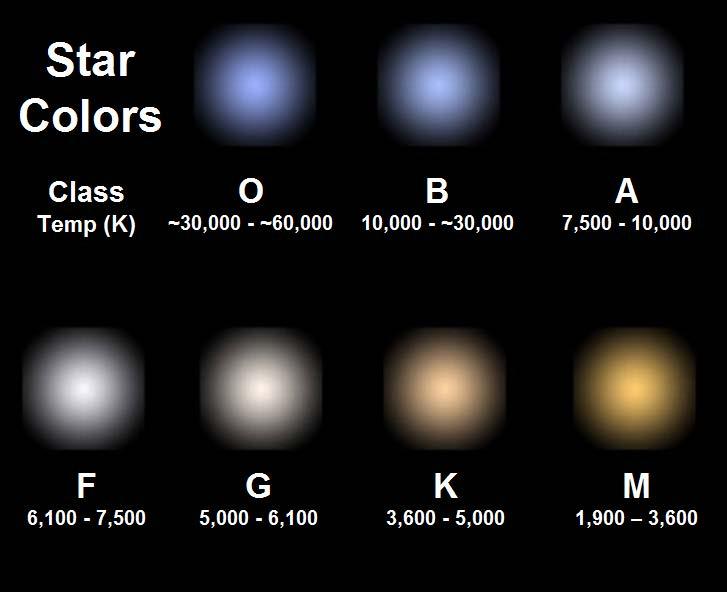
6 Every star is different All the stars have different Brightness: Tells us how luminous the star is, i.e. how much energy is being produced in the core Color: Tells us the surface temperature of the star
7 Units of luminosity We measure the luminosity of every day objects in Watts. How bright is a light bulb? By comparison, the Sun outputs: 380,000,000,000,000,000,000,000,000 Watts (380 million million million million Watts!) This is easier to write as 3.8 x Watts To make things easier we measure the brightness of stars relative to the Sun.
8 Units of temperature Temperature is measured in Kelvin The Kelvin temperature scale is the same as the Celsius scale, but starts from -273 o. This temperature is known as absolute zero -273 o C -173 o C 0 o C 100 o C 1000 o C 0 K 100 K 273 K 373 K 1273 K Kelvin = Celsius + 273


9 Measuring the temperature The temperature of a star is indicated by its color Blue stars are hot, and red stars are cold Red star Yellow star Blue star 3,000 K 5,000 K 10,000 K
10
11 Quick Check 1. How is the temperature of stars measured? a) Fahrenheit b) Celsius c) Kelvin 2. How is luminosity measured? a) Spectra b) Watts c) Lumens
12

13 Stellar brightness Controlled by three factors Size Temperature Distance Also called Magnitude, there are 2 types: Apparent magnitude Absolute magnitude
14 Apparent magnitude Brightness when a star is viewed from Earth Decreases with distance Dim stars have large numbers Negative numbers are also used Our Sun: -26.7

15 Absolute Magnitude "True" or intrinsic brightness of a star Most stars' absolute magnitudes are between -5 and +15 Our Sun: 5 Remember, the smaller or more negative, the brighter.
16 Absolute Value Chart Star Absolute Magnitude (TRUE) Apparent Magnitude (FROM EARTH) Distance from Earth (light-years) The Sun Sirius Arcturus Vega Rigel Betelgeuse ,500
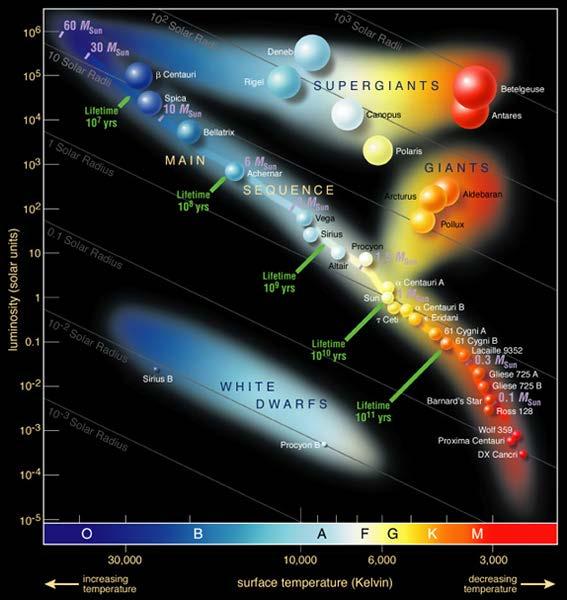
17 The HERTZSPRUNG-RUSSEL (H-R) DIAGRAM Classification system for stars Depicts the relationship between luminosity (absolute magnitudes) and temperature Named after Ejnar Hertzsprung (Danish) and Henry Norris Russell (United States) Developed in the 1920 s

18 What do you think color has to do with this diagram? Hint: Which color has the most energy and how does that energy relate to temperature?

19 Spectral Class Spectral classification (light spectrum) is more accurate then measuring the temperature of a star by its color. Sometimes the temperature scale on the horizontal axis is replaced by spectral types, OBAFGKM. Oh Be A Fine Girl/Guy, Kiss Me Spectral types refers to the state of the atoms on the star. This contains more information about the star than just its temperature (the state of its atoms). Even though it is a scale based on stellar spectra it does contain correlations between the stellar spectra and the surface temperature of the star. O = 30,000 K G = 6,000 K B = 20,000 K A = 10,000 K F = 7,000 K K = 4,000 K M = 3,000 K
20 Color and Temperature Hot star: Temperature above 30,000 K Appears blue Cool star: Temperature less than 3,000 K Appears red Between 5000 and 6000 K Stars appear yellow H-R Diagram
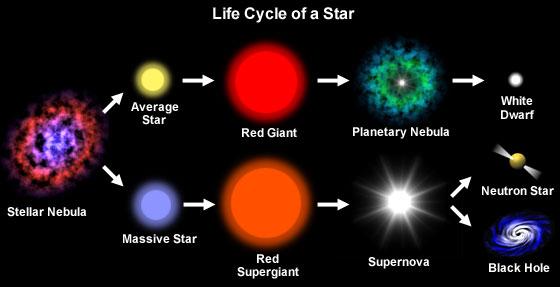
21 Hertzsprung-Russell Diagram Shows the relationship between stellar brightness & temperature/ spectra Used to study stellar evolution (i.e life cycles of stars)
22 Hertzsprung-Russell Diagram Parts of an H-R diagram Main-sequence stars: approx. 86% of all stars Giants & Super Giants Large Upper-right on the H-R diagram Only a few percent of all stars (approx. 4%) Dwarfs (white & others) Small (approximate the size of Earth) Perhaps 10% of all stars
23 Draw the Hertzsprung-Russell Diagram
24 Luminosity (brightness) goes up the y-axis Temperature x-axis. Hotter (bluer) stars lie to the left Cooler (redder) stars lie to the right *Note that the higher temperatures are to the left and cooler stars are to the right.
25
26 Quick Write On the H-R Diagram, where are most stars located?
27
A1101, Lab 5: The Hertzsprung- Russell Diagram Laboratory Worksheet
 Student Name: Lab TA Name: A1101, Lab 5: The Hertzsprung- Russell Diagram Laboratory Worksheet One of the most basic physical properties of a star is its luminosity, the rate at which it radiates energy
H-R Diagram Lab. Vocabulary:
 H-R Diagram Lab Vocabulary: luminosity: brightness dependent on a star s size; temperature and distance spectral class: classification of stars by their spectrum and luminosity magnitude: measure of the
Stars: some basic characteristics
 Stars: some basic characteristics Stars! How bright are they? How massive are they? What are the different types? How long do they live? How hot are they? Stellar brightness and luminosity The apparent
Chapter 15: Surveying the Stars
 Chapter 15 Lecture Chapter 15: Surveying the Stars Surveying the Stars 15.1 Properties of Stars Our goals for learning: How do we measure stellar luminosities? How do we measure stellar temperatures? How
The Cosmic Perspective. Surveying the Properties of Stars. Surveying the Stars. How do we measure stellar luminosities?
 Surveying the Stars Chapter 15 Lecture The Cosmic Perspective 15.1 Properties of Stars Our goals for learning: How do we measure stellar luminosities? How do we measure stellar temperatures? How do we
How can we use an H-R diagram to know where a star is in its life cycle?
 How can we use an H-R diagram to know where a star is in its life cycle? Just like humans, stars go through a life cycle. Over the course of their lives, stars change in ways that make each stage different
Book page cgrahamphysics.com Stellar Spectra
 Book page 650-652 Stellar Spectra Emission and absorption Spectra The black lines of the absorption spectrum match up with the bright lines of the emission spectrum Spectra unique to each element Emission
Each star is born with a specific mass. This mass is the main factor in determining the star s brightness, temperature, expected lifetime, type of
 Each star is born with a specific mass. This mass is the main factor in determining the star s brightness, temperature, expected lifetime, type of death, and spectra. Stars are classified according to
They developed a graph, called the H-R diagram, that relates the temperature of a star to its absolute magnitude.
 Ejnar Hertzsprung and Henry Russell noticed that stars with higher temperatures and large sizes also have brighter absolute magnitudes the actual amount of light given off by a star. (also referred to
Chapter 15 Surveying the Stars Properties of Stars
 Chapter 15 Surveying the Stars 15.1 Properties of Stars Our goals for learning: How do we measure stellar luminosities? How do we measure stellar temperatures? How do we measure stellar masses? Luminosity:
Chapter 15 Surveying the Stars
 Chapter 15 Surveying the Stars 15.1 Properties of Stars Our goals for learning How do we measure stellar luminosities? How do we measure stellar temperatures? How do we measure stellar masses? How do we
Chapter 15 Surveying the Stars Pearson Education, Inc.
 Chapter 15 Surveying the Stars 15.1 Properties of Stars Our goals for learning: How do we measure stellar luminosities? How do we measure stellar temperatures? How do we measure stellar masses? 1. How
How Do Stars Appear from Earth?
 How Do Stars Appear from Earth? Magnitude: the brightness a star appears to have from Earth Apparent Magnitude depends on 2 things: (actual intrinsic brightness) The color of a star is related to its temperature:
λ = 650 nm = c = m s 1 f =? c = fλ f = c λ = ( m s 1 ) ( m) = = Hz T = 1 f 4.
 ( m) = = Hz T = 1 f 4.") Chapter 13 Stars Section 13.1 Astronomical measurements Worked example: Try yourself 13.1.1 CALCULATING THE FREQUENCY AND PERIOD OF LIGHT The speed of light in a vacuum is approximately 3.0 10 8 m s 1.
Chapter 13 Stars Section 13.1 Astronomical measurements Worked example: Try yourself 13.1.1 CALCULATING THE FREQUENCY AND PERIOD OF LIGHT The speed of light in a vacuum is approximately 3.0 10 8 m s 1.
Daily Science 04/04/2017
 Daily Science 04/04/2017 Which statement best describes the difference between type A stars and type B stars as shown in the diagram? a. Type A stars burn for a shorter amount of time than type B stars.
Lecture 10: The Hertzsprung-Russell Diagram Reading: Sections
 Lecture 10: The Hertzsprung-Russell Diagram Reading: Sections 19.7-19.8 Key Ideas The Hertzsprung-Russell (H-R) Diagram Plot of Luminosity vs. Temperature for stars Features: Main Sequence Giant & Supergiant
Stars and HR Diagrams
 Stars and HR Diagrams Elements are not Elementary: the Building Blocks of Nature Atoms are made from protons, neutrons, electrons Chemical elements are named by the number A of protons in their nucleus
LAB: Star Classification
 Name: LAB: Star Classification INTRODUCTION: Like most scientists, astronomers like to categorize the Universe around them, and stars are no exception. Here s how astronomers classify stars into different
My God, it s full of stars! AST 248
 My God, it s full of stars! AST 248 N * The number of stars in the Galaxy N = N * f s f p n h f l f i f c L/T The Galaxy M31, the Andromeda Galaxy 2 million light years from Earth The Shape of the Galaxy
Lines of Hydrogen. Most prominent lines in many astronomical objects: Balmer lines of hydrogen
 The Family of Stars Lines of Hydrogen Most prominent lines in many astronomical objects: Balmer lines of hydrogen The Balmer Thermometer Balmer line strength is sensitive to temperature: Most hydrogen
Teacher of the Week DEVIL PHYSICS THE BADDEST CLASS ON CAMPUS IB PHYSICS
 Teacher of the Week DEVIL PHYSICS THE BADDEST CLASS ON CAMPUS IB PHYSICS TSOKOS LESSON E-2 STELLAR RADIATION IB Assessment Statements Topic E-2, Stellar Radiation and Stellar Types Energy Source E.2.1.
Test Ques4ons. Median Grade: 82/100 High Score: 99/100
 Day 11: Stars Review of Test Ar4cle Sharing Reading/Mastering Astronomy Ques4ons Lecture on Spectral Type Break Lecture on Hertzsprung- Russell Diagram L- T: H- R Diagram, p 117 Summary Test Ques4ons Median
Ohio University - Lancaster Campus slide 1 of 47 Spring 2009 PSC 100. A star s color, temperature, size, brightness and distance are all related!
 Ohio University - Lancaster Campus slide 1 of 47 A star s color, temperature, size, brightness and distance are all related! Ohio University - Lancaster Campus slide 2 of 47 The Beginnings Late 1800 s,
Exploratorium Teacher Institute page 1 Linda S. Shore
 Exploratorium Teacher Institute page 1 Growing Up A Star This activity helps students understand and interpret the Hertzsprung Russell (HR) diagram a graphical representation of how stars evolve that is
Stars III The Hertzsprung-Russell Diagram
 Stars III The Hertzsprung-Russell Diagram Attendance Quiz Are you here today? (a) yes Here! (b) no (c) here is such a 90 s concept Today s Topics (first half) Spectral sequence and spectral types Spectral
Stars: Intro & Classification
 Stars: Intro & Classification Astronomy 1 Elementary Astronomy LA Mission College Spring F2015 Quotes & Cartoon of the Day The wonder is, not that the field of stars of so vast, but that man has measured
Guiding Questions. Measuring Stars
 Measuring Stars Guiding Questions 1. How far away are the stars? 2. What is meant by a first-magnitude or second magnitude star? 3. Why are some stars red and others blue? 4. What are the stars made of?
 How do we know the distance to these stars? The Ping Pong Ball Challenge -Devise a method for determining the height of the ping pong ball above the floor. -You are restricted to the floor. -You can only
Pr P ope p rti t es s of o f St S a t rs
 Properties of Stars Distances Parallax ( Triangulation ): - observe object from two separate points - use orbit of the Earth (1 AU) - measure angular shift of object - angle depends on distance to object
The Hertzprung-Russell (HR) Diagram
 Diagram") Name: Partner(s): 1102 or 3311: Desk # Date: The Hertzprung-Russell (HR) Diagram Purpose Reproduce Hertzsprung s and Russell s simultaneous discovery Investigate the relationships between luminosity, mass,
Name: Partner(s): 1102 or 3311: Desk # Date: The Hertzprung-Russell (HR) Diagram Purpose Reproduce Hertzsprung s and Russell s simultaneous discovery Investigate the relationships between luminosity, mass,
The Hertzsprung - Russell Diagram Laboratory 11
 The Hertzsprung - Russell Diagram Laboratory 11 Objective: In this laboratory a random sample of stars will be used to create a HR Diagram. From the diagram it will be determined which category certain
Spectral Classification of Stars
 Department of Physics and Geology Spectral Classification of Stars Astronomy 1402 Part 1: Background Spectral Classification of Stars 1.1 Spectral Types: O, B, A, F, G, K, M On a dark, clear night far
Hertzsprung-Russell Diagram, Flux, Luminosity, Magnitude 10 Oct
 Russell Diagram, Flux, Luminosity, Magnitude 10 Oct Outline Review of 7 Oct Thermal radiation Wien s Law Stefan Boltzmann Law How to measure temperature of stars. AJ Cannon s method of classifying spectra.
Question: How do we use a Hertzsprung-Russell Diagram to explain star characteristics?
 The Hertzsprung-Russell Diagram Assignment Introduction: The development of the H-R Diagram began with Danish astronomer Ejnar Hertzsprung who began plotting the stars around 1911. American astronomer
Observational Astronomy - Lecture 8 Stars I - Distances, Magnitudes, Spectra, HR Diagram
 Observational Astronomy - Lecture 8 Stars I - Distances, Magnitudes, Spectra, HR Diagram Craig Lage New York University - Department of Physics craig.lage@nyu.edu April 7, 2014 1 / 36 JPL Horizons Database.
EVOLUTION OF STARS HERTZSPRUNG-RUSSELL DIAGRAM
 VISUAL PHYSICS ONLINE EVOLUTION OF STARS HERTZSPRUNG-RUSSELL DIAGRAM The total power radiated by a star is called its intrinsic luminosity L (luminosity). The apparent brightness (apparent luminosity)
Announcements. Lecture 11 Properties of Stars. App Bright = L / 4!d 2
 Announcements Quiz#3 today at the end of 60min lecture. Homework#3 will be handed out on Thursday. Due October 14 (next Thursday) Review of Mid-term exam will be handed out next Tuesday. Mid-term exam
Student Exploration: H-R Diagram
 Name: Date: Student Exploration: H-R Diagram Vocabulary: giant, H-R diagram, luminosity, main sequence, star, supergiant, white dwarf Prior Knowledge Questions (Do these BEFORE using the Gizmo.) 1. The
GALAXIES AND STARS. 2. Which star has a higher luminosity and a lower temperature than the Sun? A Rigel B Barnard s Star C Alpha Centauri D Aldebaran
 GALAXIES AND STARS 1. Compared with our Sun, the star Betelgeuse is A smaller, hotter, and less luminous B smaller, cooler, and more luminous C larger, hotter, and less luminous D larger, cooler, and more
Y Centauri A 6. Alpha O Centauri B 7. Alpha
 H-R Star Spectrum Lab The H-R diagram, as it s known for short, plots a star s luminosity its true brightness against its surface temperature in Kelvin. Are there patterns that emerge and what does this
Mass-Luminosity and Stellar Lifetimes WS
 Name Mass-Luminosity and Stellar Lifetimes WS The graph shows the Mass-Luminosity Relationship for main sequence stars. Use it to answer questions 1-3. 1) A star with a mass of 0.5 solar masses would be
Deducing Temperatures and Luminosities of Stars (and other objects ) Electromagnetic Fields. Sinusoidal Fields
 Electromagnetic Fields. Sinusoidal Fields") Deducing Temperatures and Luminosities of Stars (and other objects ) Review: Electromagnetic Radiation Gamma Rays X Rays Ultraviolet (UV) Visible Light Infrared (IR) Increasing energy Microwaves Radio
Deducing Temperatures and Luminosities of Stars (and other objects ) Review: Electromagnetic Radiation Gamma Rays X Rays Ultraviolet (UV) Visible Light Infrared (IR) Increasing energy Microwaves Radio
Vocabulary. Section Resources
 Section 26.2 26.2 Stars 1 FOCUS Objectives 26.2.1 Demonstrate how distance to a star is measured. 26.2.2 Classify stars according to chemical and physical properties. 26.2.3 Interpret the H-R diagram.
Astronomy 210. Outline. Stellar Properties. The Mosquito Dilemma. Solar Observing & HW9 due April 15 th Stardial 2 is available.
 Astronomy 210 Outline This Class (Lecture 31): Stars: Spectra and the H-R Diagram Next Class: Life and Death of the Sun Solar Observing & HW9 due April 15 th Stardial 2 is available. The Mosquito dilemma
Family of stars. Fred Sarazin Physics Department, Colorado School of Mines. PHGN324: Family of stars
 Family of stars Reminder: the stellar magnitude scale In the 1900 s, the magnitude scale was defined as follows: a difference of 5 in magnitude corresponds to a change of a factor 100 in brightness. Dm
Imagine the Universe: Life Cycle of Stars
 Objective: To explore the similarities of stars through a Hertzsprung-Russell diagram. Grade Level: 9-12 Subject(s): Space Science Prep Time: < 10 minutes Duration: 30 minutes Materials Category: None
Homework 2 AST 301, Sections and 46850, Spring NAME Student EID Score: on last page. Due Tuesday, March 1, 2016
 Homework 2 AST 301, Sections 46845 and 46850, Spring 2016 NAME Student EID Score: on last page Due Tuesday, March 1, 2016 Questions A C should help you to understand the properties of light. Show your
Astronomy. The Nature of Stars
 Astronomy A. Dayle Hancock adhancock@wm.edu Small 239 Office hours: MTWR 10-11am The Nature of Stars Distances to stars A Star's brightness and Luminosity A Magnitude scale Color indicates a Star's temperature
Parallax: Measuring the distance to Stars
 Measuring the Stars Parallax: Measuring the distance to Stars Use Earth s orbit as baseline Parallactic angle = 1/2 angular shift Distance from the Sun required for a star to have a parallactic angle of
Determining the Properties of the Stars
 Determining the Properties of the Stars This set of notes by Nick Strobel covers: The properties of stars--their distances, luminosities, compositions, velocities, masses, radii, and how we determine those
How does the Sun shine? What is the Sun s structure? Lifetime of the Sun. Luminosity of the Sun. Radiation Zone. Core 3/30/17
 What is the Sun s structure? From inside out, the layers are: Core Radiation Zone Convection Zone Photosphere Chromosphere Corona How does the Sun shine? The Sun has its own energy source Main difference
HR Diagram Student Guide
 Name: HR Diagram Student Guide Pretest Score: Background Information Work through the background sections on Spectral Classification, Luminosity, and the Hertzsprung-Russell Diagram. Then complete the
Characteristics of Stars
 Characteristics of Stars This section explains how astronomers measure distances to stars. It also describes how stars are classified. Use Target Reading Skills As you read about stars, stop and write
Organizing the Family of Stars:
 Organizing the Family of Stars: We know: Stars have different temperatures, different luminosities, and different sizes. To bring some order into that zoo of different types of stars: organize them in
Classifying the stars: from dwarfs to supergiants
 Classifying the stars: from dwarfs to supergiants By SAO Encyclopedia of Astronomy, Big History Project, adapted by Newsela staff on 08.22.17 Word Count 697 Level 1170L Artist s depiction of the life cycle
The Hertzsprung-Russell Diagram
 The Hertzsprung-Russell Diagram Our Objectives To determine the physical properties of the stars; to learn how they differ; and to understand why those differences arise We can now get around the problem
Astronomy Exam 3 - Sun and Stars
 Astronomy Exam 3 - Sun and Stars Study online at quizlet.com/_4zgp6 1. `what are the smallest group of stars in the H-R diagram 2. A star has a parallax of 0.05". what is the distance from the earth? white
Position 1 Position 2 6 after position 1 Distance between positions 1 and 2 is the Bigger = bigger parallax (Ɵ)
") STARS CHAPTER 10.1 the solar neighborhood The distances to the nearest stars can be measured using Parallax => the shift of an object relative to some distant background as the observer s point of view
STARS CHAPTER 10.1 the solar neighborhood The distances to the nearest stars can be measured using Parallax => the shift of an object relative to some distant background as the observer s point of view
The Hertzprung-Russell Diagram. The Hertzprung-Russell Diagram. Question
 Key Concepts: Lecture 21: Measuring the properties of stars (cont.) The Hertzsprung-Russell (HR) Diagram (L versus T) The Hertzprung-Russell Diagram The Stefan-Boltzmann Law: flux emitted by a black body
Lecture Outlines. Chapter 17. Astronomy Today 8th Edition Chaisson/McMillan Pearson Education, Inc.
 Lecture Outlines Chapter 17 Astronomy Today 8th Edition Chaisson/McMillan Chapter 17 Measuring the Stars Units of Chapter 17 17.1 The Solar Neighborhood 17.2 Luminosity and Apparent Brightness 17.3 Stellar
1. Basic Properties of Stars
 1. Basic Properties of Stars This is the Sun during a total eclipse. The Sun, our closest star, is very much representative of the objects that we will study during this module, namely stars. Much of the
Review Chapter 10. 2) A parsec is slightly more than 200,000 AU. 2)
 A parsec is slightly more than 200,000 AU. 2)") Review Chapter 10 TRUE/FALSE. Write 'T' if the statement is true and 'F' if the statement is false. 1) A parsec is about 3.3 light-years. 1) 2) A parsec is slightly more than 200,000 AU. 2) 3) The nearest
Review Chapter 10 TRUE/FALSE. Write 'T' if the statement is true and 'F' if the statement is false. 1) A parsec is about 3.3 light-years. 1) 2) A parsec is slightly more than 200,000 AU. 2) 3) The nearest
Galaxies and Stars. 3. Base your answer to the following question on The reaction below represents an energy-producing process.
 Galaxies and Stars 1. To an observer on Earth, the Sun appears brighter than the star Rigel because the Sun is A) hotter than Rigel B) more luminous than Rigel C) closer than Rigel D) larger than Rigel
Hertzsprung-Russel Diagrams and Distance to Stars
 Chapter 10 Hertzsprung-Russel Diagrams and Distance to Stars 10.1 Purpose In this lab, we will explore how astronomer classify stars. This classificatin one way that can be used to determine the distance
Types of Stars and the HR diagram
 Types of Stars and the HR diagram Full window version (looks a little nicer). Click button to get back to small framed version with content indexes. This material (and images) is copyrighted! See
The light from the stars we see at night travel great distances to reach Earth. Other than the sun, Proxima Centauriis the next closest
 The light from the stars we see at night travel great distances to reach Earth. Other than the sun, Proxima Centauriis the next closest star. The light that we see from it takes over 4 yearsto reach our
a. Star A c. The two stars are the same distance b. Star B d. Not enough information
 Name: Astro 102 S17 Test 1 Multiple Choice Identify the choice that best completes the statement or answers the question. 1. Your test is Version A. Please fill in the circle for A for this question on
The Hertzsprung-Russell Diagram
 The Hertzsprung-Russell Diagram VIREO Virtual Educational Observatory Aims To use the observational + analysis tools of modern astronomy To use the setup that professional astronomers use at large telescopes
Chapter 10 Measuring the Stars
 Chapter 10 Measuring the Stars Some of the topics included in this chapter Stellar parallax Distance to the stars Stellar motion Luminosity and apparent brightness of stars The magnitude scale Stellar
Chapter 11 Surveying the Stars
 Chapter 11 Surveying the Stars Luminosity Luminosity: Rate of energy emitted by star every second. Apparent brightness (flux): Amount of energy passing through every second per unit area. Luninosity =
The Amazing Power of Starlight
 The Amazing Power of Starlight Chapter 6 Just by analyzing the light received from a star, astronomers can retrieve information about a star s Starlight and Atoms 1. Total energy output 2. Surface temperature
Wednesday 21 June 2017 Morning
 Oxford Cambridge and RSA Wednesday 21 June 2017 Morning A2 GCE PHYSICS B (ADVANCING PHYSICS) G495/01 Field and Particle Pictures ADVANCE NOTICE Duration: 2 hours *6744539949* INSTRUCTIONS TO CANDIDATES
PH104 Lab 5 Stellar Classification Pre-Lab
 Name: Lab Time: 1 PH104 Lab 5 Stellar Classification Pre-Lab 5.1 Goals This is a series of labs designed to help is in understanding the nature and lives of stars. There are 3 total labs in this sequence.
What do the Roman numerals mean and how do stars die
 What do the Roman numerals mean and how do stars die What is luminosity? Luminosity is the energy emitted from a star, or basically how bright it is compared to our Sun The higher the luminosity, the higher
the nature of the universe, galaxies, and stars can be determined by observations over time by using telescopes
 the nature of the universe, galaxies, and stars can be determined by observations over time by using telescopes The spectral lines of stars tell us their approximate composition Remember last year in Physics?
Chapter 6. Atoms and Starlight
 Chapter 6 Atoms and Starlight What is light? Light is an electromagnetic wave. Wavelength and Frequency wavelength frequency = speed of light = constant Particles of Light Particles of light are called
StarTalk. Sanjay Yengul May "To know ourselves, we must know the stars."
 StarTalk Sanjay Yengul May 2016 "To know ourselves, we must know the stars." Twinkle Twinkle How many stars are there? How big are these stars? Picture of night sky What are they made of? Why do they shine?
A Stellar Spectra 3. Stars shine at night (during the day too!). A star is a self-luminous sphere of gas. Stars are held together by gravity.
. A star is a self-luminous sphere of gas. Stars are held together by gravity.") Stellar Spectra Relativity and Astrophysics Lecture 12 Terry Herter Outline What is a star? Stellar Spectra Kirchhoff s Laws Spectral Classification Spectral Types: O B A F G K M L T Stellar Photometry
Stellar Spectra Relativity and Astrophysics Lecture 12 Terry Herter Outline What is a star? Stellar Spectra Kirchhoff s Laws Spectral Classification Spectral Types: O B A F G K M L T Stellar Photometry
OPEN CLUSTER PRELAB The first place to look for answers is in the lab script!
 NAME: 1. Define using complete sentences: Globular Cluster: OPEN CLUSTER PRELAB The first place to look for answers is in the lab script! Open Cluster: Main Sequence: Turnoff point: Answer the following
Hertzsprung-Russell Diagram
 Hertzsprung-Russell Diagram Objectives: To learn what a Hertzsprung-Russell Diagram is, what its major regions represent, and how to construct such a diagram. To study the evolution of star clusters. Equipment:
OTHER MOTIONS. Just so far away they appear to move very slowly
 OTHER MOTIONS The position of a nearby star changing over a year gives us parallax Stars can also move on their own Real motion, not just our point of view They are just balls of gas and are moving around
18. Which graph best represents the relationship between the number of sunspots and the amount of magnetic activity in the Sun?
 1. Which star has a surface temperature most similar to the surface temperature of Alpha Centauri? A) Polaris B) Betelgeuse C) Procyon B D) Sirius 2. Giant stars have greater luminosity than our sun mainly
NSCI 314 LIFE IN THE COSMOS
 NSCI 314 LIFE IN THE COSMOS 2 BASIC ASTRONOMY, AND STARS AND THEIR EVOLUTION Dr. Karen Kolehmainen Department of Physics CSUSB COURSE WEBPAGE: http://physics.csusb.edu/~karen MOTIONS IN THE SOLAR SYSTEM
Stars and Galaxies. Evolution of Stars
 chapter 13 3 Stars and Galaxies section 3 Evolution of Stars Before You Read What makes one star different from another? Do you think the Sun is the same as other stars? Write your ideas on the lines below.
Chapter 9: Measuring the Stars
 Chapter 9: Measuring the Stars About 10 11 (100,000,000,000) stars in a galaxy; also about 10 11 galaxies in the universe Stars have various major characteristics, the majority of which fall into several
Black Hole Binary System. Outline - Feb. 25, Constraining the Size of the Region that Contains the Invisible Mass
 Outline - Feb. 25, 2010 Black Hole Binary System Observational evidence for Black Holes (pgs. 600-601) Properties of Stars (Ch. 16) Luminosities (pgs. 519-523) Temperatures (pg. 524) Optical image of Cygnus
HOMEWORK - Chapter 17 The Stars
 Astronomy 20 HOMEWORK - Chapter 7 The Stars Use a calculator whenever necessary. For full credit, always show your work and explain how you got your answer in full, complete sentences on a separate sheet
Chapter 15 Lecture. The Cosmic Perspective Seventh Edition. Surveying the Stars Pearson Education, Inc.
 Chapter 15 Lecture The Cosmic Perspective Seventh Edition Surveying the Stars 15.1 Properties of Stars Our goals for learning: How do we measure stellar luminosities? How do we measure stellar temperatures?
The Life Histories of Stars I. Birth and Violent Lives
 The Life Histories of Stars I Birth and Violent Lives Stellar evolution--first problem for new discipline of astrophysics What is a star? What is it made of? How does it produce and release energy? How
15.1 Properties of Stars
 Surveying the Stars 15.1 Properties of Stars Our goals for learning: How do we measure stellar luminosities? How do we measure stellar temperatures? How do we measure stellar masses? How do we measure
The Family of Stars. Chapter 13. Triangulation. Trigonometric Parallax. Calculating Distance Using Parallax. Calculating Distance Using Parallax
 The Family of Stars Chapter 13 Measuring the Properties of Stars 1 Those tiny glints of light in the night sky are in reality huge, dazzling balls of gas, many of which are vastly larger and brighter than
Hertzsprung-Russell Diagram 7 Oct
 Hertzsprung-Russell Diagram 7 Oct Outline Thermal radiation Wien s Law Stefan Boltzmann Law Hertzsprung Russell diagram There are 3 types of stars: main sequence or dwarfs, giants, white dwarfs Missouri
Get ready for quiz # 5! Get out a ½ sheet and Calculator
 Get ready for quiz # 5! Get out a ½ sheet and Calculator The above image shows the solar eclipse earlier this month as covered and uncovered by several different solar observatories. The innermost image
Star Formation A cloud of gas and dust, called a nebula, begins spinning & heating up. Eventually, it gets hot enough for fusion to take place, and a
 Stars Star- large ball of gas held together by gravity that produces tremendous amounts of energy and shines Sun- our closest star Star Formation A cloud of gas and dust, called a nebula, begins spinning
Hertzprung-Russel and colormagnitude. ASTR320 Wednesday January 31, 2018
 Hertzprung-Russel and colormagnitude diagrams ASTR320 Wednesday January 31, 2018 H-R diagram vs. Color- Magnitude Diagram (CMD) H-R diagram: Plot of Luminosity vs. Temperature CMD: Plot of magnitude vs.
SEQUENCING THE STARS
 SEQUENCING THE STARS ROBERT J. VANDERBEI Using images acquired with modern CCD cameras, amateur astronomers can make Hertzsprung-Russell diagrams from their own images of clusters. In this way, we can
Selected Questions from Minute Papers. Outline - March 2, Stellar Properties. Stellar Properties Recap. Stellar properties recap
 Black Holes: Selected Questions from Minute Papers Will all the material in the Milky Way eventually be sucked into the BH at the center? Does the star that gives up mass to a BH eventually get pulled
Life Cycle of a Star - Activities
 Name: Class Period: Life Cycle of a Star - Activities A STAR IS BORN STAGES COMMON TO ALL STARS All stars start as a nebula. A nebula is a large cloud of gas and dust. Gravity can pull some of the gas
Sun. Sirius. Tuesday, February 21, 2012
 Spectral Classification of Stars Sun Sirius Stellar Classification Spectral Lines H Fe Na H Ca H Spectral Classification of Stars Timeline: 1890s Edward C. Pickering (1846-1919) and Williamina P. Fleming
D2 Stellar characteristics and stellar evolution
 Learning objectives Describe the use of stellar spectra. Work with the HR diagram, including representation of stellar evolution. Apply the mass luminosity relation. Describe Cepheid variables and their