frequency R 2 =0.99 y=1.01x modelled O 4 Correspondence to: Yang Wang y=1.02x-1.44
|
|
|
- Norma Daniel
- 5 years ago
- Views:
Transcription
1 measured O 4 dscd [10 43 molecules 2 cm -5 ] measured NO 2 dscd [10 15 molecules cm -2 ] frequency Supplement for Vertical profiles of NO 2, SO 2, HONO, HCHO, CHOCHO, and aerosols derived from MAX-DOAS measurements at a rural site in the central-western North China Plain and their relation to emission sources and effects of regional transport Yang Wang 1, Steffen Dörner 1, Sebastian Donner 1, Sebastian Böhnke 1, Isabelle De Smedt 2, Russell R. Dickerson 3, Zipeng Dong 4, Hao He 3, Zhanqing Li 3,4, Zhengqiang Li 5, Donghui Li 5, Dong Liu 6, Xinrong Ren 3,7, Nicolas Theys 7, Yuying Wang 4, Yang Wang 4, Zhenzhu Wang 6, Hua Xu 5, Jiwei Xu 6, Thomas Wagner 1 1 Max Planck Institute for Chemistry, Mainz, Germany 2 Belgian Institute for Space Aeronomy (BIRA-IASB), Brussels, Belgium 3 Department of Atmospheric and Oceanic Science and ESSIC, University of Maryland, College Park, Maryland, USA 4 College of Global Change and Earth System Sciences, Beijing Normal University, Beijing, China 5 Institute of Remote Sensing and Digital Earth, Chinese Academy of Sciences 6 Key Laboratory of Atmospheric Composition and Optical Radiation, Anhui Institute of Optics and Fine Mechanics, Chinese Academy of Sciences, Hefei, China 7 Air Resources Laboratory, National Oceanic and Atmospheric Administration, College Park, Maryland, USA Correspondence to: Yang Wang (y.wang@mpic.de) (a) (b) 20% 15% 10% 5% 0% WNW W NW NNW N NNE NE ENE E wind speed [m/s] >= % 10% WSW ESE 15% SW SE 20% SSW S SSE Figure S1: Wind roses (a) and averaged diurnal variations of local winds (b) derived from a local weather station during the measurement period of MAX-DOAS. The arrows point to the direction to which wind blows; the length of the arrows represent the wind speed. 5 4 R 2 =0.99 y=1.01x R 2 =0.99 y=1.02x modelled O 4 dscd [10 43 molecules 2 cm -5 ] modelled NO 2 dscd [10 15 molecules cm -2 ]
2 measured HCHO dscd [10 15 molecules cm -2 ] measured SO 2 dscd [10 15 molecules cm -2 ] measured HONO dscd [10 15 molecules cm -2 ] R 2 =0.99 y=1.01x all data: R 2 =0.91, y=1.12x-0.44 measured dscd>1: R 2 =0.91, y=0.99x modelled SO 2 dscd [10 15 molecules cm -2 ] modelled HONO dscd [10 15 molecules cm -2 ] R 2 =0.94 y=1.00x modelled HCHO dscd [10 15 molecules cm -2 ] Figure S2: Scatter plots of measured dscds against modelled dscds (simulated by the RTM SCIATRAN for the retrieved profiles) during the whole measurement period for retrievals of aerosols, NO 2, SO 2, HONO, and HCHO. The squares of the correlation coefficients (R 2 ) and the slopes derived from the linear regressions (red lines) are given in each subplot. For HONO, R²and the slopes are also given for the measured dscd larger than molecules cm -2 in order to minimise the effect of measurements close or below the detection limit.
3
4
5
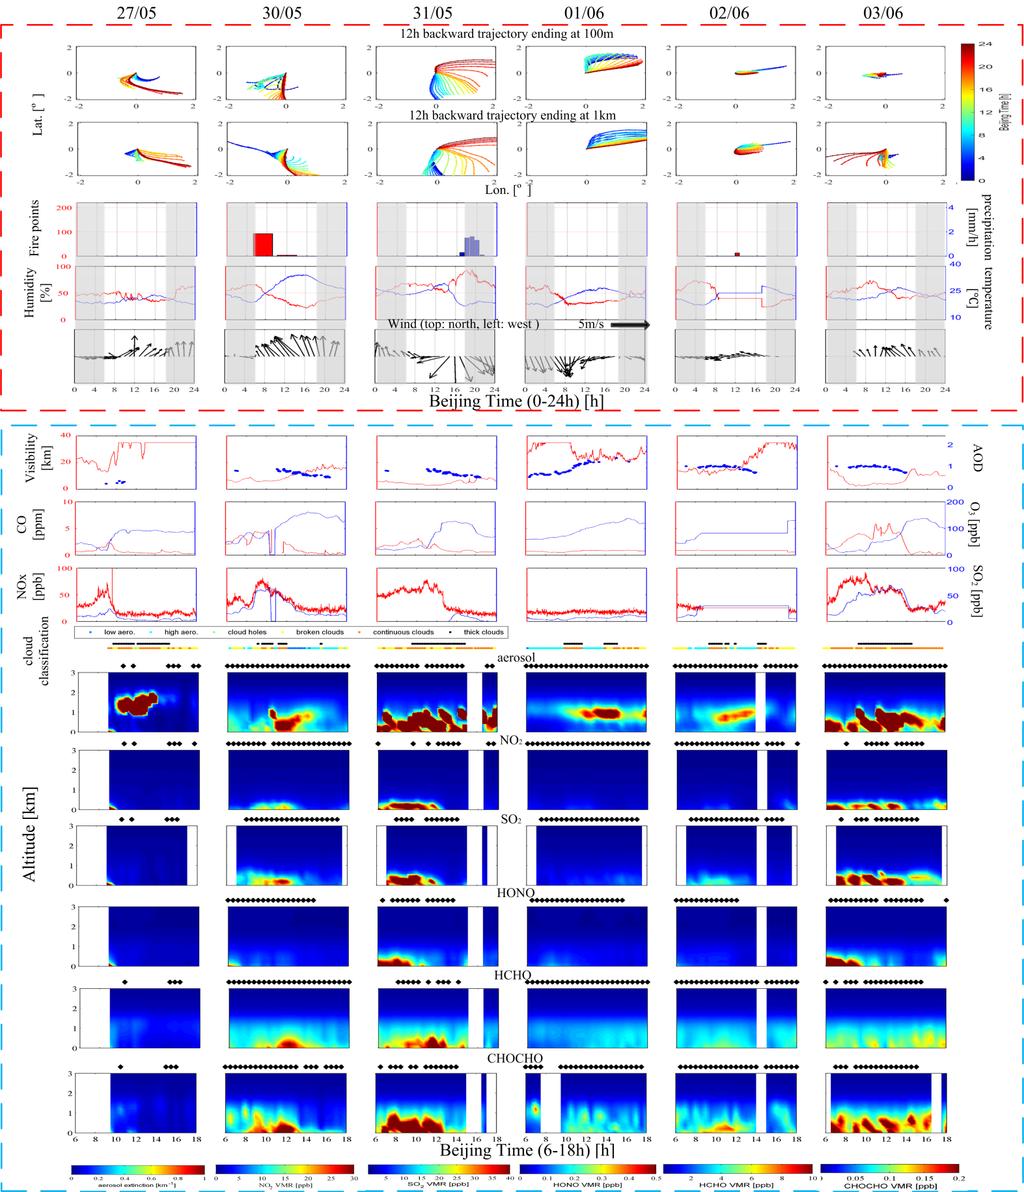
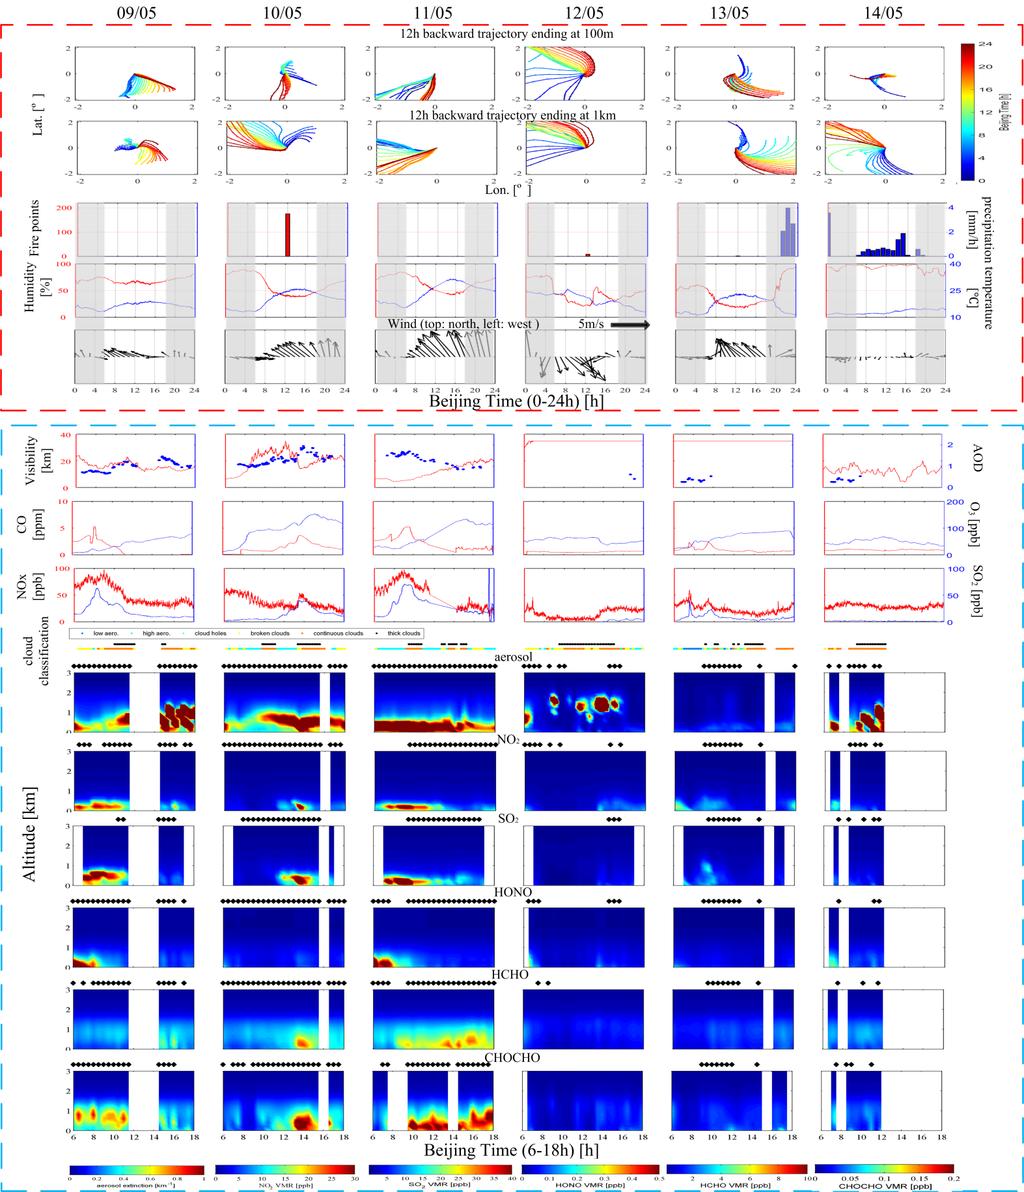
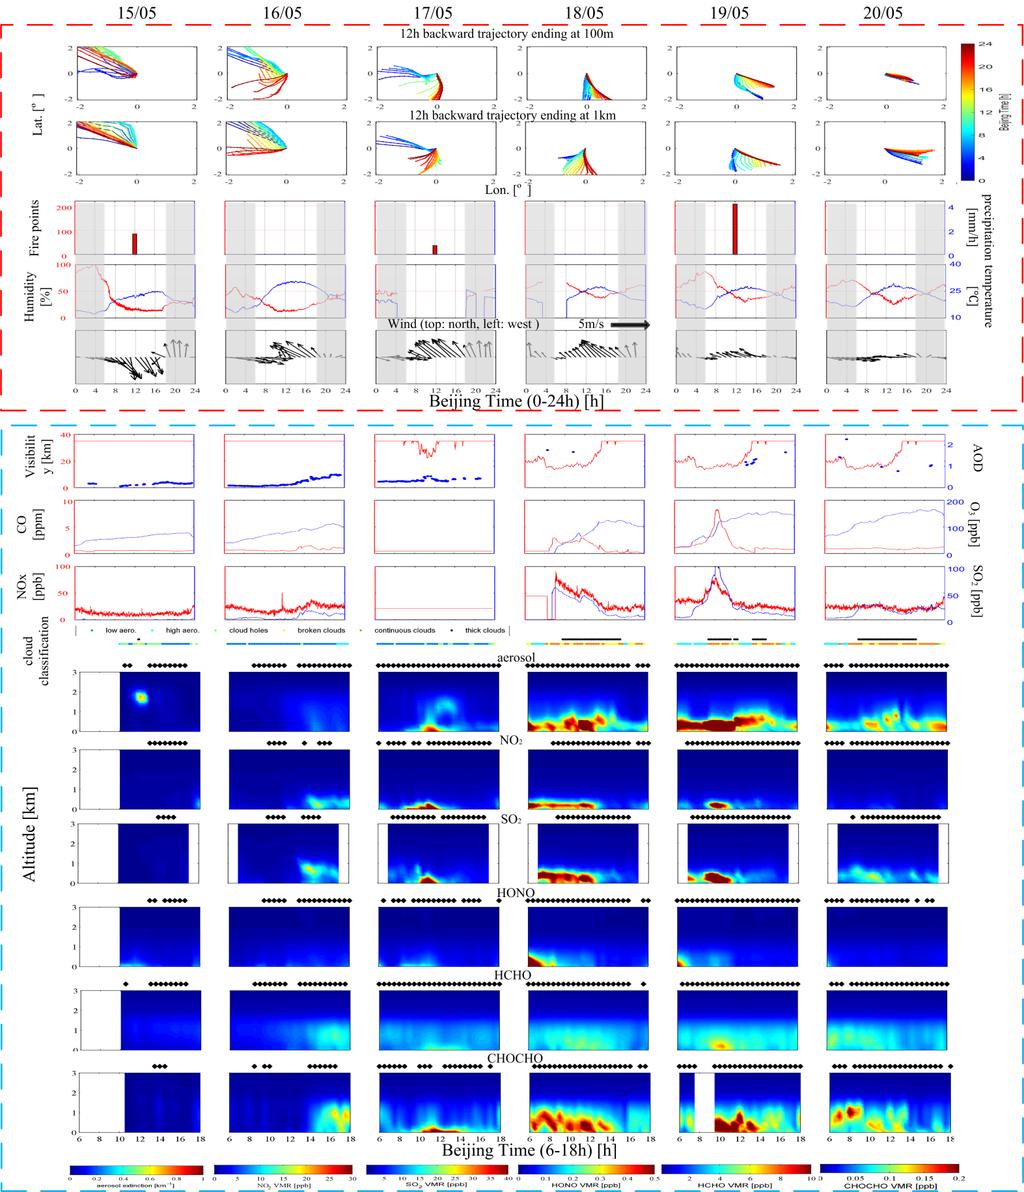
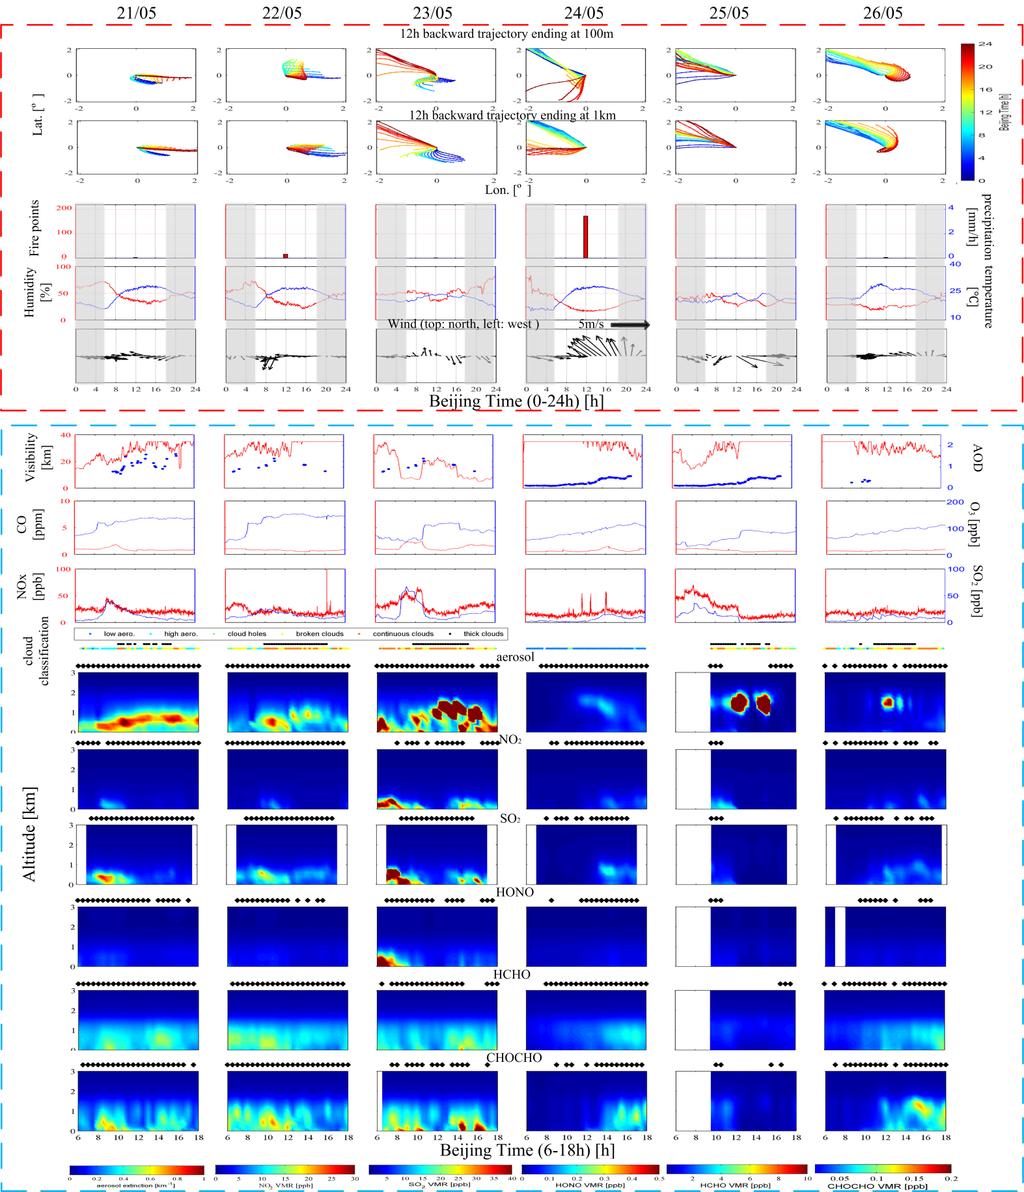
6

7 Figure S3: Results from MAX-DOAS measurements, trajectories, meteorology data, and independent measurements of pollutants during the whole measurement period. See Fig. 10 in the main manuscript.
8 (a)
9 (b)
10 (c)
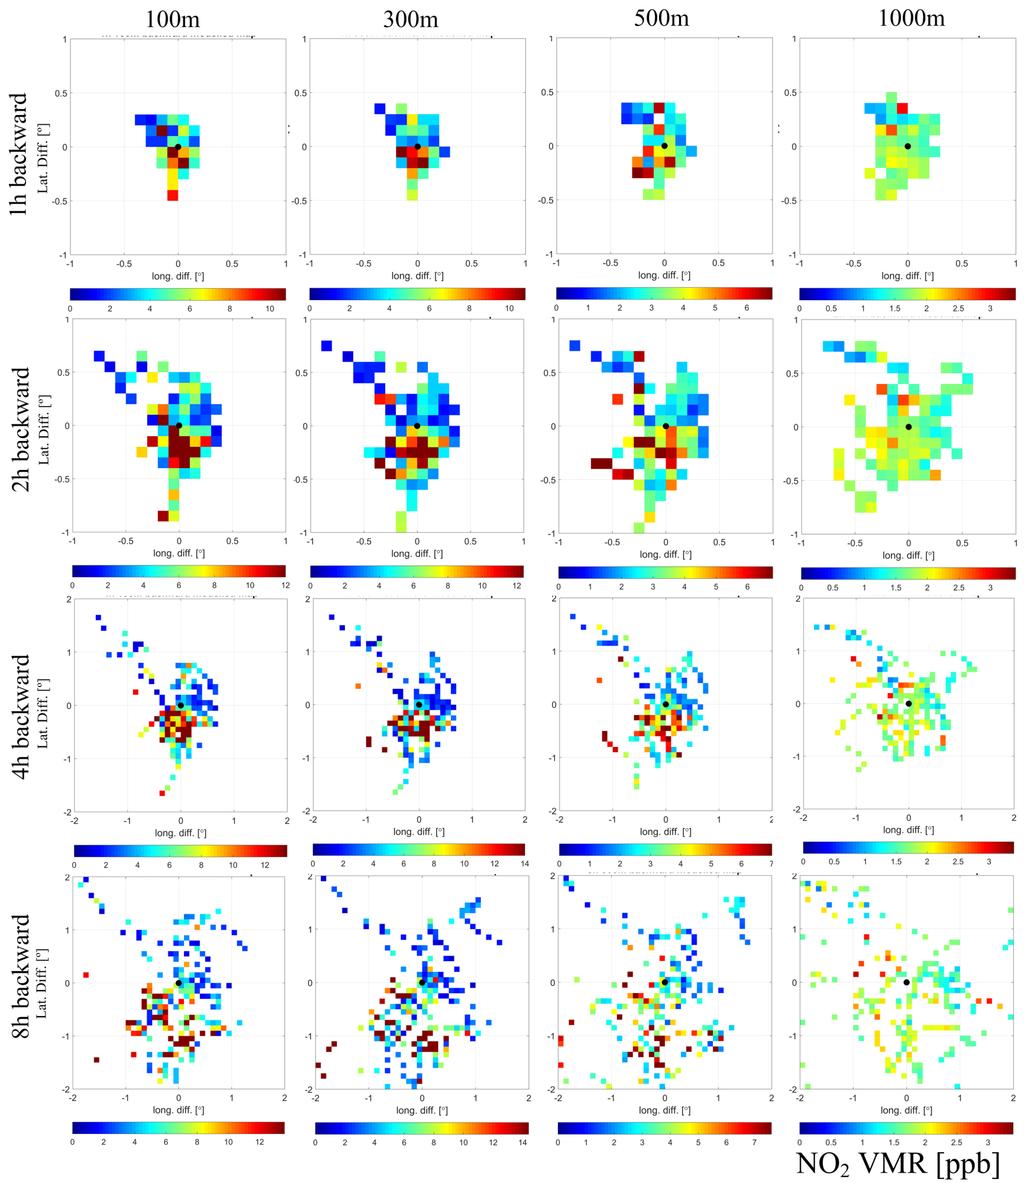
11 (d) Figure S4: Average reproduced maps of VMRs of NO 2 (a), SO 2 (b), HCHO (c), and aerosol extinctions (d) based on MAX-DOAS results and backward trajectories at different altitudes (different columns of subfigures) with different backward times (different rows of subfigures).
12 Figure S5: Nighttime (0-6h) and daytime (7-18h) contributions (colorbar) of air mass from different locations into the measurement area along the 6h backward trajectories in the three groups of days during the whole measurement period. The days are sorted into the three groups based on the dominant directions (southerly, north-westerly, and easterly) of trajectories. The white areas represent no trajectories passing the areas.
APPENDIX G-7 METEROLOGICAL DATA
 APPENDIX G-7 METEROLOGICAL DATA METEOROLOGICAL DATA FOR AIR AND NOISE SAMPLING DAYS AT MMR Monthly Normals and Extremes for Honolulu International Airport Table G7-1 MMR RAWS Station Hourly Data Tables
Weather Station: WH_500_Series. Battery Voltage
 Battery Voltage 12.800 12.795 12.790 Voltage 12.785 12.780 12.775 12.770 Apr 2015 8 Wed 15 Wed 22 Wed 1 Fri Time Page 1 Date Batt Volt Min 4/1/2015 12.77 4/2/2015 12.78 4/3/2015 12.80 4/4/2015 12.79 4/5/2015
MAX-DOAS observations of NO 2 in NDACC: status and perspectives
 MAX-DOAS observations of NO 2 in NDACC: status and perspectives F. Hendrick 31/01/2015 C. Gielen, G. Pinardi, B. Langerock, M. De Mazière, and M. Van Roozendael Royal Belgian Institute for Space Aeronomy
LOCAL CLIMATOLOGICAL DATA Monthly Summary July 2013
 Deg. Days Precip Ty Precip Wind Solar Hu- Adj. to Sea Level mid- ity Avg Res Res Peak Minute 1 fog 2 hvy fog 3 thunder 4 ice plt 5 hail 6 glaze 7 duststm 8 smk, hz 9 blw snw 1 2 3 4A 4B 5 6 7 8 9 12 14
MAX-DOAS observations of NO 2 in NDACC: status and perspectives
 MAX-DOAS observations of NO 2 in NDACC: status and perspectives F. Hendrick 31/01/2015 C. Gielen, G. Pinardi, B. Langerock, M. De Mazière, and M. Van Roozendael Royal Belgian Institute for Space Aeronomy
Investigation of the effects of horizontal gradients of trace gases, aerosols and clouds on the validation of tropospheric TROPOMI products (TROPGRAD)
") Investigation of the effects of horizontal gradients of trace gases, aerosols and clouds on the validation of tropospheric TROPOMI products (TROPGRAD) T. Wagner, J. Remmers, S. Beirle, Y. Wang MPI for
Investigation of the effects of horizontal gradients of trace gases, aerosols and clouds on the validation of tropospheric TROPOMI products (TROPGRAD) T. Wagner, J. Remmers, S. Beirle, Y. Wang MPI for
Comparing the diurnal and seasonal variabilities of atmospheric and surface urban heat islands based on the Beijing urban meteorological network
 Comparing the diurnal and seasonal variabilities of atmospheric and surface urban heat islands based on the Beijing urban meteorological network Kaicun Wang, Shaojing Jiang, Jiankai Wang, Chunlüe Zhou,
LOCAL CLIMATOLOGICAL DATA Monthly Summary September 2016
 Deg. Days Precip Ty Precip Wind Solar Hu- Adj. to Sea Level mid- ity Avg Res Res Peak 2 Minute 1 fog 2 hvy fog 3 thunder 4 ice plt 5 hail 6 glaze 7 duststm 8 smk, hz 9 blw snw 1 2 3 4A 4B 5 6 7 8 9 11
Supplement of Iodine oxide in the global marine boundary layer
 Supplement of Atmos. Chem. Phys., 1,, 01 http://www.atmos-chem-phys.net/1//01/ doi:.1/acp-1--01-supplement Author(s) 01. CC Attribution.0 License. Supplement of Iodine oxide in the global marine boundary
LOCAL CLIMATOLOGICAL DATA Monthly Summary November 2006
 Deg. Days Precip Ty Precip Wind Sun Hu- Adj. to Sea Level mid- ity Avg Res Res Peak Minute 1 fog 2 hvy fog 3 thunder 4 ice plt 5 hail 6 glaze 7 duststm 8 smk, hz 9 blw snw 1 2 3 4A 4B 5 6 7 8 9 12 14 15
Analysis on Factors of Summer Temperature Distribution in the Basin City
 Analysis on Factors of Summer Temperature Distribution in the Basin City SHOHEI NOGUCHI 1, TAKAHIRO TANAKA 2, SATORU SADOHARA 3 1 Graduate School of Engineering, Hiroshima University, Higashihiroshima,
BUMBA Belgian Urban NO2 Monitoring Based on APEX hyperspectral data. Koen Meuleman and the BUMBA team (special thanks to F.
 BUMBA Belgian Urban NO2 Monitoring Based on APEX hyperspectral data Koen Meuleman and the BUMBA team (special thanks to F. Tack BIRA/ISAB) PROJECT SETUP» STEREO III Application project» Two years project
Overview on UV-Vis satellite work
 Overview on UV-Vis satellite work Where we are and what possible directions are? M. Van Roozendael Belgian Institute for Space Aeronomy ACCENT AT-2 Follow up meeting, MPI Mainz, Germany, 22-23 June 2009
Implementation of SWAN model with COSMO-CLM and WRF-ARW wind forcing for the Barents Sea storm events (case study).
.") IGU Regional Conference Moscow 2015 Implementation of SWAN model with COSMO-CLM and WRF-ARW wind forcing for the Barents Sea storm events (case study). Stanislav Myslenkov 1, Vladimir Platonov 2 and Pavel
IGU Regional Conference Moscow 2015 Implementation of SWAN model with COSMO-CLM and WRF-ARW wind forcing for the Barents Sea storm events (case study). Stanislav Myslenkov 1, Vladimir Platonov 2 and Pavel
The Climate of Marshall County
 The Climate of Marshall County Marshall County is part of the Crosstimbers. This region is a transition region from the Central Great Plains to the more irregular terrain of southeastern Oklahoma. Average
SAMPLE. SITE SPECIFIC WEATHER ANALYSIS Wind Report. Robinson, Smith & Walsh. John Smith REFERENCE:
 SAMPLE SITE SPECIFIC WEATHER ANALYSIS Wind Report PREPARED FOR: Robinson, Smith & Walsh John Smith REFERENCE: JACK HIGGINS / 4151559-01 CompuWeather Sample Report Please note that this report contains
Atmospheric Measurements from Space
 Atmospheric Measurements from Space MPI Mainz Germany Thomas Wagner Satellite Group MPI Mainz Part 1: Basics Break Part 2: Applications Part 1: Basics of satellite remote sensing Why atmospheric satellite
Chapter 3. Materials and Methods
 Chapter 3 Materials and Methods CHAPTER3 MATERIALS AND METHODS The present study aims to identify the role of climatic factors in the dispersal of air pollutants released into the atmosphere at some important
The Climate of Payne County
 The Climate of Payne County Payne County is part of the Central Great Plains in the west, encompassing some of the best agricultural land in Oklahoma. Payne County is also part of the Crosstimbers in the
Remote Sensing of Atmospheric Trace Gases Udo Frieß Institute of Environmental Physics University of Heidelberg, Germany
 Remote Sensing of Atmospheric Trace Gases Udo Frieß Institute of Environmental Physics University of Heidelberg, Germany CREATE Summer School 2013 Lecture B, Wednesday, July 17 Remote Sensing of Atmospheric
Greater Toronto Area/ Clean Air Council. Air Quality Modeling Pilot Project
 Greater Toronto Area/ Clean Air Council Air Quality Modeling Pilot Project Liveable Peel Conference February 10th, 2006 Anthony Ciccone, Ph.D., P.Eng. Principal Golder Associates Limited 2390 Argentia
Format of CLIGEN weather station statistics input files. for CLIGEN versions as of 6/2001 (D.C. Flanagan).
.") Format of CLIGEN weather station statistics input files for CLIGEN versions 4.1-5.1 as of 6/2001 (D.C. Flanagan). updated 12/11/2008 - Jim Frankenberger These files are also known as CLIGEN state files
Format of CLIGEN weather station statistics input files for CLIGEN versions 4.1-5.1 as of 6/2001 (D.C. Flanagan). updated 12/11/2008 - Jim Frankenberger These files are also known as CLIGEN state files
The Climate of Murray County
 The Climate of Murray County Murray County is part of the Crosstimbers. This region is a transition between prairies and the mountains of southeastern Oklahoma. Average annual precipitation ranges from
The Climate of Seminole County
 The Climate of Seminole County Seminole County is part of the Crosstimbers. This region is a transition region from the Central Great Plains to the more irregular terrain of southeastern Oklahoma. Average
MAX-DOAS air quality observations at Phimai,
 MAX-DOAS air quality observations at Phimai, Thailand, conducted in the framework of SKYNET Hitoshi Irie Center for Environmental Remote Sensing (CEReS) Chiba University, Japan 1 T. Takamura, 1 P. Khatri,
The Climate of Texas County
 The Climate of Texas County Texas County is part of the Western High Plains in the north and west and the Southwestern Tablelands in the east. The Western High Plains are characterized by abundant cropland
APPENDIX 3.6-A Support Information for Newcastle, Wyoming Meteorological Monitoring Site
 APPENDIX 3.6-A Support Information for Newcastle, Wyoming Meteorological Monitoring Site September 2012 3.6-A-i Appendix 3.6-A This page intentionally left blank September 2012 Appendix 3.6-A APPENDIX
The Climate of Pontotoc County
 The Climate of Pontotoc County Pontotoc County is part of the Crosstimbers. This region is a transition region from the Central Great Plains to the more irregular terrain of southeast Oklahoma. Average
SAMPLE. SITE SPECIFIC WEATHER ANALYSIS Wind Report. Robinson, Smith & Walsh. John Smith. July 1, 2017 REFERENCE: 1 Maple Street, Houston, TX 77034
 SAMPLE SITE SPECIFIC WEATHER ANALYSIS Wind Report PREPARED FOR: Robinson, Smith & Walsh John Smith July 1, 2017 REFERENCE: JACK HIGGINS / 4151559-01 1 Maple Street, Houston, TX 77034 CompuWeather Sample
The Cabauw Intercomparison campaign of Nitrogen Dioxide measuring Instruments
 The Cabauw Intercomparison campaign of Nitrogen Dioxide measuring Instruments Ankie Piters, KNMI and CINDI Organisation Team Cabauw Intercomparison campaign of Nitrogen Dioxide measuring Instruments Main
The Climate of Kiowa County
 The Climate of Kiowa County Kiowa County is part of the Central Great Plains, encompassing some of the best agricultural land in Oklahoma. Average annual precipitation ranges from about 24 inches in northwestern
Determining correction factors for seasonal and regional variability in
 Determining correction factors for seasonal and regional variability in the tracer ratio method: The seasonal variability in the ΔCFC-12:ΔCO and ΔCFC-11:ΔCO enhancement ratios, observed during a three
Research on Characteristics of Atmospheric Pollution and Meteorological Condition in South of Northern China
 Journal of Geoscience and Environment Protection, 2017, 5, 73-84 http://www.scirp.org/journal/gep ISSN Online: 2327-4344 ISSN Print: 2327-4336 Research on Characteristics of Atmospheric Pollution and Meteorological
The Climate of Grady County
 The Climate of Grady County Grady County is part of the Central Great Plains, encompassing some of the best agricultural land in Oklahoma. Average annual precipitation ranges from about 33 inches in northern
3.2 Wind direction / wind velocity
 3.2 Wind direction / wind velocity The direction from which air moves to is called the wind direction, and the distance air moves per unit time is the wind velocity. Wind has to be measured not only as
The Climate of Haskell County
 The Climate of Haskell County Haskell County is part of the Hardwood Forest. The Hardwood Forest is characterized by its irregular landscape and the largest lake in Oklahoma, Lake Eufaula. Average annual
The Climate of Bryan County
 The Climate of Bryan County Bryan County is part of the Crosstimbers throughout most of the county. The extreme eastern portions of Bryan County are part of the Cypress Swamp and Forest. Average annual
Research on Application of BP Artificial Neural Network in Prediction of the concentration of PM2.5 in Beijing
 4th International Conference on Sensors, Measurement and Intelligent Materials (ICSMIM 2015) Research on Application of BP Artificial Neural Network in Prediction of the concentration of PM2.5 in Beijing
May 2017 Weather Summary P a g e 1 Alexander, P.J. & Power, S.
 May 2017 Weather Summary P a g e 1 May 2017 Beaufort Weather Station Summary Logistics May was the first full month of operation of the MaREI weather observing system (WOS) located on the grounds of the
Rapid formation and evolution of an extreme haze episode in
 Supplementary Information Rapid formation and evolution of an extreme haze episode in Northern China during winter 1 Yele Sun 1,*, Chen Chen 1,, Yingjie Zhang 1,, Weiqi Xu 1,3, Libo Zhou 1, Xueling Cheng
METEOROLOGY AND AIR POLLUTION. JAI PRAKASH Civil Engineering IIT Delhi 1 AUGUST, 2011
 METEOROLOGY AND AIR POLLUTION JAI PRAKASH Civil Engineering IIT Delhi 1 AUGUST, 2011 METEOROLOGY Aerosols particles which are emitted from the sources they are transported and dispersed through meteorological
Natural Event Documentation
 ADDENDUM Natural Event Documentation Corcoran, Oildale and Bakersfield, California September 22, 2006 San Joaquin Valley Unified Air Pollution Control District May 23, 2007 Natural Event Documentation
The effects of dust emission on the trans- Pacific transport of Asian dust in the CESM
 The effects of dust emission on the trans- Pacific transport of Asian dust in the CESM Mingxuan Wu, Xiaohong Liu, Zhien Wang, Kang Yang, Chenglai Wu University of Wyoming Kai Zhang, Hailong Wang Pacific
Decrease of light rain events in summer associated with a warming environment in China during
 GEOPHYSICAL RESEARCH LETTERS, VOL. 34, L11705, doi:10.1029/2007gl029631, 2007 Decrease of light rain events in summer associated with a warming environment in China during 1961 2005 Weihong Qian, 1 Jiaolan
SHADOW - Main Result. windpro CUMULTATIEVE EFFECTEN SLAGSCHADUW HERENTALS. EDF Luminus Markiesstraat Brussel
 SHADOW - Main Result Assumptions for shadow calculations Maximum distance for influence Calculate only when more than 20 % of sun is covered by the blade Please look in WTG table Minimum sun height over
Parallel measurements of formaldehyde (H 2 CO) at the Jungfraujoch station: Preliminary FTIR results and first comparison with MAXDOAS data
 at the Jungfraujoch station: Preliminary FTIR results and first comparison with MAXDOAS data") Parallel measurements of formaldehyde (H 2 CO) at the Jungfraujoch station: Preliminary FTIR results and first comparison with MAXDOAS data B. Franco 1, E. Mahieu 1, M. Van Roozendael 2, F. Hendrick 2,
Parallel measurements of formaldehyde (H 2 CO) at the Jungfraujoch station: Preliminary FTIR results and first comparison with MAXDOAS data B. Franco 1, E. Mahieu 1, M. Van Roozendael 2, F. Hendrick 2,
BIRA-IASB, Brussels, Belgium: (2) KNMI, De Bilt, Netherlands.
 KNMI, De Bilt, Netherlands.") Tropospheric CH 2 O Observations from Satellites: Error Budget Analysis of 12 Years of Consistent Retrieval from GOME and SCIAMACHY Measurements. A contribution to ACCENT-TROPOSAT-2, Task Group 1 I. De
Tropospheric CH 2 O Observations from Satellites: Error Budget Analysis of 12 Years of Consistent Retrieval from GOME and SCIAMACHY Measurements. A contribution to ACCENT-TROPOSAT-2, Task Group 1 I. De
Remote Measurement of Tropospheric NO 2 by a Dual MAX-DOAS over Guangzhou During the 2008 PRD Campaign
 Session h A&WMA International Specialty Conference, 10-14 May 2010, China Ih: Remote Sensing Technologies for Source Monitoring Remote Measurement of Tropospheric NO 2 by a Dual MAX- over Guangzhou During
BrO PROFILING FROM GROUND-BASED DOAS OBSERVATIONS: NEW TOOL FOR THE ENVISAT/SCIAMACHY VALIDATION
 BrO PROFILING FROM GROUND-BASED DOAS OBSERVATIONS: NEW TOOL FOR THE ENVISAT/SCIAMACHY VALIDATION F. Hendrick (1), M. Van Roozendael (1), M. De Mazière (1), A. Richter (2), A. Rozanov (2), C. Sioris (3),
TAPM Modelling for Wagerup: Phase 1 CSIRO 2004 Page 41
 We now examine the probability (or frequency) distribution of meteorological predictions and the measurements. Figure 12 presents the observed and model probability (expressed as probability density function
Algorithms/Results (SO 2 and ash) based on SCIAMACHY and GOME-2 measurements
 based on SCIAMACHY and GOME-2 measurements") ESA/EUMETSAT Workshop on Volcanic Ash Monitoring ESA/ESRIN, Frascati, 26-27 May 2010 Algorithms/Results (SO 2 and ash) based on SCIAMACHY and GOME-2 measurements Nicolas THEYS H. Brenot, J. van Gent and
ESA/EUMETSAT Workshop on Volcanic Ash Monitoring ESA/ESRIN, Frascati, 26-27 May 2010 Algorithms/Results (SO 2 and ash) based on SCIAMACHY and GOME-2 measurements Nicolas THEYS H. Brenot, J. van Gent and
MACIS documentation. a. Temporal resolution: For each month and the hole year
 MACIS documentation Wind: 1. Relative frequency of mean wind speed b. Treshold values: mean wind speed greater, greater equal, less, less equal 3, 5, 10, 12, 15 20, 22, 25 kt 2. Relative frequency of gusts
Stratospheric aerosol profile retrieval from SCIAMACHY limb observations
 Stratospheric aerosol profile retrieval from SCIAMACHY limb observations Yang Jingmei Zong Xuemei Key Laboratory of Middle Atmosphere and Global Environment Observation (LAGEO), Institute of Atmospheric
Remote sensing of haze aerosol over eastern China
 ISALSaRS'17, USTC, 21-June-2017 China University of Mining and Technology Remote sensing of haze aerosol over eastern China Qin Kai( 秦凯 ), CUMT ( 中国矿业大学 ) Wu Lixin, CSU( 中南大学 ) Wong Mansing, Hong Kong
Impact of urbanization on boundary layer structure in Beijing
 Climatic Change (13) 1:13 136 DOI 1.17/s1584-13-788- Impact of urbanization on boundary layer structure in Beijing Miao Yu & Yimin Liu & Yifeng Dai & Aqiang Yang Received: 6 October 1 / Accepted: 6 May
Retrievals of methane from IASI radiance spectra and comparisons with ground-based FTIR measurements
 ACCENT-AT2 follow-up meeting, 22-23 June 2009, Mainz, Germany Retrievals of methane from IASI radiance spectra and comparisons with ground-based FTIR measurements Tobias Kerzenmacher 1, Nicolas Kumps 1,
Atmospheric Chemistry and Physics
 Atmos. Chem. Phys., 7, 19 133, 27 www.atmos-chem-phys.net/7/19/27/ Author(s) 27. This work is licensed under a Creative Commons License. Atmospheric Chemistry and Physics Comparison of box-air-mass-factors
Cambridge International Examinations Cambridge Ordinary Level
 Cambridge International Examinations Cambridge Ordinary Level *8834141397* GEOGRAPHY 2217/23 Paper 2 May/June 218 Candidates answer on the Question Paper. Additional Materials: Ruler Calculator Protractor
The Current Status of Aerosol Remote Sensing in China
 The Current Status of Aerosol Remote Sensing in China Prof. Dr. Yong Xue Institute of Remote Sensing and Digital Earth, Chinese Academy of Sciences, China Outline Introduction Ground-Based Aerosol Remote
Key Laboratory of Environment Optics and Technology, Anhui Institute of Optics and Fine Mechanics, Chinese Academy of Science, Hefei , China 4
 1 2 3 Aerosol optical characteristics and their vertical distributions under enhanced haze pollution events: effect of the regional transport of different aerosol types over eastern China 4 5 6 7 8 9 10
CH Stretching Excitation Promotes its Cleavage in. Collision Energies
 Electronic Supplementary Material (ESI) for Physical Chemistry Chemical Physics. This journal is the Owner Societies 2017 Electronic supplementary information for CH Stretching Excitation Promotes its
SACS & SACS2 an overview and recent developments
 SACS & SACS2 an overview and recent developments L. Clarisse (1), N. Theys (2), H. Brenot (2), J. van Gent (2), R. van der A (4), P. Valks (5), M. Van Roozendael (2), D. Hurtmans (1), P.-F. Coheur (1),
Monsoon Activities in China Tianjun ZHOU
 Monsoon Activities in China Tianjun ZHOU Email: zhoutj@lasg.iap.ac.cn CLIVAR AAMP10, Busan,, Korea 18-19 19 June 2010 Outline Variability of EASM -- Interdecadal variability -- Interannual variability
Measurement and Analysis of the Vertical Distribution Characteristic of the Atmospheric Particle Concentration in Beijing District
 International Journal of Environmental Science and Development, Vol. 5, No. 2, April 214 Measurement and Analysis of the Vertical Distribution Characteristic of the Atmospheric Particle Concentration in
Lunar Eclipse of June, 15, 2011: Three-color umbra surface photometry
 Lunar Eclipse of June, 15, 2011: Three-color umbra surface photometry Oleg S. Ugolnikov 1, Igor A. Maslov 1,2, Stanislav A. Korotkiy 3 1 Space Research Institute, Russian Academy of Sciences, Russia 2
Observation of Smoke and Dust Plume Transport and Impact on the Air Quality Remote Sensing in New York City
 Observation of Smoke and Dust Plume Transport and Impact on the Air Quality Remote Sensing in New York City Yonghua Wu*, Chowdhury Nazmi, Cuiya Li, Daniel Hoyos, Barry Gross, Fred Moshary NOAA-CREST and
Field Experiment on the Effects of a Nearby Asphalt Road on Temperature Measurement
 8.3 Field Experiment on the Effects of a Nearby Asphalt Road on Temperature Measurement T. Hamagami a *, M. Kumamoto a, T. Sakai a, H. Kawamura a, S. Kawano a, T. Aoyagi b, M. Otsuka c, and T. Aoshima
obtuse triangle close N with the nearest star 1.8' NW.
 Abell 262 - Observing Notes I observed the cluster on eight occasions and identified a total of 47 cluster members down to photographic magnitude 15.7, the majority of which are so-called anonymous galaxies
Physicochemical and Optical Properties of Aerosols in South Korea
 Physicochemical and Optical Properties of Aerosols in South Korea Seungbum Kim, Sang-Sam Lee, Jeong-Eun Kim, Ju-Wan Cha, Beom-Cheol Shin, Eun-Ha Lim, Jae-Cheol Nam Asian Dust Research Division NIMR/KMA
Short Cruise Report - RV Maria S. Merian, cruise MSM-58/2 -
 Lisa Behrens Institut für Umweltphysik/MARUM Universität Bremen Otto-Hahn-Allee 1 28359 Bremen Germany Tel.: +49(0)421 218 62093 Fax: +49(0)421 218 98 62133 email: lbehrens@iup.physik.uni-bremen.de Short
Satellite retrieval of cloud condensation nuclei (CCN) concentrations for convective clouds
 concentrations for convective clouds") Satellite retrieval of cloud condensation nuclei (CCN) concentrations for convective clouds Youtong Zheng 1, Daniel Rosenfeld 2, Zhanqing Li 1 1 Department of Atmospheric and Oceanic Science, University
Satellite retrieval of cloud condensation nuclei (CCN) concentrations for convective clouds Youtong Zheng 1, Daniel Rosenfeld 2, Zhanqing Li 1 1 Department of Atmospheric and Oceanic Science, University
3.3 AN OBSERVATIONAL ANALYSIS OF VERTICAL DISTRIBUTIONS OF SO 2 IN THE SURFACE LAYER OF BEIJING DURING COLD WAVE PASSING IN WINTER
 3.3 AN OBSERVATIONAL ANALYSIS OF VERTICAL DISTRIBUTIONS OF SO 2 IN THE SURFACE LAYER OF BEIJING DURING COLD WAVE PASSING IN WINTER LIU FENG 1,2 *,CHEN HUI 2,XU YONGFU 2,HU FEI 2, WANG MINGXING 2, SHI LIQING
Comparison of column-integrated aerosol optical and physical properties in Beijing and Xianghe
 Comparison of column-integrated aerosol optical and physical properties in Beijing and Xianghe Fan X.H., Chen H.B., Xia X.A. Key Laboratory of Middle Atmosphere and Global Environment Observation (LAGEO),
Supplement of Cloud and aerosol classification for 2.5 years of MAX-DOAS observations in Wuxi (China) and comparison to independent data sets
 and comparison to independent data sets") Supplement of Atmos. Meas. Tech., 8, 5133 5156, 215 http://www.atmos-meas-tech.net/8/5133/215/ doi:1.5194/amt-8-5133-215-supplement Author(s) 215. CC Attribution 3. License. Supplement of Cloud and aerosol
Supplement of Atmos. Meas. Tech., 8, 5133 5156, 215 http://www.atmos-meas-tech.net/8/5133/215/ doi:1.5194/amt-8-5133-215-supplement Author(s) 215. CC Attribution 3. License. Supplement of Cloud and aerosol
Map reading notes. It is a very useful kind of map that shows the topography of an area, i.e whether it is flat, undulating, rugged or mountainous
 Introduction Map reading notes In the course of 2 or 3 years course, Candidates will be exposed to topographical maps from tropical countries such as Mauritius, Tanzania, Zimbabwe and Jamaica. Many of
EXTRACTION OF THE DISTRIBUTION OF YELLOW SAND DUST AND ITS OPTICAL PROPERTIES FROM ADEOS/POLDER DATA
 EXTRACTION OF THE DISTRIBUTION OF YELLOW SAND DUST AND ITS OPTICAL PROPERTIES FROM ADEOS/POLDER DATA Takashi KUSAKA, Michihiro KODAMA and Hideki SHIBATA Kanazawa Institute of Technology Nonoichi-machi
Modeling Study of A Typical Summer Ozone Pollution Event over Yangtze River Delta
 36 11 2015 11 ENVIRONMENTAL SCIENCE Vol 36 No 11 Nov 2015 * - - 210044 WRF /Chem 2013 8 10 ~ 18 11 ~ 13 h 15 00 WRF /Chem X51 A 0250-3301 2015 11-3981-08 DOI 10 13227 /j hjkx 2015 11 006 Modeling Study
CAMARGO RANCH, llc. CRAIG BUFORD BufordResources.com
 CAMARGO RANCH, llc 2897 +/- acre Wheat & Cattle Farm Mangum, greer county, oklahoma CRAIG BUFORD 405-833-9499 BufordResources.com 4101 Perimeter Center Dr., Suite 107 Oklahoma City, OK 73112 405.833.9499
Aerosol-Cloud-Climate Interaction: A Case Study from the Indian Ocean. Sagnik Dey
 Aerosol-Cloud-Climate Interaction: A Case Study from the Indian Ocean Sagnik Dey Centre for Atmospheric Sciences Indian Institute of Technology Delhi sagnik@cas.iitd.ac.in Content Background and Motivation
APPLICATION OF CCNY LIDAR AND CEILOMETERS TO THE STUDY OF AEROSOL TRANSPORT AND PM2.5 MONITORING
 P1.14 APPLICATION OF CCNY LIDAR AND CEILOMETERS TO THE STUDY OF AEROSOL TRANSPORT AND PM2.5 MONITORING Leona A. Charles*, Shuki Chaw, Viviana Vladutescu, Yonghua Wu, Fred Moshary, Barry Gross, Stanley
EVALUATION OF VENTILATION PERFORMANCE IN VOID SPACE BY EXCEEDANCE PROBABILITIES BASED ON CFD SIMULATION
 EVALUATION OF VENTILATION PERFORMANCE IN VOID SPACE BY EXCEEDANCE PROBABILITIES BASED ON CFD SIMULATION Zhen BU 1, Shinsuke KATO 2, Yoshihiro ISHIDA 2, and Hong HUANG 2 1 Graduate School of Engineering,
SOFTWARE USER MANUAL. Weather Capture Advance WS1640 WM9280
 SOFTWARE USER MANUAL Weather Capture Advance WS1640 WM9280 1 TABLE OF CONTENTS 1. Introduction 3 1.1 System requirements 1.2 Connection of the weather station 1.3 Installation of the Weather Capture Advance
H SMALL SCALE PARTICULATE MATTER MEASUREMENTS AND DISPERSION MODELLING IN THE INNER CITY OF LIEGE, BELGIUM
 H14-198 SMALL SCALE PARTICULATE MATTER MEASUREMENTS AND DISPERSION MODELLING IN THE INNER CITY OF LIEGE, BELGIUM Hendrik Merbitz 1, Francois Detalle 2, Gunnar Ketzler 1, Christoph Schneider 1, Fabian Lenartz
Surface Ozone Problem in Two Polluted Regions in China and VOGA-NCP 2013 Summer Campaign
 Surface Ozone Problem in Two Polluted Regions in China and VOGA-NCP 2013 Summer Campaign Liang Ran Key Laboratory of Middle Atmosphere and Global Environment Observation (LAGEO) Institute of Atmospheric
The Status of Meteorological Observation in the Asian Countries
 The Status of Meteorological Observation in the Asian Countries 19 February 2013 Kunio AKATSU JICA Advisor, JICA H/Q (Meteorology) Self-Introduction Countries visited or stayed as ODA Projects, mainly
ADVANCES IN EARTH SCIENCE
 29 2 2014 2 ADVANCES IN EARTH SCIENCE Vol. 29 No. 2 Feb. 2014. J. 2014 29 2 207-215 doi 10. 11867 /j. issn. 1001-8166. 2014. 02. 0207. Ma Yaoming Hu Zeyong Tian Lide et al. Study progresses of the Tibet
Numerical Simulation of Wind and Temperature Fields over Beijing Area in Summer
 120 ACTA METEOROLOGICA SINICA VOL.19 Numerical Simulation of Wind and Temperature Fields over Beijing Area in Summer HU Xiaoming 1 ( ), LIU Shuhua 1 ( ), WANG Yingchun 2 ( ), and LI Ju 2 ( ) 1 Group of
Table of ceasefire violations as of 20 December
 Table of ceasefire violations as of 20 December 2018 1 SMM position Event location Means No. Observation Description Weapon Date, time SMM camera in 2-4km SE Recorded 2 Explosion Impact N/K 20-Dec, 05:33
Advising Growers on Conditions for Sugarcane Burning in Cauca Valley (Colombia) Using Data Obtained From an Automated Weather Network
 Using Data Obtained From an Automated Weather Network") Advising Growers on Conditions for Sugarcane Burning in Cauca Valley (Colombia) Using Data Obtained From an Automated Weather Network Enrique Cortés-Betancourt Area of Meteorology CENICAÑA Cali, Colombia
Advising Growers on Conditions for Sugarcane Burning in Cauca Valley (Colombia) Using Data Obtained From an Automated Weather Network Enrique Cortés-Betancourt Area of Meteorology CENICAÑA Cali, Colombia
Meteorological and Dispersion Modelling Using TAPM for Wagerup
 Meteorological and Dispersion Modelling Using TAPM for Wagerup Phase 1: Meteorology Appendix A: Additional modelling details Prepared for: Alcoa World Alumina Australia, P. O. Box 252, Applecross, Western
Space-based Constraints on VOC Emissions in the Pearl River Delta
 Christopher Chan Miller 7th International GEOS-Chem Meeting 5//15 Thanks to Daniel Jacob, Kelly Chance and Gonzalo Gonzalaz-Abad! Space-based Constraints on VOC Emissions in the Pearl River Delta Glyoxal:
FRAPPÉ/DISCOVER-AQ (July/August 2014) in perspective of multi-year ozone analysis
 in perspective of multi-year ozone analysis") FRAPPÉ/DISCOVER-AQ (July/August 2014) in perspective of multi-year ozone analysis Project Report #2: Monitoring network assessment for the City of Fort Collins Prepared by: Lisa Kaser kaser@ucar.edu ph:
FRAPPÉ/DISCOVER-AQ (July/August 2014) in perspective of multi-year ozone analysis Project Report #2: Monitoring network assessment for the City of Fort Collins Prepared by: Lisa Kaser kaser@ucar.edu ph:
The Pontchartrain Maurepas Surge Consortium (LPMSC) Lake Sloshing Effect Preliminary Findings
 Lake Sloshing Effect Preliminary Findings") The Pontchartrain Maurepas Surge Consortium (LPMSC) Lake Sloshing Effect Preliminary Findings Lake Pontchartrain Basin Foundation John A. Lopez, Ph.D. with contributions from Dr. Joe Suhayda, Dr. Hal Needham,
The Pontchartrain Maurepas Surge Consortium (LPMSC) Lake Sloshing Effect Preliminary Findings Lake Pontchartrain Basin Foundation John A. Lopez, Ph.D. with contributions from Dr. Joe Suhayda, Dr. Hal Needham,
Supplement of Studying the vertical aerosol extinction coefficient by comparing in situ airborne data and elastic backscatter lidar
 Supplement of Atmos. Chem. Phys., 16, 4539 4554, 2016 http://www.atmos-chem-phys.net/16/4539/2016/ doi:10.5194/acp-16-4539-2016-supplement Author(s) 2016. CC Attribution 3.0 License. Supplement of Studying
Proceedings, International Snow Science Workshop, Breckenridge, Colorado, 2016
 CHARACTERISTICS OF AVALANCHE RELEASE AND AN APPROACH OF AVALANCHE FORECAST- ING SYSTEM USING SNOWPACK MODEL IN THE TIANSHAN MOUNTAINS, CHINA Osamu ABE 1*, Lanhai LI 2, Lei BAI 2, Jiansheng HAO 2, Hiroyuki
Wet deposition and estimates of aerosol wet scavenging coefficient for the location in north suburb of Nanjing
 Wet deposition and estimates of aerosol wet scavenging coefficient for the location in north suburb of Nanjing Yale-NUIST Center on Atmospheric Environment, NUIST School of Environmental Science and Engineering,
Analysis on the decadal scale variation of the dust storm in North China
 2260 Science in China Ser. D Earth Sciences 2005 Vol.48 No.12 2260 2266 Analysis on the decadal scale variation of the dust storm in North China KANG Dujuan 1,2 & WANG Huijun 1 1. NZC/LASG, Institute of
Using Satellite Data to Analyze the Initiation and Evolution of Deep Convective Clouds
 Atmospheric and Oceanic Science Letters ISSN: 674-2834 (Print) 2376-623 (Online) Journal homepage: https://www.tandfonline.com/loi/taos20 Using Satellite Data to Analyze the Initiation and Evolution of
Geographer s Toolkit. Geography of Canada
 Geographer s Toolkit Geography of Canada www.craigmarlatt.com/school Geographer s Toolkit 1. Parts of a Map Map Symbols Mapping Your Location 2. Types of Maps 3. Political Map of Canada 4. Drainage Map
Table of ceasefire violations as of 4 December
 Table of ceasefire violations as of 4 December 2018 1 SMM position Event location Means No. Observation Description Weapon Date, time SMM camera in 2-4km SE Recorded 1 Projectile NE to SW N/K 18:52 Chermalyk