Hilbert analysis unveils inter-decadal changes in large-scale patterns of surface air temperature variability
|
|
|
- Winfred Wade
- 5 years ago
- Views:
Transcription
 Universitat Politecnica de Catalunya (2) Universidad de la República, Uruguay Cristina.masoller@upc.edu")
1 Hilbert analysis unveils inter-decadal changes in large-scale patterns of surface air temperature variability Dario A. Zappala 1, Marcelo Barreiro 2 and Cristina Masoller 1 (1) Universitat Politecnica de Catalunya (2) Universidad de la República, Uruguay Cristina.masoller@upc.edu Workshop on Nonlinear Phenomena in the Atmosphere and Ocean Volga, July 2017
 Phase (t) Frequency (t)=d (t)/dt HT[sin( t)]=cos( t) x Y=HT[x] HT[x] x 29/07/2017")
2 The Hilbert Transform of a real oscillatory signal Allows to calculate, for each data point in the time series, an instantaneous Amplitude a(t) Phase (t) Frequency (t)=d (t)/dt HT[sin( t)]=cos( t) x Y=HT[x] HT[x] x 29/07/2017 2


3 Extensively used to analyze output signals of complex systems (physiological, neurological, etc.) Rossler Can we use the amplitude, phase, frequency, to investigate synchronization in climate data and quantify regional changes? 29/07/2017 3

4 Motivation Well-defined regions with in-phase annual cycles of surface air temperature. SAT in regions with the same color SAT in regions with different color Tirabassi and Masoller EPL 2013, Sci. Rep
5 Outline Data and Hilbert method Climate Dynamics Time-series analysis Complex systems Results Univariate analysis Bivariate analysis Inter-decadal variations Summary 29/07/2017 5

6 Surface Air Temperature Datasets 29/07/2017 6
7 Hilbert analysis of surface air temperature 29/07/2017 7
8 Restriction In order to obtain meaningful instantaneous frequency, the signal has to be narrow band For a narrow band signal the number of extrema and the number of zero crossings have to equal. This condition does not hold to daily SAT time series ( noisy weather). However 29/07/2017 8
9 Even in cases where the data do not meet the mathematical or algorithmic requirements, the results of nonlinear time-series analysis can be helpful in understanding, characterizing, and predicting dynamical systems. Elizabeth Bradley and Holger Kantz Nonlinear time-series analysis revisited Chaos /07/2017 9
")
10 Average frequency The expected average frequency (one complete cycle in one year) is rad/day 29/07/2017 Zappala, Barreiro and Masoller, Entropy 18, 408 (2016) 10
 29/07/2017")
11 Standard deviation of frequency fluctuations Annual mean precipitation (mm/day) 29/07/2017 Masoller 11

12 Consistency check A real signal has narrow band behavior if relative amplitude variations are very slow when compared with phase variations. d 1 dt A da dt ( da/ dt) / A 1 29/07/


13 SAT average in a window of D days Hilbert 29/07/
14 Influence of the length of SAT averaging window Average Period (years) at (10 S, 150 E) x Window length (days) 29/07/
15 Average Period (years) at (0, 200 E) x Window length (days) quasi-biennial oscillation (QBO)? 29/07/2017 Masoller 15
16 Average period (years) Comparison with synthetic data Empirical data = =0.5 0 = 2 /365 C = norm. factor = AR(1) persistence Window length (days) Window length (days) 29/07/
 La Niña year 29/07/2017")
17 Phase dynamics Cos(phase) typical year Cos(phase) El Niño year Cos(phase) La Niña year 29/07/
, then use 3 confidence level")
18 Bivariate analysis: extra-tropics Significance: 100 surrogates (anomaly TS or Hilbert TS), then use 3 confidence level 29/07/

19 29/07/2017 Masoller 19
20 Lagged correlations? In the extra-tropics, lag (in days) cross-correlations of Hilbert frequencies. 29/07/


21 But in the El Niño region CC: anomalies CC: frequencies CC: amplitude 29/07/
22 Pre-processing data: filtering fast SAT variability Also, no significant correlations found in lagged time-series. Atmospheric dynamics in the tropics has different timescales from the extra-tropics 29/07/2017 Masoller 22

23 Network of individual oscillators 29/07/2017 Masoller 23

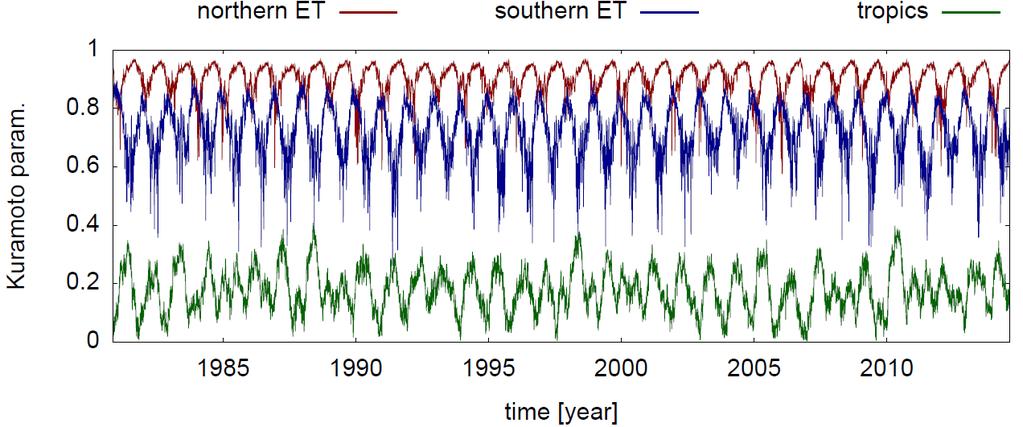
24 Quantifying phase synchronization Kuramoto order parameter 29/07/2017 Steven H. Strogatz, Nature
25 29/07/
26 Unveiling inter-decadal changes -can amplitude and frequency variations be used as a quantitative measure of regional climate change?
27 Relative inter-decadal variation (ERA-Interim, 37 years) a a a a a Significance analysis: For each amplitude time series 100 shuffle surrogates were generated, and the relative change is significant if: a a. 2 s s or a a. 2 s s 29/07/

28 Relative change of time-averaged Hilbert amplitude Melting of sea ice: during winter the air temperature is mitigated by the sea and tends to have more moderated values Decrease of precipitation: the solar radiation that is not used for evaporation is used to heat the ground.

29 Hotspots Amazonia Artic 29/07/
 29/07/2017")
30 a a Hilbert amplitude variation consistent with climatology variation a a clim clim I = time interval ( ; ; ) 29/07/


31 Relative change of timeaveraged Hilbert frequency First ten years Last ten years Consistent with a shift towards north and a widening of the ITCZ Consistent with variation in the number of zero-crossings 31
 but some differences are detected in certain regions.")
32 ERA-Interim Model inter-comparison (same temporal period and resolution) Average amplitude inter-decadal variation NCEP-DOE Good qualitative agreement (also in the maps of variations of average frequency the uncover ITCZ migration) but some differences are detected in certain regions. 29/07/
33 Conclusions
34 What did we learn? Hilbert analysis: allows to identify and quantify changes in climatic time series. Large variations of average amplitude (more than 50%): ice melting in the Arctic precipitation decrease in Amazonia Large variations of average frequency (more than 100%), consistent with an enlargement and northward migration of the inter-tropical convergence zone (ITCZ). Far reaching climatic consequences because ITCZ migration affects tropical atmospheric circulation. Ongoing work: predictive power? (attractor reconstruction, event synchronization applied to Hilbert time series, etc.)
. D. A. Zappala, M. Barreiro, and C.")
35 THANK YOU FOR YOUR ATTENTION! D. A. Zappala, M. Barreiro, and C. Masoller, Global atmospheric dynamics investigated by using Hilbert frequency analysis, Entropy 18, 408 (2016). D. A. Zappala, M. Barreiro, and C. Masoller, Quantifying interdecadal changes in large-scale patterns of surface air temperature variability, submitted (2017).
What have we learned about our climate by using networks and nonlinear analysis tools?
 What have we learned about our climate by using networks and nonlinear analysis tools? Cristina Masoller Universitat Politecnica de Catalunya www.fisica.edu.uy/~cris LINC conference Wien, April 2015 ITN
Global Atmospheric Dynamics Investigated by Using Hilbert Frequency Analysis
 entropy Article Global Atmospheric Dynamics Investigated by Using Hilbert Frequency Analysis Dario A. Zappalà,, Marcelo Barreiro and Cristina Masoller Departament de Física, Universitat Politècnica de
An Introduction to Coupled Models of the Atmosphere Ocean System
 An Introduction to Coupled Models of the Atmosphere Ocean System Jonathon S. Wright jswright@tsinghua.edu.cn Atmosphere Ocean Coupling 1. Important to climate on a wide range of time scales Diurnal to
High-Resolution MPAS Simulations for Analysis of Climate Change Effects on Weather Extremes
 High-Resolution MPAS Simulations for Analysis of Climate Change Effects on Weather Extremes ALLISON MICHAELIS, GARY LACKMANN, & WALT ROBINSON Department of Marine, Earth, and Atmospheric Sciences, North
Challenges for Climate Science in the Arctic. Ralf Döscher Rossby Centre, SMHI, Sweden
 Challenges for Climate Science in the Arctic Ralf Döscher Rossby Centre, SMHI, Sweden The Arctic is changing 1) Why is Arctic sea ice disappearing so rapidly? 2) What are the local and remote consequences?
Estimation of Natural Variability and Detection of Anthropogenic Signal in Summertime Precipitation in La Plata Basin
 Estimation of Natural Variability and Detection of Anthropogenic Signal in Summertime Precipitation in La Plata Basin Marcelo Barreiro Stefanie Talento Talento and Barreiro (2012) Facultad de Ciencias
Chapter outline. Reference 12/13/2016
 Chapter 2. observation CC EST 5103 Climate Change Science Rezaul Karim Environmental Science & Technology Jessore University of science & Technology Chapter outline Temperature in the instrumental record
Malawi. General Climate. UNDP Climate Change Country Profiles. C. McSweeney 1, M. New 1,2 and G. Lizcano 1
 UNDP Climate Change Country Profiles Malawi C. McSweeney 1, M. New 1,2 and G. Lizcano 1 1. School of Geography and Environment, University of Oxford. 2. Tyndall Centre for Climate Change Research http://country-profiles.geog.ox.ac.uk
Preferred spatio-temporal patterns as non-equilibrium currents
 Preferred spatio-temporal patterns as non-equilibrium currents Escher Jeffrey B. Weiss Atmospheric and Oceanic Sciences University of Colorado, Boulder Arin Nelson, CU Baylor Fox-Kemper, Brown U Royce
La Niña impacts on global seasonal weather anomalies: The OLR perspective. Andrew Chiodi and Ed Harrison
 La Niña impacts on global seasonal weather anomalies: The OLR perspective Andrew Chiodi and Ed Harrison Outline Motivation Impacts of the El Nino- Southern Oscillation (ENSO) on seasonal weather anomalies
Climate Variability. Andy Hoell - Earth and Environmental Systems II 13 April 2011
 Climate Variability Andy Hoell - andrew_hoell@uml.edu Earth and Environmental Systems II 13 April 2011 The Earth System Earth is made of several components that individually change throughout time, interact
Steven Feldstein. The link between tropical convection and the Arctic warming on intraseaonal and interdecadal time scales
 The link between tropical convection and the Arctic warming on intraseaonal and interdecadal time scales Steven Feldstein The Pennsylvania State University Collaborators: Sukyoung Lee, Hyoseok Park, Tingting
Exploring Climate Patterns Embedded in Global Climate Change Datasets
 Exploring Climate Patterns Embedded in Global Climate Change Datasets James Bothwell, May Yuan Department of Geography University of Oklahoma Norman, OK 73019 jamesdbothwell@yahoo.com, myuan@ou.edu Exploring
Supplementary Material for. Atmospheric and Oceanic Origins of Tropical Precipitation Variability
 1 2 Supplementary Material for Atmospheric and Oceanic Origins of Tropical Precipitation Variability 3 4 Jie He 1, Clara Deser 2 & Brian J. Soden 3 5 6 7 8 9 10 11 1. Princeton University, and NOAA/Geophysical
Semiblind Source Separation of Climate Data Detects El Niño as the Component with the Highest Interannual Variability
 Semiblind Source Separation of Climate Data Detects El Niño as the Component with the Highest Interannual Variability Alexander Ilin Neural Networks Research Centre Helsinki University of Technology P.O.
Future risk of tipping points
 Future risk of tipping points Tim Lenton (t.m.lenton@exeter.ac.uk) Thanks to Chris Boulton, Valerie Livina, Vasilis Dakos, Marten Scheffer, John Schellnhuber Outline Tipping points Early warning Taster
Which Climate Model is Best?
 Which Climate Model is Best? Ben Santer Program for Climate Model Diagnosis and Intercomparison Lawrence Livermore National Laboratory, Livermore, CA 94550 Adapting for an Uncertain Climate: Preparing
Statistical modelling in climate science
 Statistical modelling in climate science Nikola Jajcay supervisor Milan Paluš Seminář strojového učení a modelovaní MFF UK seminář 2016 1 Introduction modelling in climate science dynamical model initial
Hurricane Risk: Importance of Climate Time Scale and Uncertainty
 Hurricane Risk: Importance of Climate Time Scale and Uncertainty FCHLPM Workshop Peter S. Dailey, Ph.D. July 23-24, 2009 2009 AIR WORLDWIDE CORPORATION 1 Agenda Importance of Understanding Climate Change,
Mozambique. General Climate. UNDP Climate Change Country Profiles. C. McSweeney 1, M. New 1,2 and G. Lizcano 1
 UNDP Climate Change Country Profiles Mozambique C. McSweeney 1, M. New 1,2 and G. Lizcano 1 1. School of Geography and Environment, University of Oxford. 2.Tyndall Centre for Climate Change Research http://country-profiles.geog.ox.ac.uk
Outline: 1) Extremes were triggered by anomalous synoptic patterns 2) Cloud-Radiation-PWV positive feedback on 2007 low SIE
 Extremes were triggered by anomalous synoptic patterns 2) Cloud-Radiation-PWV positive feedback on 2007 low SIE") Identifying Dynamical Forcing and Cloud-Radiative Feedbacks Critical to the Formation of Extreme Arctic Sea-Ice Extent in the Summers of 2007 and 1996 Xiquan Dong University of North Dakota Outline: 1)
Identifying Dynamical Forcing and Cloud-Radiative Feedbacks Critical to the Formation of Extreme Arctic Sea-Ice Extent in the Summers of 2007 and 1996 Xiquan Dong University of North Dakota Outline: 1)
POSSIBLE EFFECTS OF SOLAR-INDUCED AND INTERNAL CLIMATE VARIABILITY ON THE THERMOHALINE CIRCULATION *
 Romanian Reports in Physics, Vol. 63, No. 1, P. 275 286, 2011 POSSIBLE EFFECTS OF SOLAR-INDUCED AND INTERNAL CLIMATE VARIABILITY ON THE THERMOHALINE CIRCULATION * I. MICLAUS, M. DIMA Faculty of Physics,
Nonlinear atmospheric response to Arctic sea-ice loss under different sea ice scenarios
 Nonlinear atmospheric response to Arctic sea-ice loss under different sea ice scenarios Hans Chen, Fuqing Zhang and Richard Alley Advanced Data Assimilation and Predictability Techniques The Pennsylvania
Trends in Climate Teleconnections and Effects on the Midwest
 Trends in Climate Teleconnections and Effects on the Midwest Don Wuebbles Zachary Zobel Department of Atmospheric Sciences University of Illinois, Urbana November 11, 2015 Date Name of Meeting 1 Arctic
Different impacts of Northern, Tropical and Southern volcanic eruptions on the tropical Pacific SST in the last millennium
 Different impacts of Northern, Tropical and Southern volcanic eruptions on the tropical Pacific SST in the last millennium Meng Zuo, Wenmin Man, Tianjun Zhou Email: zuomeng@lasg.iap.ac.cn Sixth WMO International
Environment and Climate Change Canada / GPC Montreal
 Environment and Climate Change Canada / GPC Montreal Assessment, research and development Bill Merryfield Canadian Centre for Climate Modelling and Analysis (CCCma) with contributions from colleagues at
The ECMWF prototype for coupled reanalysis. Patrick Laloyaux
 The ECMWF prototype for coupled reanalysis Patrick Laloyaux ECMWF July 10, 2015 Outline Current status and future plans for ECMWF operational reanalyses Extended climate reanalyses Coupled atmosphere-ocean
SHORT COMMUNICATION EXPLORING THE RELATIONSHIP BETWEEN THE NORTH ATLANTIC OSCILLATION AND RAINFALL PATTERNS IN BARBADOS
 INTERNATIONAL JOURNAL OF CLIMATOLOGY Int. J. Climatol. 6: 89 87 (6) Published online in Wiley InterScience (www.interscience.wiley.com). DOI:./joc. SHORT COMMUNICATION EXPLORING THE RELATIONSHIP BETWEEN
Winter Forecast for GPC Tokyo. Shotaro TANAKA Tokyo Climate Center (TCC) Japan Meteorological Agency (JMA)
 Japan Meteorological Agency (JMA)") Winter Forecast for 2013 2014 GPC Tokyo Shotaro TANAKA Tokyo Climate Center (TCC) Japan Meteorological Agency (JMA) NEACOF 5, October 29 November 1, 2013 1 Outline 1. Numerical prediction 2. Interannual
Winter Forecast for 2013 2014 GPC Tokyo Shotaro TANAKA Tokyo Climate Center (TCC) Japan Meteorological Agency (JMA) NEACOF 5, October 29 November 1, 2013 1 Outline 1. Numerical prediction 2. Interannual
Recent trends in energy flows through the Arctic climate system. Michael Mayer Leo Haimberger
 Recent trends in energy flows through the Arctic climate system Michael Mayer Leo Haimberger Motivation and outline Arctic climate system is subject to rapid changes and large interannual variability How
Global Temperature Is Continuing to Rise: A Primer on Climate Baseline Instability. G. Bothun and S. Ostrander Dept of Physics, University of Oregon
 Global Temperature Is Continuing to Rise: A Primer on Climate Baseline Instability G. Bothun and S. Ostrander Dept of Physics, University of Oregon The issue of whether or not humans are inducing significant
the 2 past three decades
 SUPPLEMENTARY INFORMATION DOI: 10.1038/NCLIMATE2840 Atlantic-induced 1 pan-tropical climate change over the 2 past three decades 3 4 5 6 7 8 9 10 POP simulation forced by the Atlantic-induced atmospheric
Atmospheric circulation analysis for seasonal forecasting
 Training Seminar on Application of Seasonal Forecast GPV Data to Seasonal Forecast Products 18 21 January 2011 Tokyo, Japan Atmospheric circulation analysis for seasonal forecasting Shotaro Tanaka Climate
Doing science with multi-model ensembles
 Doing science with multi-model ensembles Gerald A. Meehl National Center for Atmospheric Research Biological and Energy Research Regional and Global Climate Modeling Program Why use a multi-model ensemble
Teleconnections and Climate predictability
 Southern Hemisphere Teleconnections and Climate predictability Carolina Vera CIMA/CONICET University of Buenos Aires, UMI IFAECI/CNRS Buenos Aires, Argentina Motivation Large scale circulation variability
THE PACIFIC DECADAL OSCILLATION (PDO)
") THE PACIFIC DECADAL OSCILLATION (PDO) The Pacific Decadal Oscillation (PDO) refers to cyclical variations in sea surface temperatures in the Pacific Ocean. A detailed summary of the PDO is given in D Aleo
THE PACIFIC DECADAL OSCILLATION (PDO) The Pacific Decadal Oscillation (PDO) refers to cyclical variations in sea surface temperatures in the Pacific Ocean. A detailed summary of the PDO is given in D Aleo
SIO 210 CSP: Data analysis methods L. Talley, Fall Sampling and error 2. Basic statistical concepts 3. Time series analysis
 SIO 210 CSP: Data analysis methods L. Talley, Fall 2016 1. Sampling and error 2. Basic statistical concepts 3. Time series analysis 4. Mapping 5. Filtering 6. Space-time data 7. Water mass analysis Reading:
Interactive comment on Characterizing ecosystem-atmosphere interactions from short to interannual time scales by M. D. Mahecha et al.
 Biogeosciences Discuss., www.biogeosciences-discuss.net/4/s681/2007/ c Author(s) 2007. This work is licensed under a Creative Commons License. Biogeosciences Discussions comment on Characterizing ecosystem-atmosphere
MJO modeling and Prediction
 MJO modeling and Prediction In-Sik Kang Seoul National University, Korea Madden & Julian Oscillation (MJO) index Composite: OLR & U850 RMM index based on Leading PCs of Combined EOF (OLR, U850, U200) P-1
PRMS WHITE PAPER 2014 NORTH ATLANTIC HURRICANE SEASON OUTLOOK. June RMS Event Response
 PRMS WHITE PAPER 2014 NORTH ATLANTIC HURRICANE SEASON OUTLOOK June 2014 - RMS Event Response 2014 SEASON OUTLOOK The 2013 North Atlantic hurricane season saw the fewest hurricanes in the Atlantic Basin
Exploring experimental optical complexity with big data nonlinear analysis tools. Cristina Masoller
 Exploring experimental optical complexity with big data nonlinear analysis tools Cristina Masoller Cristina.masoller@upc.edu www.fisica.edu.uy/~cris 4 th International Conference on Complex Dynamical Systems
The global S 1 tide and Earth s nutation
 Journées 2014 St. Petersburg 22 24 September Michael SCHINDELEGGER Johannes BÖHM, David SALSTEIN The global S 1 tide and Earth s nutation Session 4: Earth s rotation and geodynamics Motivation & Background
Climate Change and Predictability of the Indian Summer Monsoon
 Climate Change and Predictability of the Indian Summer Monsoon B. N. Goswami (goswami@tropmet.res.in) Indian Institute of Tropical Meteorology, Pune Annual mean Temp. over India 1875-2004 Kothawale, Roopakum
Towards a more physically based approach to Extreme Value Analysis in the climate system
 N O A A E S R L P H Y S IC A L S C IE N C E S D IV IS IO N C IR E S Towards a more physically based approach to Extreme Value Analysis in the climate system Prashant Sardeshmukh Gil Compo Cecile Penland
NSF Expeditions in Computing. Understanding Climate Change: A Data Driven Approach. Vipin Kumar University of Minnesota
 NSF Expeditions in Computing Understanding Climate Change: A Data Driven Approach Vipin Kumar University of Minnesota kumar@cs.umn.edu www.cs.umn.edu/~kumar Vipin Kumar UCC Aug 15, 2011 Climate Change:
arxiv: v3 [physics.ao-ph] 27 Jan 2011
![arxiv: v3 [physics.ao-ph] 27 Jan 2011](/thumbs/73/69394374.jpg "arxiv: v3 [physics.ao-ph] 27 Jan 2011") Inferring long memory processes in the climate network via ordinal pattern analysis Marcelo Barreiro and Arturo C. Marti Instituto de Física, Facultad de Ciencias, Universidad de la República, Iguá 4225,
Inferring long memory processes in the climate network via ordinal pattern analysis Marcelo Barreiro and Arturo C. Marti Instituto de Física, Facultad de Ciencias, Universidad de la República, Iguá 4225,
CHAPTER 1: INTRODUCTION
 CHAPTER 1: INTRODUCTION There is now unequivocal evidence from direct observations of a warming of the climate system (IPCC, 2007). Despite remaining uncertainties, it is now clear that the upward trend
Behind the Climate Prediction Center s Extended and Long Range Outlooks Mike Halpert, Deputy Director Climate Prediction Center / NCEP
 Behind the Climate Prediction Center s Extended and Long Range Outlooks Mike Halpert, Deputy Director Climate Prediction Center / NCEP September 2012 Outline Mission Extended Range Outlooks (6-10/8-14)
Atmospheric QBO and ENSO indices with high vertical resolution from GNSS RO
 Atmospheric QBO and ENSO indices with high vertical resolution from GNSS RO H. Wilhelmsen, F. Ladstädter, B. Scherllin-Pirscher, A.K.Steiner Wegener Center for Climate and Global Change University of Graz,
Northern New England Climate: Past, Present, and Future. Basic Concepts
 Northern New England Climate: Past, Present, and Future Basic Concepts Weather instantaneous or synoptic measurements Climate time / space average Weather - the state of the air and atmosphere at a particular
lecture 11 El Niño/Southern Oscillation (ENSO) Part II
 Part II") lecture 11 El Niño/Southern Oscillation (ENSO) Part II SYSTEM MEMORY: OCEANIC WAVE PROPAGATION ASYMMETRY BETWEEN THE ATMOSPHERE AND OCEAN The atmosphere and ocean are not symmetrical in their responses
lecture 11 El Niño/Southern Oscillation (ENSO) Part II SYSTEM MEMORY: OCEANIC WAVE PROPAGATION ASYMMETRY BETWEEN THE ATMOSPHERE AND OCEAN The atmosphere and ocean are not symmetrical in their responses
The 2009 Hurricane Season Overview
 The 2009 Hurricane Season Overview Jae-Kyung Schemm Gerry Bell Climate Prediction Center NOAA/ NWS/ NCEP 1 Overview outline 1. Current status for the Atlantic, Eastern Pacific and Western Pacific basins
Recent Climate History - The Instrumental Era.
 2002 Recent Climate History - The Instrumental Era. Figure 1. Reconstructed surface temperature record. Strong warming in the first and late part of the century. El Ninos and major volcanic eruptions are
Global climate predictions: forecast drift and bias adjustment issues
 www.bsc.es Ispra, 23 May 2017 Global climate predictions: forecast drift and bias adjustment issues Francisco J. Doblas-Reyes BSC Earth Sciences Department and ICREA Many of the ideas in this presentation
Possible Applications of Deep Neural Networks in Climate and Weather. David M. Hall Assistant Research Professor Dept. Computer Science, CU Boulder
 Possible Applications of Deep Neural Networks in Climate and Weather David M. Hall Assistant Research Professor Dept. Computer Science, CU Boulder Quick overview of climate and weather models Weather models
ENSO and April SAT in MSA. This link is critical for our regression analysis where ENSO and
 Supplementary Discussion The Link between El Niño and MSA April SATs: Our study finds a robust relationship between ENSO and April SAT in MSA. This link is critical for our regression analysis where ENSO
Presentation Overview. Southwestern Climate: Past, present and future. Global Energy Balance. What is climate?
 Southwestern Climate: Past, present and future Mike Crimmins Climate Science Extension Specialist Dept. of Soil, Water, & Env. Science & Arizona Cooperative Extension The University of Arizona Presentation
Rainfall is the most important climate element affecting the livelihood and wellbeing of the
 Ensemble-Based Empirical Prediction of Ethiopian Monthly-to-Seasonal Monsoon Rainfall Rainfall is the most important climate element affecting the livelihood and wellbeing of the majority of Ethiopians.
CLIMATE SIMULATION AND ASSESSMENT OF PREDICTABILITY OF RAINFALL IN THE SOUTHEASTERN SOUTH AMERICA REGION USING THE CPTEC/COLA ATMOSPHERIC MODEL
 CLIMATE SIMULATION AND ASSESSMENT OF PREDICTABILITY OF RAINFALL IN THE SOUTHEASTERN SOUTH AMERICA REGION USING THE CPTEC/COLA ATMOSPHERIC MODEL JOSÉ A. MARENGO, IRACEMA F.A.CAVALCANTI, GILVAN SAMPAIO,
Monitoring and Prediction of Climate Extremes
 Monitoring and Prediction of Climate Extremes Stephen Baxter Meteorologist, Climate Prediction Center NOAA/NWS/NCEP Deicing and Stormwater Management Conference ACI-NA/A4A Arlington, VA May 19, 2017 What
GPC Exeter forecast for winter Crown copyright Met Office
 GPC Exeter forecast for winter 2015-2016 Global Seasonal Forecast System version 5 (GloSea5) ensemble prediction system the source for Met Office monthly and seasonal forecasts uses a coupled model (atmosphere
THE PACIFIC DECADAL OSCILLATION, REVISITED. Matt Newman, Mike Alexander, and Dima Smirnov CIRES/University of Colorado and NOAA/ESRL/PSD
 THE PACIFIC DECADAL OSCILLATION, REVISITED Matt Newman, Mike Alexander, and Dima Smirnov CIRES/University of Colorado and NOAA/ESRL/PSD PDO and ENSO ENSO forces remote changes in global oceans via the
North Pacific Climate Overview N. Bond (UW/JISAO), J. Overland (NOAA/PMEL) Contact: Last updated: August 2009
, J. Overland (NOAA/PMEL) Contact: Last updated: August 2009") North Pacific Climate Overview N. Bond (UW/JISAO), J. Overland (NOAA/PMEL) Contact: Nicholas.Bond@noaa.gov Last updated: August 2009 Summary. The North Pacific atmosphere-ocean system from fall 2008 through
North Pacific Climate Overview N. Bond (UW/JISAO), J. Overland (NOAA/PMEL) Contact: Nicholas.Bond@noaa.gov Last updated: August 2009 Summary. The North Pacific atmosphere-ocean system from fall 2008 through
The Stratospheric Link Between the Sun and Climate
 The Stratospheric Link Between the Sun and Climate The Stratospheric Link Between the Sun and Climate Mark P. Baldwin Northwest Research Associates, USA SORCE, 27 October 2004 Overview Climatology of the
North Pacific Climate Overview N. Bond (UW/JISAO), J. Overland (NOAA/PMEL) Contact: Last updated: September 2008
, J. Overland (NOAA/PMEL) Contact: Last updated: September 2008") North Pacific Climate Overview N. Bond (UW/JISAO), J. Overland (NOAA/PMEL) Contact: Nicholas.Bond@noaa.gov Last updated: September 2008 Summary. The North Pacific atmosphere-ocean system from fall 2007
North Pacific Climate Overview N. Bond (UW/JISAO), J. Overland (NOAA/PMEL) Contact: Nicholas.Bond@noaa.gov Last updated: September 2008 Summary. The North Pacific atmosphere-ocean system from fall 2007
Impacts of Long-term Climate Cycles on Alberta. A Summary. by Suzan Lapp and Stefan Kienzle
 Impacts of Long-term Climate Cycles on Alberta A Summary by Suzan Lapp and Stefan Kienzle Large Scale Climate Drivers The Pacific Decadal Oscillation (PDO) [Mantua et al., 1997] is the dominant mode of
Future changes of precipitation over the western United States using variable-resolution CESM
 Future changes of precipitation over the western United States using variable-resolution CESM Xingying Huang, Paul A. Ullrich Department of Land, Air and Water Resources University of California, Davis
Simulated variability in the mean atmospheric meridional circulation over the 20th century
 GEOPHYSICAL RESEARCH LETTERS, VOL. 36, L06704, doi:10.1029/2008gl036741, 2009 Simulated variability in the mean atmospheric meridional circulation over the 20th century Damianos F. Mantsis 1 and Amy C.
Assessing and understanding the role of stratospheric changes on decadal climate prediction
 MiKlip II-Status seminar, Berlin, 1-3 March 2017 Assessing and understanding the role of stratospheric changes on decadal climate prediction Martin Dameris Deutsches Zentrum für Luft- und Raumfahrt, Institut
IMPACTS OF A WARMING ARCTIC
 The Earth s Greenhouse Effect Most of the heat energy emitted from the surface is absorbed by greenhouse gases which radiate heat back down to warm the lower atmosphere and the surface. Increasing the
June 1993 T. Nitta and J. Yoshimura 367. Trends and Interannual and Interdecadal Variations of. Global Land Surface Air Temperature
 June 1993 T. Nitta and J. Yoshimura 367 Trends and Interannual and Interdecadal Variations of Global Land Surface Air Temperature By Tsuyoshi Nitta Center for Climate System Research, University of Tokyo,
The Role of Mathematics in Understanding the Earth s Climate. Andrew Roberts
 The Role of Mathematics in Understanding the Earth s Climate Andrew Roberts Outline What is climate (change)? History of mathematics in climate science How do we study the climate? Dynamical systems Large-scale
Mesoscale and High Impact Weather in the South American Monsoon Leila M. V. Carvalho 1 and Maria A. F. Silva Dias 2 1
 Mesoscale and High Impact Weather in the South American Monsoon Leila M. V. Carvalho 1 and Maria A. F. Silva Dias 2 1 University of California, Santa Barbara 2 University of Sao Paulo, Brazil Objectives
Vulnerability of economic systems
 Vulnerability of economic systems Quantitative description of U.S. business cycles using multivariate singular spectrum analysis Andreas Groth* Michael Ghil, Stéphane Hallegatte, Patrice Dumas * Laboratoire
Human influence on terrestrial precipitation trends revealed by dynamical
 1 2 3 Supplemental Information for Human influence on terrestrial precipitation trends revealed by dynamical adjustment 4 Ruixia Guo 1,2, Clara Deser 1,*, Laurent Terray 3 and Flavio Lehner 1 5 6 7 1 Climate
COMPOSITE ANALYSIS OF EL NINO SOUTHERN OSCILLATION EVENTS ON ANTARCTICA
 COMPOSITE ANALYSIS OF EL NINO SOUTHERN OSCILLATION EVENTS ON ANTARCTICA Lee Welhouse 2*, Matthew Lazzara 2,3, Matt Hitchman 1 Linda Keller 1, Greg Tripoli 1 1 University of Wisconsin-Madison, Department
Zambia. General Climate. Recent Climate Trends. UNDP Climate Change Country Profiles. Temperature. C. McSweeney 1, M. New 1,2 and G.
 UNDP Climate Change Country Profiles Zambia C. McSweeney 1, M. New 1,2 and G. Lizcano 1 1. School of Geography and Environment, University of Oxford. 2. Tyndall Centre for Climate Change Research http://country-profiles.geog.ox.ac.uk
Operational event attribution
 Operational event attribution Peter Stott, NCAR, 26 January, 2009 August 2003 Events July 2007 January 2009 January 2009 Is global warming slowing down? Arctic Sea Ice Climatesafety.org climatesafety.org
Modelled and observed multi-decadal variability in the North Atlantic jet stream and its connection to Sea Surface Temperatures
 Modelled and observed multi-decadal variability in the North Atlantic jet stream and its connection to Sea Surface Temperatures Isla Simpson 1 Clara Deser 1, Karen McKinnon 1, Elizabeth Barnes 2 1: Climate
Name the surface winds that blow between 0 and 30. GEO 101, February 25, 2014 Monsoon Global circulation aloft El Niño Atmospheric water
 GEO 101, February 25, 2014 Monsoon Global circulation aloft El Niño Atmospheric water Name the surface winds that blow between 0 and 30 What is the atmospheric pressure at 0? What is the atmospheric pressure
SE Atlantic SST variability and southern African climate
 SE Atlantic SST variability and southern African climate Chris Reason Oceanography Dept, Univ. Cape Town Overview of southern African climate and tropical Atlantic SST South American monsoon, Benguela
Influence of solar activity on the occurrence of weather types over Europe from 1763 to 2009
 Influence of solar activity on the occurrence of weather types over Europe from 1763 to 2009 05.10.2016 SCOSTEP Workshop Mikhaël Schwander & Stefan Brönnimann Oeschger Centre for Climate Change Research
2013 ATLANTIC HURRICANE SEASON OUTLOOK. June RMS Cat Response
 2013 ATLANTIC HURRICANE SEASON OUTLOOK June 2013 - RMS Cat Response Season Outlook At the start of the 2013 Atlantic hurricane season, which officially runs from June 1 to November 30, seasonal forecasts
CERA: The Coupled ECMWF ReAnalysis System. Coupled data assimilation
 CERA: The Coupled ECMWF ReAnalysis System Coupled data assimilation Patrick Laloyaux, Eric de Boisséson, Magdalena Balmaseda, Kristian Mogensen, Peter Janssen, Dick Dee University of Reading - 7 May 2014
Lecture 1. Amplitude of the seasonal cycle in temperature
 Lecture 6 Lecture 1 Ocean circulation Forcing and large-scale features Amplitude of the seasonal cycle in temperature 1 Atmosphere and ocean heat transport Trenberth and Caron (2001) False-colour satellite
Guided Notes: Atmosphere Layers of the Atmosphere
 Guided Notes: Atmosphere Layers of the Atmosphere Atmosphere: Absorbs solar radiation, Burns up meteors, transports and recycles water, and other chemicals, and moderates climate Main Components: o Meteorology
ALASKA REGION CLIMATE OUTLOOK BRIEFING. December 22, 2017 Rick Thoman National Weather Service Alaska Region
 ALASKA REGION CLIMATE OUTLOOK BRIEFING December 22, 2017 Rick Thoman National Weather Service Alaska Region Today s Outline Feature of the month: Autumn sea ice near Alaska Climate Forecast Basics Climate
Lecture 28: Observed Climate Variability and Change
 Lecture 28: Observed Climate Variability and Change 1. Introduction This chapter focuses on 6 questions - Has the climate warmed? Has the climate become wetter? Are the atmosphere/ocean circulations changing?
How can we explain possible human contribution to weather events?
 WMO-IPCC Tokyo workshop for weather presenters, November 11, 2015 How can we explain possible human contribution to weather events? Masahiro Watanabe Atmosphere and Ocean Research Institute University
By STEVEN B. FELDSTEINI and WALTER A. ROBINSON* University of Colorado, USA 2University of Illinois at Urbana-Champaign, USA. (Received 27 July 1993)
") Q. J. R. Meteorol. SOC. (1994), 12, pp. 739-745 551.513.1 Comments on Spatial structure of ultra-low frequency variability of the flow in a simple atmospheric circulation model by I. N. James and P. M.
Q. J. R. Meteorol. SOC. (1994), 12, pp. 739-745 551.513.1 Comments on Spatial structure of ultra-low frequency variability of the flow in a simple atmospheric circulation model by I. N. James and P. M.
El Niño signals contained in precipitation at the East China Sea
 CLIMATE RESEARCH Vol. :, Published December Clim Res El Niño signals contained in precipitation at the East China Sea You-Soon Chang, *, HuiSoo An, DongChull Jeon, Jae-Cheol Nam, Jang-Won Seo Marine Meteorology
Development of a Tropical Ecological Forecasting Strategy for ENSO Based on the ACME Modeling Framework
 Development of a Tropical Ecological Forecasting Strategy for ENSO Based on the ACME Modeling Framework Forrest M. Hoffman 1,2, Min Xu 1, Nathaniel Collier 1, Chonggang Xu 3, Bradley Christoffersen 3,
3. Carbon Dioxide (CO 2 )
") 3. Carbon Dioxide (CO 2 ) Basic information on CO 2 with regard to environmental issues Carbon dioxide (CO 2 ) is a significant greenhouse gas that has strong absorption bands in the infrared region and
3. Carbon Dioxide (CO 2 ) Basic information on CO 2 with regard to environmental issues Carbon dioxide (CO 2 ) is a significant greenhouse gas that has strong absorption bands in the infrared region and
Vertical Coupling in Climate
 Vertical Coupling in Climate Thomas Reichler (U. of Utah) NAM Polar cap averaged geopotential height anomalies height time Observations Reichler et al. (2012) SSWs seem to cluster Low-frequency power Vortex
SPECIAL PROJECT PROGRESS REPORT
 SPECIAL PROJECT PROGRESS REPORT Progress Reports should be 2 to 10 pages in length, depending on importance of the project. All the following mandatory information needs to be provided. Reporting year
Proceedings, International Snow Science Workshop, Banff, 2014
 RELATING AVALANCHES TO LARGE-SCALE OCEAN ATMOSPHERIC OSCILLATIONS Scott Thumlert 1, Sascha Bellaire 2, Bruce Jamieson 1 1 Dept. of Civil Engineering, University of Calgary, AB, Canada 2 Institute of Meteorology
Interacting Networks in Climate. Marcelo Barreiro Department of Atmospheric Sciences School of Sciences, Universidad de la República, Uruguay
 Interacting Networks in Climate Marcelo Barreiro Department of Atmospheric Sciences School of Sciences, Universidad de la República, Uruguay CCIARM, Sao Jose dos Campos 2017 Collaborators Ignacio Deza
The North Atlantic Oscillation: Climatic Significance and Environmental Impact
 1 The North Atlantic Oscillation: Climatic Significance and Environmental Impact James W. Hurrell National Center for Atmospheric Research Climate and Global Dynamics Division, Climate Analysis Section
Name Spin-up runs Flux Ocean Atmosphere adjustments CON-DEF O-DEF A-DEF O-DEF/A-DEF CON-SHF O-SHF A-SHF O-SHF/A-SHF CON-EFF O-EFF A-EFF O-EFF/A-EFF
 Chapter 5 Control runs 5.1 Introduction Three coupled model control runs are presented in this chapter; these are summarised in Table 5.1. They differ from each another only in the initial states of the
Lecture 8: Natural Climate Variability
 Lecture 8: Natural Climate Variability Extratropics: PNA, NAO, AM (aka. AO), SAM Tropics: MJO Coupled A-O Variability: ENSO Decadal Variability: PDO, AMO Unforced vs. Forced Variability We often distinguish