A SEASONAL TIME SERIES MODEL FOR NIGERIAN MONTHLY AIR TRAFFIC DATA
|
|
|
- Hilda Scott
- 5 years ago
- Views:
Transcription
1 A SEASONAL TIME SERIES MODEL FOR NIGERIAN MONTHLY AIR TRAFFIC DATA Ette Harrison Etuk Department of Mathematics/Computer Science, Rivers State University of Science and Technology, Nigeria ABSTRACT Nigerian Monthly Air Traffic Data (NAP) is analysed as a time series. The non-seasonal difference of its seasonal (i.e. 12-month) difference (DSDNAP) is observed to show some seasonality. The autocorrelation function of DSDNAP reveals a 12-month seasonality, the involvement of a seasonal moving average component of order 1 and the product of two autoregressive components: one non-seasonal and the other seasonal, both of order one. Therefore, a (1, 1, 0)x(1, 1, 1) 12 is proposed and fitted to the data. This model has been demonstrated to be adequate. Keywords: Air Traffic Data, Seasonal Time Series, ARIMA models, Nigeria. 1. INTRODUCTION A time series may be defined as data collected sequentially in time, the time points often equally spaced. A property of such a series is that neighbouring values are correlated. This correlation is called autocorrelation. Put as a function of the lag separating the correlated values, it is called autocorrelation function (ACF). The graph of the ACF is called the correlogram. A stationary time series refers to a time series with a constant mean, a constant variance and autocorrelation that is a function of the lag separating the correlated values. A stationary time series { t } is said to follow an autoregressive moving average model of order p and q, denoted by ARMA(p, q) if it satisfies the following difference equation t t 1 2 t 2 p t p t 1 t 1 2 t q t q (1) where { t } is called a white noise process and defined as a sequence of uncorrelated zero mean random variables with constant variance. The model (1) may be alternatively put as A(L) t = B(L) t (2) where A(L) = 1-1 L - 2 L p L p and B(L) = L + 2 L q L q and L is the backward shift operator defined by L k t = t-k. Besides stationarity, another necessary property for a time series is invertibility, which may be defined as the situation whereby the model is associated with a unique autocorrelation structure (Priestley[1]). For the model above to be stationary the equation A(L) = 0 must have roots all outside the unit circle and for it to be invertible, the equation B(L) = 0 must have all roots outside the unit circle. If p = 0, the model (1) or (2) becomes a moving average model of order q, designated MA(q). If, however, q = 0, the model (1) or (2) an autoregressive model of order p, designated AR(p). An autoregressive model of order p may be more specifically written as t... p1 t 1 p2 t 2 pp t p t (3) The sequence of the last coefficients { ii } is called the partial autocorrelation (PACF) of { t }. The PACF of an AR(p) cuts off at lag p, whereas that of an MA model dies off slowly. The ACF of an MA(q) model cuts off at lag q 596
2 but the PACF dies off slowly. AR and MA models have certain duality relationships. For instance, a finite-order model of one type is equivalent to an infinite-order model of the other type. Most real-life time series exhibit non-stationary behaviour. Box and Jenkins ([2]) proposed that such a series could be made stationary after differencing of an appropriate order. Let the minimum order of differencing applied to a time series { t } to render it stationary be d. This d th difference of t denoted by d t and defined by d t = (1 L) d t is used in lieu of t in model (1) or (2). Then the resultant model is called an autoregressive integrated moving average model of orders p, d and q, designated ARIMA(p,d,q) in { t }. Seasonality refers to a tendency for a time series to fluctuate periodically. Many economic time series are seasonal, fluctuating according to natural seasons. Assuming that s is the period of seasonality, a time series { t } is said to follow a multiplicative (p, d, q)x(p, D, Q) s seasonal ARIMA model if A(L) (L s ) d D s t = B(L) (L s ) t (4) where (L) = L + 2 L P L P and (L) = L + 2 L Q L Q and the s and s are constants such that the roots of (L) = 0 and (L) = 0 are all outside the unit circle for stationarity and invertiblity respectively. The purpose of this work is to fit a seasonal ARIMA model to Nigerian Air Traffic Data (NAP). Earlier works on Air Traffic Modelling exist. For instance, Box and Jenkins ([1]) modelled monthly totals (in thousands of passengers) from 1949 to 1960 as (0, 1, 1)x(0, 1, 1) 12. He used this data to introduce the concept of a seasonal ARIMA model. In the Nigerian scene, Ogbudinkpa ([3]) used the traditional approach of breaking the series into the traditional components: secular trend, seasonal movement and irregular movement, to analyse Nigerian Air Traffic Data. Etuk et al ([4]) fitted to the data an ARIMA(7, 1, 0) model. 2. MATERIALS AND METHODS The data for this work are ninety six monthly totals of Nigerian Air Traffic Data in nearest thousands covering 2004 to 2011 retrievable from the Federal Airways Authority of Nigeria (FAAN) website Determination of orders p, d, q, s, P, D and Q Seasonality often becomes apparent from the time plot of a time series. In that case, s is the observed period. Seasonality of period s is suggestive if the correlogram shows a significant spike at the lag s, with neighbouring spikes non-significant. A negative spike at lag s also is indicative of the involvement of a seasonal MA component of lag 1, that is, Q=1. On the other hand, a positive spike at lag s indicates the involvement of a seasonal AR component of lag 1, that is, P=1. To avoid undue model complexity, it has been advised that d + D < 3. The orders p and q are the lags of the cutting off of the ACF and PACF respectively. Moreover, knowledge of the autocorrelation structure of the hypothesized model provides further basis for order determination. Box and Jenkins ([2]) and Madsen ([5]) are a few of authors that have written extensively on seasonal time series models Model Estimation Once orders have been determined, the model could be estimated. Involvement of items of a white noise process in the model to be estimated often entails the application of non-linear optimization techniques for model estimation. Usually an initial estimate is made. Then by an iterative process improvement is made on the estimates until convergence to an optimal estimate is achieved. The criterion of optimization could be the least error sum of squares, the maximum likelihood, the maximum entropy, etc. For pure AR or pure MA models, there exist linear optimization techniques (see for example, Box and Jenkins, [1]; Oyetunji, [6]). There are attempts to adopt linear optimization techniques for mixed ARMA models (see for example Etuk ( [7], [8] ). In this work we are using Eviews software which employs the least sum of squares technique Diagnostic Checking Sequel to model estimation goodness-of-fit of the model to the observations must be ascertained. It involves some residual analysis. Under the assumption of model adequacy, the residuals should be uncorrelated, have mean zero and follow a normal distribution. 597
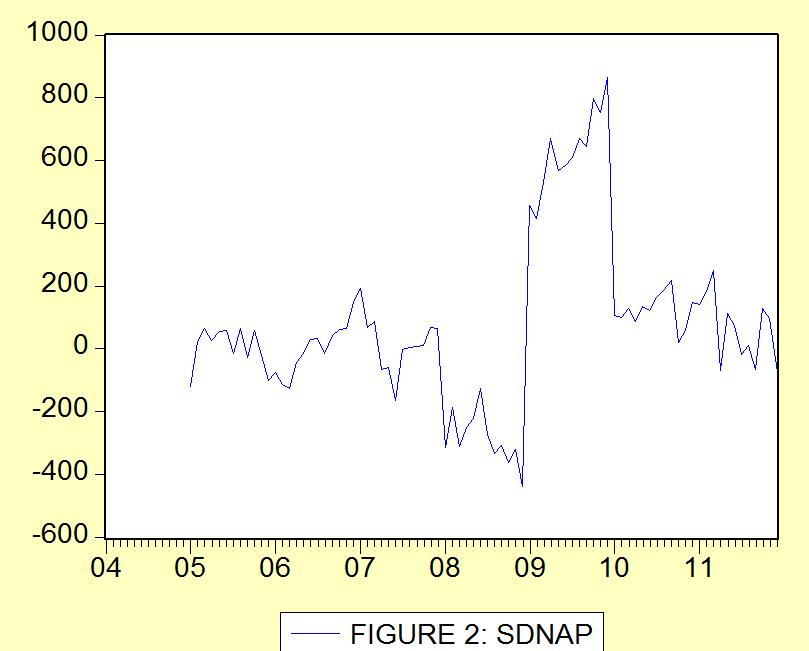
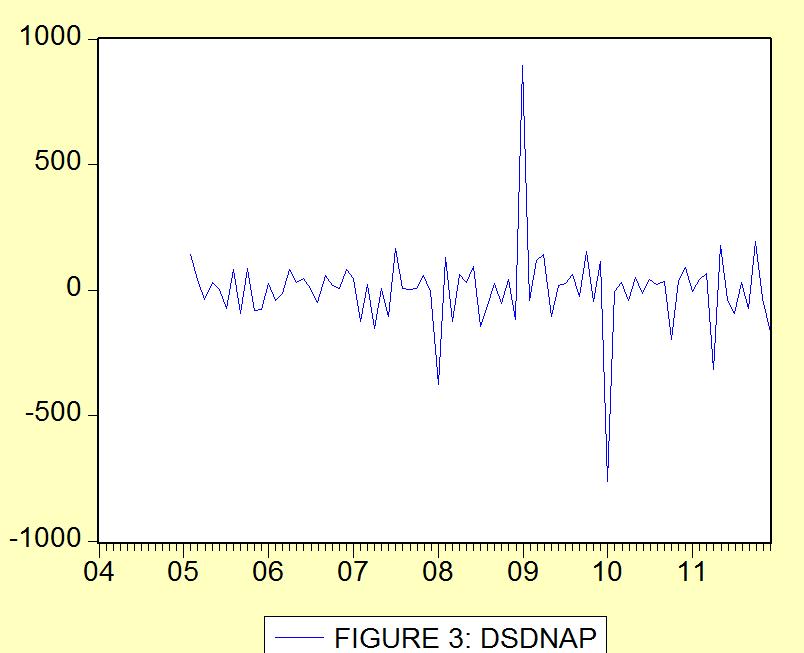
. Non-seasonal differencing of SDNAP yields DSDNAP which shows no trend either.")
3 3. RESULTS AND DISCUSSION The time plot of NAP in Figure 1 shows a depression in 2008 and a generally increasing trend. Seasonality is not obvious. Seasonal (i.e. 12-month) differencing yields SDNAP which apart from a peak in 2009 shows no trend on the overall. Seasonality is not evident still (see Figure 2). Non-seasonal differencing of SDNAP yields DSDNAP which shows no trend either. Even though its time plot in Figure 3 does not reveal a seasonal nature its correlogram in Figure 4 reveals seasonality of order 12, involvement of a seasonal MA component and a seasonal AR component. Moreover the spikes at lags 1, 12 and 13 in the PACF suggest the involvement of the product of two autoregressive components: one seasonal and the other non-seasonal. The model (1, 1, 0)x(1, 1, 1) 12 is hereby proposed. That is, DSDNAP = 1 DSDNAP t DSDNAP t DSDNAP t-13 + t-12 + t (5) The model (5) estimated as summarized in Table 1 is given by DSDNAP DSDNAP t DSDNAP t DSDNAP t t-12 = t (6) It is noteworthy that all the coefficients of the model (6) are statistically significant, each being more than twice its standard error. Moreover as much as 69% of the variation in DSDNAP is explained by the model. Figure 5 shows a very close agreement between the model and the data. Figure 6 is a histogram of the residuals. The probability curve shows a nearly normal distribution of mean zero (apart from the outlier of value close to 500). The correlogram of the residuals in Figure 7 is such that no correlation is statistically significant. All these show that the model is adequate. 598
4 599


5 FIGURE 4: CORRELOGRAM OF DSDNAP TABLE 1: MODEL ESTIMATON 600


6 FIGURE 6: HISTOGRAM OF THE RESIDUALS 601
. [2] G. E. P. Box and G. M. Jenkins, Time Series Analysis, Forecasting and Control.")
7 FIGURE 7: CORRELOGRAM OF THE RESIDUALS 4. CONCLUSION It may be concluded that NAP follows the multiplicative seasonal (1, 1, 0)x(1, 1, 1) 12 model. This model has been shown to be adequate. 5. REFERENCES [1] M. B. Priestley, Spectral Analysis and Time Series. Academic Press, London (1981). [2] G. E. P. Box and G. M. Jenkins, Time Series Analysis, Forecasting and Control. Holden-Day, San Francisco (1976). [3] R. N. Ogbudinkpa, Time Series Analysis of Nigeria s Airways Passenger Traffic , Jour. Of Nigerian Statistical Association, 1, Number 3, (1983). [4] E. H. Etuk, C. E. Onwukwe, I. E. Egong and J. N. Ezeorah, An ARIMA model for Nigerian Aviation traffic Data, International Journal of Natural and Applied Sciences, 2, Number 1, (2007). [5] H. Madsen, Time Series Analysis, Chapman/CRC, London (2008). [6] O. B. Oyetunji, Inverse Autocorrelations and Moving Average Time Series Modelling. Jour. Of Official Statistics, 1, (1985). [7] E. H. Etuk, On the Selection of Autoregressive Moving Average Models. Ph. D. Thesis, Department of Statistics, University of Ibadan, Nigeria (1987). [8] E. H. Etuk, An Autoregressive Integrated Moving Average (ARIMA) Simulation Model: A Case Study. Discovery and Innovation, 10, Numbers 1 & 2, (1998). 602
Modelling Monthly Rainfall Data of Port Harcourt, Nigeria by Seasonal Box-Jenkins Methods
 International Journal of Sciences Research Article (ISSN 2305-3925) Volume 2, Issue July 2013 http://www.ijsciences.com Modelling Monthly Rainfall Data of Port Harcourt, Nigeria by Seasonal Box-Jenkins
Asian Economic and Financial Review. SEASONAL ARIMA MODELLING OF NIGERIAN MONTHLY CRUDE OIL PRICES Ette Harrison Etuk
 Asian Economic and Financial Review journal homepage: http://aessweb.com/journal-detail.php?id=5002 SEASONAL ARIMA MODELLING OF NIGERIAN MONTHLY CRUDE OIL PRICES Ette Harrison Etuk Department of Mathematics/Computer
The Fitting of a SARIMA model to Monthly Naira-Euro Exchange Rates
 The Fitting of a SARIMA model to Monthly Naira-Euro Exchange Rates Abstract Ette Harrison Etuk (Corresponding author) Department of Mathematics/Computer Science, Rivers State University of Science and
Multiplicative Sarima Modelling Of Nigerian Monthly Crude Oil Domestic Production
 Journal of Applied Mathematics & Bioinformatics, vol.3, no.3, 2013, 103-112 ISSN: 1792-6602 (print), 1792-6939 (online) Scienpress Ltd, 2013 Multiplicative Sarima Modelling Of Nigerian Monthly Crude Oil
MODELING INFLATION RATES IN NIGERIA: BOX-JENKINS APPROACH. I. U. Moffat and A. E. David Department of Mathematics & Statistics, University of Uyo, Uyo
 Vol.4, No.2, pp.2-27, April 216 MODELING INFLATION RATES IN NIGERIA: BOX-JENKINS APPROACH I. U. Moffat and A. E. David Department of Mathematics & Statistics, University of Uyo, Uyo ABSTRACT: This study
Time Series Analysis of Monthly Rainfall data for the Gadaref rainfall station, Sudan, by Sarima Methods
 International Journal of Scientific Research in Knowledge, 2(7), pp. 320-327, 2014 Available online at http://www.ijsrpub.com/ijsrk ISSN: 2322-4541; 2014 IJSRPUB http://dx.doi.org/10.12983/ijsrk-2014-p0320-0327
Lesson 13: Box-Jenkins Modeling Strategy for building ARMA models
 Lesson 13: Box-Jenkins Modeling Strategy for building ARMA models Facoltà di Economia Università dell Aquila umberto.triacca@gmail.com Introduction In this lesson we present a method to construct an ARMA(p,
A Simulating Model For Daily Uganda Shilling-Nigerian Naira Exchange Rates
 Available online at www.scinzer.com Austrian Journal of Mathematics and Statistics, Vol 1, Issue 1, (2017): 23-28 ISSN 0000-0000 A Simulating Model For Daily Uganda Shilling-Nigerian Naira Exchange Rates
Some Time-Series Models
 Some Time-Series Models Outline 1. Stochastic processes and their properties 2. Stationary processes 3. Some properties of the autocorrelation function 4. Some useful models Purely random processes, random
at least 50 and preferably 100 observations should be available to build a proper model
 III Box-Jenkins Methods 1. Pros and Cons of ARIMA Forecasting a) need for data at least 50 and preferably 100 observations should be available to build a proper model used most frequently for hourly or
Available online Journal of Scientific and Engineering Research, 2016, 3(2): Research Article
: Research Article") Available online www.jsaer.com, 2016, 3(2):11-15 Research Article ISSN: 2394-2630 CODEN(USA): JSERBR A Box-Jenkins Method Based Subset Simulating Model for Daily Ugx-Ngn Exchange Rates Ette Harrison Etuk
Available online www.jsaer.com, 2016, 3(2):11-15 Research Article ISSN: 2394-2630 CODEN(USA): JSERBR A Box-Jenkins Method Based Subset Simulating Model for Daily Ugx-Ngn Exchange Rates Ette Harrison Etuk
Forecasting. Simon Shaw 2005/06 Semester II
 Forecasting Simon Shaw s.c.shaw@maths.bath.ac.uk 2005/06 Semester II 1 Introduction A critical aspect of managing any business is planning for the future. events is called forecasting. Predicting future
Suan Sunandha Rajabhat University
 Forecasting Exchange Rate between Thai Baht and the US Dollar Using Time Series Analysis Kunya Bowornchockchai Suan Sunandha Rajabhat University INTRODUCTION The objective of this research is to forecast
TIME SERIES ANALYSIS AND FORECASTING USING THE STATISTICAL MODEL ARIMA
 CHAPTER 6 TIME SERIES ANALYSIS AND FORECASTING USING THE STATISTICAL MODEL ARIMA 6.1. Introduction A time series is a sequence of observations ordered in time. A basic assumption in the time series analysis
FORECASTING SUGARCANE PRODUCTION IN INDIA WITH ARIMA MODEL
 FORECASTING SUGARCANE PRODUCTION IN INDIA WITH ARIMA MODEL B. N. MANDAL Abstract: Yearly sugarcane production data for the period of - to - of India were analyzed by time-series methods. Autocorrelation
Chapter 12: An introduction to Time Series Analysis. Chapter 12: An introduction to Time Series Analysis
 Chapter 12: An introduction to Time Series Analysis Introduction In this chapter, we will discuss forecasting with single-series (univariate) Box-Jenkins models. The common name of the models is Auto-Regressive
Time Series Analysis -- An Introduction -- AMS 586
 Time Series Analysis -- An Introduction -- AMS 586 1 Objectives of time series analysis Data description Data interpretation Modeling Control Prediction & Forecasting 2 Time-Series Data Numerical data
Available online Journal of Scientific and Engineering Research, 2017, 4(10): Research Article
: Research Article") Available online www.jsaer.com, 2017, 4(10):233-237 Research Article ISSN: 2394-2630 CODEN(USA): JSERBR Interrupted Time Series Modelling of Daily Amounts of British Pound Per Euro due to Brexit Ette Harrison
Available online www.jsaer.com, 2017, 4(10):233-237 Research Article ISSN: 2394-2630 CODEN(USA): JSERBR Interrupted Time Series Modelling of Daily Amounts of British Pound Per Euro due to Brexit Ette Harrison
A Model for Daily Exchange Rates of the Naira and the XOF by Seasonal ARIMA Methods
 Euro-Asian Journal of Economics and Finance ISSN: 2310-0184 (print) ISSN: 2310-4929 (online) Volume: 2, Issue: 3 (July 2014), Pages: 203-215 Academy of Business & Scientific Research http://www.absronline.org/journals
2. An Introduction to Moving Average Models and ARMA Models
 . An Introduction to Moving Average Models and ARMA Models.1 White Noise. The MA(1) model.3 The MA(q) model..4 Estimation and forecasting of MA models..5 ARMA(p,q) models. The Moving Average (MA) models
MCMC analysis of classical time series algorithms.
 MCMC analysis of classical time series algorithms. mbalawata@yahoo.com Lappeenranta University of Technology Lappeenranta, 19.03.2009 Outline Introduction 1 Introduction 2 3 Series generation Box-Jenkins
5 Autoregressive-Moving-Average Modeling
 5 Autoregressive-Moving-Average Modeling 5. Purpose. Autoregressive-moving-average (ARMA models are mathematical models of the persistence, or autocorrelation, in a time series. ARMA models are widely
Minitab Project Report - Assignment 6
 .. Sunspot data Minitab Project Report - Assignment Time Series Plot of y Time Series Plot of X y X 7 9 7 9 The data have a wavy pattern. However, they do not show any seasonality. There seem to be an
Univariate ARIMA Models
 Univariate ARIMA Models ARIMA Model Building Steps: Identification: Using graphs, statistics, ACFs and PACFs, transformations, etc. to achieve stationary and tentatively identify patterns and model components.
Chapter 6: Model Specification for Time Series
 Chapter 6: Model Specification for Time Series The ARIMA(p, d, q) class of models as a broad class can describe many real time series. Model specification for ARIMA(p, d, q) models involves 1. Choosing
{ } Stochastic processes. Models for time series. Specification of a process. Specification of a process. , X t3. ,...X tn }
 Stochastic processes Time series are an example of a stochastic or random process Models for time series A stochastic process is 'a statistical phenomenon that evolves in time according to probabilistic
ARIMA Models. Richard G. Pierse
 ARIMA Models Richard G. Pierse 1 Introduction Time Series Analysis looks at the properties of time series from a purely statistical point of view. No attempt is made to relate variables using a priori
Chapter 8: Model Diagnostics
 Chapter 8: Model Diagnostics Model diagnostics involve checking how well the model fits. If the model fits poorly, we consider changing the specification of the model. A major tool of model diagnostics
Empirical Approach to Modelling and Forecasting Inflation in Ghana
 Current Research Journal of Economic Theory 4(3): 83-87, 2012 ISSN: 2042-485X Maxwell Scientific Organization, 2012 Submitted: April 13, 2012 Accepted: May 06, 2012 Published: June 30, 2012 Empirical Approach
FE570 Financial Markets and Trading. Stevens Institute of Technology
 FE570 Financial Markets and Trading Lecture 5. Linear Time Series Analysis and Its Applications (Ref. Joel Hasbrouck - Empirical Market Microstructure ) Steve Yang Stevens Institute of Technology 9/25/2012
Estimation and application of best ARIMA model for forecasting the uranium price.
 Estimation and application of best ARIMA model for forecasting the uranium price. Medeu Amangeldi May 13, 2018 Capstone Project Superviser: Dongming Wei Second reader: Zhenisbek Assylbekov Abstract This
Forecasting using R. Rob J Hyndman. 2.4 Non-seasonal ARIMA models. Forecasting using R 1
 Forecasting using R Rob J Hyndman 2.4 Non-seasonal ARIMA models Forecasting using R 1 Outline 1 Autoregressive models 2 Moving average models 3 Non-seasonal ARIMA models 4 Partial autocorrelations 5 Estimation
International Journal of Advancement in Physical Sciences, Volume 4, Number 2, 2012
 International Journal of Advancement in Physical Sciences, Volume, Number, RELIABILIY IN HE ESIMAES AND COMPLIANCE O INVERIBILIY CONDIION OF SAIONARY AND NONSAIONARY IME SERIES MODELS Usoro, A. E. and
Basics: Definitions and Notation. Stationarity. A More Formal Definition
 Basics: Definitions and Notation A Univariate is a sequence of measurements of the same variable collected over (usually regular intervals of) time. Usual assumption in many time series techniques is that
Empirical Market Microstructure Analysis (EMMA)
") Empirical Market Microstructure Analysis (EMMA) Lecture 3: Statistical Building Blocks and Econometric Basics Prof. Dr. Michael Stein michael.stein@vwl.uni-freiburg.de Albert-Ludwigs-University of Freiburg
Empirical Market Microstructure Analysis (EMMA) Lecture 3: Statistical Building Blocks and Econometric Basics Prof. Dr. Michael Stein michael.stein@vwl.uni-freiburg.de Albert-Ludwigs-University of Freiburg
Estimation of Parameters of Multiplicative Seasonal Autoregressive Integrated Moving Average Model Using Multiple Regression
 International Journal of Statistics and Applications 2015, 5(2): 91-97 DOI: 10.5923/j.statistics.20150502.07 Estimation of Parameters of Multiplicative Seasonal Autoregressive Integrated Moving Average
Lecture 19 Box-Jenkins Seasonal Models
 Lecture 19 Box-Jenkins Seasonal Models If the time series is nonstationary with respect to its variance, then we can stabilize the variance of the time series by using a pre-differencing transformation.
ARIMA Models. Jamie Monogan. January 16, University of Georgia. Jamie Monogan (UGA) ARIMA Models January 16, / 27
 ARIMA Models January 16, / 27") ARIMA Models Jamie Monogan University of Georgia January 16, 2018 Jamie Monogan (UGA) ARIMA Models January 16, 2018 1 / 27 Objectives By the end of this meeting, participants should be able to: Argue why
ARIMA Models Jamie Monogan University of Georgia January 16, 2018 Jamie Monogan (UGA) ARIMA Models January 16, 2018 1 / 27 Objectives By the end of this meeting, participants should be able to: Argue why
EASTERN MEDITERRANEAN UNIVERSITY ECON 604, FALL 2007 DEPARTMENT OF ECONOMICS MEHMET BALCILAR ARIMA MODELS: IDENTIFICATION
 ARIMA MODELS: IDENTIFICATION A. Autocorrelations and Partial Autocorrelations 1. Summary of What We Know So Far: a) Series y t is to be modeled by Box-Jenkins methods. The first step was to convert y t
3 Theory of stationary random processes
 3 Theory of stationary random processes 3.1 Linear filters and the General linear process A filter is a transformation of one random sequence {U t } into another, {Y t }. A linear filter is a transformation
Acta Universitatis Carolinae. Mathematica et Physica
 Acta Universitatis Carolinae. Mathematica et Physica Jitka Zichová Some applications of time series models to financial data Acta Universitatis Carolinae. Mathematica et Physica, Vol. 52 (2011), No. 1,
Econometrics for Policy Analysis A Train The Trainer Workshop Oct 22-28, 2016 Organized by African Heritage Institution
 Econometrics for Policy Analysis A Train The Trainer Workshop Oct 22-28, 2016 Organized by African Heritage Institution Delivered by Dr. Nathaniel E. Urama Department of Economics, University of Nigeria,
Using Analysis of Time Series to Forecast numbers of The Patients with Malignant Tumors in Anbar Provinc
 Using Analysis of Time Series to Forecast numbers of The Patients with Malignant Tumors in Anbar Provinc /. ) ( ) / (Box & Jenkins).(.(2010-2006) ARIMA(2,1,0). Abstract: The aim of this research is to
Firstly, the dataset is cleaned and the years and months are separated to provide better distinction (sample below).
.") Project: Forecasting Sales Step 1: Plan Your Analysis Answer the following questions to help you plan out your analysis: 1. Does the dataset meet the criteria of a time series dataset? Make sure to explore
Project: Forecasting Sales Step 1: Plan Your Analysis Answer the following questions to help you plan out your analysis: 1. Does the dataset meet the criteria of a time series dataset? Make sure to explore
Time Series I Time Domain Methods
 Astrostatistics Summer School Penn State University University Park, PA 16802 May 21, 2007 Overview Filtering and the Likelihood Function Time series is the study of data consisting of a sequence of DEPENDENT
Stochastic Analysis of Benue River Flow Using Moving Average (Ma) Model.
 Model.") American Journal of Engineering Research (AJER) 24 American Journal of Engineering Research (AJER) e-issn : 232-847 p-issn : 232-936 Volume-3, Issue-3, pp-274-279 www.ajer.org Research Paper Open Access
American Journal of Engineering Research (AJER) 24 American Journal of Engineering Research (AJER) e-issn : 232-847 p-issn : 232-936 Volume-3, Issue-3, pp-274-279 www.ajer.org Research Paper Open Access
Romanian Economic and Business Review Vol. 3, No. 3 THE EVOLUTION OF SNP PETROM STOCK LIST - STUDY THROUGH AUTOREGRESSIVE MODELS
 THE EVOLUTION OF SNP PETROM STOCK LIST - STUDY THROUGH AUTOREGRESSIVE MODELS Marian Zaharia, Ioana Zaheu, and Elena Roxana Stan Abstract Stock exchange market is one of the most dynamic and unpredictable
Analysis. Components of a Time Series
 Module 8: Time Series Analysis 8.2 Components of a Time Series, Detection of Change Points and Trends, Time Series Models Components of a Time Series There can be several things happening simultaneously
Autoregressive Integrated Moving Average Model to Predict Graduate Unemployment in Indonesia
 DOI 10.1515/ptse-2017-0005 PTSE 12 (1): 43-50 Autoregressive Integrated Moving Average Model to Predict Graduate Unemployment in Indonesia Umi MAHMUDAH u_mudah@yahoo.com (State Islamic University of Pekalongan,
AR(p) + I(d) + MA(q) = ARIMA(p, d, q)
 + I(d) + MA(q) = ARIMA(p, d, q)") AR(p) + I(d) + MA(q) = ARIMA(p, d, q) Outline 1 4.1: Nonstationarity in the Mean 2 ARIMA Arthur Berg AR(p) + I(d)+ MA(q) = ARIMA(p, d, q) 2/ 19 Deterministic Trend Models Polynomial Trend Consider the
AR(p) + I(d) + MA(q) = ARIMA(p, d, q) Outline 1 4.1: Nonstationarity in the Mean 2 ARIMA Arthur Berg AR(p) + I(d)+ MA(q) = ARIMA(p, d, q) 2/ 19 Deterministic Trend Models Polynomial Trend Consider the
Lecture 2: Univariate Time Series
 Lecture 2: Univariate Time Series Analysis: Conditional and Unconditional Densities, Stationarity, ARMA Processes Prof. Massimo Guidolin 20192 Financial Econometrics Spring/Winter 2017 Overview Motivation:
The ARIMA Procedure: The ARIMA Procedure
 Page 1 of 120 Overview: ARIMA Procedure Getting Started: ARIMA Procedure The Three Stages of ARIMA Modeling Identification Stage Estimation and Diagnostic Checking Stage Forecasting Stage Using ARIMA Procedure
Stat 5100 Handout #12.e Notes: ARIMA Models (Unit 7) Key here: after stationary, identify dependence structure (and use for forecasting)
 Key here: after stationary, identify dependence structure (and use for forecasting)") Stat 5100 Handout #12.e Notes: ARIMA Models (Unit 7) Key here: after stationary, identify dependence structure (and use for forecasting) (overshort example) White noise H 0 : Let Z t be the stationary
Stat 5100 Handout #12.e Notes: ARIMA Models (Unit 7) Key here: after stationary, identify dependence structure (and use for forecasting) (overshort example) White noise H 0 : Let Z t be the stationary
ARIMA modeling to forecast area and production of rice in West Bengal
 Journal of Crop and Weed, 9(2):26-31(2013) ARIMA modeling to forecast area and production of rice in West Bengal R. BISWAS AND B. BHATTACHARYYA Department of Agricultural Statistics Bidhan Chandra Krishi
University of Oxford. Statistical Methods Autocorrelation. Identification and Estimation
 University of Oxford Statistical Methods Autocorrelation Identification and Estimation Dr. Órlaith Burke Michaelmas Term, 2011 Department of Statistics, 1 South Parks Road, Oxford OX1 3TG Contents 1 Model
Classic Time Series Analysis
 Classic Time Series Analysis Concepts and Definitions Let Y be a random number with PDF f Y t ~f,t Define t =E[Y t ] m(t) is known as the trend Define the autocovariance t, s =COV [Y t,y s ] =E[ Y t t
Author: Yesuf M. Awel 1c. Affiliation: 1 PhD, Economist-Consultant; P.O Box , Addis Ababa, Ethiopia. c.
 ISSN: 2415-0304 (Print) ISSN: 2522-2465 (Online) Indexing/Abstracting Forecasting GDP Growth: Application of Autoregressive Integrated Moving Average Model Author: Yesuf M. Awel 1c Affiliation: 1 PhD,
ECONOMETRIA II. CURSO 2009/2010 LAB # 3
 ECONOMETRIA II. CURSO 2009/2010 LAB # 3 BOX-JENKINS METHODOLOGY The Box Jenkins approach combines the moving average and the autorregresive models. Although both models were already known, the contribution
Univariate linear models
 Univariate linear models The specification process of an univariate ARIMA model is based on the theoretical properties of the different processes and it is also important the observation and interpretation
Econometría 2: Análisis de series de Tiempo
 Econometría 2: Análisis de series de Tiempo Karoll GOMEZ kgomezp@unal.edu.co http://karollgomez.wordpress.com Segundo semestre 2016 III. Stationary models 1 Purely random process 2 Random walk (non-stationary)
STAT 436 / Lecture 16: Key
 STAT 436 / 536 - Lecture 16: Key Modeling Non-Stationary Time Series Many time series models are non-stationary. Recall a time series is stationary if the mean and variance are constant in time and the
CHAPTER 8 FORECASTING PRACTICE I
 CHAPTER 8 FORECASTING PRACTICE I Sometimes we find time series with mixed AR and MA properties (ACF and PACF) We then can use mixed models: ARMA(p,q) These slides are based on: González-Rivera: Forecasting
Design of Time Series Model for Road Accident Fatal Death in Tamilnadu
 Volume 109 No. 8 2016, 225-232 ISSN: 1311-8080 (printed version); ISSN: 1314-3395 (on-line version) url: http://www.ijpam.eu ijpam.eu Design of Time Series Model for Road Accident Fatal Death in Tamilnadu
Ch 5. Models for Nonstationary Time Series. Time Series Analysis
 We have studied some deterministic and some stationary trend models. However, many time series data cannot be modeled in either way. Ex. The data set oil.price displays an increasing variation from the
Forecasting Area, Production and Yield of Cotton in India using ARIMA Model
 Forecasting Area, Production and Yield of Cotton in India using ARIMA Model M. K. Debnath 1, Kartic Bera 2 *, P. Mishra 1 1 Department of Agricultural Statistics, Bidhan Chanda Krishi Vishwavidyalaya,
Ch 8. MODEL DIAGNOSTICS. Time Series Analysis
 Model diagnostics is concerned with testing the goodness of fit of a model and, if the fit is poor, suggesting appropriate modifications. We shall present two complementary approaches: analysis of residuals
A Data-Driven Model for Software Reliability Prediction
 A Data-Driven Model for Software Reliability Prediction Author: Jung-Hua Lo IEEE International Conference on Granular Computing (2012) Young Taek Kim KAIST SE Lab. 9/4/2013 Contents Introduction Background
Prof. Dr. Roland Füss Lecture Series in Applied Econometrics Summer Term Introduction to Time Series Analysis
 Introduction to Time Series Analysis 1 Contents: I. Basics of Time Series Analysis... 4 I.1 Stationarity... 5 I.2 Autocorrelation Function... 9 I.3 Partial Autocorrelation Function (PACF)... 14 I.4 Transformation
Autoregressive and Moving-Average Models
 Chapter 3 Autoregressive and Moving-Average Models 3.1 Introduction Let y be a random variable. We consider the elements of an observed time series {y 0,y 1,y2,...,y t } as being realizations of this randoms
Time Series Analysis
 Time Series Analysis Christopher Ting http://mysmu.edu.sg/faculty/christophert/ christopherting@smu.edu.sg Quantitative Finance Singapore Management University March 3, 2017 Christopher Ting Week 9 March
Applied time-series analysis
 Robert M. Kunst robert.kunst@univie.ac.at University of Vienna and Institute for Advanced Studies Vienna October 18, 2011 Outline Introduction and overview Econometric Time-Series Analysis In principle,
Forecasting the Prices of Indian Natural Rubber using ARIMA Model
 Available online at www.ijpab.com Rani and Krishnan Int. J. Pure App. Biosci. 6 (2): 217-221 (2018) ISSN: 2320 7051 DOI: http://dx.doi.org/10.18782/2320-7051.5464 ISSN: 2320 7051 Int. J. Pure App. Biosci.
Chapter 4: Models for Stationary Time Series
 Chapter 4: Models for Stationary Time Series Now we will introduce some useful parametric models for time series that are stationary processes. We begin by defining the General Linear Process. Let {Y t
Univariate Time Series Analysis; ARIMA Models
 Econometrics 2 Fall 24 Univariate Time Series Analysis; ARIMA Models Heino Bohn Nielsen of4 Outline of the Lecture () Introduction to univariate time series analysis. (2) Stationarity. (3) Characterizing
A SARIMAX coupled modelling applied to individual load curves intraday forecasting
 A SARIMAX coupled modelling applied to individual load curves intraday forecasting Frédéric Proïa Workshop EDF Institut Henri Poincaré - Paris 05 avril 2012 INRIA Bordeaux Sud-Ouest Institut de Mathématiques
Lecture 3: Autoregressive Moving Average (ARMA) Models and their Practical Applications
 Models and their Practical Applications") Lecture 3: Autoregressive Moving Average (ARMA) Models and their Practical Applications Prof. Massimo Guidolin 20192 Financial Econometrics Winter/Spring 2018 Overview Moving average processes Autoregressive
Lecture 3: Autoregressive Moving Average (ARMA) Models and their Practical Applications Prof. Massimo Guidolin 20192 Financial Econometrics Winter/Spring 2018 Overview Moving average processes Autoregressive
Econometric Forecasting
 Robert M. Kunst robert.kunst@univie.ac.at University of Vienna and Institute for Advanced Studies Vienna October 1, 2014 Outline Introduction Model-free extrapolation Univariate time-series models Trend
Modeling and forecasting global mean temperature time series
 Modeling and forecasting global mean temperature time series April 22, 2018 Abstract: An ARIMA time series model was developed to analyze the yearly records of the change in global annual mean surface
TIME SERIES ANALYSIS. Forecasting and Control. Wiley. Fifth Edition GWILYM M. JENKINS GEORGE E. P. BOX GREGORY C. REINSEL GRETA M.
 TIME SERIES ANALYSIS Forecasting and Control Fifth Edition GEORGE E. P. BOX GWILYM M. JENKINS GREGORY C. REINSEL GRETA M. LJUNG Wiley CONTENTS PREFACE TO THE FIFTH EDITION PREFACE TO THE FOURTH EDITION
EXAMINATIONS OF THE ROYAL STATISTICAL SOCIETY
 EXAMINATIONS OF THE ROYAL STATISTICAL SOCIETY GRADUATE DIPLOMA, 011 MODULE 3 : Stochastic processes and time series Time allowed: Three Hours Candidates should answer FIVE questions. All questions carry
Short-run electricity demand forecasts in Maharashtra
 Applied Economics, 2002, 34, 1055±1059 Short-run electricity demand forecasts in Maharashtra SAJAL GHO SH* and AN JAN A D AS Indira Gandhi Institute of Development Research, Mumbai, India This paper, has
TRANSFER FUNCTION MODEL FOR GLOSS PREDICTION OF COATED ALUMINUM USING THE ARIMA PROCEDURE
 TRANSFER FUNCTION MODEL FOR GLOSS PREDICTION OF COATED ALUMINUM USING THE ARIMA PROCEDURE Mozammel H. Khan Kuwait Institute for Scientific Research Introduction The objective of this work was to investigate
ARIMA Models. Jamie Monogan. January 25, University of Georgia. Jamie Monogan (UGA) ARIMA Models January 25, / 38
 ARIMA Models January 25, / 38") ARIMA Models Jamie Monogan University of Georgia January 25, 2012 Jamie Monogan (UGA) ARIMA Models January 25, 2012 1 / 38 Objectives By the end of this meeting, participants should be able to: Describe
ARIMA Models Jamie Monogan University of Georgia January 25, 2012 Jamie Monogan (UGA) ARIMA Models January 25, 2012 1 / 38 Objectives By the end of this meeting, participants should be able to: Describe
Time Series and Forecasting
 Time Series and Forecasting Introduction to Forecasting n What is forecasting? n Primary Function is to Predict the Future using (time series related or other) data we have in hand n Why are we interested?
Time Series Analysis of Currency in Circulation in Nigeria
 ISSN -3 (Paper) ISSN 5-091 (Online) Time Series Analysis of Currency in Circulation in Nigeria Omekara C.O Okereke O.E. Ire K.I. Irokwe O. Department of Statistics, Michael Okpara University of Agriculture
Elements of Multivariate Time Series Analysis
 Gregory C. Reinsel Elements of Multivariate Time Series Analysis Second Edition With 14 Figures Springer Contents Preface to the Second Edition Preface to the First Edition vii ix 1. Vector Time Series
Time Series Outlier Detection
 Time Series Outlier Detection Tingyi Zhu July 28, 2016 Tingyi Zhu Time Series Outlier Detection July 28, 2016 1 / 42 Outline Time Series Basics Outliers Detection in Single Time Series Outlier Series Detection
SOME BASICS OF TIME-SERIES ANALYSIS
 SOME BASICS OF TIME-SERIES ANALYSIS John E. Floyd University of Toronto December 8, 26 An excellent place to learn about time series analysis is from Walter Enders textbook. For a basic understanding of
Forecasting Egyptian GDP Using ARIMA Models
 Reports on Economics and Finance, Vol. 5, 2019, no. 1, 35-47 HIKARI Ltd, www.m-hikari.com https://doi.org/10.12988/ref.2019.81023 Forecasting Egyptian GDP Using ARIMA Models Mohamed Reda Abonazel * and
Final Examination 7/6/2011
 The Islamic University of Gaza Faculty of Commerce Department of Economics & Applied Statistics Time Series Analysis - Dr. Samir Safi Spring Semester 211 Final Examination 7/6/211 Name: ID: INSTRUCTIONS:
Econometrics I: Univariate Time Series Econometrics (1)
") Econometrics I: Dipartimento di Economia Politica e Metodi Quantitativi University of Pavia Overview of the Lecture 1 st EViews Session VI: Some Theoretical Premises 2 Overview of the Lecture 1 st EViews
Econometrics I: Dipartimento di Economia Politica e Metodi Quantitativi University of Pavia Overview of the Lecture 1 st EViews Session VI: Some Theoretical Premises 2 Overview of the Lecture 1 st EViews
Stat 565. (S)Arima & Forecasting. Charlotte Wickham. stat565.cwick.co.nz. Feb
Arima & Forecasting. Charlotte Wickham. stat565.cwick.co.nz. Feb") Stat 565 (S)Arima & Forecasting Feb 2 2016 Charlotte Wickham stat565.cwick.co.nz Today A note from HW #3 Pick up with ARIMA processes Introduction to forecasting HW #3 The sample autocorrelation coefficients
Stat 565 (S)Arima & Forecasting Feb 2 2016 Charlotte Wickham stat565.cwick.co.nz Today A note from HW #3 Pick up with ARIMA processes Introduction to forecasting HW #3 The sample autocorrelation coefficients
Development of Demand Forecasting Models for Improved Customer Service in Nigeria Soft Drink Industry_ Case of Coca-Cola Company Enugu
 International Journal of Scientific Research Engineering & Technology (IJSRET), ISSN 2278 882 Volume 5, Issue 4, April 26 259 Development of Demand Forecasting Models for Improved Customer Service in Nigeria
ESSE Mid-Term Test 2017 Tuesday 17 October :30-09:45
 ESSE 4020 3.0 - Mid-Term Test 207 Tuesday 7 October 207. 08:30-09:45 Symbols have their usual meanings. All questions are worth 0 marks, although some are more difficult than others. Answer as many questions
NANYANG TECHNOLOGICAL UNIVERSITY SEMESTER II EXAMINATION MAS451/MTH451 Time Series Analysis TIME ALLOWED: 2 HOURS
 NANYANG TECHNOLOGICAL UNIVERSITY SEMESTER II EXAMINATION 2012-2013 MAS451/MTH451 Time Series Analysis May 2013 TIME ALLOWED: 2 HOURS INSTRUCTIONS TO CANDIDATES 1. This examination paper contains FOUR (4)
Time Series Analysis of United States of America Crude Oil and Petroleum Products Importations from Saudi Arabia
 International Journal of Applied Science and Technology Vol. 5, No. 5; October 2015 Time Series Analysis of United States of America Crude Oil and Petroleum Products Importations from Saudi Arabia Olayan
MODELING MAXIMUM MONTHLY TEMPERATURE IN KATUNAYAKE REGION, SRI LANKA: A SARIMA APPROACH
 MODELING MAXIMUM MONTHLY TEMPERATURE IN KATUNAYAKE REGION, SRI LANKA: A SARIMA APPROACH M.C.Alibuhtto 1 &P.A.H.R.Ariyarathna 2 1 Department of Mathematical Sciences, Faculty of Applied Sciences, South
Time Series and Forecasting
 Time Series and Forecasting Introduction to Forecasting n What is forecasting? n Primary Function is to Predict the Future using (time series related or other) data we have in hand n Why are we interested?
Box-Jenkins ARIMA Advanced Time Series
 Box-Jenkins ARIMA Advanced Time Series www.realoptionsvaluation.com ROV Technical Papers Series: Volume 25 Theory In This Issue 1. Learn about Risk Simulator s ARIMA and Auto ARIMA modules. 2. Find out
Ch 6. Model Specification. Time Series Analysis
 We start to build ARIMA(p,d,q) models. The subjects include: 1 how to determine p, d, q for a given series (Chapter 6); 2 how to estimate the parameters (φ s and θ s) of a specific ARIMA(p,d,q) model (Chapter