Confidence Intervals for Population Mean
|
|
|
- Barnaby Stafford
- 5 years ago
- Views:
Transcription
1 Confidence Intervals for Population Mean Reading: Sections 7.1, 7.2, 7.3 Learning Objectives: Students should be able to: Understand the meaning and purpose of confidence intervals Calculate a confidence interval for the mean of a Normally distributed population with or without known variance Calculate a confidence interval for the mean of any distribution with a large sample Correctly interpret confidence intervals Determine the sample size needed to be within a given margin of error 1
2 Point Estimation is Not Enough GOAL: Use a sample to make inference about the population parameters. SO FAR: We used point estimation to make a guess about a population parameter. We saw that these guesses (statistics) have distributions. We know that we only see one value not the entire distribution. We do not know how good our guess is. NEXT: Instead of making a single guess at the parameter, we want to determine an interval of values in which the parameter lay with good confidence. 2
3 Finding CIs for a population Mean Three Settings Normal distribution with known variance (contrive but easiest to understand) Normal distribution with unknown variance Note: The above two settings do not require large sample size Non-normal distribution, but sample size is large enough so that the CLT applies. 3
4 Example 1: Normal Distribution Variance Known Suppose the following beam strengths (a subset from a previous example) follow a normal distribution N(µ, ): 5.9, 7.2, 7.3, 6.3, 8.1, 6.8, 7.0, 7.6, 6.8, 6.5, 7.0, 6.3, 7.9, 9.0, 8.2, 8.7, 7.8, 9.7, 7.4, 7.7, 9.7, 7.8, 7.7, 10.7,
5 Example 1 (cont d): CI for μ Point estimator follows a normal distribution x 25 5
6 Interpreting a CI The probability that the random interval contains μ is 1-α. If we have N samples and we compute the CI N times. Then 90% of them will contain the true value of μ. 6
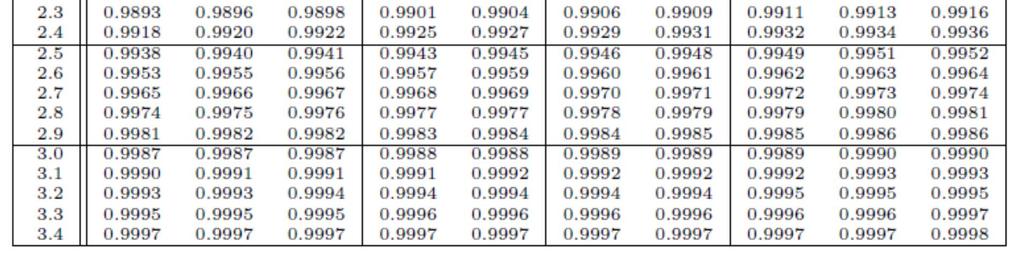
7 Example 1 (cont d): CI for μ for different α levels 7 212Xz1. Xz. 225, 2 / / 25 X2/ α = 0.1; 90% CI = zz/ 2/ 2α = 0.05; 95% CI = α = 0.01; 99% CI = z7
8 .. \
9 True or False? There is a 95% chance that the true average strength falls between 7.28 and I am 95% confident that the true average strength is captured between 7.28 and At 95% confidence, the values between 7.28 and 8.22 are reasonable values for the true average strength. If I repeated this sampling procedure 100 times, I would expect 95% of the calculated intervals to capture the true average strength. 9
10 Normal Distribution Variance Known Two-sided and one-sided CIs 10
11 Sample size, Confidence Level, and Precision 110CI: Xz Xz( ) % 2 n 2/, / z Width of interval = n2/2/ 2 n Precision = inverse of the width of interval Margin of error = ½ width of interval The larger the sample size, the larger the precision, the smaller the margin of error Trade-off between precision and confidence level A larger confidence level will lead to a less precise interval since will be larger z11
12 Sample Size Determination Suppose you will collect a sample from a population with a Normal distribution and known standard deviation σ. What sample size would you need to obtain a confidence interval for the population mean with a particular margin of error e at significance level α, i.e., confidence level (1- α)100%? 12
13 Example 1 (cont d): CI for μ for different α levels 90% CI: (7.36, 8.14); e = % CI: (7.28, 8.22); e = % CI: (7.13, 8.37); e = Xz1. Xz. 225, 2 / / z196n z. 2 2 e /. / 205z258n z. 2 2 e /. / X 13
14 CI for Population Mean Normal Distribution Variance Unknown Substitute the sample standard deviation for the population standard deviation. 14
15 Student s t distribution N
: 5.9, 7.2, 7.3, 6.3, 8.1, 6.8, 7.0, 7.6, 6.8, 6.5, 7.0, 6.3, 7.9, 9.0, 8.2, 8.7, 7.8, 9.7, 7.4, 7.7, 9.7, 7.8, 7.7, 10.7, 8.6. 16")
16 Example 2: Normal Variance Unknown Suppose the following beam strengths (a subset from a previous example) follow a normal distribution N(µ, σ 2 ): 5.9, 7.2, 7.3, 6.3, 8.1, 6.8, 7.0, 7.6, 6.8, 6.5, 7.0, 6.3, 7.9, 9.0, 8.2, 8.7, 7.8, 9.7, 7.4, 7.7, 9.7, 7.8, 7.7, 10.7,
17 Example 2 (Cont d): CI for μ t with d.f. = 24 x 25
18 18
19 Normal Distribution Variance Unknown Two-sided and one-sided CIs Can define upper confidence bound and lower confidence bound similarly as in the variance known case. 19
20 ~NapproximatelyCI for Population Mean in ANY Population with Large Sample Size CLT: Suppose X 1, X n are independent random draws from a population with mean μ and variance σ 2. If n is sufficiently large, then Xn2, n How large is sufficiently large? Rule of thumb: n 30 Is this rule of thumb still applies for constructing intervals. 20
21 Large Sample CI for Population Mean 2X~N aproximat n, n Rule of thumb: n 40, which is larger than for CLT due to additional variability introduced by using S in place of σ. Can construct one-sided CIs as before.ely21
22 Sample Size Calculation n z 2 S / 2 e Can sample size be reasonably determined? Educated guess of S based on a pilot study Educated guess of range (R) of data; if population is not too skewed, estimate S by R/4. 22
23 Example 3: Large Sample CI for μ Suppose he number of daily spam s coming to a mailbox follows a Poisson distribution with intensity parameter λ. The following table gives the observations in 60 days (independent from day to day). # Spam Freq (days) Percent Number of Spam s Bars are the observed; Red dots are the fit with Poisson distribution. 23
24 Example 3: Large Sample CI (Cont d) Construct a 85% two-sided CI 24


25 .. \
26 Summary of Steps in Constructing CI for a Parameter θ (i.e. mean) 1. Find point estimator (statistic) for parameter 2. Find the (approximate) distribution of the (standardized) statistic 3. Using the sample distribution to find the upper and lower limits (critical values for significant level α) 4. Solve for θ to get the (random) CI 26
7.1 Basic Properties of Confidence Intervals
 7.1 Basic Properties of Confidence Intervals What s Missing in a Point Just a single estimate What we need: how reliable it is Estimate? No idea how reliable this estimate is some measure of the variability
Business Statistics. Lecture 5: Confidence Intervals
 Business Statistics Lecture 5: Confidence Intervals Goals for this Lecture Confidence intervals The t distribution 2 Welcome to Interval Estimation! Moments Mean 815.0340 Std Dev 0.8923 Std Error Mean
Chapter 8 - Statistical intervals for a single sample
 Chapter 8 - Statistical intervals for a single sample 8-1 Introduction In statistics, no quantity estimated from data is known for certain. All estimated quantities have probability distributions of their
Chapter 8: Estimating with Confidence
 Chapter 8: Estimating with Confidence Section 8.3 The Practice of Statistics, 4 th edition For AP* STARNES, YATES, MOORE Chapter 8 Estimating with Confidence n 8.1 Confidence Intervals: The Basics n 8.2
Chapter 8: Estimating with Confidence
 Chapter 8: Estimating with Confidence Section 8.3 The Practice of Statistics, 4 th edition For AP* STARNES, YATES, MOORE The One-Sample z Interval for a Population Mean In Section 8.1, we estimated the
Statistical Inference
 Chapter 14 Confidence Intervals: The Basic Statistical Inference Situation: We are interested in estimating some parameter (population mean, μ) that is unknown. We take a random sample from this population.
Business Statistics: Lecture 8: Introduction to Estimation & Hypothesis Testing
 Business Statistics: Lecture 8: Introduction to Estimation & Hypothesis Testing Agenda Introduction to Estimation Point estimation Interval estimation Introduction to Hypothesis Testing Concepts en terminology
Statistical Inference
 Statistical Inference Bernhard Klingenberg Institute of Statistics Graz University of Technology Steyrergasse 17/IV, 8010 Graz www.statistics.tugraz.at February 12, 2008 Outline Estimation: Review of concepts
Statistical inference provides methods for drawing conclusions about a population from sample data.
 Introduction to inference Confidence Intervals Statistical inference provides methods for drawing conclusions about a population from sample data. 10.1 Estimating with confidence SAT σ = 100 n = 500 µ
Business Statistics: A Decision-Making Approach 6 th Edition. Chapter Goals
 Chapter 6 Student Lecture Notes 6-1 Business Statistics: A Decision-Making Approach 6 th Edition Chapter 6 Introduction to Sampling Distributions Chap 6-1 Chapter Goals To use information from the sample
Confidence Intervals Unknown σ
 Confidence Intervals Unknown σ Estimate σ Student s t-distribution Step-by-step instructions Example Confidence Intervals - Known σ Standard normal distribution aaad1hicbvjbtxqxfc6sf1xvoi/gzojcgrohm4neetahyqipxlbzmaer6xtozjz0kmnk5cmt8zxn33vf+ap8qf44h/xdedcbzp0eubr951lz8kqkwobx7+nplvnzl+4ohopffnk1wvxz+duvk/1yhdocs1+zcxgqrq0lpcsvhqgwbljmer10p91ufwnrcq017ueg/ziusa8gzreijo5zj6jxfcxe38tuznxgpblz0kiojm7a/xvz+9vpxs7c9m/aa75qarluwr1vzkle07zqzgenybjmqogn9lbwyjqvgjdd81aftoiuiojwba4fyaubxiwnlxr+uwrfpktlhkiqzcqcw9ar7o3jud0jviwukbougdccm4n4kbnglb5dmyry47osmcrpbjogtpo+oxigdtf1ek+nkibrp/giujpa4e4gtskuxe0tpibaemohx3rchh47x57pkjjhcqhavyozu7ssr0nbtrsi1nl5gm47m5c0al5ciff+9pxd/yrtjlbabeonyhkshf/gwdtmrajtbvdpaztj4cuqxipgrdb3mfstkso1kpqamtf6z7cxxt9//7htq6tiqitckcjcndkmnvxxgrybn69ffbeuzrd7qyp0m66sulpohygqp3jlsfixeijndhxxdhkvnnexptpvfhigzzhauzwmo4jwkng55cnkktxu9dgl1kx6tdnzekmm1q6rosrjoqhwsppyqbpeu4m+ua+kx+trzzvfw59oarotx1pbpkj1fr6fqtsik=
Sampling Distributions
 Sampling Distributions Sampling Distribution of the Mean & Hypothesis Testing Remember sampling? Sampling Part 1 of definition Selecting a subset of the population to create a sample Generally random sampling
Lecture 7: Confidence interval and Normal approximation
 Lecture 7: Confidence interval and Normal approximation 26th of November 2015 Confidence interval 26th of November 2015 1 / 23 Random sample and uncertainty Example: we aim at estimating the average height
Lecture 6: Point Estimation and Large Sample Confidence Intervals. Readings: Sections
 Lecture 6: Point Estimation and Large Sample Confidence Intervals Readings: Sections 7.1-7.3 1 Point Estimation Objective of point estimation: use a sample to compute a number that represents in some sense
7 Estimation. 7.1 Population and Sample (P.91-92)
") 7 Estimation MATH1015 Biostatistics Week 7 7.1 Population and Sample (P.91-92) Suppose that we wish to study a particular health problem in Australia, for example, the average serum cholesterol level for
7 Estimation MATH1015 Biostatistics Week 7 7.1 Population and Sample (P.91-92) Suppose that we wish to study a particular health problem in Australia, for example, the average serum cholesterol level for
Percentage point z /2
 Chapter 8: Statistical Intervals Why? point estimate is not reliable under resampling. Interval Estimates: Bounds that represent an interval of plausible values for a parameter There are three types of
Introduction to Estimation. Martina Litschmannová K210
 Introduction to Estimation Martina Litschmannová martina.litschmannova@vsb.cz K210 Populations vs. Sample A population includes each element from the set of observations that can be made. A sample consists
Topic 3: Sampling Distributions, Confidence Intervals & Hypothesis Testing. Road Map Sampling Distributions, Confidence Intervals & Hypothesis Testing
 Topic 3: Sampling Distributions, Confidence Intervals & Hypothesis Testing ECO22Y5Y: Quantitative Methods in Economics Dr. Nick Zammit University of Toronto Department of Economics Room KN3272 n.zammit
MATH Chapter 21 Notes Two Sample Problems
 MATH 1070 - Chapter 21 Notes Two Sample Problems Recall: So far, we have dealt with inference (confidence intervals and hypothesis testing) pertaining to: Single sample of data. A matched pairs design
Are data normally normally distributed?
 Standard Normal Image source Are data normally normally distributed? Sample mean: 66.78 Sample standard deviation: 3.37 (66.78-1 x 3.37, 66.78 + 1 x 3.37) (66.78-2 x 3.37, 66.78 + 2 x 3.37) (66.78-3 x
Ch Inference for Linear Regression
 Ch. 12-1 Inference for Linear Regression ACT = 6.71 + 5.17(GPA) For every increase of 1 in GPA, we predict the ACT score to increase by 5.17. population regression line β (true slope) μ y = α + βx mean
GAISE Framework 3. Formulate Question Collect Data Analyze Data Interpret Results
 Project-SET Variability Final Learning Trajectory 1,2 Loop 1 4 Concept of a Distribution GAISE Framework 3 Formulate Question Collect Data Analyze Data Interpret Results a. How can we discover a. Describe
Chapter 24. Comparing Means. Copyright 2010 Pearson Education, Inc.
 Chapter 24 Comparing Means Copyright 2010 Pearson Education, Inc. Plot the Data The natural display for comparing two groups is boxplots of the data for the two groups, placed side-by-side. For example:
Math 494: Mathematical Statistics
 Math 494: Mathematical Statistics Instructor: Jimin Ding jmding@wustl.edu Department of Mathematics Washington University in St. Louis Class materials are available on course website (www.math.wustl.edu/
T.I.H.E. IT 233 Statistics and Probability: Sem. 1: 2013 ESTIMATION AND HYPOTHESIS TESTING OF TWO POPULATIONS
 ESTIMATION AND HYPOTHESIS TESTING OF TWO POPULATIONS In our work on hypothesis testing, we used the value of a sample statistic to challenge an accepted value of a population parameter. We focused only
How do we compare the relative performance among competing models?
 How do we compare the relative performance among competing models? 1 Comparing Data Mining Methods Frequent problem: we want to know which of the two learning techniques is better How to reliably say Model
Section I Questions with parts
 Name: SFU ID: Stat 201 Midterm Solutions page 1 Section I Questions with parts Most parts in these questions are related. For a part that you can t do, write Can t do -- suppose answer is and fill in some
Diagnostics. Gad Kimmel
 Diagnostics Gad Kimmel Outline Introduction. Bootstrap method. Cross validation. ROC plot. Introduction Motivation Estimating properties of an estimator. Given data samples say the average. x 1, x 2,...,
Chapter 23: Inferences About Means
 Chapter 3: Inferences About Means Sample of Means: number of observations in one sample the population mean (theoretical mean) sample mean (observed mean) is the theoretical standard deviation of the population
Lecture 11 - Tests of Proportions
 Lecture 11 - Tests of Proportions Statistics 102 Colin Rundel February 27, 2013 Research Project Research Project Proposal - Due Friday March 29th at 5 pm Introduction, Data Plan Data Project - Due Friday,
Interval estimation. October 3, Basic ideas CLT and CI CI for a population mean CI for a population proportion CI for a Normal mean
 Interval estimation October 3, 2018 STAT 151 Class 7 Slide 1 Pandemic data Treatment outcome, X, from n = 100 patients in a pandemic: 1 = recovered and 0 = not recovered 1 1 1 0 0 0 1 1 1 0 0 1 0 1 0 0
Sociology 6Z03 Review II
 Sociology 6Z03 Review II John Fox McMaster University Fall 2016 John Fox (McMaster University) Sociology 6Z03 Review II Fall 2016 1 / 35 Outline: Review II Probability Part I Sampling Distributions Probability
Stat 231 Exam 2 Fall 2013
 Stat 231 Exam 2 Fall 2013 I have neither given nor received unauthorized assistance on this exam. Name Signed Date Name Printed 1 1. Some IE 361 students worked with a manufacturer on quantifying the capability
STA 101 Final Review
 STA 101 Final Review Statistics 101 Thomas Leininger June 24, 2013 Announcements All work (besides projects) should be returned to you and should be entered on Sakai. Office Hour: 2 3pm today (Old Chem
 «4 [< «
 Content by Week Week of October 14 27
 Content by Week Week of October 14 27 Learning objectives By the end of this week, you should be able to: Understand the purpose and interpretation of confidence intervals for the mean, Calculate confidence
Statistics Primer. ORC Staff: Jayme Palka Peter Boedeker Marcus Fagan Trey Dejong
 Statistics Primer ORC Staff: Jayme Palka Peter Boedeker Marcus Fagan Trey Dejong 1 Quick Overview of Statistics 2 Descriptive vs. Inferential Statistics Descriptive Statistics: summarize and describe data
Chapter 23. Inference About Means
 Chapter 23 Inference About Means 1 /57 Homework p554 2, 4, 9, 10, 13, 15, 17, 33, 34 2 /57 Objective Students test null and alternate hypotheses about a population mean. 3 /57 Here We Go Again Now that
Math489/889 Stochastic Processes and Advanced Mathematical Finance Solutions for Homework 7
 Math489/889 Stochastic Processes and Advanced Mathematical Finance Solutions for Homework 7 Steve Dunbar Due Mon, November 2, 2009. Time to review all of the information we have about coin-tossing fortunes
One-sample categorical data: approximate inference
 One-sample categorical data: approximate inference Patrick Breheny October 6 Patrick Breheny Biostatistical Methods I (BIOS 5710) 1/25 Introduction It is relatively easy to think about the distribution
SHORT ANSWER. Write the word or phrase that best completes each statement or answers the question.
 Chapter 7 Exam A Name 1) How do you determine whether to use the z or t distribution in computing the margin of error, E = z α/2 σn or E = t α/2 s n? 1) Use the given degree of confidence and sample data
MANY BILLS OF CONCERN TO PUBLIC
 - 6 8 9-6 8 9 6 9 XXX 4 > -? - 8 9 x 4 z ) - -! x - x - - X - - - - - x 00 - - - - - x z - - - x x - x - - - - - ) x - - - - - - 0 > - 000-90 - - 4 0 x 00 - -? z 8 & x - - 8? > 9 - - - - 64 49 9 x - -
Variables, distributions, and samples (cont.) Phil 12: Logic and Decision Making Fall 2010 UC San Diego 10/18/2010
 Phil 12: Logic and Decision Making Fall 2010 UC San Diego 10/18/2010") Variables, distributions, and samples (cont.) Phil 12: Logic and Decision Making Fall 2010 UC San Diego 10/18/2010 Review Recording observations - Must extract that which is to be analyzed: coding systems,
Variables, distributions, and samples (cont.) Phil 12: Logic and Decision Making Fall 2010 UC San Diego 10/18/2010 Review Recording observations - Must extract that which is to be analyzed: coding systems,
2.830J / 6.780J / ESD.63J Control of Manufacturing Processes (SMA 6303) Spring 2008
 Spring 2008") MIT OpenCourseWare http://ocw.mit.edu 2.830J / 6.780J / ESD.63J Control of Processes (SMA 6303) Spring 2008 For information about citing these materials or our Terms of Use, visit: http://ocw.mit.edu/terms.
MIT OpenCourseWare http://ocw.mit.edu 2.830J / 6.780J / ESD.63J Control of Processes (SMA 6303) Spring 2008 For information about citing these materials or our Terms of Use, visit: http://ocw.mit.edu/terms.
ST 371 (IX): Theories of Sampling Distributions
: Theories of Sampling Distributions") ST 371 (IX): Theories of Sampling Distributions 1 Sample, Population, Parameter and Statistic The major use of inferential statistics is to use information from a sample to infer characteristics about
ST 371 (IX): Theories of Sampling Distributions 1 Sample, Population, Parameter and Statistic The major use of inferential statistics is to use information from a sample to infer characteristics about
First we look at some terms to be used in this section.
 8 Hypothesis Testing 8.1 Introduction MATH1015 Biostatistics Week 8 In Chapter 7, we ve studied the estimation of parameters, point or interval estimates. The construction of CI relies on the sampling
EC2001 Econometrics 1 Dr. Jose Olmo Room D309
 EC2001 Econometrics 1 Dr. Jose Olmo Room D309 J.Olmo@City.ac.uk 1 Revision of Statistical Inference 1.1 Sample, observations, population A sample is a number of observations drawn from a population. Population:
Statistical Intervals (One sample) (Chs )
 (Chs )") 7 Statistical Intervals (One sample) (Chs 8.1-8.3) Confidence Intervals The CLT tells us that as the sample size n increases, the sample mean X is close to normally distributed with expected value µ and
7 Statistical Intervals (One sample) (Chs 8.1-8.3) Confidence Intervals The CLT tells us that as the sample size n increases, the sample mean X is close to normally distributed with expected value µ and
Ch. 1: Data and Distributions
 Ch. 1: Data and Distributions Populations vs. Samples How to graphically display data Histograms, dot plots, stem plots, etc Helps to show how samples are distributed Distributions of both continuous and
Statistical inference
 Statistical inference Contents 1. Main definitions 2. Estimation 3. Testing L. Trapani MSc Induction - Statistical inference 1 1 Introduction: definition and preliminary theory In this chapter, we shall
Gov Univariate Inference II: Interval Estimation and Testing
 Gov 2000-5. Univariate Inference II: Interval Estimation and Testing Matthew Blackwell October 13, 2015 1 / 68 Large Sample Confidence Intervals Confidence Intervals Example Hypothesis Tests Hypothesis
Stat 427/527: Advanced Data Analysis I
 Stat 427/527: Advanced Data Analysis I Review of Chapters 1-4 Sep, 2017 1 / 18 Concepts you need to know/interpret Numerical summaries: measures of center (mean, median, mode) measures of spread (sample
STAT 4385 Topic 01: Introduction & Review
 STAT 4385 Topic 01: Introduction & Review Xiaogang Su, Ph.D. Department of Mathematical Science University of Texas at El Paso xsu@utep.edu Spring, 2016 Outline Welcome What is Regression Analysis? Basics
Confidence Intervals. Confidence interval for sample mean. Confidence interval for sample mean. Confidence interval for sample mean
 Confidence Intervals Confidence interval for sample mean The CLT tells us: as the sample size n increases, the sample mean is approximately Normal with mean and standard deviation Thus, we have a standard
Review of the Normal Distribution
 Sampling and s Normal Distribution Aims of Sampling Basic Principles of Probability Types of Random Samples s of the Mean Standard Error of the Mean The Central Limit Theorem Review of the Normal Distribution
Occupy movement - Duke edition. Lecture 14: Large sample inference for proportions. Exploratory analysis. Another poll on the movement
 Occupy movement - Duke edition Lecture 14: Large sample inference for proportions Statistics 101 Mine Çetinkaya-Rundel October 20, 2011 On Tuesday we asked you about how closely you re following the news
Hypothesis Testing. File: /General/MLAB-Text/Papers/hyptest.tex
 File: /General/MLAB-Text/Papers/hyptest.tex Hypothesis Testing Gary D. Knott, Ph.D. Civilized Software, Inc. 12109 Heritage Park Circle Silver Spring, MD 20906 USA Tel. (301) 962-3711 Email: csi@civilized.com
Fundamental Tools - Probability Theory IV
 Fundamental Tools - Probability Theory IV MSc Financial Mathematics The University of Warwick October 1, 2015 MSc Financial Mathematics Fundamental Tools - Probability Theory IV 1 / 14 Model-independent
Lecture 8 Inequality Testing and Moment Inequality Models
 Lecture 8 Inequality Testing and Moment Inequality Models Inequality Testing In the previous lecture, we discussed how to test the nonlinear hypothesis H 0 : h(θ 0 ) 0 when the sample information comes
AMS7: WEEK 7. CLASS 1. More on Hypothesis Testing Monday May 11th, 2015
 AMS7: WEEK 7. CLASS 1 More on Hypothesis Testing Monday May 11th, 2015 Testing a Claim about a Standard Deviation or a Variance We want to test claims about or 2 Example: Newborn babies from mothers taking
Inference for Single Proportions and Means T.Scofield
 Inference for Single Proportions and Means TScofield Confidence Intervals for Single Proportions and Means A CI gives upper and lower bounds between which we hope to capture the (fixed) population parameter
LECTURE 5. Introduction to Econometrics. Hypothesis testing
 LECTURE 5 Introduction to Econometrics Hypothesis testing October 18, 2016 1 / 26 ON TODAY S LECTURE We are going to discuss how hypotheses about coefficients can be tested in regression models We will
Statistics and Quantitative Analysis U4320. Segment 5: Sampling and inference Prof. Sharyn O Halloran
 Statistics and Quantitative Analysis U4320 Segment 5: Sampling and inference Prof. Sharyn O Halloran Sampling A. Basics 1. Ways to Describe Data Histograms Frequency Tables, etc. 2. Ways to Characterize
INTRODUCTION TO ANALYSIS OF VARIANCE
 CHAPTER 22 INTRODUCTION TO ANALYSIS OF VARIANCE Chapter 18 on inferences about population means illustrated two hypothesis testing situations: for one population mean and for the difference between two
Some Assorted Formulae. Some confidence intervals: σ n. x ± z α/2. x ± t n 1;α/2 n. ˆp(1 ˆp) ˆp ± z α/2 n. χ 2 n 1;1 α/2. n 1;α/2
 ˆp ± z α/2 n. χ 2 n 1;1 α/2. n 1;α/2") STA 248 H1S MIDTERM TEST February 26, 2008 SURNAME: SOLUTIONS GIVEN NAME: STUDENT NUMBER: INSTRUCTIONS: Time: 1 hour and 50 minutes Aids allowed: calculator Tables of the standard normal, t and chi-square
STA 248 H1S MIDTERM TEST February 26, 2008 SURNAME: SOLUTIONS GIVEN NAME: STUDENT NUMBER: INSTRUCTIONS: Time: 1 hour and 50 minutes Aids allowed: calculator Tables of the standard normal, t and chi-square
Pivotal Quantities. Mathematics 47: Lecture 16. Dan Sloughter. Furman University. March 30, 2006
 Pivotal Quantities Mathematics 47: Lecture 16 Dan Sloughter Furman University March 30, 2006 Dan Sloughter (Furman University) Pivotal Quantities March 30, 2006 1 / 10 Pivotal quantities Definition Suppose
Gov 2000: 6. Hypothesis Testing
 Gov 2000: 6. Hypothesis Testing Matthew Blackwell October 11, 2016 1 / 55 1. Hypothesis Testing Examples 2. Hypothesis Test Nomenclature 3. Conducting Hypothesis Tests 4. p-values 5. Power Analyses 6.
Learning Objectives for Stat 225
 Learning Objectives for Stat 225 08/20/12 Introduction to Probability: Get some general ideas about probability, and learn how to use sample space to compute the probability of a specific event. Set Theory:
Chapter 5 Confidence Intervals
 Chapter 5 Confidence Intervals Confidence Intervals about a Population Mean, σ, Known Abbas Motamedi Tennessee Tech University A point estimate: a single number, calculated from a set of data, that is
Statistical Inference for Means
 Statistical Inference for Means Jamie Monogan University of Georgia February 18, 2011 Jamie Monogan (UGA) Statistical Inference for Means February 18, 2011 1 / 19 Objectives By the end of this meeting,
Confidence Intervals, Testing and ANOVA Summary
 Confidence Intervals, Testing and ANOVA Summary 1 One Sample Tests 1.1 One Sample z test: Mean (σ known) Let X 1,, X n a r.s. from N(µ, σ) or n > 30. Let The test statistic is H 0 : µ = µ 0. z = x µ 0
Class 24. Daniel B. Rowe, Ph.D. Department of Mathematics, Statistics, and Computer Science. Marquette University MATH 1700
 Class 4 Daniel B. Rowe, Ph.D. Department of Mathematics, Statistics, and Computer Science Copyright 013 by D.B. Rowe 1 Agenda: Recap Chapter 9. and 9.3 Lecture Chapter 10.1-10.3 Review Exam 6 Problem Solving
LECTURE 12 CONFIDENCE INTERVAL AND HYPOTHESIS TESTING
 LECTURE 1 CONFIDENCE INTERVAL AND HYPOTHESIS TESTING INTERVAL ESTIMATION Point estimation of : The inference is a guess of a single value as the value of. No accuracy associated with it. Interval estimation
Introduction to Statistical Data Analysis Lecture 5: Confidence Intervals
 Introduction to Statistical Data Analysis Lecture 5: Confidence Intervals James V. Lambers Department of Mathematics The University of Southern Mississippi James V. Lambers Statistical Data Analysis 1
The t-distribution. Patrick Breheny. October 13. z tests The χ 2 -distribution The t-distribution Summary
 Patrick Breheny October 13 Patrick Breheny Biostatistical Methods I (BIOS 5710) 1/25 Introduction Introduction What s wrong with z-tests? So far we ve (thoroughly!) discussed how to carry out hypothesis
PubH 5450 Biostatistics I Prof. Carlin. Lecture 13
 PubH 5450 Biostatistics I Prof. Carlin Lecture 13 Outline Outline Sample Size Counts, Rates and Proportions Part I Sample Size Type I Error and Power Type I error rate: probability of rejecting the null
Smart Home Health Analytics Information Systems University of Maryland Baltimore County
 Smart Home Health Analytics Information Systems University of Maryland Baltimore County 1 IEEE Expert, October 1996 2 Given sample S from all possible examples D Learner L learns hypothesis h based on
Fundamentals to Biostatistics. Prof. Chandan Chakraborty Associate Professor School of Medical Science & Technology IIT Kharagpur
 Fundamentals to Biostatistics Prof. Chandan Chakraborty Associate Professor School of Medical Science & Technology IIT Kharagpur Statistics collection, analysis, interpretation of data development of new
Sampling Distributions: Central Limit Theorem
 Review for Exam 2 Sampling Distributions: Central Limit Theorem Conceptually, we can break up the theorem into three parts: 1. The mean (µ M ) of a population of sample means (M) is equal to the mean (µ)
Section 9.4. Notation. Requirements. Definition. Inferences About Two Means (Matched Pairs) Examples
 Examples") Objective Section 9.4 Inferences About Two Means (Matched Pairs) Compare of two matched-paired means using two samples from each population. Hypothesis Tests and Confidence Intervals of two dependent means
Objective Section 9.4 Inferences About Two Means (Matched Pairs) Compare of two matched-paired means using two samples from each population. Hypothesis Tests and Confidence Intervals of two dependent means
r/lt.i Ml s." ifcr ' W ATI II. The fnncrnl.icniccs of Mr*. John We mil uppn our tcpiiblicnn rcprc Died.
 $ / / - (\ \ - ) # -/ ( - ( [ & - - - - \ - - ( - - - - & - ( ( / - ( \) Q & - - { Q ( - & - ( & q \ ( - ) Q - - # & - - - & - - - $ - 6 - & # - - - & -- - - - & 9 & q - / \ / - - - -)- - ( - - 9 - - -
W i n t e r r e m e m b e r t h e W O O L L E N S. W rite to the M anageress RIDGE LAUNDRY, ST. H E LE N S. A uction Sale.
 > 7? 8 «> ««0? [ -! ««! > - ««>« ------------ - 7 7 7 = - Q9 8 7 ) [ } Q ««
 7 ( - ( - < Q & > & )
  9 Q - -
 Confidence Intervals for the Mean of Non-normal Data Class 23, Jeremy Orloff and Jonathan Bloom
 Confidence Intervals for the Mean of Non-normal Data Class 23, 8.05 Jeremy Orloff and Jonathan Bloom Learning Goals. Be able to derive the formula for conservative normal confidence intervals for the proportion
Statistics. Statistics
 The main aims of statistics 1 1 Choosing a model 2 Estimating its parameter(s) 1 point estimates 2 interval estimates 3 Testing hypotheses Distributions used in statistics: χ 2 n-distribution 2 Let X 1,
CptS 570 Machine Learning School of EECS Washington State University. CptS Machine Learning 1
 CptS 570 Machine Learning School of EECS Washington State University CptS 570 - Machine Learning 1 IEEE Expert, October 1996 CptS 570 - Machine Learning 2 Given sample S from all possible examples D Learner
CHAPTER 10 Comparing Two Populations or Groups
 CHAPTER 10 Comparing Two Populations or Groups 10.1 Comparing Two Proportions The Practice of Statistics, 5th Edition Starnes, Tabor, Yates, Moore Bedford Freeman Worth Publishers Comparing Two Proportions
Probability theory and inference statistics! Dr. Paola Grosso! SNE research group!! (preferred!)!!
!!") Probability theory and inference statistics Dr. Paola Grosso SNE research group p.grosso@uva.nl paola.grosso@os3.nl (preferred) Roadmap Lecture 1: Monday Sep. 22nd Collecting data Presenting data Descriptive
Probability theory and inference statistics Dr. Paola Grosso SNE research group p.grosso@uva.nl paola.grosso@os3.nl (preferred) Roadmap Lecture 1: Monday Sep. 22nd Collecting data Presenting data Descriptive
AP Statistics Ch 12 Inference for Proportions
 Ch 12.1 Inference for a Population Proportion Conditions for Inference The statistic that estimates the parameter p (population proportion) is the sample proportion p ˆ. p ˆ = Count of successes in the
Purposes of Data Analysis. Variables and Samples. Parameters and Statistics. Part 1: Probability Distributions
 Part 1: Probability Distributions Purposes of Data Analysis True Distributions or Relationships in the Earths System Probability Distribution Normal Distribution Student-t Distribution Chi Square Distribution
CHAPTER 10 Comparing Two Populations or Groups
 CHAPTER 10 Comparing Two Populations or Groups 10. Comparing Two Means The Practice of Statistics, 5th Edition Starnes, Tabor, Yates, Moore Bedford Freeman Worth Publishers Comparing Two Means Learning
CHAPTER 10 Comparing Two Populations or Groups
 CHAPTER 10 Comparing Two Populations or Groups 10.2 Comparing Two Means The Practice of Statistics, 5th Edition Starnes, Tabor, Yates, Moore Bedford Freeman Worth Publishers Comparing Two Means Learning
COUNTING ERRORS AND STATISTICS RCT STUDY GUIDE Identify the five general types of radiation measurement errors.
 LEARNING OBJECTIVES: 2.03.01 Identify the five general types of radiation measurement errors. 2.03.02 Describe the effect of each source of error on radiation measurements. 2.03.03 State the two purposes
Dover- Sherborn High School Mathematics Curriculum Probability and Statistics
 Mathematics Curriculum A. DESCRIPTION This is a full year courses designed to introduce students to the basic elements of statistics and probability. Emphasis is placed on understanding terminology and
Review of Statistics 101
 Review of Statistics 101 We review some important themes from the course 1. Introduction Statistics- Set of methods for collecting/analyzing data (the art and science of learning from data). Provides methods
Smoking Habits. Moderate Smokers Heavy Smokers Total. Hypertension No Hypertension Total
 Math 3070. Treibergs Final Exam Name: December 7, 00. In an experiment to see how hypertension is related to smoking habits, the following data was taken on individuals. Test the hypothesis that the proportions
PHP2510: Principles of Biostatistics & Data Analysis. Lecture X: Hypothesis testing. PHP 2510 Lec 10: Hypothesis testing 1
 PHP2510: Principles of Biostatistics & Data Analysis Lecture X: Hypothesis testing PHP 2510 Lec 10: Hypothesis testing 1 In previous lectures we have encountered problems of estimating an unknown population
Introduction to Statistical Data Analysis III
 Introduction to Statistical Data Analysis III JULY 2011 Afsaneh Yazdani Preface Major branches of Statistics: - Descriptive Statistics - Inferential Statistics Preface What is Inferential Statistics? The
Math 3339 Homework 6 (Chapter 7)
") Math 3339 Homework 6 (Chapter 7) Name: PeopleSoft ID: Instructions: Homework will NOT be accepted through email or in person. Homework must be submitted through CourseWare BEFORE the deadline. Print out
Math 3339 Homework 6 (Chapter 7) Name: PeopleSoft ID: Instructions: Homework will NOT be accepted through email or in person. Homework must be submitted through CourseWare BEFORE the deadline. Print out