Technical Manual for the description of the OVERSEER Nutrient Budgets engine ISSN: X. Climate. June Prepared by D M Wheeler
|
|
|
- Paul Moody
- 5 years ago
- Views:
Transcription


1 OVERSEER Technical Manual Technical Manual for the description of the OVERSEER Nutrient Budgets engine ISSN: X Climate June 2018 Prepared by D M Wheeler AgResearch Ltd 2
2 DISCLAIMER: While all reasonable endeavours have been made to ensure the accuracy of the investigations and the information contained in this Technical Manual, OVERSEER Limited gives no warranties, representations or guarantees, express or implied, in relation to the quality, reliability, accuracy or fitness for any particular purpose, of the information, technologies, functionality, services or processes, described in this Technical Manual, nor does it make any warranty or representation that this Technical Manual or any information contained in this Technical Manual is complete, accurate or not misleading. OVERSEER Limited expressly disclaims and assumes no liability contingent or otherwise, that may arise from the use of, or reliance on, this Technical Manual including as a result of but not limited to, any technical or typographical errors or omissions, or any discrepancies between this Technical Manual and OVERSEER Nutrient Budgets. The contents of this Technical Manual may change from time to time without notice at the discretion of OVERSEER Limited. COPYRIGHT: You may copy and use this report and the information contained in it so long as your use does not mislead or deceive anyone as to the information contained in the report and you do not use the report or its contents in connection with any promotion, sales or marketing of any goods or services. Any copies of this report must include this disclaimer in full. Copyright 2018 OVERSEER Limited Published by: OVERSEER Limited OVERSEER is a registered trade mark owned by the OVERSEER owners The OVERSEER owners are: Ministry for Primary Industries (MPI), Fertiliser Association of New Zealand Inc. (FANZ) and AgResearch Ltd (AgResearch). 2
3 Preface OVERSEER Nutrient Budgets OVERSEER Nutrient Budgets (OVERSEER) is a strategic management tool that supports optimal nutrient use on farm for increased profitability and managing within environmental limits. OVERSEER provides users with information to examine the impact of nutrient use and flows within a farm and off-farm losses of nutrients and greenhouse gases. An OVERSEER nutrient budget takes into account inputs and outputs and the key internal recycling of nutrients around the farm. See the OVERSEER website for more detailed information: This technical manual OVERSEER is made up of a user interface and an engine. These two components work together to enable users to generate nutrient budget reports. The Technical Manual provides details of the calculation methods used in the OVERSEER engine. The OVERSEER engine is based on extensive published scientific research. Technical information about the model s development and use can be found in a growing number of conference proceedings and peer-reviewed papers. Given the ongoing upgrades many of the earlier papers no longer reflect the current version. The Technical Manual chapters provide detailed descriptions of the methods used in the OVERSEER engine s main sub-models. The Technical Manual sets out the underlying principles and sources of data used to build the model engine. It is a description of the model as implemented, and hence references may not now be the most appropriate or cover the range of data of information currently available, or may not necessarily be the most up to date. If the source of some information and/or assumptions is not known or could not be found, this is acknowledged. The chapters will continually be updated to reflect the current version. If readers have feedback or further technical information that they consider could contribute to the future development of the model, please provide feedback via the website OVERSEER Nutrient Budgets Technical Manual for the Engine (Version 6.3.0) i
4 Contents 1. Introduction Workings of the technical manual 1 2. Data sources Climate tool Region nearest town Monthly data Data inputs 3 3. Temperature Air temperature Annual mean air temperature Monthly mean air temperature Soil temperatures Precipitation Rainfall Daily rainfall patterns Daily rainfall pattern class Annual rainfall Monthly rainfall Daily rainfall Snow Potential evapotranspiration Data and default values Virtual Climate Network Climate properties OVERSEER Nutrient Budgets Technical Manual for the Engine (Version 6.3.0) ii
5 PET range and seasonality classes Default values Daily PET Ratio PET wet:pet dry Sunshine hours References 32 Appendix 1. Maps of climate data. 33 Appendix 2. Daily rainfall values OVERSEER Nutrient Budgets Technical Manual for the Engine (Version 6.3.0) iii
6 Climate 1. Introduction Climate data such as temperature, rainfall, potential evapotranspiration and sunshine hours are important drivers of processes within OVERSEER. Some of the relationships are shown in Figure 1. Rainfall PET Temperature P loss Drainage DCD effectiveness Growth factor Immobilisation factor Denitrification factor Cation leaching N leaching Other N processes Figure 1. Some of the relationships of processes within OVERSEER with climate data. This chapter outlines how available climate and other data inputs are used to provide the required climate data that is used in other sections of OVERSEER Workings of the technical manual The aim of the technical manual is to provide a level of detail so that users of OVERSEER can clearly see the underlying principles and sources of data used to build the components of the model. This technical chapter is part of a series of technical manuals currently under development to explain the inner working of the OVERSEER engine. In the equations in this manual, units are shown using ( ) and cross-references other equations and sections within this manual or to other chapters of the technical manual are shown using [ ]. Equations with multiple = options are cascading alternatives in the order they are considered. The condition is shown on the right hand side. The variable and parameter names used are generally shortened names of the property, and this naming convention is similar to the convention used in the OVERSEER engine model OVERSEER Nutrient Budgets Technical Manual for the Engine (Version 6.3.0) 1
7 2. Data sources Climate data is entered by either uploading data from a climate database that was derived from the National Institute of Water and Atmospheric Research (NIWA) 0.5 km Virtual Climate Station Network (VCN), or based on entered and selected climate properties Climate tool The original VCN had a grid spacing of 0.05, or approximately 5 km (~11,500 stations). Data and methodology for this grid was described by Tait et al. (2006), Tait and Woods (2007) and Tait (2008). The expansion to 0.5 km grid was described by Tait and Zheng (2007) and Wratt et al. (2006). The 0.5 km VCN was used to compile a database comprising 30-year average annual values of rainfall, air temperature, and potential evapotranspiration (PET) based on the period They were produced by calculating the above 30-year statistics at climate station locations with available data, then interpolating these statistics onto a 500m spatial resolution grid. The database requires a latitude and longitude grid reference. As this is an online database, it is only available when the user is connected to the internet Region nearest town The alternative method of providing climate data is to enter rainfall, and select climate properties as optional inputs. Unless otherwise indicated, data for the default climate properties are based on the mean monthly values for the period for locations having at least five complete years of data (nearest town list) 1. The locations comprise the nearest town and regions in the drop-down list. The region values are the average of the nearest towns in a given region. Since extracting this data, data for the period has been produced 2 but the tables within OVERSEER have not been updated Monthly data Rainfall, PET and temperature can be added as monthly inputs. This facility has been added to enable analysis and testing of research trials by a wider range of researchers, and to enabling modelling where the climate profile does not conform to the default average annual profiles described in this chapter. Rainfall must be entered. All PET and/or temperature fields can be left blank, in which case the defaults are used. Default annual values can be viewed on the Other values report. This option should be used with caution. The model should produce reasonable results in reversed seasons, particularly if advanced inputs are used, but there may be instances where this may not applied. Please check outputs for unusual results. It is not recommended that monthly data for a particularly year is used as inputs. 1 retrieved retrieved OVERSEER Nutrient Budgets Technical Manual for the Engine (Version 6.3.0) 2
8 2.4. Data inputs The inputs for the climate model are: 1) Compulsory a) Daily rainfall pattern (section 4.1.1). 2) Climate input method a) Climate properties (i) Required (ii) Optional Annual rainfall (mm/year). Annual mean temperature ( C). Latitude ( ) and altitude (m). Annual potential evapotranspiration (PET) (mm/year). PET seasonality class (section ). PET range class (section ). Snow (amount and snow type) (section 4.2). b) Climate station tool download: (i) Required (ii) Optional c) Monthly climate inputs (i) Required (ii) Optional Latitude ( ) and longitude ( ). As for a) Climate properties (Annual rainfall, Annual mean temperature and Annual PET fields are populated). Monthly rainfall (mm/year). Monthly mean temperature ( C). Monthly potential evapotranspiration (PET) (mm/year). 3. Temperature 3.1. Air temperature OVERSEER requires estimates of mean annual temperature ( C) and the monthly mean temperature ( C). Temperature factors governing the rate of soil processes such as mineralisation, immobilisation, denitrification, and dicyandiamide (DCD) effectiveness are based on the soil temperature (section 3.2) OVERSEER Nutrient Budgets Technical Manual for the Engine (Version 6.3.0) 3
9 The distribution of mean annual temperatures across New Zealand is shown in Appendix 1. The distribution of mean monthly temperatures for a few selected locations from the data of NIWA (2006) is shown in Figure 2, as an example. As expected, temperatures are lowest in the winter months (June and July), highest in summer (January and February), and tend to decrease the further south the location is Annual mean air temperature Annual mean air temperature ( C) is either entered, downloaded using the Climate station tool, or is estimated as: Equation 1: AnnualTemp = mon(tempmon * Daysmon) / 365 Tempmon is the mean monthly temperature ( C) [section 3.1.2]. Daysmon is the number of days in a month. where entered temperature includes the temperature added from the VCN tool OVERSEER Nutrient Budgets Technical Manual for the Engine (Version 6.3.0) 4
10 Temperature ( C) Kaitaia Palmerston North Christchurch Invercargill Jan Feb Mar Apr May Jun Jul Aug Sep Oct Nov Dec Figure 2. Monthly mean air temperature for four selected locations throughout New Zealand (average of >5 years) Monthly mean air temperature The monthly air temperature ( C) is determined using an annual average temperature that is entered, downloaded using the climate station tool, or a region or nearest town default annual temperature, and a monthly pattern based on region or nearest town, or can be entered using the monthly data option. If monthly values are not entered, monthly temperatures are adjusted so that the annual mean air temperature equals the entered value. The term Lowest was added so that all monthly temperatures moved up or down proportionally and thus the pattern was maintained. If not present, then temperatures below zero become more negative as mean temperature increases. Thus, monthly air temperature ( C) is estimated as: Equation 2: Tempmon = ((EstTempmon - Lowest) * tempadjust) + Lowest EstTemp is the mean temperature before adjustment [Equation 3]. Lowest is the lowest monthly temperature that is less than zero during the year ( C). Tempadjust is decribed in Equation OVERSEER Nutrient Budgets Technical Manual for the Engine (Version 6.3.0) 5
11 and where Equation 3: EstTempmon = LatAltTemp [Equation 5] = TownTempnearesttown, mon nearest town selected = RegionTempregion, mon otherwise TownTemp ( C) is the monthly temperature for the selected nearest town [Table 1]. RegionTemp ( C) is the monthly temperature for the selected region [Table 2]. and where Equation 4: tempadjust = tempin / ( mon(esttempmon Lowest) * DaysInMonthmon) / 365 tempin is the entered annual temperature ( C). EstTemp and Lowest are as in Equation 2. and where entered annual temperature includes the temperature added from the VCN tool. RegionTemp (Table 2) was estimated as the average temperature for each region when each town in Table 1 was assigned a region shown in Table 2. The monthly mean air temperature estimated from latitude and altitude in Equation 5 is based on Zheng and Basher (1996). Equation 5: LatAltTemp = kconstantmon + klatmon * latitude + kaltmon * altitude + kseamon * coast + kseaexpmon * exp (-0.1 * coast) + kregionmon * fregionregion latitude is the entered latitude S ( S) and hence is positive for southern hemisphere. altitude is the entered altitude (m). coast is the entered distance to coast (km). region is the selected region or estimated from nearest town. fregion = 1 for the regions East Coast North Island, Marlborough and Canterbury. = -1 for all other regions. klat, kalt, ksea, kseaexp and kregion are constants [Table 3] OVERSEER Nutrient Budgets Technical Manual for the Engine (Version 6.3.0) 6
12 Table 1. Default monthly mean air temperatures ( C) for each nearest town (NIWA 2006). Nearest town Jan Feb Mar Apr May Jun Jul Aug Sep Oct Nov Dec Kaitaia Whangarei Auckland Tauranga Hamilton Rotorua Gisborne Taupo New Plymouth Rotorua Whanganui Palmerston North Masterton Wellington Nelson Blenheim Westport Kaikoura Hokitika Christchurch Mount Cook Lake Tekapo Timaru Te Anau Queenstown Alexandra Manapouri Dunedin OVERSEER Nutrient Budgets Technical Manual for the Engine (Version 6.3.0) 7
13 Nearest town Jan Feb Mar Apr May Jun Jul Aug Sep Oct Nov Dec Invercargill Chatham Islands Table 2. Default monthly mean air temperatures ( C) for each region. Region Jan Feb Mar Apr May Jun Jul Aug Sep Oct Nov Dec Northland Auckland Waikato/ Coromandel BOP Central Plateau King Country/ Taihape Taranaki Manawatu/ Wanganui Wellington East Coast North Island West Coast South Island Nelson Marlborough Canterbury Otago Southland High Country (> 300 m) OVERSEER Nutrient Budgets Technical Manual for the Engine (Version 6.3.0) 8
14 Table 3. Coefficients for estimating mean monthly temperature (Equation 5) when altitude and latitude are entered. kconstant klat kalt ksea kseaexp kregion January February March April May June July August September October November December OVERSEER Nutrient Budgets Technical Manual for the Engine (Version 6.3.0) 9
15 3.2. Soil temperatures Soil processes such as mineralisation, immobilisation, denitrification and DCD effectiveness are based on the soil temperature at 5 cm or 10 cm depth. The relationship between air temperature and soil temperature was determined using data from NIWA (2006). A regression line was fitted between mean monthly temperature at 9am of the air temperature and 10 cm earth temperatures for the period for locations which had at least 5 years of complete data. This covered the locations listed in Table 1 except for Westport, Kaikoura, Mt Cook, lake Tekapo, Milford Sound, Queenstown, and Manapouri for which earth temperature data was not available. In addition, stations at Karamea, Franz Josef, Hanmer, Twizel and Cromwell had earth temperature but no air temperature data available. The relationship for 10 cm depth earth temperatures is shown in Figure 3. A relationship for 5 cm depth was derived by extrapolation. For a given month, the range in air temperatures between the northern and southern most sites was about 8 C. Thus, monthly soil temperatures are estimated as shown in Equation 6. Equation 6: temp5 = * tempmon temp10 = * tempmon temp is the monthly air temperature ( C) [section 3.1.2]. temp5 is the soil temperature at 5 cm ( C). temp10 is the soil temperature at 10 cm ( C). The regressions shown in Equation 6 indicate that air temperature and soil temperature are similar at about 15 C, and are higher in the soil when air temperatures are greater than 15 C, and lower in the soil when air temperatures are less than 15 C OVERSEER Nutrient Budgets Technical Manual for the Engine (Version 6.3.0) 10
16 Mean 10 cm depth earth temperature ( C) y = x R² = Mean air temperature ( C) Figure 3. Relationship between monthly measured mean air temperature and 10 cm earth temperatures. 4. Precipitation 4.1. Rainfall Rainfall is an important input in to the water balance within the hydrology sub-model (see Hydrology chapter). The hydrology sub-model provides the monthly drainage that drives the N leaching sub-model. However, the wetland and filter strip sub-models require a finer time scale than a monthly time scale. Rutherford et al. (2008) noted that: The ability of filter strips and wetlands to remove or store nutrients is strongly flow dependant. Filter strips only receive inflows during surface runoff. They may trap a substantial fraction of incoming particulates when inflows are moderate, but can be overwhelmed by large flows. Wetlands are fed by re-emerging shallow subsurface flow plus surface flow during rainfall events. They may remove a substantial proportion of the incoming nitrate load during low flows when the soilwater contact times are long. However, as inflow rates increase, surface flow tends to by-pass the active soils and the removal efficiency decreases. Further, Rutherford et al. (2008) adds: An annual time-step is inappropriate for simulating the majority of nutrient removal processes. The most important time scales for the management of nutrient generation, transport and attenuation are hourly-monthly. A daily time step may not capture the fine detail of short-term variations in rainfall and surface runoff. However, hourly or sub-hourly calculations would require extensive input data. A OVERSEER Nutrient Budgets Technical Manual for the Engine (Version 6.3.0) 11
17 weekly or monthly time step may suffice for modelling seepage or spring-fed wetlands, although surface runoff often causes short-term reductions in removal efficiency. A daily time step is a useful compromise. Using this compromise, the hydrology sub-model uses a daily time step, which requires daily rainfall inputs (see section for derivation of data). To simplify inputs, a year-long time series of daily rainfall is provided as an internal database Daily rainfall patterns Rainfall amounts were split into five rainfall range classes (Rutherford et al., 2008) as shown in Table 4. Table 4. Range in mean annual rainfall (mm/year) and description of class for each rainfall range classes. Class Range Description 1 < 731 Dry Moderate Wet Very wet 5 > 5850 Extremely wet The daily precipitation data used for this analysis comes from NIWA s 5 km VCN database (Tait and Woods 2007). The following description has largely been extracted from Rutherford et al. (2008). The typical rainfall time series was identified by searching through all years and all stations within a precipitation region until the year was found whose cumulative frequency distribution of daily rainfall most closely matched the cumulative frequency distribution of all years and all stations within the rainfall region. In other words, for the most representative year, the largest daily rainfall amount would have, for any given day, a probability of exceedance approximately equal to 1/366, and the j th largest rainfall amount would have a probability of exceedance approximately equal to j/366. In practice, the search for the most representative year was limited to 100 randomly chosen stations within each rainfall region to restrict computation time. In order to derive seasonality classes a single-harmonic Fourier series was fitted to the daily rainfall time-series using Equation 7: Equation 7: Ri = C0 + C1 cos(2 i / ) where Ri is the mean rainfall amount on the i th day of the year, and C0, C1, and are fitting parameters. The strength of seasonality is given by the dimensionless ratio C1/C0. The three classes of seasonal variation selected are shown in Table OVERSEER Nutrient Budgets Technical Manual for the Engine (Version 6.3.0) 12
18 Proportion per month Table 5. Rainfall classification based on the strength of seasonal variation in rainfall. Class Range C1/C0 Description 1 < 0.11 None to weak Low 3 > 0.22 Moderate The combination of five rainfall amount classes and three seasonality classes results in a total of 15 rainfall regions. These regions are not necessarily contiguous in geographic space, thus a given rainfall pattern may occur in various disconnected locations across New Zealand. These 15 rainfall regions are capture in the input daily rainfall category. The time series represents a typical year for a given rainfall region. Fifteen daily rainfall patterns are defined using a combination of five annual rainfall range classes and three rainfall seasonal variation classes. The distribution of mean annual rainfall and rainfall seasonality classes across New Zealand are shown in Appendix 1. The daily rainfall for each of the rainfall regions is shown in Appendix 2. The proportion of rainfall that occurs in each month, averaged over the rainfall range classes, is shown in Figure 4. The seasonal variation shown in Figure 4 is not strong relative to the dry season/wet season patterns seen in some parts of the world None to weak Low Moderate Winter drier Jan Feb Mar Apr May Jun Jul Aug Sep Oct Nov Dec Figure 4. Proportion of annual rainfall that occurs each month averaged over the rainfall range classes for each seasonality pattern used in OVERSEER, and for a winter dry site Daily rainfall pattern class Rainfall region class is a compulsory input. When importing older files, or after entering annual rainfall, the default rainfall pattern class is set as shown in Equation OVERSEER Nutrient Budgets Technical Manual for the Engine (Version 6.3.0) 13
19 Equation 8: PatternClass = (3 * (RangeClass 1)) + SeasonalityClass Rangeclass is the rainfall range class corresponding to the rainfall band the entered rainfall is in [Table 4]. SeasonalityClass is rainfall seasonality class [Equation 9]. Rainfall seasonality class is determined as: Equation 9: SeasonalityClass = user selected class = 2 region =10 and topography is hilly = 3 region is Taranaki and coast < 30 = 3 region is Nelson and coast < 30 = 2 region is Otago and coast < 30 = Rainseasonregion otherwise [Table 6]. Once the default is set the rainfall region class remains fixed unless the user changes it. This was because the switch from one rainfall region to another if rainfall was changed can result in an anomaly; a non-consistent change in drainage and hence N leaching because of the daily rainfall pattern. Additional work is required to find more stable patterns. Table 6. Default rainfall seasonality class for each Overseer region Region Rainfall seasonality class Northland 3 Auckland 3 Waikato/Coromandel 3 BOP 2 Central Plateau 2 King Country/Taihape 3 Taranaki 3 Manawatu/Wanganui 2 Wellington 3 East Coast North Island 3 West Coast South Island 2 Nelson 2 Marlborough 2 Canterbury 2 Otago 3 Southland 2 High Country (> 300 m) Annual rainfall Annual rainfall (mm/year) is either entered, downloaded using the Climate station tool, or is estimated as: Equation 10: AnnualRain = monrainmon OVERSEER Nutrient Budgets Technical Manual for the Engine (Version 6.3.0) 14
20 Monthly rainfall Rainmon is the monthly rainfall value (mm/month) [section 4.1.3]. Monthly rainfall (mm/month) is either entered using the monthly data input option, or is estimated as: Equation 11. Rainmon = RainIn * SeasonalRainProprainseason, mon seasonality selected = RainIn * TownRainPropnearesttown, mon nearest town selected = RainIn * RegionRainPropregion, mon otherwise RainIn is the entered annual rainfall (mm/year). SeasonalRainProp values are shown in Table 7. See Equation 13 for definition of rainseason. TownRainProp values are shown in Table 8. RegionRainProp values are shown in OVERSEER Nutrient Budgets Technical Manual for the Engine (Version 6.3.0) 15
21 Table 9. where the proportion of annual rainfall that occurs in each month for each nearest town (TownRainProp, Table 8) was estimated as: Equation 12: TownRainProp = rainmon / rainmon Rainmon is the monthly rainfall for meteorological locations (NIWA 2006). and RegionRainProp ( OVERSEER Nutrient Budgets Technical Manual for the Engine (Version 6.3.0) 16
22 Table 9) was based on regions been assigned to values in Table 8. If the rainfall seasonality class is selected by the user, an additional option of dry winter is included, which is based on pattern for Timaru. RainSeason, which is used to look up Table 7, is estimated as: Equation 13: rainseason = 1 RainSeasonality = 1 = 3 RainSeasonality = 2, South Island = 2 RainSeasonality = 2, North Island = RainSeasonality + 1 otherwise RainSeasonality is the selected rainfall seasonality class OVERSEER Nutrient Budgets Technical Manual for the Engine (Version 6.3.0) 17
23 Table 7. Approximate proportion of annual rainfall that occurs in each month for each seasonality class. Class Jan Feb Mar Apr May Jun Jul Aug Sep Oct Nov Dec Table 8. Approximate proportion of annual rainfall that occurs in each month for each nearest town. Nearest Town Jan Feb Mar Apr May Jun Jul Aug Sep Oct Nov Dec Kaitaia Whangarei Auckland Tauranga Hamilton Rotorua Gisborne Taupo New Plymouth Rotorua Whanganui Palmerston North Masterton Wellington Nelson Blenheim Westport Kaikoura Hokitika OVERSEER Nutrient Budgets Technical Manual for the Engine (Version 6.3.0) 18
24 Nearest Town Jan Feb Mar Apr May Jun Jul Aug Sep Oct Nov Dec Christchurch Mount Cook Lake Tekapo Timaru Te Anau Queenstown Alexandra Manapouri Dunedin Invercargill Chatham Islands OVERSEER Nutrient Budgets Technical Manual for the Engine (Version 6.3.0) 19
25 Table 9. Approximate proportion of annual rainfall that occurs in each month for each Overseer region. Region Jan Feb Mar Apr May Jun Jul Aug Sep Oct Nov Dec Northland Auckland Waikato/ Coromandel BOP Central Plateau King Country/ Taihape Taranaki Manawatu/ Wanganui Wellington East Coast North Island West Coast South Island Nelson Marlborough Canterbury Otago Southland High Country (> 300 m) OVERSEER Nutrient Budgets Technical Manual for the Engine (Version 6.3.0) 20
26 Daily rainfall Daily rainfall (mm/day) is used in the daily soil water balance sub-model (see Hydrology chapter) and is calculated in Equation 14 as: Equation 14: DailyRain = RepDailyRainjdate, RainCat * rainadjust jdate is the day of the year. raincat is the selected daily rainfall pattern (1-15) [ section ]. and where rainfall adjustment factor is estimated as: Equation 15: rainadjust = MonRainmon / daydailyrainday MonRain is the monthly rainfall (mm/month) [section 4.1.3]. day is days of year that occur in month mon Snow Snow is converted to rainfall equivalents based on snow type using the conversion rate shown in Table 10. OVERSEER assumes that snow melts in the month that it falls, and that snow or ice cover has no effect on runoff from subsequent rainfall events. This may result in anomalous results when snowmelt contributes directly to runoff. OVERSEER has not been designed to work in areas that have a permanent snow cover over winter followed by a spring thaw. Snowmelt is used to estimate daily soil water in the hydrology sub-model (see Hydrology chapter). As the exact timing of the snowfall is unknown, rainfall equivalents are distributed evenly over the month. Note that if snowfall has been included in the entered rainfall value, then snowfall should not be entered. The rainfall data uploaded from the VCN database includes snowfall. Currently snowfall as a separate input is only applied to pastoral and cut and carry blocks. Thus, daily rainfall equivalents from snowmelt (mm/day) are estimated as: Equation 16: snowmeltday = ratemon * snowconversion / DaysInMonthmon rate is the entered rate of snowfall (cm/month). snowconversion converts snow to rainfall based on entered snow type (mm/cm snow) [Table 10] OVERSEER Nutrient Budgets Technical Manual for the Engine (Version 6.3.0) 21
27 Table 10. Conversion rates for different snow types. Snow type Conversion (mm rainfall per cm snow) Ratio rain:snow Powder/dry 0.4 1:25 Average 1.0 1:10 Wet/heavy 1.3 1: Potential evapotranspiration Potential evapotranspiration (PET) is used in the daily soil water sub-model as outlined in the Hydrology chapter as a component of the water balance. The PET is defined as the PET when wet/dry days are accounted for Data and default values Virtual Climate Network The PET values (mm/year) for the 0.5 km grid can be uploaded from the VCN tool. Tait and Woods (2007) reported that PET was based on the following records: "There are several climate stations around New Zealand that have no wind measurements, meaning that Penman PET cannot be calculated. At many of these stations, however, a calculation of PET is made using the Priestley Taylor formulas (Priestley and Taylor 1972). This calculation requires the same input variables as the Penman formulas, with the exception of wind [and water pressure]. Further, at still more stations where no PET calculation can be made at all, due to no sunshine or solar radiation measurements, for example, there are records of raised pan evaporation measurements." Additionally, they added that: Maximum use is made of observational data by combining both Penman and Priestley Taylor PET calculations and raised pan evaporation measurements. They made the following caution: An analysis of the interpolation error using 20 validation sites shows that the average rootmean-square error varies between about 1 mm in the summer months to about 0.4 mm in winter. It is advised that interpolated data for areas above 500m elevation should be used with caution, however, due to the paucity of input data from high-elevation sites Climate properties If the climate properties option is selected, PET is determined from the selected range and seasonality class, or from default classes based on region. In monthly data input method is used but no PET data is entered, then default values are used OVERSEER Nutrient Budgets Technical Manual for the Engine (Version 6.3.0) 22
28 PET range and seasonality classes The following information is a summary of the approach described in Rutherford et al. (2008). Daily time series of potential PET are provided for different PET regions. The PET regions are defined by the mean annual PET amount and the seasonal variation of PET. Mean annual PET is divided into five classes as shown in Table 11. Table 11. Classification of mean annual PET range. Class Range (mm/year) Description 1 < 501 Low Low-moderate Moderate Moderate-high 5 > 951 High The seasonal variation is classified by the strength of the seasonal PET signal. The seasonal signal for a given location is calculated by fitting a single-harmonic Fourier series to the mean daily PET using Equation 17: Equation 17: PETi = C0 + C1 cos(2 i / ) PETi is the mean PET amount on the i th day of the year. C0, C1, and are fitting parameters. The strength of seasonality is given by the dimensionless ratio C1/C0 and is divided into three classes as shown in Table 12. Table 12. PET seasonality classification based on the strength of seasonal variation in PET in dry conditions. Class Range C1/C0 Description 1 < 0.8 Low Moderate 3 > 1.0 High The distribution of mean annual potential evapotranspiration across New Zealand is shown in Appendix 1. This is shown to indicate the range and distribution of mean potential evapotranspiration found in New Zealand, and is also displayed on the interface as a user reference Default values Default values for PET and seasonality classes are estimated as shown in Equation 18 and Equation OVERSEER Nutrient Budgets Technical Manual for the Engine (Version 6.3.0) 23
29 Equation 18: PETrangeclass = range class for entered PET value = user selected class = 3 region =14 and topography not flat. = PETrangeregion otherwise [Table 13]. Equation 19: PETseasonclass = user selected class = PETseasonregion otherwise [Table 13]. Table 13. Default PET climate factors for each Overseer region Region PET range class 1 PET seasonality class 2 Northland 4 1 Auckland 5 1 Waikato/Coromandel 4 1 BOP 4 2 Central Plateau 3 2 King Country/Taihape 3 2 Taranaki 4 1 Manawatu/Wanganui 4 2 Wellington 4 2 East Coast North Island 4 2 West Coast South Island 3 2 Nelson 4 2 Marlborough 4 2 Canterbury 4 2 Otago 3 2 Southland 3 2 High Country (> 300 m) see Table 11 for definition. 2 see Table 12 for definition Daily PET Typically, PET is lower on wet days than dry days (Rutherford et al., 2008). The reduction in PET is a result of rainfall and cloud cover reducing evaporative and transpiration demand. It is probable that this effect is lower when daily rainfall is low, as these probably indicates showers with fine periods. Therefore, the difference between wet and dry days was scaled arbitrarily between 0 and 5 mm daily rainfall. Daily PET (mm/day) on wet and dry days is calculated using a Fourier series transformation using a parameter set for each PET range and seasonality class (Rutherford et al., 2008). Because each PET range class spans a large range in PET (Table 11), the daily PET amounts can be scaled so that the total annual PET of the regional time series equals the total annual PET at the farm. If monthly values are entered then daily PET (mm/day) is estimated as: Equation 20: dailypet = avdailypet * frain OVERSEER Nutrient Budgets Technical Manual for the Engine (Version 6.3.0) 24
30 where the average daily PET for a given month is estimated as: Equation 21: avdailypet = PETmon / DaysInMonthmon PET is the entered monthly PET (mm/month). and the adjustment (frain) for water added (rainfall plus irrigation) is 1 if no water is added, or is ratiowetdrymon if more than 5 mm/day of water is added, or is estimated as: Equation 22: frain = (1 - ((1 - ratiowetdrymon) /5 * wadded)) ratiowetdry is the ratio of PET between wet and dry days (section 5.3). wadded is daily rainfall plus irrigation (mm/day). Otherwise, daily PET (mm/day) is calculated in Equation 23 as: Equation 23: dailypet = daypet * PETadjust daypet is daily PET as described below (mm/day). and where the PET adjustment factor is estimated as: Equation 24: PETadjust = PETIn / daydaypet0day PETIn is the entered or Climate station tool downloaded annual PET (mm/year). daypet0 is daypet when daily input is zero. Unadjusted daily PET is the PET on wet or dry days where the difference between wet and dry days was scaled between 0 and 5 mm daily rainfall. PETDry and PETWet are estimated using a Fourier series transformation. Sometimes the Fourier series transformation results in PET on dry days being lower than that of wet days in the middle of winter. This is probably not true of the underlying data (Rutherford et al., 2008) and hence a constraint is included in Equation 25. Equation 25: daypet = PETwet * ratiowetdrymon if PETDry < PETWet = PETwet daily rainfall > 5 mm = PETDry fwet otherwise PETwet is the daypet when more than 5 mm/day of rainfall occurs [Equation 26]. PETdry is the PET when there is no daily rainfall [Equation 27]. fwet (mm/day) is an adjustment to PETDry when daily rainfall is between 0 and 5 mm/day [Equation 28]. ratiowetdry is described in section 5.3. where PET on wet and dry days (mm/day) is estimated as: Equation 26: PETWet = PETFourierCatPET, SeaPET, 1 + PETFourierCatPET, SeaPET, 2 * Cos(2 * - PETFourierCatPET, SeaPET, 3) + PETFourierCatPET, SeaPET, 4 * Cos(4 * - PETFourierCatPET, SeaPET, 5) Equation 27: PETDry = PETFourierCatPET, SeaPET, 6 + PETFourierCatPET, SeaPET,7 * Cos(2 * - PETFourierCatPET, SeaPET, 8) + PETFourierCatPET, SeaPET, 9 * Cos(4 * - PETFourierCatPET, SeaPET, 10) OVERSEER Nutrient Budgets Technical Manual for the Engine (Version 6.3.0) 25
31 PETFourier are parameters listed in Table 14. CatPET is the PET range class [Table 11]. SeaPET is the PET seasonality class [Table 12] refer to constant numbers in Table 14. = Pi * jdate / 365 jdate is the day of the year (Jan 1 st = 1). and where adjustment (mm/day) to PETDry when daily rainfall is between 0 and 5 mm/day is estimated as: Equation 28: fwet = rainin / 5 * (PETDry - PETWet) rainin is daily rainfall (mm/day) OVERSEER Nutrient Budgets Technical Manual for the Engine (Version 6.3.0) 26
32 Table 14. Parameters for Fourier series transformation for calculating PET in wet or dry conditions. Category Seasonality Wet Dry class 1 class = category for PET range (Table 11). 2 = category for PET seasonality (Table 12) OVERSEER Nutrient Budgets Technical Manual for the Engine (Version 6.3.0) 27
33 Ratio PET wet:pet dry 5.3. Ratio PET wet:pet dry The climate properties method accounted for differences in PET between wet and dry days. The variation in the ratio of PEwet:PETdry was investigated using the Fourier series output for the mid-day of each month (Figure 5) Day of year Figure 5. The ratio of PET wet to PET dry based on Fourier series transformation. Each line represents a combination or PET range class and PET seasonality class. The range in values was considered sufficiently narrow that an average value could be used, with the values shown in Table 15. Table 15. Average ratio of PET wet:pet dry for each month. Month Ratio PET wet:pet dry January February March April May 1 June 1 July August September October November December Sunshine hours Sunshine hours are used in one of the growth sub-models. The sunshine data inputs are mean monthly values of total bright sunshine hours for the period for locations having at OVERSEER Nutrient Budgets Technical Manual for the Engine (Version 6.3.0) 28
34 least five complete years of data (NIWA 2006). The monthly values of bright sunshine hours are taken from Table 16 if nearest town is entered, otherwise it is taken from Table OVERSEER Nutrient Budgets Technical Manual for the Engine (Version 6.3.0) 29
35 Table 16. Default monthly sunshine hours (hours/month) for each nearest town. Jan Feb Mar Apr May Jun Jul Aug Sep Oct Nov Dec Kaitaia Whangarei Auckland Tauranga Hamilton Rotorua Gisborne Taupo New Plymouth Napier Whanganui Palmerston North Masterton Wellington Nelson Blenheim Westport Kaikoura Hokitika Christchurch Mount Cook Lake Tekapo Timaru Te Anau Queenstown Alexandra Manapouri Dunedin OVERSEER Nutrient Budgets Technical Manual for the Engine (Version 6.3.0) 30
36 Jan Feb Mar Apr May Jun Jul Aug Sep Oct Nov Dec Invercargill Chatham Islands Table 17. Default monthly sunshine hours (hours/month) for each region. Region Jan Feb Mar Apr May Jun Jul Aug Sep Oct Nov Dec Northland Auckland Waikato/ Coromandel BOP Central Plateau King Country/ Taihape Taranaki Manawatu/ Wanganui Wellington East Coast North Island West Coast South Island Nelson Marlborough Canterbury Otago Southland High Country > 300 m) OVERSEER Nutrient Budgets Technical Manual for the Engine (Version 6.3.0) 31
37 7. References NIWA Excel spreadsheets containing mean monthly values for the period for locations having at least 5 complete years of data. Rutherford K, McKergow L, Rupp D 2008 Nutrient attenuation and hydrology modules for Overseer NIWA Client Report: HAM pages. Tait A Future projections of growing degree days and frost in New Zealand and some implications for grape growing. Weather and Climate 28: Tait A, Henderson R D, Turner R, and Zheng X Thin plate smoothing spline interpolation of daily rainfall for New Zealand using a climatological rainfall surface. International Journal of Climatology 26: Tait A and Woods R A Spatial interpolation of daily potential evapotranspiration for New Zealand using a spline model. Journal of Hydrometeorology 8: Tait A and Zheng X Analysis of the spatial interpolation error associated with maps of median annual climate variables. NIWA report available from NIWA Climate Mapping webpage). Wratt D, Tait A, Griffiths G, Espie P, Jessen M, Keys J, Ladd M, Lew D, Lowther W, Lynn I, Mitchell N, Morton J, Reid J, Reid S, Richardson A, Sansom J and Shankar U Climate for crops: Integrating climate data with information about soils and crop requirements to reduce risks in agricultural decision-making. Meteorological Applications 13: Zheng X and Basher R E Spatial modelling of New Zealand temperature normals. International Journal of Climatology 16: OVERSEER Technical Manual for the Engine model (Version 6.3.0) 32

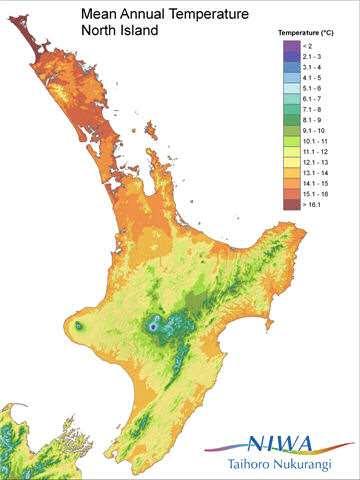
38 Appendix 1. Maps of climate data. Figure 6. Maps of distribution of annual mean temperature in New Zealand OVERSEER Nutrient Budgets Technical Manual for the Engine (Version 6.3.0) 33
39 Figure 7. Maps of distribution of annual average rainfall in New Zealand OVERSEER Nutrient Budgets Technical Manual for the Engine (Version 6.3.0) 34
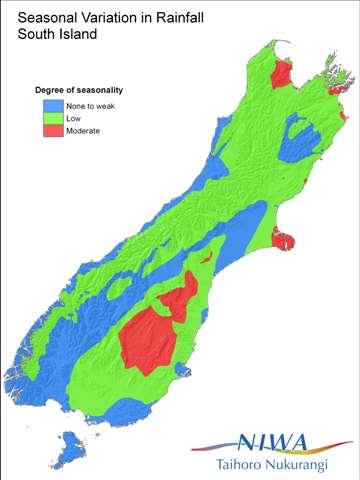
40 Figure 8. Maps of distribution of seasonality of rainfall in New Zealand OVERSEER Nutrient Budgets Technical Manual for the Engine (Version 6.3.0) 35
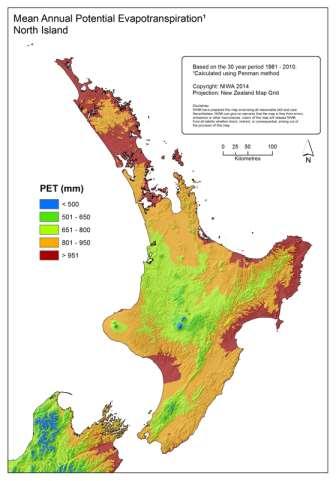
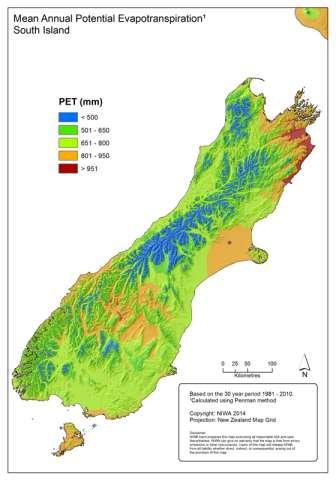
41 Figure 9. Maps of distribution of annual PET values in New Zealand OVERSEER Nutrient Budgets Technical Manual for the Engine (Version 6.3.0) 36
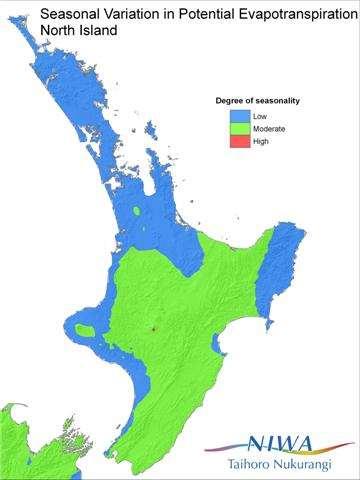
42 Figure 10. Maps of distribution of seasonality of PET in New Zealand OVERSEER Nutrient Budgets Technical Manual for the Engine (Version 6.3.0) 37
NEW ZEALAND WEATHER. BRIEF REVIEW OF THE WEATHER WINTER 1989 (Fig. 1) MONTHLY HIGHLIGHTS JUNE-AUGUST Weather and Climate (1990) 10: 27-31
 MONTHLY HIGHLIGHTS JUNE-AUGUST Weather and Climate (1990) 10: 27-31") Weather and Climate (1990) 10: 27-31 27 NEW ZEALAND WEATHER BRIEF REVIEW OF THE WEATHER (Fig. 1) WARMER THAN USUAL This was the third warmer than normal winter in a row, but not as warm as those of 1987
Weather and Climate (1990) 10: 27-31 27 NEW ZEALAND WEATHER BRIEF REVIEW OF THE WEATHER (Fig. 1) WARMER THAN USUAL This was the third warmer than normal winter in a row, but not as warm as those of 1987
NEW ZEALAND WEATHER. BRIEF REVIEW OF THE WEATHER WINTER 1991 (Fig. 1) CONTRASTING RAINFALL, COLD IN THE SOUTH-WEST OF THE SOUTH ISLAND
 CONTRASTING RAINFALL, COLD IN THE SOUTH-WEST OF THE SOUTH ISLAND") Weather and Climate (1992) 12: 47-52 47 NEW ZEALAND WEATHER BRIEF REVIEW OF THE WEATHER (Fig. 1) CONTRASTING RAINFALL, COLD IN THE SOUTH-WEST OF THE SOUTH ISLAND An El Nino event (negative phase of the
Weather and Climate (1992) 12: 47-52 47 NEW ZEALAND WEATHER BRIEF REVIEW OF THE WEATHER (Fig. 1) CONTRASTING RAINFALL, COLD IN THE SOUTH-WEST OF THE SOUTH ISLAND An El Nino event (negative phase of the
NEW ZEALAND WEATHER. BRIEF REVIEW OF WINTER AND SPRING 1990 WINTER 1990 (Fig. 1) Weather and Climate (1991) 11: 31-36
 Weather and Climate (1991) 11: 31-36") Weather and Climate (1991) 11: 31-36 31 NEW ZEALAND WEATHER BRIEF REVIEW OF WINTER AND SPRING 1990 WINTER 1990 (Fig. 1) Winter 1990 was very dry in the far south. Northeasterlies brought sunny conditions
Weather and Climate (1991) 11: 31-36 31 NEW ZEALAND WEATHER BRIEF REVIEW OF WINTER AND SPRING 1990 WINTER 1990 (Fig. 1) Winter 1990 was very dry in the far south. Northeasterlies brought sunny conditions
New Zealand Climate Update No 222, November 2017 Current climate November 2017
 New Zealand Climate Update No 222, November 2017 Current climate November 2017 November 2017 was characterised by higher than normal sea level pressure over New Zealand and the surrounding seas, particularly
New Zealand Climate Update No 221, October 2017 Current climate October 2017
 New Zealand Climate Update No 221, October 2017 Current climate October 2017 October 2017 was characterised by higher than normal sea level pressure over New Zealand and the surrounding seas. This consistent
Chiang Rai Province CC Threat overview AAS1109 Mekong ARCC
 Chiang Rai Province CC Threat overview AAS1109 Mekong ARCC This threat overview relies on projections of future climate change in the Mekong Basin for the period 2045-2069 compared to a baseline of 1980-2005.
NIWA Outlook: October - December 2015
 October December 2015 Issued: 1 October 2015 Hold mouse over links and press ctrl + left click to jump to the information you require: Overview Regional predictions for the next three months: Northland,
Damaging Wind Gust Index. Prepared for Ministry for the Environment
 Damaging Wind Gust Index Prepared for Ministry for the Environment March 2017 Prepared by: Gregor Macara For any information regarding this report please contact: Gregor Macara Climate Scientist, Climate
A warm, sunny and very dry month for most of the country.
 New Zealand Climate Summary: January 2015 Issued: 3 February 2015 A warm, sunny and very dry month for most of the country. Rainfall Soil Moisture Temperature Sunshine Rainfall was well below normal (
Inflow Forecasting for Hydro Catchments. Ross Woods and Alistair McKerchar NIWA Christchurch
 Inflow Forecasting for Hydro Catchments Ross Woods and Alistair McKerchar NIWA Christchurch Inflows Water flowing into hydro storages Usually measured by monitoring the levels and outflows from hydro storages
Variability of Reference Evapotranspiration Across Nebraska
 Know how. Know now. EC733 Variability of Reference Evapotranspiration Across Nebraska Suat Irmak, Extension Soil and Water Resources and Irrigation Specialist Kari E. Skaggs, Research Associate, Biological
NIWA Outlook: March-May 2015
 March May 2015 Issued: 27 February 2015 Hold mouse over links and press ctrl + left click to jump to the information you require: Overview Regional predictions for the next three months: Northland, Auckland,
Technical Note: Hydrology of the Lake Chilwa wetland, Malawi
 Technical Note: Hydrology of the Lake Chilwa wetland, Malawi Matthew McCartney June 27 Description Lake Chilwa is located in the Southern region of Malawi on the country s eastern boarder with Mozambique
A dry month for much of New Zealand
 New Zealand Climate Summary: October 2018 Issued: 6 November 2018 A dry month for much of New Zealand Temperature Mean temperatures for October were near average (-0.50 to +0.50 C) for nearly all locations
NEW ZEALAND WEATHER. BRIEF REVIEW OF THE WEATHER WINTER 1988 (Fig. 1)
") Weather and Climate (1989) 9: 29-36 29 NEW ZEALAND WEATHER BRIEF REVIEW OF THE WEATHER WINTER 1988 (Fig. 1) Rainfall for winter was above normal in central highcountry regions of the North Island, Wanganui,
Weather and Climate (1989) 9: 29-36 29 NEW ZEALAND WEATHER BRIEF REVIEW OF THE WEATHER WINTER 1988 (Fig. 1) Rainfall for winter was above normal in central highcountry regions of the North Island, Wanganui,
NIWA Outlook: September October November 2013
 September-November 2013 Issued: 30 August 2013 Hold mouse over links and press ctrl + left click to jump to the information you require: Overview Regional predictions for the next three months: Northland,
The Climate of Bryan County
 The Climate of Bryan County Bryan County is part of the Crosstimbers throughout most of the county. The extreme eastern portions of Bryan County are part of the Cypress Swamp and Forest. Average annual
The Climate of Marshall County
 The Climate of Marshall County Marshall County is part of the Crosstimbers. This region is a transition region from the Central Great Plains to the more irregular terrain of southeastern Oklahoma. Average
The Climate of Payne County
 The Climate of Payne County Payne County is part of the Central Great Plains in the west, encompassing some of the best agricultural land in Oklahoma. Payne County is also part of the Crosstimbers in the
The Climate of Haskell County
 The Climate of Haskell County Haskell County is part of the Hardwood Forest. The Hardwood Forest is characterized by its irregular landscape and the largest lake in Oklahoma, Lake Eufaula. Average annual
Changing Hydrology under a Changing Climate for a Coastal Plain Watershed
 Changing Hydrology under a Changing Climate for a Coastal Plain Watershed David Bosch USDA-ARS, Tifton, GA Jeff Arnold ARS Temple, TX and Peter Allen Baylor University, TX SEWRU Objectives 1. Project changes
Table 1 - Infiltration Rates
 Stantec Consulting Ltd. 100-300 Hagey Boulevard, Waterloo ON N2L 0A4 November 14, 2017 File: 161413228/10 Attention: Mr. Michael Witmer, BES, MPA, MCIP, RPP City of Guelph 1 Carden Street Guelph ON N1H
PRELIMINARY DRAFT FOR DISCUSSION PURPOSES
 Memorandum To: David Thompson From: John Haapala CC: Dan McDonald Bob Montgomery Date: February 24, 2003 File #: 1003551 Re: Lake Wenatchee Historic Water Levels, Operation Model, and Flood Operation This
The Climate of Pontotoc County
 The Climate of Pontotoc County Pontotoc County is part of the Crosstimbers. This region is a transition region from the Central Great Plains to the more irregular terrain of southeast Oklahoma. Average
The Climate of Texas County
 The Climate of Texas County Texas County is part of the Western High Plains in the north and west and the Southwestern Tablelands in the east. The Western High Plains are characterized by abundant cropland
Promoting Rainwater Harvesting in Caribbean Small Island Developing States Water Availability Mapping for Grenada Preliminary findings
 Promoting Rainwater Harvesting in Caribbean Small Island Developing States Water Availability Mapping for Grenada Preliminary findings National Workshop Pilot Project funded by The United Nations Environment
The Climate of Kiowa County
 The Climate of Kiowa County Kiowa County is part of the Central Great Plains, encompassing some of the best agricultural land in Oklahoma. Average annual precipitation ranges from about 24 inches in northwestern
A dry end to winter for much of the South Island
 New Zealand Climate Summary: August 2018 Issued: 4 September 2018 A dry end to winter for much of the South Island Temperature Rainfall Soil Moisture Mean temperatures were above average (+0.51 C to +1.20
Warmest August on record for NZ. Dry in many parts; wet in the east and north of the North Island.
 National Climate Summary: August 2013 Issued: 3 September 2013 Warmest August on record for NZ. Dry in many parts; wet in the east and north of the North Island. Temperature Rainfall Sunshine Soil moisture
A Report on a Statistical Model to Forecast Seasonal Inflows to Cowichan Lake
 A Report on a Statistical Model to Forecast Seasonal Inflows to Cowichan Lake Prepared by: Allan Chapman, MSc, PGeo Hydrologist, Chapman Geoscience Ltd., and Former Head, BC River Forecast Centre Victoria
NIWA Outlook: April June 2019
 April June 2019 Issued: 28 March 2019 Hold mouse over links and press ctrl + left click to jump to the information you require: Outlook Summary Regional predictions for the next three months Northland,
The Climate of Murray County
 The Climate of Murray County Murray County is part of the Crosstimbers. This region is a transition between prairies and the mountains of southeastern Oklahoma. Average annual precipitation ranges from
New Zealand Climate Update No 226, April 2018 Current climate March 2018
 New Zealand Climate Update No 226, April 2018 Current climate March 2018 March 2018 was characterised by significantly higher pressure than normal to the east of New Zealand. This pressure pattern, in
CATCHMENT DESCRIPTION. Little River Catchment Management Plan Stage I Report Climate 4.0
 CATCHMENT DESCRIPTION Little River Catchment Management Plan Stage I Report Climate 4. Little River Catchment Management Plan Stage I Report Climate 4.1 4. CLIMATE 4.1 INTRODUCTION Climate is one of the
Percentage of normal rainfall for April 2018 Departure from average air temperature for April 2018
 New Zealand Climate Update No 227, May 2018 Current climate April 2018 Overall, April 2018 was characterised by lower pressure than normal over and to the southeast of New Zealand. Unlike the first three
The Climate of Grady County
 The Climate of Grady County Grady County is part of the Central Great Plains, encompassing some of the best agricultural land in Oklahoma. Average annual precipitation ranges from about 33 inches in northern
The Climate of Seminole County
 The Climate of Seminole County Seminole County is part of the Crosstimbers. This region is a transition region from the Central Great Plains to the more irregular terrain of southeastern Oklahoma. Average
Technical Note: Hydrology of the Lukanga Swamp, Zambia
 Technical Note: Hydrology of the Lukanga Swamp, Zambia Matthew McCartney July 7 Description The Lukanga swamp is located approximately 5km west of the city of Kabwe, in the Central province of Zambia,
Lake Tahoe Watershed Model. Lessons Learned through the Model Development Process
 Lake Tahoe Watershed Model Lessons Learned through the Model Development Process Presentation Outline Discussion of Project Objectives Model Configuration/Special Considerations Data and Research Integration
Percentage of normal rainfall for August 2017 Departure from average air temperature for August 2017
 New Zealand Climate Update No 219, August 2017 Current climate August 2017 Overall, mean sea level pressure was lower than normal over and to the west of New Zealand during August while higher than normal
Geostatistical Analysis of Rainfall Temperature and Evaporation Data of Owerri for Ten Years
 Atmospheric and Climate Sciences, 2012, 2, 196-205 http://dx.doi.org/10.4236/acs.2012.22020 Published Online April 2012 (http://www.scirp.org/journal/acs) Geostatistical Analysis of Rainfall Temperature
GovHack APIs from MetService
 GovHack s from MetService Introduction The MetService for the GovHack NZ event consists of a subset of weather data that has been exposed via a test created specifically for GovHack NZ. This will be made
4. THE HBV MODEL APPLICATION TO THE KASARI CATCHMENT
 Application of HBV model to the Kasari River, 1994 Page 1 of 6 Application of the HBV model to the Kasari river for flow modulation of catchments characterised by specific underlying features by R. Vedom,
Interannual variation of MODIS NDVI in Lake Taihu and its relation to climate in submerged macrophyte region
 Yale-NUIST Center on Atmospheric Environment Interannual variation of MODIS NDVI in Lake Taihu and its relation to climate in submerged macrophyte region ZhangZhen 2015.07.10 1 Outline Introduction Data
Jude Wilson & Susanne Becken Lincoln University
 Jude Wilson & Susanne Becken Lincoln University Outline Research context Interaction of climate, weather & tourism Marketing climate Research objectives Method Archive analysis > RTO analysis Results Implications
Near average temperatures for most of the country.
 New Zealand Climate Summary: Spring 2014 Issued: 5 December 2014 Near average temperatures for most of the country. Temperature Rainfall Sunshine Soil moisture Spring temperatures were near average (-0.50
Summary report for Ruamāhanga Whaitua Committee The climate of the Ruamāhanga catchment
 Summary report for Ruamāhanga Whaitua Committee The climate of the Ruamāhanga catchment The Tararua and Rimutaka ranges have a large influence on the climate of the Ruamāhanga catchment. The ranges shelter
Highly variable rainfall but plenty of sunshine
 National Climate Summary: August 2014 Issued: 4 September 2014 Highly variable rainfall but plenty of sunshine Rainfall Sunshine Temperature Soil Moisture August rainfall was wide ranging. Above normal
The Climate of Oregon Climate Zone 5 High Plateau
 105 E55 Unbound issue i". 9 13oes not circulate CZe Special Report 917 May 1993 The Climate of Oregon Climate Zone 5 Property of OREGON STATE UNIVERSITY Library Serials Corvallis, OR 97331-4503 Agricultural
Dependence of evaporation on meteorological variables at di erent time-scales and intercomparison of estimation methods
 Hydrological Processes Hydrol. Process. 12, 429±442 (1998) Dependence of evaporation on meteorological variables at di erent time-scales and intercomparison of estimation methods C.-Y. Xu 1 and V.P. Singh
January 25, Summary
 January 25, 2013 Summary Precipitation since the December 17, 2012, Drought Update has been slightly below average in parts of central and northern Illinois and above average in southern Illinois. Soil
PLANNED UPGRADE OF NIWA S HIGH INTENSITY RAINFALL DESIGN SYSTEM (HIRDS)
") PLANNED UPGRADE OF NIWA S HIGH INTENSITY RAINFALL DESIGN SYSTEM (HIRDS) G.A. Horrell, C.P. Pearson National Institute of Water and Atmospheric Research (NIWA), Christchurch, New Zealand ABSTRACT Statistics
PLANNED UPGRADE OF NIWA S HIGH INTENSITY RAINFALL DESIGN SYSTEM (HIRDS) G.A. Horrell, C.P. Pearson National Institute of Water and Atmospheric Research (NIWA), Christchurch, New Zealand ABSTRACT Statistics
Drought in Southeast Colorado
 Drought in Southeast Colorado Nolan Doesken and Roger Pielke, Sr. Colorado Climate Center Prepared by Tara Green and Odie Bliss http://climate.atmos.colostate.edu 1 Historical Perspective on Drought Tourism
New Zealand Climate Update No 223, January 2018 Current climate December 2017
 New Zealand Climate Update No 223, January 2018 Current climate December 2017 December 2017 was characterised by higher than normal sea level pressure over New Zealand and the surrounding seas. This pressure
Local Ctimatotogical Data Summary White Hall, Illinois
 SWS Miscellaneous Publication 98-5 STATE OF ILLINOIS DEPARTMENT OF ENERGY AND NATURAL RESOURCES Local Ctimatotogical Data Summary White Hall, Illinois 1901-1990 by Audrey A. Bryan and Wayne Armstrong Illinois
Appendix C. AMEC Evaluation of Zuni PPIW. Appendix C. Page C-1 of 34
 AMEC s Independent Estimate of PPIW Crop Water Use Using the ASCE Standardized Reference Evapotranspiration via Gridded Meteorological Data, and Estimation of Crop Coefficients, and Net Annual Diversions
2015 Fall Conditions Report
 2015 Fall Conditions Report Prepared by: Hydrologic Forecast Centre Date: December 21 st, 2015 Table of Contents Table of Figures... ii EXECUTIVE SUMMARY... 1 BACKGROUND... 2 SUMMER AND FALL PRECIPITATION...
CHAPTER-11 CLIMATE AND RAINFALL
 CHAPTER-11 CLIMATE AND RAINFALL 2.1 Climate Climate in a narrow sense is usually defined as the "average weather", or more rigorously, as the statistical description in terms of the mean and variability
Jackson County 2013 Weather Data
 Jackson County 2013 Weather Data 61 Years of Weather Data Recorded at the UF/IFAS Marianna North Florida Research and Education Center Doug Mayo Jackson County Extension Director 1952-2008 Rainfall Data
Global Climates. Name Date
 Global Climates Name Date No investigation of the atmosphere is complete without examining the global distribution of the major atmospheric elements and the impact that humans have on weather and climate.
New Zealand s 3 rd -warmest summer on record
 New Zealand Climate Summary: Summer 2018-19 Issued: 5 March 2019 New Zealand s 3 rd -warmest summer on record Temperature It was New Zealand s 3 rd -warmest summer on record. Temperatures across the country
Regional Climate Change: Current Impacts and Perspectives Greater Lake Nipissing Stewardship Council Annual Meeting Wednesday April 16, 2014
 Regional Climate Change: Current Impacts and Perspectives Greater Lake Nipissing Stewardship Council Annual Meeting Wednesday April 16, 2014 Speaker: Peter Bullock, Stantec Consulting Information Source:
Climate also has a large influence on how local ecosystems have evolved and how we interact with them.
 The Mississippi River in a Changing Climate By Paul Lehman, P.Eng., General Manager Mississippi Valley Conservation (This article originally appeared in the Mississippi Lakes Association s 212 Mississippi
Analysis of Rainfall and Other Weather Parameters under Climatic Variability of Parbhani ( )
") International Journal of Current Microbiology and Applied Sciences ISSN: 2319-7706 Volume 7 Number 06 (2018) Journal homepage: http://www.ijcmas.com Original Research Article https://doi.org/10.20546/ijcmas.2018.706.295
International Journal of Current Microbiology and Applied Sciences ISSN: 2319-7706 Volume 7 Number 06 (2018) Journal homepage: http://www.ijcmas.com Original Research Article https://doi.org/10.20546/ijcmas.2018.706.295
Investigation IV: Seasonal Precipitation and Seasonal Surface Runoff in the US
 Investigation IV: Seasonal Precipitation and Seasonal Surface Runoff in the US Purpose Students will consider the seasonality of precipitation and surface runoff and think about how the time of year can
8.1 Attachment 1: Ambient Weather Conditions at Jervoise Bay, Cockburn Sound
 8.1 Attachment 1: Ambient Weather Conditions at Jervoise Bay, Cockburn Sound Cockburn Sound is 20km south of the Perth-Fremantle area and has two features that are unique along Perth s metropolitan coast
ANALYSIS OF CLIMATIC DATA FOR THE CHATEAU, MT RUAPHEHU ( ), IN RELATION TO CLIMATIC CHANGE
, IN RELATION TO CLIMATIC CHANGE") Weather and Climate (1991) 11: 15-26 15 ANALYSIS OF CLIMATIC DATA FOR THE CHATEAU, MT RUAPHEHU (1930-1988), IN RELATION TO CLIMATIC CHANGE Frances West and Terry Healy Department of Earth Sciences, University
Weather and Climate (1991) 11: 15-26 15 ANALYSIS OF CLIMATIC DATA FOR THE CHATEAU, MT RUAPHEHU (1930-1988), IN RELATION TO CLIMATIC CHANGE Frances West and Terry Healy Department of Earth Sciences, University
DROUGHT IN MAINLAND PORTUGAL
 DROUGHT IN MAINLAND Ministério da Ciência, Tecnologia e Ensino Superior Instituto de Meteorologia, I. P. Rua C Aeroporto de Lisboa Tel.: (351) 21 844 7000 e-mail:informacoes@meteo.pt 1749-077 Lisboa Portugal
Multivariate Regression Model Results
 Updated: August, 0 Page of Multivariate Regression Model Results 4 5 6 7 8 This exhibit provides the results of the load model forecast discussed in Schedule. Included is the forecast of short term system
Supplementary appendix
 Supplementary appendix This appendix formed part of the original submission and has been peer reviewed. We post it as supplied by the authors. Supplement to: Lowe R, Stewart-Ibarra AM, Petrova D, et al.
Champaign-Urbana 2001 Annual Weather Summary
 Champaign-Urbana 2001 Annual Weather Summary ILLINOIS STATE WATER SURVEY 2204 Griffith Dr. Champaign, IL 61820 wxobsrvr@sws.uiuc.edu Maria Peters, Weather Observer January: After a cold and snowy December,
WHEN IS IT EVER GOING TO RAIN? Table of Average Annual Rainfall and Rainfall For Selected Arizona Cities
 WHEN IS IT EVER GOING TO RAIN? Table of Average Annual Rainfall and 2001-2002 Rainfall For Selected Arizona Cities Phoenix Tucson Flagstaff Avg. 2001-2002 Avg. 2001-2002 Avg. 2001-2002 October 0.7 0.0
Wind Resource Data Summary Cotal Area, Guam Data Summary and Transmittal for December 2011
 Wind Resource Data Summary Cotal Area, Guam Data Summary and Transmittal for December 2011 Prepared for: GHD Inc. 194 Hernan Cortez Avenue 2nd Floor, Ste. 203 Hagatna, Guam 96910 January 2012 DNV Renewables
2018 Annual Review of Availability Assessment Hours
 2018 Annual Review of Availability Assessment Hours Amber Motley Manager, Short Term Forecasting Clyde Loutan Principal, Renewable Energy Integration Karl Meeusen Senior Advisor, Infrastructure & Regulatory
Agricultural Science Climatology Semester 2, Anne Green / Richard Thompson
 Agricultural Science Climatology Semester 2, 2006 Anne Green / Richard Thompson http://www.physics.usyd.edu.au/ag/agschome.htm Course Coordinator: Mike Wheatland Course Goals Evaluate & interpret information,
Tool 2.1.2: Modelling future heavy rainfall
 Impacts of Climate Change on Urban Infrastructure & the Built Environment A Toolbox Tool 2.1.2: Modelling future heavy rainfall Author(s) J. Sturman 1, H. McMillan 2, S. Poyck 2, R. Ibbitt 2, R. Woods
APPENDIX G-7 METEROLOGICAL DATA
 APPENDIX G-7 METEROLOGICAL DATA METEOROLOGICAL DATA FOR AIR AND NOISE SAMPLING DAYS AT MMR Monthly Normals and Extremes for Honolulu International Airport Table G7-1 MMR RAWS Station Hourly Data Tables
Variability and trends in daily minimum and maximum temperatures and in diurnal temperature range in Lithuania, Latvia and Estonia
 Variability and trends in daily minimum and maximum temperatures and in diurnal temperature range in Lithuania, Latvia and Estonia Jaak Jaagus Dept. of Geography, University of Tartu Agrita Briede Dept.
UWM Field Station meteorological data
 University of Wisconsin Milwaukee UWM Digital Commons Field Station Bulletins UWM Field Station Spring 992 UWM Field Station meteorological data James W. Popp University of Wisconsin - Milwaukee Follow
University of Florida Department of Geography GEO 3280 Assignment 3
 G E O 3 2 8 A s s i g n m e n t # 3 Page 1 University of Florida Department of Geography GEO 328 Assignment 3 Modeling Precipitation and Elevation Solar Radiation Precipitation Evapo- Transpiration Vegetation
Champaign-Urbana 1998 Annual Weather Summary
 Champaign-Urbana 1998 Annual Weather Summary ILLINOIS STATE WATER SURVEY Audrey Bryan, Weather Observer 2204 Griffith Dr. Champaign, IL 61820 wxobsrvr@sparc.sws.uiuc.edu The development of the El Nìno
Special Climate Statement record warmth in the Tasman Sea, New Zealand and Tasmania. 27 March 2018
 Special Climate Statement record warmth in the Tasman Sea, New Zealand and Tasmania 27 March 2018 Version number/type Date of issue 1.0 27 March 2018 Unless otherwise noted, all images in this document
Monthly Long Range Weather Commentary Issued: APRIL 18, 2017 Steven A. Root, CCM, Chief Analytics Officer, Sr. VP,
 Monthly Long Range Weather Commentary Issued: APRIL 18, 2017 Steven A. Root, CCM, Chief Analytics Officer, Sr. VP, sroot@weatherbank.com MARCH 2017 Climate Highlights The Month in Review The average contiguous
The Effect of Cloudy Days on the Annual Typical Meteorological Solar Radiation for Armidale NSW, Australia
 IOSR Journal of Engineering (IOSRJEN) ISSN (e): 2250-3021, ISSN (p): 2278-8719 Vol. 04, Issue 08 (August. 2014), VX PP 14-20 www.iosrjen.org The Effect of Cloudy Days on the Annual Typical Meteorological
PREDICTING SOIL SUCTION PROFILES USING PREVAILING WEATHER
 PREDICTING SOIL SUCTION PROFILES USING PREVAILING WEATHER Ronald F. Reed, P.E. Member, ASCE rreed@reed-engineering.com Reed Engineering Group, Ltd. 2424 Stutz, Suite 4 Dallas, Texas 723 214-3-6 Abstract
Direct Normal Radiation from Global Radiation for Indian Stations
 RESEARCH ARTICLE OPEN ACCESS Direct Normal Radiation from Global Radiation for Indian Stations Jaideep Rohilla 1, Amit Kumar 2, Amit Tiwari 3 1(Department of Mechanical Engineering, Somany Institute of
PROJECTING THE SOLAR RADIATION IN NASARAWA-NIGERIA USING REITVELD EQUATION
 PROJECTING THE SOLAR RADIATION IN NASARAWA-NIGERIA USING REITVELD EQUATION * Benedicta C. Njoku 1, Musibau A. Adesina 2, Eshipemi W. Lukman 3 and Bankole Omojola 4 1,2,3 Mechanical Engineering Department,
Champaign-Urbana 2000 Annual Weather Summary
 Champaign-Urbana 2000 Annual Weather Summary ILLINOIS STATE WATER SURVEY 2204 Griffith Dr. Champaign, IL 61820 wxobsrvr@sws.uiuc.edu Maria Peters, Weather Observer January: January started on a mild note,
Fire Season Prediction for Canada, Kerry Anderson Canadian Forest Service
 Fire Season Prediction for Canada, 2014 Kerry Anderson Canadian Forest Service 1 Introduction The Canadian Forest Service is now presenting monthly and seasonal forecast maps through the Canadian Wildland
Monthly Long Range Weather Commentary Issued: February 15, 2015 Steven A. Root, CCM, President/CEO
 Monthly Long Range Weather Commentary Issued: February 15, 2015 Steven A. Root, CCM, President/CEO sroot@weatherbank.com JANUARY 2015 Climate Highlights The Month in Review During January, the average
JOURNAL OF INTERNATIONAL ACADEMIC RESEARCH FOR MULTIDISCIPLINARY Impact Factor 1.393, ISSN: , Volume 2, Issue 4, May 2014
 Impact Factor 1.393, ISSN: 3583, Volume, Issue 4, May 14 A STUDY OF INVERSIONS AND ISOTHERMALS OF AIR POLLUTION DISPERSION DR.V.LAKSHMANARAO DR. K. SAI LAKSHMI P. SATISH Assistant Professor(c), Dept. of
Jackson County 2018 Weather Data 67 Years of Weather Data Recorded at the UF/IFAS Marianna North Florida Research and Education Center
 Jackson County 2018 Weather Data 67 Years of Weather Data Recorded at the UF/IFAS Marianna North Florida Research and Education Center Doug Mayo Jackson County Extension Director 1952-2008 Rainfall Data
Inter-linkage case study in Pakistan
 7 th GEOSS Asia Pacific Symposium GEOSS AWCI Parallel Session: 26-28 May, 2014, Tokyo, Japan Inter-linkage case study in Pakistan Snow and glaciermelt runoff modeling in Upper Indus Basin of Pakistan Maheswor
Sierra Weather and Climate Update
 Sierra Weather and Climate Update 2014-15 Kelly Redmond Western Regional Climate Center Desert Research Institute Reno Nevada Yosemite Hydroclimate Workshop Yosemite Valley, 2015 October 8-9 Percent of
Colorado s 2003 Moisture Outlook
 Colorado s 2003 Moisture Outlook Nolan Doesken and Roger Pielke, Sr. Colorado Climate Center Prepared by Tara Green and Odie Bliss http://climate.atmos.colostate.edu How we got into this drought! Fort
HYDROLOGIC AND WATER RESOURCES EVALUATIONS FOR SG. LUI WATERSHED
 HYDROLOGIC AND WATER RESOURCES EVALUATIONS FOR SG. LUI WATERSHED 1.0 Introduction The Sg. Lui watershed is the upper part of Langat River Basin, in the state of Selangor which located approximately 20
Seasonal Hydrometeorological Ensemble Prediction System: Forecast of Irrigation Potentials in Denmark
 Seasonal Hydrometeorological Ensemble Prediction System: Forecast of Irrigation Potentials in Denmark Diana Lucatero 1*, Henrik Madsen 2, Karsten H. Jensen 1, Jens C. Refsgaard 3, Jacob Kidmose 3 1 University
PROJECT REPORT (ASL 720) CLOUD CLASSIFICATION
 CLOUD CLASSIFICATION") PROJECT REPORT (ASL 720) CLOUD CLASSIFICATION SUBMITTED BY- PRIYANKA GUPTA 2011CH70177 RINI KAPOOR 2011CH70179 INDIVIDUAL CONTRIBUTION- Priyanka Gupta- analysed data of region considered in India (West:80,
PROJECT REPORT (ASL 720) CLOUD CLASSIFICATION SUBMITTED BY- PRIYANKA GUPTA 2011CH70177 RINI KAPOOR 2011CH70179 INDIVIDUAL CONTRIBUTION- Priyanka Gupta- analysed data of region considered in India (West:80,
Scarborough Tide Gauge
 Tide Gauge Location OS: 504898E 488622N WGS84: Latitude: 54 16' 56.990"N Longitude: 00 23' 25.0279"W Instrument Valeport 740 (Druck Pressure Transducer) Benchmarks Benchmark Description TGBM = 4.18m above
July, International SWAT Conference & Workshops
 July, 212 212 International SWAT Conference & Workshops Hydrological Modelling of Kosi and Gandak Basins using SWAT Model S. Dutta, Pritam Biswas, Sangita Devi, Suresh A Karth and Bimlesh kumar, Ganga