Statistics II. Management Degree Management Statistics IIDegree. Statistics II. 2 nd Sem. 2013/2014. Management Degree. Simple Linear Regression
|
|
|
- Matilda Thomas
- 5 years ago
- Views:
Transcription

1
2 Model 1 2 Ordinary Least Squares 3 4 Non-linearities 5 of the coefficients and their
3 to the model We saw that econometrics studies E (Y x). More generally, we shall study regression analysis. : The regression of Y on X is any characteristic of the conditional distribution f (y x) expressed as a function of x.
4 to the model Frequently the term regression is incorrectly used to denote other quantities. We could be interested in other measures of location, say for instance the median. In this course we shall focus our attention mainly on the conditional expected value.
5 Choice of the conditional expected value Why? Because E (Y x) is the function of x that minimises [ E (Y h (x)) 2]. (The median minimises E [ Y h (x) ], and it allows for non-symmetric loss functions.) Let us start with the simplest case of a univariate x (this is helpful as it allows a simple graphical representation).
6 Definition of the model We need to define three items: 1. The functional form of E (Y x) (we shall assume linearity) 2. How to treat the effect of the remaining variables on Y 3. How to perform a ceteris paribus analysis
7 Definition of the model Our starting point is: E (Y x) = β 0 + β 1 x Y = β 0 + β 1 x + u Example: wage as a function of schooling
8 Y E (Y x) = u Properties 1. E (u x) = 0 2. E (u) = 0 3. Var (u x) = σy 2 x 4. Cov (u, x) = 0 5. Cov (u, g (x)) = 0 Only the deviations of Y from E (Y x) have property 5.
9 Observations In the case of the conditional expected value, a ceteris paribus inferential analysis is possible, since we can consider variations of x with constant u. The problem is that many times the economic analysis is not interested in the parameters appearing in conditional expected values, or at least not in those we can estimate.
10 Model s hypotheses SLR.1: Model linear in the parameters Y = β 0 + β 1 x + u SLR.2: Random sample (i.i.d.) {(y i, x i ) : i = 1... n} y i = β 0 + β 1 x i + u i SLR.3: Sample variation: x i is not constant in the sample SLR.4: Errors uncorrelated with x: E (u x) = 0 SLR.5: Homoskedasticity: Var (u x) = σ 2 constant
11 Notice that E (u) = 0 and that Cov (u, x) = E (xu) = 0 Applying the method of moments: 1 ( y i n ˆβ 0 ˆβ ) 1 x i = 0 1 ( ) y i ˆβ 0 ˆβ 1 x i x i = 0 n
12 From the first equation we obtain ȳ = ˆβ 0 + ˆβ 1 x ˆβ 0 = ȳ ˆβ 1 x
13 Substituting into the second equation 1 ( ( y i ȳ n ˆβ ) 1 x ˆβ ) 1 x i x i = 0 1 (yi ȳ) x i = 1 ˆβ 1 (x i x) x i n n ˆβ 1 = (yi ȳ) x i (xi x) 2 = (yi ȳ) (x i x) (xi x) 2 This expression corresponds to to the ratio between the sample covariance of y and x and the sample variance of x (necessarily positive).
14 The fitted values of y are given by: ŷ = ˆβ 0 + ˆβ 1 x i which is called regression line. From ŷ, the residuals can be computed: ( ) û i = y i ŷ i = y i ˆβ 0 + ˆβ 1 x i
15 Consider now the sum of the squared residuals: SSR = ( ) 2 y i ˆβ 0 ˆβ 1 x i The ordinary least squares ˆβ 0 and ˆβ 1 minimise the SSR.
16 To prove the above, consider SSR = ( y i ˆβ 0 ˆβ 1 x i ) 2 SSR ˆβ 0 = 2 ( y i ˆβ 0 ˆβ 1 x i ) = 0 SSR ˆβ 1 = 2 ( y i ˆβ 0 ˆβ 1 x i ) x i = 0 You can find the second order condition in the book.
17 Properties: 1 1. ûi = 0 n 2. 1 xi û i = 0 n 3. ȳ = ˆβ 0 + ˆβ 1 x 4. ŷ = ȳ 5. 1 ŷi û i = 0 n
18 Important comment Noticing that y i = ŷ i + û i, this last property: 1 ŷi û i = 0 n implies that the least squares method provides a decomposition of y i into two parts that are orthogonal in the sample.
19 Decomposition of y i
20 Consider now the following quantities: Total sum of squares - total variation in dependent variable SST = (y i ȳ) 2 Explained sum of squares - variation explained by regression SSE = (ŷ i ȳ) 2 Residual sum of squares - variation not explained by regression SSR = ûi 2
21 It is possible to prove that SST = SSE + SSR. This decomposition allows to evaluate the goodness of fit using the following coefficient: R 2 = SSE SST = 1 SSR SST 0 R 2 1 In the simple linear regression model R 2 = ρ 2 y,x.
22 SST = (y i ȳ) 2 = [(y i ŷ i ) + (ŷ i ȳ)] 2 = [û i + (ŷ i ȳ)] 2 = û 2 i + 2 û i (ŷ i ȳ) + (ŷ i ȳ) 2 = SSR + 2 û i (ŷ i ȳ) + SSE From properties 1 to 5 it is easy to see that û i (ŷ i ȳ) = 0, so that SST = SSE + SSR.
23 Example
24 Example
25 Example
26 Change of location and scale What happens when we change the unit of measurement of the variables? Y = β 0 + β 1 α (αx) + u αy = αβ 0 + αβ 1 x + αu αy + θ = (αβ 0 + θ) + αβ 1 x + αu In any of the above cases the R 2 coefficient remains the same.
27 Non-linearities So far, it looked like the kind of model we considered, namely Y = β 0 + β 1 x + u only allows to describe linear relationships. Luckily, this is not the case, and the model can accommodate for non-linear relationships between y and x (as long as it keeps being linear in the parameters).
28 Non-linearities For example, the model wage = β 0 + β 1 edu + u implies that any added year of schooling has the same effect on wage. This is not very close to reality! Luckily, the model only needs to be linear in the parameters, but not in the variables, so we can consider more sensible alternatives.
29 Non-linearities Consider for instance: ln (wage) = β 0 + β 1 edu + u Now: edu = 1 = ln (wage) = β 1 Since ln (wage) wage wage this specification of the model implies that any additional year of schooling has the same percentage effect on wage.

30 Example 2.10
31 Non-linearities Consider now a demand function of the type Q = β 0 + β 1 P Elasticity in this model is given by ε Q,P = β 1P β 0 + β 1 P
32 Non-linearities In order to obtain a constant elasticity, we can use the following specification: ln (Q) = β 0 + β 1 ln (P) Q = exp (β 0 + β 1 ln (P)) Q P = β 1 P Q = ε Q,P = β 1Q P P Q = β 1 This model falls within our framework, because it could be linearised.

33 Example 2.11
34 Non-linearities Some models cannot be linearised. An example is the following specification of the probability of an individual being vegetarian as a function of age: Pr = exp (β 0 + β 1 age) 1 + exp (β 0 + β 1 age)
35 of the coefficients and their Case 1: lin-lin model Consider the model y = β 0 + β 1 x + u or E(Y x) = β 0 + β 1 x estimated by ŷ = ˆβ 0 + ˆβ 1 x
36 of the coefficients and their From the above we obtain: so that E(Y x) = β 1 x ŷ = ˆβ 1 x x = 1 = Cp E(Y x) = β 1 and ŷ = ˆβ 1
37 of the coefficients and their Example: lin-lin model educ = 1 = Cp ŝal = educ ŝal = 0.64
38 of the coefficients and their Case 2: log-linear model Consider the model estimated by log(y) = ˆβ 0 + ˆβ 1 x Now a change in x has the following effect: x = 1 = Cp log(y) = ˆβ 1
39 of the coefficients and their But we can approximate the log function as follows: so that log(y) ŷ ŷ log(y) 100% ŷ ŷ 100% = % ŷ
40 of the coefficients and their Substituting into the effect of a change in x we obtain x = 1 = Cp % ŷ ˆβ 1 100% which represents an approximate semi-elasticity.
41 of the coefficients and their Example: log-linear model log(sal) = educ educ = 1 = Cp % ŝal 10%
42 of the coefficients and their Case 3: log-log model Consider now the model The change log(x) leads to log(y) = ˆβ 0 + ˆβ 1 log(x) log(y) = β 1 log(x) log(y) log(x) = β 1 elasticity % x = 1% = Cp % y β 1 %
43 of the coefficients and their Example: log-log model log(price) = log(sqrft) % sqrft = 1% = Cp % price 0.70%
44 of the coefficients and their Case 4: lin-log model In the model: ŷ = ˆβ 0 + ˆβ 1 log(x) A change log(x) gives If % x = 1% then ŷ = ˆβ 1 log(x) log(x) 100 = 1 log(x) = ŷ = β 1 100
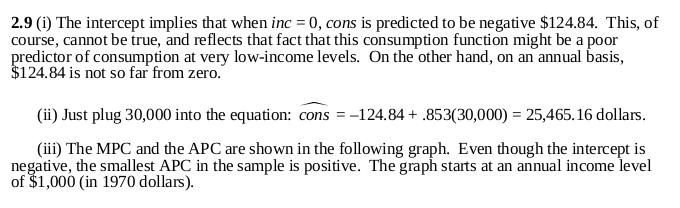
45 of the coefficients and their Example: lin-log model price = log(sqrft) % sqrft = 1% = Cp price
46 Table 2.3

47 Exercise 2.6
ECON The Simple Regression Model
 ECON 351 - The Simple Regression Model Maggie Jones 1 / 41 The Simple Regression Model Our starting point will be the simple regression model where we look at the relationship between two variables In
Intermediate Econometrics
 Intermediate Econometrics Markus Haas LMU München Summer term 2011 15. Mai 2011 The Simple Linear Regression Model Considering variables x and y in a specific population (e.g., years of education and wage
Econometrics I Lecture 3: The Simple Linear Regression Model
 Econometrics I Lecture 3: The Simple Linear Regression Model Mohammad Vesal Graduate School of Management and Economics Sharif University of Technology 44716 Fall 1397 1 / 32 Outline Introduction Estimating
Wooldridge, Introductory Econometrics, 4th ed. Chapter 2: The simple regression model
 Wooldridge, Introductory Econometrics, 4th ed. Chapter 2: The simple regression model Most of this course will be concerned with use of a regression model: a structure in which one or more explanatory
The Simple Regression Model. Part II. The Simple Regression Model
 Part II The Simple Regression Model As of Sep 22, 2015 Definition 1 The Simple Regression Model Definition Estimation of the model, OLS OLS Statistics Algebraic properties Goodness-of-Fit, the R-square
Econometrics I KS. Module 2: Multivariate Linear Regression. Alexander Ahammer. This version: April 16, 2018
 Econometrics I KS Module 2: Multivariate Linear Regression Alexander Ahammer Department of Economics Johannes Kepler University of Linz This version: April 16, 2018 Alexander Ahammer (JKU) Module 2: Multivariate
Homoskedasticity. Var (u X) = σ 2. (23)
 = σ 2. (23)") Homoskedasticity How big is the difference between the OLS estimator and the true parameter? To answer this question, we make an additional assumption called homoskedasticity: Var (u X) = σ 2. (23) This
Homoskedasticity How big is the difference between the OLS estimator and the true parameter? To answer this question, we make an additional assumption called homoskedasticity: Var (u X) = σ 2. (23) This
ECON2228 Notes 2. Christopher F Baum. Boston College Economics. cfb (BC Econ) ECON2228 Notes / 47
 ECON2228 Notes / 47") ECON2228 Notes 2 Christopher F Baum Boston College Economics 2014 2015 cfb (BC Econ) ECON2228 Notes 2 2014 2015 1 / 47 Chapter 2: The simple regression model Most of this course will be concerned with
ECON2228 Notes 2 Christopher F Baum Boston College Economics 2014 2015 cfb (BC Econ) ECON2228 Notes 2 2014 2015 1 / 47 Chapter 2: The simple regression model Most of this course will be concerned with
Applied Econometrics (QEM)
") Applied Econometrics (QEM) based on Prinicples of Econometrics Jakub Mućk Department of Quantitative Economics Jakub Mućk Applied Econometrics (QEM) Meeting #3 1 / 42 Outline 1 2 3 t-test P-value Linear
Applied Econometrics (QEM) based on Prinicples of Econometrics Jakub Mućk Department of Quantitative Economics Jakub Mućk Applied Econometrics (QEM) Meeting #3 1 / 42 Outline 1 2 3 t-test P-value Linear
The Simple Regression Model. Simple Regression Model 1
 The Simple Regression Model Simple Regression Model 1 Simple regression model: Objectives Given the model: - where y is earnings and x years of education - Or y is sales and x is spending in advertising
Sample Problems. Note: If you find the following statements true, you should briefly prove them. If you find them false, you should correct them.
 Sample Problems 1. True or False Note: If you find the following statements true, you should briefly prove them. If you find them false, you should correct them. (a) The sample average of estimated residuals
LECTURE 6. Introduction to Econometrics. Hypothesis testing & Goodness of fit
 LECTURE 6 Introduction to Econometrics Hypothesis testing & Goodness of fit October 25, 2016 1 / 23 ON TODAY S LECTURE We will explain how multiple hypotheses are tested in a regression model We will define
Simple Linear Regression: The Model
 Simple Linear Regression: The Model task: quantifying the effect of change X in X on Y, with some constant β 1 : Y = β 1 X, linear relationship between X and Y, however, relationship subject to a random
Introductory Econometrics
 Based on the textbook by Wooldridge: : A Modern Approach Robert M. Kunst robert.kunst@univie.ac.at University of Vienna and Institute for Advanced Studies Vienna October 16, 2013 Outline Introduction Simple
5.1 Model Specification and Data 5.2 Estimating the Parameters of the Multiple Regression Model 5.3 Sampling Properties of the Least Squares
 5.1 Model Specification and Data 5. Estimating the Parameters of the Multiple Regression Model 5.3 Sampling Properties of the Least Squares Estimator 5.4 Interval Estimation 5.5 Hypothesis Testing for
Applied Econometrics (QEM)
") Applied Econometrics (QEM) The Simple Linear Regression Model based on Prinicples of Econometrics Jakub Mućk Department of Quantitative Economics Jakub Mućk Applied Econometrics (QEM) Meeting #2 The Simple
Applied Econometrics (QEM) The Simple Linear Regression Model based on Prinicples of Econometrics Jakub Mućk Department of Quantitative Economics Jakub Mućk Applied Econometrics (QEM) Meeting #2 The Simple
Multiple Regression Analysis: Further Issues
 Multiple Regression Analysis: Further Issues Ping Yu School of Economics and Finance The University of Hong Kong Ping Yu (HKU) MLR: Further Issues 1 / 36 Effects of Data Scaling on OLS Statistics Effects
Simple Linear Regression
 Simple Linear Regression In simple linear regression we are concerned about the relationship between two variables, X and Y. There are two components to such a relationship. 1. The strength of the relationship.
Econometrics I KS. Module 1: Bivariate Linear Regression. Alexander Ahammer. This version: March 12, 2018
 Econometrics I KS Module 1: Bivariate Linear Regression Alexander Ahammer Department of Economics Johannes Kepler University of Linz This version: March 12, 2018 Alexander Ahammer (JKU) Module 1: Bivariate
ECON3150/4150 Spring 2015
 ECON3150/4150 Spring 2015 Lecture 3&4 - The linear regression model Siv-Elisabeth Skjelbred University of Oslo January 29, 2015 1 / 67 Chapter 4 in S&W Section 17.1 in S&W (extended OLS assumptions) 2
Multiple Regression Analysis. Basic Estimation Techniques. Multiple Regression Analysis. Multiple Regression Analysis
 Multiple Regression Analysis Basic Estimation Techniques Herbert Stocker herbert.stocker@uibk.ac.at University of Innsbruck & IIS, University of Ramkhamhaeng Regression Analysis: Statistical procedure
Introduction to Econometrics
 Introduction to Econometrics Lecture 3 : Regression: CEF and Simple OLS Zhaopeng Qu Business School,Nanjing University Oct 9th, 2017 Zhaopeng Qu (Nanjing University) Introduction to Econometrics Oct 9th,
4.1 Least Squares Prediction 4.2 Measuring Goodness-of-Fit. 4.3 Modeling Issues. 4.4 Log-Linear Models
 4.1 Least Squares Prediction 4. Measuring Goodness-of-Fit 4.3 Modeling Issues 4.4 Log-Linear Models y = β + β x + e 0 1 0 0 ( ) E y where e 0 is a random error. We assume that and E( e 0 ) = 0 var ( e
1. The OLS Estimator. 1.1 Population model and notation
 1. The OLS Estimator OLS stands for Ordinary Least Squares. There are 6 assumptions ordinarily made, and the method of fitting a line through data is by least-squares. OLS is a common estimation methodology
The Multiple Regression Model Estimation
 Lesson 5 The Multiple Regression Model Estimation Pilar González and Susan Orbe Dpt Applied Econometrics III (Econometrics and Statistics) Pilar González and Susan Orbe OCW 2014 Lesson 5 Regression model:
Ch 2: Simple Linear Regression
 Ch 2: Simple Linear Regression 1. Simple Linear Regression Model A simple regression model with a single regressor x is y = β 0 + β 1 x + ɛ, where we assume that the error ɛ is independent random component
Lecture: Simultaneous Equation Model (Wooldridge s Book Chapter 16)
") Lecture: Simultaneous Equation Model (Wooldridge s Book Chapter 16) 1 2 Model Consider a system of two regressions y 1 = β 1 y 2 + u 1 (1) y 2 = β 2 y 1 + u 2 (2) This is a simultaneous equation model
Lecture: Simultaneous Equation Model (Wooldridge s Book Chapter 16) 1 2 Model Consider a system of two regressions y 1 = β 1 y 2 + u 1 (1) y 2 = β 2 y 1 + u 2 (2) This is a simultaneous equation model
Wooldridge, Introductory Econometrics, 4th ed. Chapter 15: Instrumental variables and two stage least squares
 Wooldridge, Introductory Econometrics, 4th ed. Chapter 15: Instrumental variables and two stage least squares Many economic models involve endogeneity: that is, a theoretical relationship does not fit
Multiple Linear Regression CIVL 7012/8012
 Multiple Linear Regression CIVL 7012/8012 2 Multiple Regression Analysis (MLR) Allows us to explicitly control for many factors those simultaneously affect the dependent variable This is important for
Measuring the fit of the model - SSR
 Measuring the fit of the model - SSR Once we ve determined our estimated regression line, we d like to know how well the model fits. How far/close are the observations to the fitted line? One way to do
Lecture 3: Multiple Regression
 Lecture 3: Multiple Regression R.G. Pierse 1 The General Linear Model Suppose that we have k explanatory variables Y i = β 1 + β X i + β 3 X 3i + + β k X ki + u i, i = 1,, n (1.1) or Y i = β j X ji + u
Multiple Regression Analysis. Part III. Multiple Regression Analysis
 Part III Multiple Regression Analysis As of Sep 26, 2017 1 Multiple Regression Analysis Estimation Matrix form Goodness-of-Fit R-square Adjusted R-square Expected values of the OLS estimators Irrelevant
Review of Statistics
 Review of Statistics Topics Descriptive Statistics Mean, Variance Probability Union event, joint event Random Variables Discrete and Continuous Distributions, Moments Two Random Variables Covariance and
Linear models. Linear models are computationally convenient and remain widely used in. applied econometric research
 Linear models Linear models are computationally convenient and remain widely used in applied econometric research Our main focus in these lectures will be on single equation linear models of the form y
Multiple Regression Analysis: Inference MULTIPLE REGRESSION ANALYSIS: INFERENCE. Sampling Distributions of OLS Estimators
 1 2 Multiple Regression Analysis: Inference MULTIPLE REGRESSION ANALYSIS: INFERENCE Hüseyin Taştan 1 1 Yıldız Technical University Department of Economics These presentation notes are based on Introductory
Applied Regression. Applied Regression. Chapter 2 Simple Linear Regression. Hongcheng Li. April, 6, 2013
 Applied Regression Chapter 2 Simple Linear Regression Hongcheng Li April, 6, 2013 Outline 1 Introduction of simple linear regression 2 Scatter plot 3 Simple linear regression model 4 Test of Hypothesis
Diagnostics of Linear Regression
 Diagnostics of Linear Regression Junhui Qian October 7, 14 The Objectives After estimating a model, we should always perform diagnostics on the model. In particular, we should check whether the assumptions
EC212: Introduction to Econometrics Review Materials (Wooldridge, Appendix)
") 1 EC212: Introduction to Econometrics Review Materials (Wooldridge, Appendix) Taisuke Otsu London School of Economics Summer 2018 A.1. Summation operator (Wooldridge, App. A.1) 2 3 Summation operator For
1 EC212: Introduction to Econometrics Review Materials (Wooldridge, Appendix) Taisuke Otsu London School of Economics Summer 2018 A.1. Summation operator (Wooldridge, App. A.1) 2 3 Summation operator For
LECTURE 2 LINEAR REGRESSION MODEL AND OLS
 SEPTEMBER 29, 2014 LECTURE 2 LINEAR REGRESSION MODEL AND OLS Definitions A common question in econometrics is to study the effect of one group of variables X i, usually called the regressors, on another
Math 3330: Solution to midterm Exam
 Math 3330: Solution to midterm Exam Question 1: (14 marks) Suppose the regression model is y i = β 0 + β 1 x i + ε i, i = 1,, n, where ε i are iid Normal distribution N(0, σ 2 ). a. (2 marks) Compute the
Model Specification and Data Problems. Part VIII
 Part VIII Model Specification and Data Problems As of Oct 24, 2017 1 Model Specification and Data Problems RESET test Non-nested alternatives Outliers A functional form misspecification generally means
Linear Regression. Junhui Qian. October 27, 2014
 Linear Regression Junhui Qian October 27, 2014 Outline The Model Estimation Ordinary Least Square Method of Moments Maximum Likelihood Estimation Properties of OLS Estimator Unbiasedness Consistency Efficiency
Environmental Econometrics
 Environmental Econometrics Syngjoo Choi Fall 2008 Environmental Econometrics (GR03) Fall 2008 1 / 37 Syllabus I This is an introductory econometrics course which assumes no prior knowledge on econometrics;
Economics 113. Simple Regression Assumptions. Simple Regression Derivation. Changing Units of Measurement. Nonlinear effects
 Economics 113 Simple Regression Models Simple Regression Assumptions Simple Regression Derivation Changing Units of Measurement Nonlinear effects OLS and unbiased estimates Variance of the OLS estimates
Inference in Regression Analysis
 ECNS 561 Inference Inference in Regression Analysis Up to this point 1.) OLS is unbiased 2.) OLS is BLUE (best linear unbiased estimator i.e., the variance is smallest among linear unbiased estimators)
Basic econometrics. Tutorial 3. Dipl.Kfm. Johannes Metzler
 Basic econometrics Tutorial 3 Dipl.Kfm. Introduction Some of you were asking about material to revise/prepare econometrics fundamentals. First of all, be aware that I will not be too technical, only as
WISE MA/PhD Programs Econometrics Instructor: Brett Graham Spring Semester, Academic Year Exam Version: A
 WISE MA/PhD Programs Econometrics Instructor: Brett Graham Spring Semester, 2016-17 Academic Year Exam Version: A INSTRUCTIONS TO STUDENTS 1 The time allowed for this examination paper is 2 hours. 2 This
Applied Statistics and Econometrics
 Applied Statistics and Econometrics Lecture 6 Saul Lach September 2017 Saul Lach () Applied Statistics and Econometrics September 2017 1 / 53 Outline of Lecture 6 1 Omitted variable bias (SW 6.1) 2 Multiple
Econometrics Multiple Regression Analysis: Heteroskedasticity
 Econometrics Multiple Regression Analysis: João Valle e Azevedo Faculdade de Economia Universidade Nova de Lisboa Spring Semester João Valle e Azevedo (FEUNL) Econometrics Lisbon, April 2011 1 / 19 Properties
Applied Quantitative Methods II
 Applied Quantitative Methods II Lecture 4: OLS and Statistics revision Klára Kaĺıšková Klára Kaĺıšková AQM II - Lecture 4 VŠE, SS 2016/17 1 / 68 Outline 1 Econometric analysis Properties of an estimator
STAT420 Midterm Exam. University of Illinois Urbana-Champaign October 19 (Friday), :00 4:15p. SOLUTIONS (Yellow)
, :00 4:15p. SOLUTIONS (Yellow)") STAT40 Midterm Exam University of Illinois Urbana-Champaign October 19 (Friday), 018 3:00 4:15p SOLUTIONS (Yellow) Question 1 (15 points) (10 points) 3 (50 points) extra ( points) Total (77 points) Points
STAT40 Midterm Exam University of Illinois Urbana-Champaign October 19 (Friday), 018 3:00 4:15p SOLUTIONS (Yellow) Question 1 (15 points) (10 points) 3 (50 points) extra ( points) Total (77 points) Points
STAT5044: Regression and Anova. Inyoung Kim
 STAT5044: Regression and Anova Inyoung Kim 2 / 51 Outline 1 Matrix Expression 2 Linear and quadratic forms 3 Properties of quadratic form 4 Properties of estimates 5 Distributional properties 3 / 51 Matrix
Intermediate Econometrics
 Intermediate Econometrics Heteroskedasticity Text: Wooldridge, 8 July 17, 2011 Heteroskedasticity Assumption of homoskedasticity, Var(u i x i1,..., x ik ) = E(u 2 i x i1,..., x ik ) = σ 2. That is, the
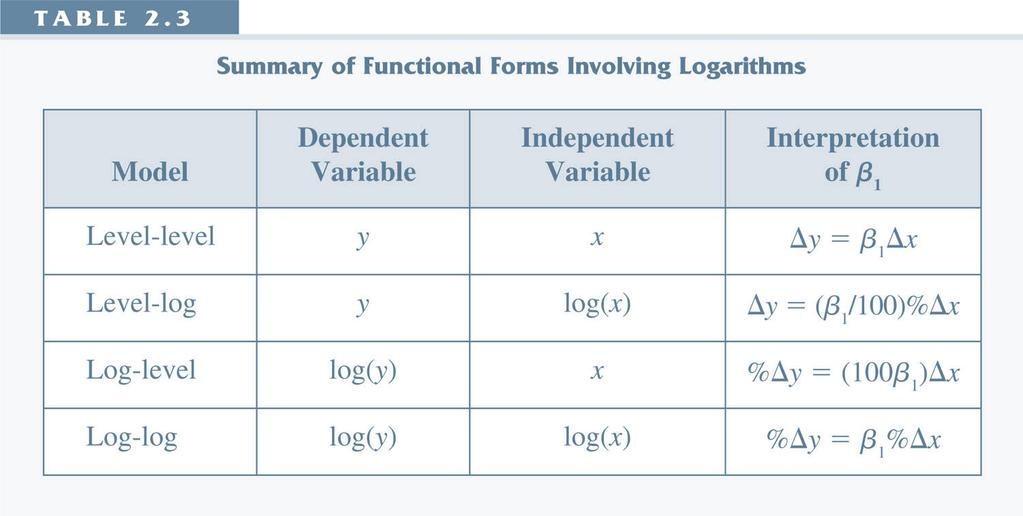
Outline. 2. Logarithmic Functional Form and Units of Measurement. Functional Form. I. Functional Form: log II. Units of Measurement
 Outline 2. Logarithmic Functional Form and Units of Measurement I. Functional Form: log II. Units of Measurement Read Wooldridge (2013), Chapter 2.4, 6.1 and 6.2 2 Functional Form I. Functional Form: log
Regression Analysis: Basic Concepts
 The simple linear model Regression Analysis: Basic Concepts Allin Cottrell Represents the dependent variable, y i, as a linear function of one independent variable, x i, subject to a random disturbance
Chapter 2: simple regression model
 Chapter 2: simple regression model Goal: understand how to estimate and more importantly interpret the simple regression Reading: chapter 2 of the textbook Advice: this chapter is foundation of econometrics.
ECON Program Evaluation, Binary Dependent Variable, Misc.
 ECON 351 - Program Evaluation, Binary Dependent Variable, Misc. Maggie Jones () 1 / 17 Readings Chapter 13: Section 13.2 on difference in differences Chapter 7: Section on binary dependent variables Chapter
Correlation 1. December 4, HMS, 2017, v1.1
 Correlation 1 December 4, 2017 1 HMS, 2017, v1.1 Chapter References Diez: Chapter 7 Navidi, Chapter 7 I don t expect you to learn the proofs what will follow. Chapter References 2 Correlation The sample
ECON 450 Development Economics
 ECON 450 Development Economics Statistics Background University of Illinois at Urbana-Champaign Summer 2017 Outline 1 Introduction 2 3 4 5 Introduction Regression analysis is one of the most important
Lecture 14 Simple Linear Regression
 Lecture 4 Simple Linear Regression Ordinary Least Squares (OLS) Consider the following simple linear regression model where, for each unit i, Y i is the dependent variable (response). X i is the independent
Multiple Linear Regression
 Multiple Linear Regression Simple linear regression tries to fit a simple line between two variables Y and X. If X is linearly related to Y this explains some of the variability in Y. In most cases, there
Linear Regression with 1 Regressor. Introduction to Econometrics Spring 2012 Ken Simons
 Linear Regression with 1 Regressor Introduction to Econometrics Spring 2012 Ken Simons Linear Regression with 1 Regressor 1. The regression equation 2. Estimating the equation 3. Assumptions required for
MATH 644: Regression Analysis Methods
 MATH 644: Regression Analysis Methods FINAL EXAM Fall, 2012 INSTRUCTIONS TO STUDENTS: 1. This test contains SIX questions. It comprises ELEVEN printed pages. 2. Answer ALL questions for a total of 100
The regression model with one fixed regressor cont d
 The regression model with one fixed regressor cont d 3150/4150 Lecture 4 Ragnar Nymoen 27 January 2012 The model with transformed variables Regression with transformed variables I References HGL Ch 2.8
The multiple regression model; Indicator variables as regressors
 The multiple regression model; Indicator variables as regressors Ragnar Nymoen University of Oslo 28 February 2013 1 / 21 This lecture (#12): Based on the econometric model specification from Lecture 9
Economics 582 Random Effects Estimation
 Economics 582 Random Effects Estimation Eric Zivot May 29, 2013 Random Effects Model Hence, the model can be re-written as = x 0 β + + [x ] = 0 (no endogeneity) [ x ] = = + x 0 β + + [x ] = 0 [ x ] = 0
Unit 10: Simple Linear Regression and Correlation
 Unit 10: Simple Linear Regression and Correlation Statistics 571: Statistical Methods Ramón V. León 6/28/2004 Unit 10 - Stat 571 - Ramón V. León 1 Introductory Remarks Regression analysis is a method for
Ph.D. Qualifying Exam Friday Saturday, January 6 7, 2017
 Ph.D. Qualifying Exam Friday Saturday, January 6 7, 2017 Put your solution to each problem on a separate sheet of paper. Problem 1. (5106) Let X 1, X 2,, X n be a sequence of i.i.d. observations from a
Linear Models in Econometrics
 Linear Models in Econometrics Nicky Grant At the most fundamental level econometrics is the development of statistical techniques suited primarily to answering economic questions and testing economic theories.
Econ 3790: Statistics Business and Economics. Instructor: Yogesh Uppal
 Econ 3790: Statistics Business and Economics Instructor: Yogesh Uppal Email: yuppal@ysu.edu Chapter 14 Covariance and Simple Correlation Coefficient Simple Linear Regression Covariance Covariance between
Intro to Applied Econometrics: Basic theory and Stata examples
 IAPRI-MSU Technical Training Intro to Applied Econometrics: Basic theory and Stata examples Training materials developed and session facilitated by icole M. Mason Assistant Professor, Dept. of Agricultural,
Estadística II Chapter 4: Simple linear regression
 Estadística II Chapter 4: Simple linear regression Chapter 4. Simple linear regression Contents Objectives of the analysis. Model specification. Least Square Estimators (LSE): construction and properties
Advanced Econometrics I
 Lecture Notes Autumn 2010 Dr. Getinet Haile, University of Mannheim 1. Introduction Introduction & CLRM, Autumn Term 2010 1 What is econometrics? Econometrics = economic statistics economic theory mathematics
EC4051 Project and Introductory Econometrics
 EC4051 Project and Introductory Econometrics Dudley Cooke Trinity College Dublin Dudley Cooke (Trinity College Dublin) Intro to Econometrics 1 / 23 Project Guidelines Each student is required to undertake
Simple Linear Regression
 Simple Linear Regression September 24, 2008 Reading HH 8, GIll 4 Simple Linear Regression p.1/20 Problem Data: Observe pairs (Y i,x i ),i = 1,...n Response or dependent variable Y Predictor or independent
Statistical Inference. Part IV. Statistical Inference
 Part IV Statistical Inference As of Oct 5, 2017 Sampling Distributions of the OLS Estimator 1 Statistical Inference Sampling Distributions of the OLS Estimator Testing Against One-Sided Alternatives Two-Sided
Econometrics Summary Algebraic and Statistical Preliminaries
 Econometrics Summary Algebraic and Statistical Preliminaries Elasticity: The point elasticity of Y with respect to L is given by α = ( Y/ L)/(Y/L). The arc elasticity is given by ( Y/ L)/(Y/L), when L
The general linear regression with k explanatory variables is just an extension of the simple regression as follows
 3. Multiple Regression Analysis The general linear regression with k explanatory variables is just an extension of the simple regression as follows (1) y i = β 0 + β 1 x i1 + + β k x ik + u i. Because
WISE International Masters
 WISE International Masters ECONOMETRICS Instructor: Brett Graham INSTRUCTIONS TO STUDENTS 1 The time allowed for this examination paper is 2 hours. 2 This examination paper contains 32 questions. You are
L2: Two-variable regression model
 L2: Two-variable regression model Feng Li feng.li@cufe.edu.cn School of Statistics and Mathematics Central University of Finance and Economics Revision: September 4, 2014 What we have learned last time...
Linear Models and Estimation by Least Squares
 Linear Models and Estimation by Least Squares Jin-Lung Lin 1 Introduction Causal relation investigation lies in the heart of economics. Effect (Dependent variable) cause (Independent variable) Example:
Motivation for multiple regression
 Motivation for multiple regression 1. Simple regression puts all factors other than X in u, and treats them as unobserved. Effectively the simple regression does not account for other factors. 2. The slope
Linear models and their mathematical foundations: Simple linear regression
 Linear models and their mathematical foundations: Simple linear regression Steffen Unkel Department of Medical Statistics University Medical Center Göttingen, Germany Winter term 2018/19 1/21 Introduction
Final Exam. Economics 835: Econometrics. Fall 2010
 Final Exam Economics 835: Econometrics Fall 2010 Please answer the question I ask - no more and no less - and remember that the correct answer is often short and simple. 1 Some short questions a) For each
MA Advanced Econometrics: Spurious Regressions and Cointegration
 MA Advanced Econometrics: Spurious Regressions and Cointegration Karl Whelan School of Economics, UCD February 22, 2011 Karl Whelan (UCD) Spurious Regressions and Cointegration February 22, 2011 1 / 18
Advanced Quantitative Methods: ordinary least squares
 Advanced Quantitative Methods: Ordinary Least Squares University College Dublin 31 January 2012 1 2 3 4 5 Terminology y is the dependent variable referred to also (by Greene) as a regressand X are the
Introduction. The Linear Regression Model One popular model is the linear regression model. It writes as :
 Introduction Definition From Wikipedia : The two main purposes of econometrics are to give empirical content to economic theory and to subject economic theory to potentially falsifying tests. Another popular
K. Model Diagnostics. residuals ˆɛ ij = Y ij ˆµ i N = Y ij Ȳ i semi-studentized residuals ω ij = ˆɛ ij. studentized deleted residuals ɛ ij =
 K. Model Diagnostics We ve already seen how to check model assumptions prior to fitting a one-way ANOVA. Diagnostics carried out after model fitting by using residuals are more informative for assessing
WISE MA/PhD Programs Econometrics Instructor: Brett Graham Spring Semester, Academic Year Exam Version: A
 WISE MA/PhD Programs Econometrics Instructor: Brett Graham Spring Semester, 2016-17 Academic Year Exam Version: A INSTRUCTIONS TO STUDENTS 1 The time allowed for this examination paper is 2 hours. 2 This
Chapter 8 Heteroskedasticity
 Chapter 8 Walter R. Paczkowski Rutgers University Page 1 Chapter Contents 8.1 The Nature of 8. Detecting 8.3 -Consistent Standard Errors 8.4 Generalized Least Squares: Known Form of Variance 8.5 Generalized
Rewrap ECON November 18, () Rewrap ECON 4135 November 18, / 35
 Rewrap ECON 4135 November 18, / 35") Rewrap ECON 4135 November 18, 2011 () Rewrap ECON 4135 November 18, 2011 1 / 35 What should you now know? 1 What is econometrics? 2 Fundamental regression analysis 1 Bivariate regression 2 Multivariate
Rewrap ECON 4135 November 18, 2011 () Rewrap ECON 4135 November 18, 2011 1 / 35 What should you now know? 1 What is econometrics? 2 Fundamental regression analysis 1 Bivariate regression 2 Multivariate
CHAPTER 4. > 0, where β
 CHAPTER 4 SOLUTIONS TO PROBLEMS 4. (i) and (iii) generally cause the t statistics not to have a t distribution under H. Homoskedasticity is one of the CLM assumptions. An important omitted variable violates
Statistical View of Least Squares
 Basic Ideas Some Examples Least Squares May 22, 2007 Basic Ideas Simple Linear Regression Basic Ideas Some Examples Least Squares Suppose we have two variables x and y Basic Ideas Simple Linear Regression
Scatter plot of data from the study. Linear Regression
 1 2 Linear Regression Scatter plot of data from the study. Consider a study to relate birthweight to the estriol level of pregnant women. The data is below. i Weight (g / 100) i Weight (g / 100) 1 7 25
Econometrics - 30C00200
 Econometrics - 30C00200 Lecture 11: Heteroskedasticity Antti Saastamoinen VATT Institute for Economic Research Fall 2015 30C00200 Lecture 11: Heteroskedasticity 12.10.2015 Aalto University School of Business
Multiple Linear Regression
 Multiple Linear Regression ST 430/514 Recall: a regression model describes how a dependent variable (or response) Y is affected, on average, by one or more independent variables (or factors, or covariates).
Inference for Regression
 Inference for Regression Section 9.4 Cathy Poliak, Ph.D. cathy@math.uh.edu Office in Fleming 11c Department of Mathematics University of Houston Lecture 13b - 3339 Cathy Poliak, Ph.D. cathy@math.uh.edu
Large Sample Properties & Simulation
 Large Sample Properties & Simulation Quantitative Microeconomics R. Mora Department of Economics Universidad Carlos III de Madrid Outline Large Sample Properties (W App. C3) 1 Large Sample Properties (W
Using regression to study economic relationships is called econometrics. econo = of or pertaining to the economy. metrics = measurement
 EconS 450 Forecasting part 3 Forecasting with Regression Using regression to study economic relationships is called econometrics econo = of or pertaining to the economy metrics = measurement Econometrics
Applied Regression Analysis
 Applied Regression Analysis Chapter 3 Multiple Linear Regression Hongcheng Li April, 6, 2013 Recall simple linear regression 1 Recall simple linear regression 2 Parameter Estimation 3 Interpretations of