Interval Estimation (Confidence Interval = C.I.): An interval estimate of some population parameter is an interval of the form (, ),
|
|
|
- Theodora Harrell
- 5 years ago
- Views:
Transcription
1 Cofidece Iterval
2 Estimatio Problems Suppose we have a populatio with some ukow parameter(s). Example: Normal(,) ad are parameters. We eed to draw coclusios (make ifereces) about the ukow parameters. We select samples, compute some statistics, ad make ifereces about the ukow parameters based o the samplig distributios of the statistics. Statistical Iferece (1) Estimatio of the parameters Poit Estimatio Iterval Estimatio (Cofidece Iterval) () Tests of hypotheses about the parameters
3 Classical Methods of Estimatio: Poit Estimatio: A poit estimate of some populatio parameter is a sigle valueˆ of a statistic ˆ. For example, the value of the statistic computed from a sample of size is a poit estimate of the populatio mea. x Iterval Estimatio (Cofidece Iterval = C.I.): A iterval estimate of some populatio parameter is a iterval of the form (, ), i.e, ˆL <<. This iterval cotais the true value of "with probability 1", that is P( ˆL << ˆU )=1 ˆU ˆ L ˆ U

4 Example of Poit Estimatio
5 Iterval Estimatio (Cofidece Iterval) of the Mea (): If i1 i / is the sample mea of a radom sample of size from a populatio (distributio) with mea ad kow variace, the a (1)100% cofidece iterval for ca be calculated as follows depedig o whether the populatio variace is kow or ot.
6 ), ( where is the -value leavig a area of / to the right; i.e., P(> )=/, or equivaletly, P(< )=1/. Note: We are (1)100% cofidet that ), ( (i) First Case: is kow: The value is called the -score ad the test is called the -test
7 Example The average zic cocetratio recorded from a sample of zic measuremets i 36 differet locatios is foud to be.6 gram/milliliter. Fid a 95% ad 99% cofidece iterval (C.I.) for the mea zic cocetratio i the river. Assume that the populatio stadard deviatio is 0.3. Solutio: = the mea zic cocetratio i the river. Populatio Sample =?? =36 =0.3 =.6 First, a poit estimate for is =.6. (a) We wat to fid 95% C.I. for. =?? 95% = (1)100% = (1) =0.05 / = 0.05
8 = 0.05 = 1.96 A 95% C.I. for is (1.96).6 (1.96) < < < <.698 (.50,.698) We are 95% cofidet that (.50,.698).
9
10 (b) Similarly, we ca fid that a 99% C.I. for is.471 < <.79 (.471,.79) We are 99% cofidet that (.471,.79) Notice that a 99% C.I. is wider that a 95% C.I. This is a tradeoff betwee accuracy ad precisio Theorem If is used as a estimate of, we ca the be (1)100% cofidet that the error (i estimatio) will ot exceed
11 Example: I previous example, we are 95% cofidet that the sample mea differs from the true mea by a amout less tha.6 (1.96) Note: Let e be the maximum amout of the error, that is e, the: e e e Theorem : If is used as a estimate of, we ca the be (1)100% cofidet that the error (i estimatio) will ot exceed a specified amout e whe the sample size is e
12 Example How large a sample is required i previous example if we wat to be 95% cofidet that our estimate of is off by less tha 0.05? Solutio: We have = 0.3, e=0.05. The by Theorem, e 0.05 Therefore, we ca be 95% cofidet that a radom sample of size =139 will provide a estimate differig from by a amout less tha e=0.05.
13 t-distributio: Recall that, if 1,,, is a radom sample of size from a ormal distributio with mea ad variace, i.e. N(,), the / ~ N(0,1) We ca apply this result oly whe is kow ad umber of samples is 30 or more! If is ukow, we replace the populatio variace with the ( ) sample variace 1 i i S to have the followig statistic 1 T S /
14 Result: If 1,,, is a radom sample of size from a ormal distributio with mea ad variace, i.e. N(,), the the statistic T S / has a t-distributio with =1degrees of freedom (df), ad we write T~ t(). Note: t-distributio is a cotiuous distributio. The shape of t-distributio is similar to the shape of the stadard ormal distributio.
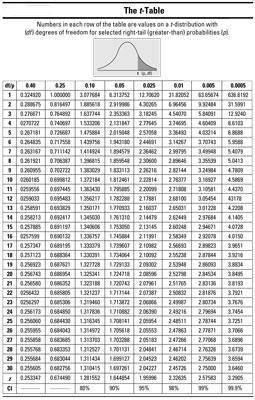
15 t = The t-value above which we fid a area equal to, that is P(T> t ) = Sice the curve of the pdf of T~ t() is symmetric about 0, we have t 1 = t Values of t are tabulated i Tables.
16
17 of: Example: Fid the t-value with =14 (df) that leaves a area (a) (b) 0.95 to the left to the right. Solutio: = 14 (df); T~ t(14) (a) The t-value that leaves a area of 0.95 to the left is t 0.05 = 1.761
18 (b) The t-value that leaves a area of 0.95 to the right is t 0.95 = t = t 0.05 = 1.761
19 Example: For = 10 degrees of freedom (df), fid t 0.10 ad t Solutio: t 0.10 = 1.37 t 0.85 = t = t 0.15 = (t 0.15 = 1.093)
20 If ad are the sample mea ad the sample stadard deviatio of a radom sample of size from a ormal populatio (distributio) with ukow variace, the a (1)100% cofidece iterval for is : i i / 1 i i S 1 1) /( ) ( Result: ), ( S t S t S t S t S t Iterval Estimatio (Cofidece Iterval) of the Mea (): (ii) Secod Case: is ukow: Recall: 1) ~ t( S/ T
21 t where is the t-value with =1 degrees of freedom leavig t a area of / to the right; i.e., P(T> )=/, or equivaletly, P(T< )=1/. t Example The cotets of 7 similar cotaiers of sulfuric acid are 9.8, 10., 10.4, 9.8, 10.0, 10., ad 9.6 liters. Fid a 95% C.I. for the mea of all such cotaiers, assumig a approximate ormal distributio. Solutio:.=7 i / 10.0 S ( ) /( 1) i1 i1 First, a poit estimate for is i / i1 i
22 Now, we eed to fid a cofidece iterval for. =?? 95%=(1)100% 0. 95=(1) =0.05 /=0.05 = t 0.05 =.447 (with =1=6 degrees of freedom) t A 95% C.I. for is t S S t t (.447) 7 S < < < < 10.6 ( 9.74, 10.6) We are 95% cofidet that ( 9.74, 10.6) (.447) 7
23 Estimatio of the Mea (): Recall: E ( ) Var( ) ~ N, / T S/ ~ N(0,1) ~ t( 1) ( is kow) We use the samplig distributio of ifereces about. ( is ukow) to make
(7 One- and Two-Sample Estimation Problem )
") 34 Stat Lecture Notes (7 Oe- ad Two-Sample Estimatio Problem ) ( Book*: Chapter 8,pg65) Probability& Statistics for Egieers & Scietists By Walpole, Myers, Myers, Ye Estimatio 1 ) ( ˆ S P i i Poit estimate:
34 Stat Lecture Notes (7 Oe- ad Two-Sample Estimatio Problem ) ( Book*: Chapter 8,pg65) Probability& Statistics for Egieers & Scietists By Walpole, Myers, Myers, Ye Estimatio 1 ) ( ˆ S P i i Poit estimate:
Common Large/Small Sample Tests 1/55
 Commo Large/Small Sample Tests 1/55 Test of Hypothesis for the Mea (σ Kow) Covert sample result ( x) to a z value Hypothesis Tests for µ Cosider the test H :μ = μ H 1 :μ > μ σ Kow (Assume the populatio
BIOS 4110: Introduction to Biostatistics. Breheny. Lab #9
 BIOS 4110: Itroductio to Biostatistics Brehey Lab #9 The Cetral Limit Theorem is very importat i the realm of statistics, ad today's lab will explore the applicatio of it i both categorical ad cotiuous
7-1. Chapter 4. Part I. Sampling Distributions and Confidence Intervals
 7-1 Chapter 4 Part I. Samplig Distributios ad Cofidece Itervals 1 7- Sectio 1. Samplig Distributio 7-3 Usig Statistics Statistical Iferece: Predict ad forecast values of populatio parameters... Test hypotheses
Topic 9: Sampling Distributions of Estimators
 Topic 9: Samplig Distributios of Estimators Course 003, 2016 Page 0 Samplig distributios of estimators Sice our estimators are statistics (particular fuctios of radom variables), their distributio ca be
Inferential Statistics. Inference Process. Inferential Statistics and Probability a Holistic Approach. Inference Process.
 Iferetial Statistics ad Probability a Holistic Approach Iferece Process Chapter 8 Poit Estimatio ad Cofidece Itervals This Course Material by Maurice Geraghty is licesed uder a Creative Commos Attributio-ShareAlike
Statistical Inference (Chapter 10) Statistical inference = learn about a population based on the information provided by a sample.
 Statistical inference = learn about a population based on the information provided by a sample.") Statistical Iferece (Chapter 10) Statistical iferece = lear about a populatio based o the iformatio provided by a sample. Populatio: The set of all values of a radom variable X of iterest. Characterized
Statistical Iferece (Chapter 10) Statistical iferece = lear about a populatio based o the iformatio provided by a sample. Populatio: The set of all values of a radom variable X of iterest. Characterized
Expectation and Variance of a random variable
 Chapter 11 Expectatio ad Variace of a radom variable The aim of this lecture is to defie ad itroduce mathematical Expectatio ad variace of a fuctio of discrete & cotiuous radom variables ad the distributio
Statistical Intervals for a Single Sample
 3/5/06 Applied Statistics ad Probability for Egieers Sixth Editio Douglas C. Motgomery George C. Ruger Chapter 8 Statistical Itervals for a Sigle Sample 8 CHAPTER OUTLINE 8- Cofidece Iterval o the Mea
Topic 9: Sampling Distributions of Estimators
 Topic 9: Samplig Distributios of Estimators Course 003, 2018 Page 0 Samplig distributios of estimators Sice our estimators are statistics (particular fuctios of radom variables), their distributio ca be
Topic 9: Sampling Distributions of Estimators
 Topic 9: Samplig Distributios of Estimators Course 003, 2018 Page 0 Samplig distributios of estimators Sice our estimators are statistics (particular fuctios of radom variables), their distributio ca be
Chapter 8: Estimating with Confidence
 Chapter 8: Estimatig with Cofidece Sectio 8.2 The Practice of Statistics, 4 th editio For AP* STARNES, YATES, MOORE Chapter 8 Estimatig with Cofidece 8.1 Cofidece Itervals: The Basics 8.2 8.3 Estimatig
STAT 155 Introductory Statistics Chapter 6: Introduction to Inference. Lecture 18: Estimation with Confidence
 The UNIVERSITY of NORTH CAROLINA at CHAPEL HILL STAT 155 Itroductory Statistics Chapter 6: Itroductio to Iferece Lecture 18: Estimatio with Cofidece 11/14/06 Lecture 18 1 Itroductio Statistical Iferece
Chapter 20. Comparing Two Proportions. BPS - 5th Ed. Chapter 20 1
 Chapter 0 Comparig Two Proportios BPS - 5th Ed. Chapter 0 Case Study Machie Reliability A study is performed to test of the reliability of products produced by two machies. Machie A produced 8 defective
Lecture 5. Materials Covered: Chapter 6 Suggested Exercises: 6.7, 6.9, 6.17, 6.20, 6.21, 6.41, 6.49, 6.52, 6.53, 6.62, 6.63.
 STT 315, Summer 006 Lecture 5 Materials Covered: Chapter 6 Suggested Exercises: 67, 69, 617, 60, 61, 641, 649, 65, 653, 66, 663 1 Defiitios Cofidece Iterval: A cofidece iterval is a iterval believed to
MATH/STAT 352: Lecture 15
 MATH/STAT 352: Lecture 15 Sectios 5.2 ad 5.3. Large sample CI for a proportio ad small sample CI for a mea. 1 5.2: Cofidece Iterval for a Proportio Estimatig proportio of successes i a biomial experimet
MBACATÓLICA. Quantitative Methods. Faculdade de Ciências Económicas e Empresariais UNIVERSIDADE CATÓLICA PORTUGUESA 9. SAMPLING DISTRIBUTIONS
 MBACATÓLICA Quatitative Methods Miguel Gouveia Mauel Leite Moteiro Faculdade de Ciêcias Ecoómicas e Empresariais UNIVERSIDADE CATÓLICA PORTUGUESA 9. SAMPLING DISTRIBUTIONS MBACatólica 006/07 Métodos Quatitativos
Chapter 22. Comparing Two Proportions. Copyright 2010 Pearson Education, Inc.
 Chapter 22 Comparig Two Proportios Copyright 2010 Pearso Educatio, Ic. Comparig Two Proportios Comparisos betwee two percetages are much more commo tha questios about isolated percetages. Ad they are more
Chapter 22. Comparing Two Proportions. Copyright 2010, 2007, 2004 Pearson Education, Inc.
 Chapter 22 Comparig Two Proportios Copyright 2010, 2007, 2004 Pearso Educatio, Ic. Comparig Two Proportios Read the first two paragraphs of pg 504. Comparisos betwee two percetages are much more commo
MATH 320: Probability and Statistics 9. Estimation and Testing of Parameters. Readings: Pruim, Chapter 4
 MATH 30: Probability ad Statistics 9. Estimatio ad Testig of Parameters Estimatio ad Testig of Parameters We have bee dealig situatios i which we have full kowledge of the distributio of a radom variable.
STA Learning Objectives. Population Proportions. Module 10 Comparing Two Proportions. Upon completing this module, you should be able to:
 STA 2023 Module 10 Comparig Two Proportios Learig Objectives Upo completig this module, you should be able to: 1. Perform large-sample ifereces (hypothesis test ad cofidece itervals) to compare two populatio
HYPOTHESIS TESTS FOR ONE POPULATION MEAN WORKSHEET MTH 1210, FALL 2018
 HYPOTHESIS TESTS FOR ONE POPULATION MEAN WORKSHEET MTH 1210, FALL 2018 We are resposible for 2 types of hypothesis tests that produce ifereces about the ukow populatio mea, µ, each of which has 3 possible
Chapter 6 Sampling Distributions
 Chapter 6 Samplig Distributios 1 I most experimets, we have more tha oe measuremet for ay give variable, each measuremet beig associated with oe radomly selected a member of a populatio. Hece we eed to
Mathacle. PSet Stats, Concepts In Statistics Level Number Name: Date:
 PSet ----- Stats, Cocepts I Statistics 7.3. Cofidece Iterval for a Mea i Oe Sample [MATH] The Cetral Limit Theorem. Let...,,, be idepedet, idetically distributed (i.i.d.) radom variables havig mea µ ad
Final Examination Solutions 17/6/2010
 The Islamic Uiversity of Gaza Faculty of Commerce epartmet of Ecoomics ad Political Scieces A Itroductio to Statistics Course (ECOE 30) Sprig Semester 009-00 Fial Eamiatio Solutios 7/6/00 Name: I: Istructor:
UNIT 8: INTRODUCTION TO INTERVAL ESTIMATION
 STATISTICAL METHODS FOR BUSINESS UNIT 8: INTRODUCTION TO INTERVAL ESTIMATION 8..- Itroductio to iterval estimatio 8..- Cofidece itervals. Costructio ad characteristics 8.3.- Cofidece itervals for the mea
independence of the random sample measurements, we have U = Z i ~ χ 2 (n) with σ / n 1. Now let W = σ 2. We then have σ 2 (x i µ + µ x ) 2 i =1 ( )
 with σ / n 1. Now let W = σ 2. We then have σ 2 (x i µ + µ x ) 2 i =1 ( )") MATH 48 Chi-Square Aalysis of a Normal Stadard Deviatio Dr Neal, WKU We ow shall use the chi-square distriutios to aalyze the stadard deviatio of a measuremet that is kow to e ormally distriuted The proof
MATH 48 Chi-Square Aalysis of a Normal Stadard Deviatio Dr Neal, WKU We ow shall use the chi-square distriutios to aalyze the stadard deviatio of a measuremet that is kow to e ormally distriuted The proof
Continuous Data that can take on any real number (time/length) based on sample data. Categorical data can only be named or categorised
 based on sample data. Categorical data can only be named or categorised") Questio 1. (Topics 1-3) A populatio cosists of all the members of a group about which you wat to draw a coclusio (Greek letters (μ, σ, Ν) are used) A sample is the portio of the populatio selected for
Questio 1. (Topics 1-3) A populatio cosists of all the members of a group about which you wat to draw a coclusio (Greek letters (μ, σ, Ν) are used) A sample is the portio of the populatio selected for
Statistics 511 Additional Materials
 Cofidece Itervals o mu Statistics 511 Additioal Materials This topic officially moves us from probability to statistics. We begi to discuss makig ifereces about the populatio. Oe way to differetiate probability
Confidence Intervals QMET103
 Cofidece Itervals QMET103 Library, Teachig ad Learig CONFIDENCE INTERVALS provide a iterval estimate of the ukow populatio parameter. What is a cofidece iterval? Statisticias have a habit of hedgig their
MOST PEOPLE WOULD RATHER LIVE WITH A PROBLEM THEY CAN'T SOLVE, THAN ACCEPT A SOLUTION THEY CAN'T UNDERSTAND.
 XI-1 (1074) MOST PEOPLE WOULD RATHER LIVE WITH A PROBLEM THEY CAN'T SOLVE, THAN ACCEPT A SOLUTION THEY CAN'T UNDERSTAND. R. E. D. WOOLSEY AND H. S. SWANSON XI-2 (1075) STATISTICAL DECISION MAKING Advaced
Class 23. Daniel B. Rowe, Ph.D. Department of Mathematics, Statistics, and Computer Science. Marquette University MATH 1700
 Class 23 Daiel B. Rowe, Ph.D. Departmet of Mathematics, Statistics, ad Computer Sciece Copyright 2017 by D.B. Rowe 1 Ageda: Recap Chapter 9.1 Lecture Chapter 9.2 Review Exam 6 Problem Solvig Sessio. 2
Exam II Covers. STA 291 Lecture 19. Exam II Next Tuesday 5-7pm Memorial Hall (Same place as exam I) Makeup Exam 7:15pm 9:15pm Location CB 234
 Makeup Exam 7:15pm 9:15pm Location CB 234") STA 291 Lecture 19 Exam II Next Tuesday 5-7pm Memorial Hall (Same place as exam I) Makeup Exam 7:15pm 9:15pm Locatio CB 234 STA 291 - Lecture 19 1 Exam II Covers Chapter 9 10.1; 10.2; 10.3; 10.4; 10.6
STA 291 Lecture 19 Exam II Next Tuesday 5-7pm Memorial Hall (Same place as exam I) Makeup Exam 7:15pm 9:15pm Locatio CB 234 STA 291 - Lecture 19 1 Exam II Covers Chapter 9 10.1; 10.2; 10.3; 10.4; 10.6
- E < p. ˆ p q ˆ E = q ˆ = 1 - p ˆ = sample proportion of x failures in a sample size of n. where. x n sample proportion. population proportion
 1 Chapter 7 ad 8 Review for Exam Chapter 7 Estimates ad Sample Sizes 2 Defiitio Cofidece Iterval (or Iterval Estimate) a rage (or a iterval) of values used to estimate the true value of the populatio parameter
z is the upper tail critical value from the normal distribution
 Statistical Iferece drawig coclusios about a populatio parameter, based o a sample estimate. Populatio: GRE results for a ew eam format o the quatitative sectio Sample: =30 test scores Populatio Samplig
Class 27. Daniel B. Rowe, Ph.D. Department of Mathematics, Statistics, and Computer Science. Marquette University MATH 1700
 Class 7 Daiel B. Rowe, Ph.D. Departmet of Mathematics, Statistics, ad Computer Sciece Copyright 013 by D.B. Rowe 1 Ageda: Skip Recap Chapter 10.5 ad 10.6 Lecture Chapter 11.1-11. Review Chapters 9 ad 10
Overview. p 2. Chapter 9. Pooled Estimate of. q = 1 p. Notation for Two Proportions. Inferences about Two Proportions. Assumptions
 Chapter 9 Slide Ifereces from Two Samples 9- Overview 9- Ifereces about Two Proportios 9- Ifereces about Two Meas: Idepedet Samples 9-4 Ifereces about Matched Pairs 9-5 Comparig Variatio i Two Samples
1 Inferential Methods for Correlation and Regression Analysis
 1 Iferetial Methods for Correlatio ad Regressio Aalysis I the chapter o Correlatio ad Regressio Aalysis tools for describig bivariate cotiuous data were itroduced. The sample Pearso Correlatio Coefficiet
Chapter 8: STATISTICAL INTERVALS FOR A SINGLE SAMPLE. Part 3: Summary of CI for µ Confidence Interval for a Population Proportion p
 Chapter 8: STATISTICAL INTERVALS FOR A SINGLE SAMPLE Part 3: Summary of CI for µ Cofidece Iterval for a Populatio Proportio p Sectio 8-4 Summary for creatig a 100(1-α)% CI for µ: Whe σ 2 is kow ad paret
Section 9.2. Tests About a Population Proportion 12/17/2014. Carrying Out a Significance Test H A N T. Parameters & Hypothesis
 Sectio 9.2 Tests About a Populatio Proportio P H A N T O M S Parameters Hypothesis Assess Coditios Name the Test Test Statistic (Calculate) Obtai P value Make a decisio State coclusio Sectio 9.2 Tests
Chapter 8 Interval Estimation
 Iterval Estimatio Learig Objectives 1. Kow how to costruct ad iterpret a iterval estimate of a populatio mea ad / or a populatio proportio.. Uderstad ad be able to compute the margi of error. 3. Lear about
Introduction to Econometrics (3 rd Updated Edition) Solutions to Odd- Numbered End- of- Chapter Exercises: Chapter 3
 Solutions to Odd- Numbered End- of- Chapter Exercises: Chapter 3") Itroductio to Ecoometrics (3 rd Updated Editio) by James H. Stock ad Mark W. Watso Solutios to Odd- Numbered Ed- of- Chapter Exercises: Chapter 3 (This versio August 17, 014) 015 Pearso Educatio, Ic. Stock/Watso
Itroductio to Ecoometrics (3 rd Updated Editio) by James H. Stock ad Mark W. Watso Solutios to Odd- Numbered Ed- of- Chapter Exercises: Chapter 3 (This versio August 17, 014) 015 Pearso Educatio, Ic. Stock/Watso
Confidence Intervals รศ.ดร. อน นต ผลเพ ม Assoc.Prof. Anan Phonphoem, Ph.D. Intelligent Wireless Network Group (IWING Lab)
") Cofidece Itervals รศ.ดร. อน นต ผลเพ ม Assoc.Prof. Aa Phophoem, Ph.D. aa.p@ku.ac.th Itelliget Wireless Network Group (IWING Lab) http://iwig.cpe.ku.ac.th Computer Egieerig Departmet Kasetsart Uiversity,
Cofidece Itervals รศ.ดร. อน นต ผลเพ ม Assoc.Prof. Aa Phophoem, Ph.D. aa.p@ku.ac.th Itelliget Wireless Network Group (IWING Lab) http://iwig.cpe.ku.ac.th Computer Egieerig Departmet Kasetsart Uiversity,
A quick activity - Central Limit Theorem and Proportions. Lecture 21: Testing Proportions. Results from the GSS. Statistics and the General Population
 A quick activity - Cetral Limit Theorem ad Proportios Lecture 21: Testig Proportios Statistics 10 Coli Rudel Flip a coi 30 times this is goig to get loud! Record the umber of heads you obtaied ad calculate
f(x i ; ) L(x; p) = i=1 To estimate the value of that maximizes L or equivalently ln L we will set =0, for i =1, 2,...,m p x i (1 p) 1 x i i=1
 L(x; p) = i=1 To estimate the value of that maximizes L or equivalently ln L we will set =0, for i =1, 2,...,m p x i (1 p) 1 x i i=1") Parameter Estimatio Samples from a probability distributio F () are: [,,..., ] T.Theprobabilitydistributio has a parameter vector [,,..., m ] T. Estimator: Statistic used to estimate ukow. Estimate: Observed
Parameter Estimatio Samples from a probability distributio F () are: [,,..., ] T.Theprobabilitydistributio has a parameter vector [,,..., m ] T. Estimator: Statistic used to estimate ukow. Estimate: Observed
Confidence Interval for one population mean or one population proportion, continued. 1. Sample size estimation based on the large sample C.I.
 Cofidece Iterval for oe populatio mea or oe populatio proportio, cotiued 1. ample size estimatio based o the large sample C.I. for p ˆ(1 ˆ) ˆ(1 ˆ) From the iterval ˆ p p Z p ˆ, p Z p p L legh of your 100(1
STATISTICAL INFERENCE
 STATISTICAL INFERENCE POPULATION AND SAMPLE Populatio = all elemets of iterest Characterized by a distributio F with some parameter θ Sample = the data X 1,..., X, selected subset of the populatio = sample
Confidence Level We want to estimate the true mean of a random variable X economically and with confidence.
 Cofidece Iterval 700 Samples Sample Mea 03 Cofidece Level 095 Margi of Error 0037 We wat to estimate the true mea of a radom variable X ecoomically ad with cofidece True Mea μ from the Etire Populatio
AP Statistics Review Ch. 8
 AP Statistics Review Ch. 8 Name 1. Each figure below displays the samplig distributio of a statistic used to estimate a parameter. The true value of the populatio parameter is marked o each samplig distributio.
The variance of a sum of independent variables is the sum of their variances, since covariances are zero. Therefore. V (xi )= n n 2 σ2 = σ2.
= n n 2 σ2 = σ2.") SAMPLE STATISTICS A radom sample x 1,x,,x from a distributio f(x) is a set of idepedetly ad idetically variables with x i f(x) for all i Their joit pdf is f(x 1,x,,x )=f(x 1 )f(x ) f(x )= f(x i ) The sample
SAMPLE STATISTICS A radom sample x 1,x,,x from a distributio f(x) is a set of idepedetly ad idetically variables with x i f(x) for all i Their joit pdf is f(x 1,x,,x )=f(x 1 )f(x ) f(x )= f(x i ) The sample
Statistics 300: Elementary Statistics
 Statistics 300: Elemetary Statistics Sectios 7-, 7-3, 7-4, 7-5 Parameter Estimatio Poit Estimate Best sigle value to use Questio What is the probability this estimate is the correct value? Parameter Estimatio
Comparing Two Populations. Topic 15 - Two Sample Inference I. Comparing Two Means. Comparing Two Pop Means. Background Reading
 Topic 15 - Two Sample Iferece I STAT 511 Professor Bruce Craig Comparig Two Populatios Research ofte ivolves the compariso of two or more samples from differet populatios Graphical summaries provide visual
University of California, Los Angeles Department of Statistics. Hypothesis testing
 Uiversity of Califoria, Los Ageles Departmet of Statistics Statistics 100B Elemets of a hypothesis test: Hypothesis testig Istructor: Nicolas Christou 1. Null hypothesis, H 0 (claim about µ, p, σ 2, µ
Computing Confidence Intervals for Sample Data
 Computig Cofidece Itervals for Sample Data Topics Use of Statistics Sources of errors Accuracy, precisio, resolutio A mathematical model of errors Cofidece itervals For meas For variaces For proportios
Stat 421-SP2012 Interval Estimation Section
 Stat 41-SP01 Iterval Estimatio Sectio 11.1-11. We ow uderstad (Chapter 10) how to fid poit estimators of a ukow parameter. o However, a poit estimate does ot provide ay iformatio about the ucertaity (possible
Module 1 Fundamentals in statistics
 Normal Distributio Repeated observatios that differ because of experimetal error ofte vary about some cetral value i a roughly symmetrical distributio i which small deviatios occur much more frequetly
Sampling Distributions, Z-Tests, Power
 Samplig Distributios, Z-Tests, Power We draw ifereces about populatio parameters from sample statistics Sample proportio approximates populatio proportio Sample mea approximates populatio mea Sample variace
Big Picture. 5. Data, Estimates, and Models: quantifying the accuracy of estimates.
 5. Data, Estimates, ad Models: quatifyig the accuracy of estimates. 5. Estimatig a Normal Mea 5.2 The Distributio of the Normal Sample Mea 5.3 Normal data, cofidece iterval for, kow 5.4 Normal data, cofidece
Comparing your lab results with the others by one-way ANOVA
 Comparig your lab results with the others by oe-way ANOVA You may have developed a ew test method ad i your method validatio process you would like to check the method s ruggedess by coductig a simple
(6) Fundamental Sampling Distribution and Data Discription
 Fundamental Sampling Distribution and Data Discription") 34 Stat Lecture Notes (6) Fudametal Samplig Distributio ad Data Discriptio ( Book*: Chapter 8,pg5) Probability& Statistics for Egieers & Scietists By Walpole, Myers, Myers, Ye 8.1 Radom Samplig: Populatio:
34 Stat Lecture Notes (6) Fudametal Samplig Distributio ad Data Discriptio ( Book*: Chapter 8,pg5) Probability& Statistics for Egieers & Scietists By Walpole, Myers, Myers, Ye 8.1 Radom Samplig: Populatio:
Chapter 6 Part 5. Confidence Intervals t distribution chi square distribution. October 23, 2008
 Chapter 6 Part 5 Cofidece Itervals t distributio chi square distributio October 23, 2008 The will be o help sessio o Moday, October 27. Goal: To clearly uderstad the lik betwee probability ad cofidece
Lesson 2. Projects and Hand-ins. Hypothesis testing Chaptre 3. { } x=172.0 = 3.67
 Lesso 7--7 Chaptre 3 Projects ad Had-is Project I: latest ovember Project I: latest december Laboratio Measuremet systems aalysis I: latest december Project - are volutary. Laboratio is obligatory. Give
Frequentist Inference
 Frequetist Iferece The topics of the ext three sectios are useful applicatios of the Cetral Limit Theorem. Without kowig aythig about the uderlyig distributio of a sequece of radom variables {X i }, for
CONFIDENCE INTERVALS STUDY GUIDE
 CONFIDENCE INTERVALS STUDY UIDE Last uit, we discussed how sample statistics vary. Uder the right coditios, sample statistics like meas ad proportios follow a Normal distributio, which allows us to calculate
Statistical Inference Procedures
 Statitical Iferece Procedure Cofidece Iterval Hypothei Tet Statitical iferece produce awer to pecific quetio about the populatio of iteret baed o the iformatio i a ample. Iferece procedure mut iclude a
Lecture 7: Non-parametric Comparison of Location. GENOME 560, Spring 2016 Doug Fowler, GS
 Lecture 7: No-parametric Compariso of Locatio GENOME 560, Sprig 2016 Doug Fowler, GS (dfowler@uw.edu) 1 Review How ca we set a cofidece iterval o a proportio? 2 Review How ca we set a cofidece iterval
Chapter 6 Principles of Data Reduction
 Chapter 6 for BST 695: Special Topics i Statistical Theory. Kui Zhag, 0 Chapter 6 Priciples of Data Reductio Sectio 6. Itroductio Goal: To summarize or reduce the data X, X,, X to get iformatio about a
This chapter focuses on two experimental designs that are crucial to comparative studies: (1) independent samples and (2) matched pair samples.
 independent samples and (2) matched pair samples.") Chapter 9 & : Comparig Two Treatmets: This chapter focuses o two eperimetal desigs that are crucial to comparative studies: () idepedet samples ad () matched pair samples Idepedet Radom amples from Two
Chapter 9 & : Comparig Two Treatmets: This chapter focuses o two eperimetal desigs that are crucial to comparative studies: () idepedet samples ad () matched pair samples Idepedet Radom amples from Two
MIT : Quantitative Reasoning and Statistical Methods for Planning I
 MIT 11.220 Sprig 06 Recitatio 4 March 16, 2006 MIT - 11.220: Quatitative Reasoig ad Statistical Methods for Plaig I Recitatio #4: Sprig 2006 Cofidece Itervals ad Hypothesis Testig I. Cofidece Iterval 1.
April 18, 2017 CONFIDENCE INTERVALS AND HYPOTHESIS TESTING, UNDERGRADUATE MATH 526 STYLE
 April 18, 2017 CONFIDENCE INTERVALS AND HYPOTHESIS TESTING, UNDERGRADUATE MATH 526 STYLE TERRY SOO Abstract These otes are adapted from whe I taught Math 526 ad meat to give a quick itroductio to cofidece
Stat 225 Lecture Notes Week 7, Chapter 8 and 11
 Normal Distributio Stat 5 Lecture Notes Week 7, Chapter 8 ad Please also prit out the ormal radom variable table from the Stat 5 homepage. The ormal distributio is by far the most importat distributio
Discrete Mathematics for CS Spring 2008 David Wagner Note 22
 CS 70 Discrete Mathematics for CS Sprig 2008 David Wager Note 22 I.I.D. Radom Variables Estimatig the bias of a coi Questio: We wat to estimate the proportio p of Democrats i the US populatio, by takig
Lecture 6 Chi Square Distribution (χ 2 ) and Least Squares Fitting
 and Least Squares Fitting") Lecture 6 Chi Square Distributio (χ ) ad Least Squares Fittig Chi Square Distributio (χ ) Suppose: We have a set of measuremets {x 1, x, x }. We kow the true value of each x i (x t1, x t, x t ). We would
Lecture 6 Chi Square Distributio (χ ) ad Least Squares Fittig Chi Square Distributio (χ ) Suppose: We have a set of measuremets {x 1, x, x }. We kow the true value of each x i (x t1, x t, x t ). We would
Direction: This test is worth 250 points. You are required to complete this test within 50 minutes.
 Term Test October 3, 003 Name Math 56 Studet Number Directio: This test is worth 50 poits. You are required to complete this test withi 50 miutes. I order to receive full credit, aswer each problem completely
CHAPTER 8 FUNDAMENTAL SAMPLING DISTRIBUTIONS AND DATA DESCRIPTIONS. 8.1 Random Sampling. 8.2 Some Important Statistics
 CHAPTER 8 FUNDAMENTAL SAMPLING DISTRIBUTIONS AND DATA DESCRIPTIONS 8.1 Radom Samplig The basic idea of the statistical iferece is that we are allowed to draw ifereces or coclusios about a populatio based
Chapters 5 and 13: REGRESSION AND CORRELATION. Univariate data: x, Bivariate data (x,y).
.") Chapters 5 ad 13: REGREION AND CORRELATION (ectios 5.5 ad 13.5 are omitted) Uivariate data: x, Bivariate data (x,y). Example: x: umber of years studets studied paish y: score o a proficiecy test For each
Chapters 5 ad 13: REGREION AND CORRELATION (ectios 5.5 ad 13.5 are omitted) Uivariate data: x, Bivariate data (x,y). Example: x: umber of years studets studied paish y: score o a proficiecy test For each
Chapter 6. Sampling and Estimation
 Samplig ad Estimatio - 34 Chapter 6. Samplig ad Estimatio 6.. Itroductio Frequetly the egieer is uable to completely characterize the etire populatio. She/he must be satisfied with examiig some subset
Econ 325 Notes on Point Estimator and Confidence Interval 1 By Hiro Kasahara
 Poit Estimator Eco 325 Notes o Poit Estimator ad Cofidece Iterval 1 By Hiro Kasahara Parameter, Estimator, ad Estimate The ormal probability desity fuctio is fully characterized by two costats: populatio
Lecture 6 Chi Square Distribution (χ 2 ) and Least Squares Fitting
 and Least Squares Fitting") Lecture 6 Chi Square Distributio (χ ) ad Least Squares Fittig Chi Square Distributio (χ ) Suppose: We have a set of measuremets {x 1, x, x }. We kow the true value of each x i (x t1, x t, x t ). We would
Lecture 6 Chi Square Distributio (χ ) ad Least Squares Fittig Chi Square Distributio (χ ) Suppose: We have a set of measuremets {x 1, x, x }. We kow the true value of each x i (x t1, x t, x t ). We would
Estimation of a population proportion March 23,
 1 Social Studies 201 Notes for March 23, 2005 Estimatio of a populatio proportio Sectio 8.5, p. 521. For the most part, we have dealt with meas ad stadard deviatios this semester. This sectio of the otes
Statistics 20: Final Exam Solutions Summer Session 2007
 1. 20 poits Testig for Diabetes. Statistics 20: Fial Exam Solutios Summer Sessio 2007 (a) 3 poits Give estimates for the sesitivity of Test I ad of Test II. Solutio: 156 patiets out of total 223 patiets
Working with Two Populations. Comparing Two Means
 Workig with Two Populatios Comparig Two Meas Coditios for Two-Sample Iferece The data are from two radom samples from two distict idepedet populatios. Normality. Two sample t procedures are more robust
Stat 200 -Testing Summary Page 1
 Stat 00 -Testig Summary Page 1 Mathematicias are like Frechme; whatever you say to them, they traslate it ito their ow laguage ad forthwith it is somethig etirely differet Goethe 1 Large Sample Cofidece
Simulation. Two Rule For Inverting A Distribution Function
 Simulatio Two Rule For Ivertig A Distributio Fuctio Rule 1. If F(x) = u is costat o a iterval [x 1, x 2 ), the the uiform value u is mapped oto x 2 through the iversio process. Rule 2. If there is a jump
Unit 6 Estimation Week #10 - Practice Problems SOLUTIONS
 PubHlth 540 Itroductory Biostatistics Page of 7 Uit 6 Estimatio Week #0 - Practice Problems SOLUTIONS. A etomologist samples a field for egg masses of a harmful isect by placig a yardsquare frame at radom
Lecture 7: Non-parametric Comparison of Location. GENOME 560 Doug Fowler, GS
 Lecture 7: No-parametric Compariso of Locatio GENOME 560 Doug Fowler, GS (dfowler@uw.edu) 1 Review How ca we set a cofidece iterval o a proportio? 2 What do we mea by oparametric? 3 Types of Data A Review
2 1. The r.s., of size n2, from population 2 will be. 2 and 2. 2) The two populations are independent. This implies that all of the n1 n2
 The two populations are independent. This implies that all of the n1 n2") Chapter 8 Comparig Two Treatmets Iferece about Two Populatio Meas We wat to compare the meas of two populatios to see whether they differ. There are two situatios to cosider, as show i the followig examples:
Chapter 8 Comparig Two Treatmets Iferece about Two Populatio Meas We wat to compare the meas of two populatios to see whether they differ. There are two situatios to cosider, as show i the followig examples:
Statistical inference: example 1. Inferential Statistics
 Statistical iferece: example 1 Iferetial Statistics POPULATION SAMPLE A clothig store chai regularly buys from a supplier large quatities of a certai piece of clothig. Each item ca be classified either
Statistics. Chapter 10 Two-Sample Tests. Copyright 2013 Pearson Education, Inc. publishing as Prentice Hall. Chap 10-1
 Statistics Chapter 0 Two-Sample Tests Copyright 03 Pearso Educatio, Ic. publishig as Pretice Hall Chap 0- Learig Objectives I this chapter, you lear How to use hypothesis testig for comparig the differece
Stat 319 Theory of Statistics (2) Exercises
 Exercises") Kig Saud Uiversity College of Sciece Statistics ad Operatios Research Departmet Stat 39 Theory of Statistics () Exercises Refereces:. Itroductio to Mathematical Statistics, Sixth Editio, by R. Hogg, J.
Kig Saud Uiversity College of Sciece Statistics ad Operatios Research Departmet Stat 39 Theory of Statistics () Exercises Refereces:. Itroductio to Mathematical Statistics, Sixth Editio, by R. Hogg, J.
Direction: This test is worth 150 points. You are required to complete this test within 55 minutes.
 Term Test 3 (Part A) November 1, 004 Name Math 6 Studet Number Directio: This test is worth 10 poits. You are required to complete this test withi miutes. I order to receive full credit, aswer each problem
STATISTICAL PROPERTIES OF LEAST SQUARES ESTIMATORS. Comments:
 Recall: STATISTICAL PROPERTIES OF LEAST SQUARES ESTIMATORS Commets:. So far we have estimates of the parameters! 0 ad!, but have o idea how good these estimates are. Assumptio: E(Y x)! 0 +! x (liear coditioal
Sample questions. 8. Let X denote a continuous random variable with probability density function f(x) = 4x 3 /15 for
 = 4x 3 /15 for") Sample questios Suppose that humas ca have oe of three bloodtypes: A, B, O Assume that 40% of the populatio has Type A, 50% has type B, ad 0% has Type O If a perso has type A, the probability that they
Sample questios Suppose that humas ca have oe of three bloodtypes: A, B, O Assume that 40% of the populatio has Type A, 50% has type B, ad 0% has Type O If a perso has type A, the probability that they
Mathacle. PSet Stats, Concepts In Statistics Level Number Name: Date: Confidence Interval Guesswork with Confidence
 PSet ----- Stats, Cocepts I Statistics Cofidece Iterval Guesswork with Cofidece VII. CONFIDENCE INTERVAL 7.1. Sigificace Level ad Cofidece Iterval (CI) The Sigificace Level The sigificace level, ofte deoted
Properties and Hypothesis Testing
 Chapter 3 Properties ad Hypothesis Testig 3.1 Types of data The regressio techiques developed i previous chapters ca be applied to three differet kids of data. 1. Cross-sectioal data. 2. Time series data.
Sample Size Determination (Two or More Samples)
") Sample Sie Determiatio (Two or More Samples) STATGRAPHICS Rev. 963 Summary... Data Iput... Aalysis Summary... 5 Power Curve... 5 Calculatios... 6 Summary This procedure determies a suitable sample sie
Sample Sie Determiatio (Two or More Samples) STATGRAPHICS Rev. 963 Summary... Data Iput... Aalysis Summary... 5 Power Curve... 5 Calculatios... 6 Summary This procedure determies a suitable sample sie
Rule of probability. Let A and B be two events (sets of elementary events). 11. If P (AB) = P (A)P (B), then A and B are independent.
. 11. If P (AB) = P (A)P (B), then A and B are independent.") Percetile: the αth percetile of a populatio is the value x 0, such that P (X x 0 ) α% For example the 5th is the x 0, such that P (X x 0 ) 5% 05 Rule of probability Let A ad B be two evets (sets of elemetary
Percetile: the αth percetile of a populatio is the value x 0, such that P (X x 0 ) α% For example the 5th is the x 0, such that P (X x 0 ) 5% 05 Rule of probability Let A ad B be two evets (sets of elemetary
KLMED8004 Medical statistics. Part I, autumn Estimation. We have previously learned: Population and sample. New questions
 We have previously leared: KLMED8004 Medical statistics Part I, autum 00 How kow probability distributios (e.g. biomial distributio, ormal distributio) with kow populatio parameters (mea, variace) ca give
Tests of Hypotheses Based on a Single Sample (Devore Chapter Eight)
") Tests of Hypotheses Based o a Sigle Sample Devore Chapter Eight MATH-252-01: Probability ad Statistics II Sprig 2018 Cotets 1 Hypothesis Tests illustrated with z-tests 1 1.1 Overview of Hypothesis Testig..........
Tests of Hypotheses Based o a Sigle Sample Devore Chapter Eight MATH-252-01: Probability ad Statistics II Sprig 2018 Cotets 1 Hypothesis Tests illustrated with z-tests 1 1.1 Overview of Hypothesis Testig..........
1.010 Uncertainty in Engineering Fall 2008
 MIT OpeCourseWare http://ocw.mit.edu.00 Ucertaity i Egieerig Fall 2008 For iformatio about citig these materials or our Terms of Use, visit: http://ocw.mit.edu.terms. .00 - Brief Notes # 9 Poit ad Iterval