Universities of Leeds, Sheffield and York
|
|
|
- Cody Barnett
- 5 years ago
- Views:
Transcription
1 promoting access to White Rose research papers Universities of Leeds, Sheffield and York This is an author produced version of a paper published in Computers & Fluids White Rose Research Online URL for this paper: Published paper Barber, S., Chin, S.B., and Carré, M.J. Sports ball aerodynamics: A numerical study of the erratic motion of soccer balls. Computers and Fluids, 38, 6 (2009), White Rose Research Online eprints@whiterose.ac.uk
2 Sports ball aerodynamics: a numerical study of the erratic motion of soccer balls S. Barber, S.B. Chin and M.J. Carré Department of Mechanical Engineering, University of Sheffield, S1 3JD, UK +44(0) barbers@ethz.ch, s.b.chin@shef.ac.uk, m.j.carre@shef.ac.uk The application of the commercial CFD code, FLUENT, to sports ball aerodynamics was assessed and a validated 3D analysis technique was established for balls that have been scanned with a 3D laser scanner or drawn in CAD. The technique was used to examine the effects of surface geometry on the aerodynamic behaviour of soccer balls by comparing the flow around different balls and predicting the aerodynamic force coefficients. The validation process included performing CFD studies on 3D smooth spheres and various soccer balls, and comparing the results to wind tunnel tests and flow visualisation. The CFD technique used a surface wrapping meshing method and the Reynolds-Averaged Navier- Stokes approach with the realizable k-ε turbulence model, which was found to be able to predict the drag, lift and side force coefficients (C D, C L and C S ) reliably, to compare the wake behaviour, and to give good pressure distributions near the stagnation point. The main limitations of the technique with the available computational resources were its inability to accurately predict boundary layer transition or growth, but despite this, several conclusions could be drawn regarding soccer ball aerodynamics. C D was not significantly different between balls. C L and C S were found to be significantly affected by the orientation of the ball relative to its direction of travel, meaning that balls kicked with low amounts of spin could experience quasi-steady lift and side forces and move erratically from side-to-side or up and down through the air. For different balls, C D, C L and C S were predicted and their variation with orientation entered into a modified trajectory simulation program. The erratic nature of this type of kick was found to vary with details of the surface geometry including seam size, panel symmetry, number, frequency and pattern, as well as the velocity and spin applied to the ball by the player. Exploitation of this phenomenon by players and ball designers could have a significant impact on the game. Keywords: Football, soccer, CFD, aerodynamics, drag, sports balls
3 Nomenclature ρvd Re = Reynolds number µ rω Sp = Spin parameter v D = Drag coefficient 1 2 ρv A CD 2 C L C S Lift coefficient Side force coefficient v Velocity [m/s] d Ball diameter [m] r Ball radius [m] ρ Density [kg/m 3 ] A Ball cross-sectional area [m 2 ] D Drag force [N] µ Dynamic viscosity [Pa s] y + y plus value ω Spin rate [rad/s]
4 1. Introduction 1.1 Background The flight of a ball through the air is a key part of many popular sports, and gaining an understanding of the aerodynamics can help equipment designers, players, coaches and game regulators and make the game more interesting for the fans. Soccer is widely regarded as the most popular sport in the world, and the exact speed, swerve or dip of a soccer ball can be match-deciding. Recent developments in soccer ball manufacturing technologies have led to the possibility of radical changes in surface geometry and seam configurations, and the consequences of such changes can only be fully predicted if the aerodynamic behaviour is understood. A number of wind tunnel tests, flow visualisation and numerical studies have been undertaken on both smooth and rough non-spinning spheres at a high Re relevant to soccer balls. These include drag coefficient (C D ) measurements by Achenbach [1, 2], wake flow visualisation with smoke and tufts in a wind tunnel by Taneda [3], and RANS and LES computations by Jindal et al. [4] and Constantinescu et al. [5]. The behaviour of smooth spheres at high Re is well-documented. However, relatively few CFD studies have been undertaken on sports balls due to the required computational power, difficulty of meshing and perhaps a previous lack of demand for a highly detailed understanding. 3D qualitative CFD analysis was carried out on a non-spinning cricket ball for both laminar and turbulent flow (using ANSYS FLOTRAN with the standard k-ε turbulence model) by Penrose et al. [6] and on a rotating baseball (using an in-house code for the laminar regime only) by Himeno [7].
5 Various CFD studies on spinning golf balls have been carried out using FLUENT. One set of studies by Ting [8-10] used a rather small flow domain (dimensions of m and only approximately unstructured tetrahedral cells) and the Spalart-Allmaras turbulence model, which showed reasonable C D agreement for laminar solutions and allowed qualitative wake structure comparisons to be made for turbulent solutions for spinning balls; another by Aoki et al. [11] produced results that were only over-predicted by approximately 5% when compared to experimental data (using LES with a grid that had dimensions m and contained about 1 million unstructured cells in total). Additionally, simulation of the 3D flow around dimpled cylinders by Kim et al. [12] predicted a reasonable C D for lower Reynolds number, Re, (getting towards transition) but too high for higher Re (using an in-house code with the Spalart-Allmaras turbulence model on a grid that contained approximately 2.4 million tetrahedral and prism elements). There is no consensus yet as to the most appropriate CFD technique for modelling sports ball aerodynamics, therefore this work covered a thorough consideration of the available meshing and modelling techniques. 1.2 Aims The aims of this study were to assess the use of FLUENT as a tool for modelling the aerodynamic behaviour of sports balls (within the limits provided by the computational resources available), to establish a validated 3D technique for the analysis of soccer balls in FLUENT, and then to use the technique to help understand the aerodynamics of soccer balls and the effects of surface geometry on their trajectories.
6 1.3 Resources and limitations The commercially-available CFD software, FLUENT Version 6.2, and its preprocessing components, GAMBIT and TGRID4, were available for use in this study. The computational resources available to the study meant that, in practical terms, grid sizes were limited to approximately 9 million cells, but at this size they were slow to produce, manipulate and transfer, and file storage space was limited. Solutions typically took 2-4 days to reach full convergence using the steady-state RANS equations (parallel processing, shared server). These limitations required the assumption of a fully turbulent boundary layer. In a previous study, Barber et al. [13] found that laminar to turbulent transition occurs at Re for soccer balls, corresponding to v m/s. The type of free-kick studied in this work is the low-spin, high-velocity kick that is generally launched at a velocity of m/s, which is well into the turbulent flow regime. An in-house trajectory simulation programme developed by Carré et al. [14] showed that a ball launched at this velocity slows to approximately 21 m/s by the end of its flight, which is still in the turbulent regime. Hence it was deemed valid for this study to assume that the flow was always fully turbulent. The computational limitations required the use of the steady-state Reynolds Averages Navier-Stokes (RANS) approach. It was thought that over the range of Re experienced by the flow around a football (~10 6 ), unsteady effects would be of secondary importance, and hence the aerodynamic coefficients would be largely unaffected by this and a steady state flow analysis would provide useful information at relatively low computational cost.
7 Additionally, the constraints required the use of a hybrid meshing technique and the study of non-spinning balls only. 2. Validation A large part of this study involved the validation procedure, which is given in detail by Barber [15]. Studies were undertaken in order to become familiar with the FLUENT software and with the physics of the flow, and to assess the use of FLUENT as a tool for analysing sports ball aerodynamics. The geometry was made progressively more complex, and solutions were continuously compared to experimental results for validation purposes. The studies included a 3D smooth sphere, the CAD geometry of a scale model soccer ball and a scanned soccer ball. The study culminated in the production of a preferred CFD methodology for the 3D analysis of soccer ball aerodynamics in FLUENT, which uses the realizable k-ε turbulence model, a surface wrapping meshing technique and a hybrid mesh mainly consisting of 3D structured hexahedral elements with a near-wall cell size of 0.01 mm. 2.1 Mesh design For each study, the following aspects were taken into consideration: Domain size: The domain must be large enough to ensure that its outer surfaces have minimal effect on the flow. Placing the surface of the ball, diameter d, at 5d from the inlet, 20d from the outlet and 5d from the sides of the domain was found to be sufficient.
8 Near-wall cell size: The required size of the first cell at the surface of the ball was dictated by the chosen method of modelling near the wall. For the soccer balls, enhanced wall treatment was used, and to obtain sufficient accuracy to model the boundary layer and resolve the viscous sub-layer, y + was required to be approximately equal to 1 (y + represents a non-dimensional wall distance that is used to define different sections of a boundary layer). Cell skewness: Cell skewness is a measure of grid quality, and is measured between 0 and 1, where skewness = 0 indicates an equiangular cell, is excellent, is good, is fair, is poor, is very poor and 1 is degenerate. According to the FLUENT user guide [16] a general guide is to try and keep the skewness of all cells below Cell aspect ratio: Cell aspect ratio is another measure of grid quality, and a general rule-of-thumb specified in the FLUENT user guide is to keep the aspect ratio of all the cells in the grid below 5; however it is said to be acceptable for the value to reach 10 in regions aligned with the flow. Boundary conditions: For each case, the outlet was specified as an outflow, and the inlet defined by the fluid velocity. The surface of the geometry was defined as a noslip wall, and the far field boundaries of the solution domain were defined as a slipwall, i.e., a wall with zero shear stress.
9 To alter Re over the required range, the velocity was altered between 10 and 30 m/s and the fluid viscosity was altered between and kg/ms, which was necessary to keep y + down as the velocity increased. Density was kept constant at kg/m 3. The turbulence intensity (the ratio of the root-mean-square of the velocity fluctuations to the mean flow velocity) and length scale (a physical quantity related to the size of the large eddies that contain the energy in turbulent flows, defined as 0.07 duct width [16]) at the inlet were set to 0.1% and 0.07 m, respectively, to match the wind tunnel conditions for comparison purposes. The exact value of turbulence intensity was initially varied from about 10% to 0.1%, and appeared to have very little effect on the results. Convergence was monitored with strict residual criteria of 10-5 and force coefficient monitoring. For each study, C D was predicted at a range of Re in the super- and trans-critical regimes, and details of the flow were compared to those of corresponding experimental results. Only the highest Re tested was expected to correspond to a fullyturbulent boundary layer the lower simulations were undertaken in order to observe trends and Re-dependency. 2.2 Summary of validation For each type of geometry that was analysed, a grid dependency study and a turbulence model study was undertaken. The procedure is summarised here. The drag results were compared to wind tunnel force measurements and the wake structure to experimental flow visualisation. The basic mesh structure, containing structured 3D quadrilateral cells, was the same for every study and is illustrated in Figure 1. A table summarizing the C D results compared to experiment for each study
10 and turbulence model is shown in Table 1. These ranges are very high due to the general difficulties of separation point prediction in the RANS approach and the very high sensitivity of C D on the separation position. The most suitable turbulence model for each application is highlighted with a star in the table. The optimum solver details for each case are summarised in Table 2. Experimental C D vs. Re results for a smooth sphere and various soccer balls (pictured in Figure 2) are shown in Figure 3. In general, a large drop in C D is seen at a certain Re, when the boundary layer transitions from laminar to turbulent flow. C D reaches a minimum (C Dmin ) at the critical Reynolds number (Re crit ), when turbulent boundary layer separation first occurs. As Re is increased beyond Re crit, transition takes place earlier on the surface, and C D rises as the skin friction drag increases. FLUENT was found to be capable of predicting average wake structures that compared well with wind tunnel flow visualisation for the 3D smooth sphere, the scale model soccer ball and the real soccer ball. However, several discrepancies were found between the CFD results and the wind tunnel results, and in general the following applied: The expected drop in C D in the critical regime could not be predicted because boundary layer transition could not be modelled; The rise in C D in the super-critical regime could not be modelled for a combination of reasons: the boundary layer was modelled as fully turbulent whereas in reality it is a combination of laminar and turbulent in the super-critical regime, and in some cases FLUENT switched from near-wall modelling to the
11 standard wall function at high Re (because a range of Re were studied and computational constraints prevented y + from staying 1 at the higher Re), not fully resolving the boundary layer and affecting separation; The C D values were generally lower than experiment because the effects of the flow interaction between the sphere and its supporting device could not fully taken into consideration (implying that the experimental results are indeed slightly higher than reality see the study in Barber [13] for more details); Convergence was difficult to reach and wake asymmetries suggested large numerical errors for all the turbulence models except for the standard k-ε and realizable k-ε models this is due to the over-prediction of turbulent kinetic energy of the k-ε models (which reduces the accuracy of the prediction of separation); Even though a mesh dependency study was carried out, inaccuracies could result from the tetrahedron-to-quadrilateral transition region and the hanging-node formulation further out. The analyses were limited by computational power and software availability, and FLUENT was found to be a difficult tool for this application. The meshing process was very time-consuming and convergence for a real soccer ball was only achieved after altering the numerical model parameters. Despite these problems, the results suggest that FLUENT can be used as an effective tool for comparison between different ball designs. The most suitable and accurate meshing and solving techniques that were chosen for the analysis of soccer balls were combined together into an analysis tool, which used
12 the solving parameters shown in Tables 1 and 2 for the real soccer balls, along with a mesh structure as shown in Figure 4. The mesh varied slightly between balls, but in general had about 9 million cells with prism cells growing from the surface and a section of unstructured tetrahedral cells joining them to the outer structured mesh. Once imported into TGRID4, the scanned geometry of a ball was immediately converted to a surface mesh using a new wrapping tool. The use of the analysis tool to compare the behaviour of several different soccer balls is discussed below.
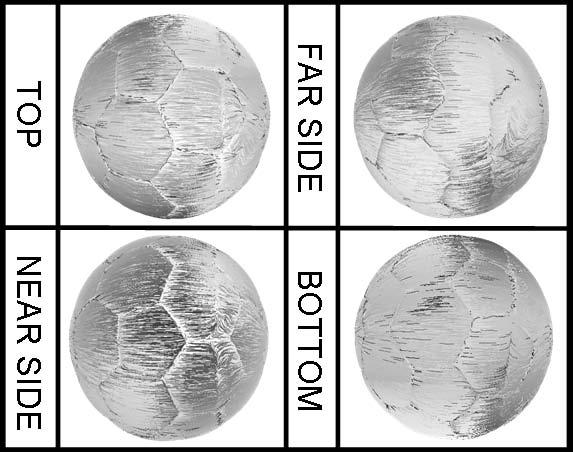
13 3. Soccer ball analysis 3.1 Scanned balls Set-up Scanned geometries of seven different balls (Balls 1-7) were entered into FLUENT, which was set up as described in the previous section. Studies were undertaken at various ball orientations about the vertical y-axis (rotated at 10 o intervals from 0 o to 90 o ) at Re = This was done by importing the scanned geometry into GAMBIT, rotating the geometry manually to 0 o and then using the rotating tool in GAMBIT to move the geometry to the other orientations. 0 o was defined for each ball as illustrated in Figure 2. Different orientations were studied in order to analyse the behaviour of balls launched with very low amounts of spin. For the orientations of 0 o, the study was repeated for Re = and in order to examine Redependency effects. Ball 1 had 32 panels (20 pentagonal and 12 hexagonal) that were hand-stitched together in the traditional manner. Ball 2 had 32 panels that were thermally bonded together, and hence had narrower, shallower and sharper seams. Ball 3 had 14 precurved panels that were thermally bonded together. Balls 4-7 were similar to a standard 32 panel ball, but some of the panels were joined together. The four balls varied in arrangement and alignment of the panels and they were generally not rotationally symmetrical at an orientation of 0 o. Ball 4 and Ball 5 had 12 additional joins between hexagons and pentagons making a total of 20 panels, but were different in the way the panels are joined. Ball 6 and Ball 7 had 6 additional joins between
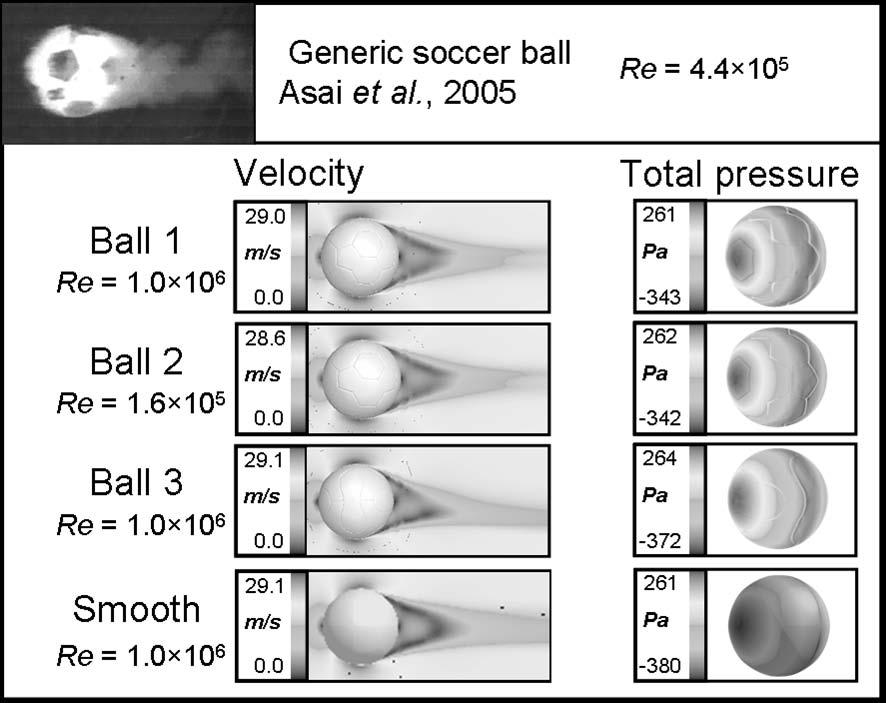
14 hexagons making a total of 26 panels, and were oriented slightly differently to each other. The resolution of the mesh was such that each seam contained at least 10 grid points Drag results The C D results for Balls 1-3 are shown in Figure 3 and compared to known data of Achenbach [1] and Barber et al. [15]. The results for Balls 4-7 were very similar and are therefore not shown. C D was higher for each ball than for the smooth sphere, and lower than the wind tunnel results for the scale model soccer ball, due to the relative seam sizes. As shown in Figure 3, C D for Ball 3 was under-predicted compared to the wind tunnel results (by about 3-5% in the super-critical regime and about 25% in the trans-critical regime). The reasons for this were because the flow was modelled as fully turbulent for the entire Re range, and the effects of the flow interaction between the ball and its supporting device were not deducted from the wind tunnel C D values. The C D values were split into skin friction and pressure drag components, and the skin friction drag was approximately for the lowest Re and for the highest Re (depending on the ball). C D for Ball 2 was approximately 15% larger than for Ball 1 possibly due to slightly earlier separation caused by the sharper seams. C D for Ball 3 was approximately 6% smaller than for Ball 1 due to a decrease in both pressure and skin friction drag with the smaller and fewer seams. These trends matched the wind tunnel results around the super-critical regime [15]. Flow visualisation (velocity contours taken at a central plane, side view and total pressure contours on the surface) for the three balls and the
15 smooth sphere at Re = is shown in Figure 5. The wakes were all similar in size, explaining the fairly similar C D values seen, and compared well with experimental flow visualisation of Asai [17]. Additionally, the wakes appear slightly asymmetric and possibly unsteady. Even though unsteady effects were expected not to be significant, it is recommended that further work is carried out to investigate this effect in more detail. This could also take into account the oscillation of the ball following deformation after it is kicked, even though this effect is generally assumed to be small. This is not, however, within the scope or the computational constraints of the present work Variation with orientation Force coefficients In general, C L and C S were found to vary with orientation due to the asymmetry of the scanned geometry, but C D remained constant. The predicted variations of C S for Balls 1-3 are shown in Figure 6. For Balls 1-3, C L did not vary significantly due to symmetry about the perpendicular axis so are not included. Position of separation These variations can be explained by considering how the position of separation relates to the surface geometry of the balls. The same argument could also partly explain the under-prediction of C D described earlier. Figure 7 shows the simulated oil flow visualisation (from four different views) around Ball 1 at 0 o for Re = , demonstrating the pathlines of particles released from the surface and showing clearly the separation position towards the rear of the ball.
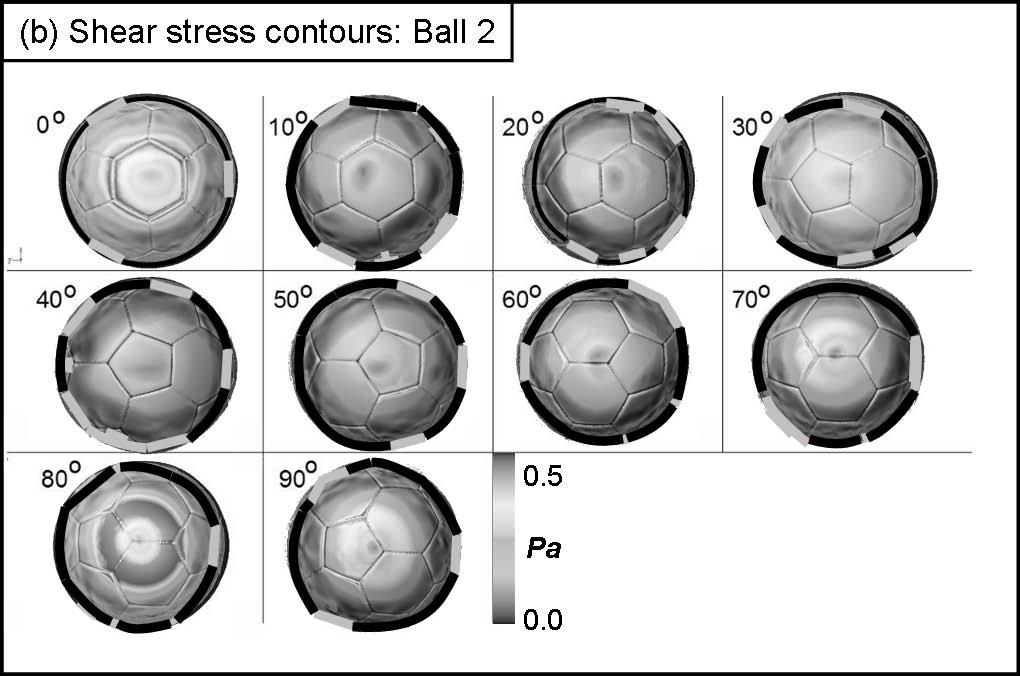
16 Each particle had its own particle ID and the particles were coloured according to their ID. For each ball, images were then built up that indicated the position of separation at all points around the ball, and the influence of the seams were seen. Figure 8 shows shear stress contours (Pa) on the rear surface of Balls 1-3, along with approximate separation points obtained from the oil flow visualisation. Black lines indicate approximate separation and red lines indicate separation where the flow is particularly affected by the presence of a seam. The images in Figure 8 suggest that seams that are perpendicular, or nearly perpendicular, to the flow had an effect on the position of separation, due to the sudden change in curvature of the surface. The less perpendicular to the flow a seam was (i.e. the more aligned with the flow) the more likely the flow was to continue in its original direction and not be affected largely by the seam. In general, the seams of Ball 1 that were perpendicular (or nearly perpendicular) to the flow seem to have been more likely to hold back the flow and alter its position of separation than the seams of Ball 2, probably because they were larger and had more influence on the flow (e.g. Ball 1 compared to Ball 2 at 20 o and 30 o ). This meant that the C S varied more often with angle for Ball 1. The seams of Ball 3 only rarely held back the flow and influenced separation, but was sometimes swayed heavily by the presence of long, perpendicular seams, e.g. at 40 o and 50 o (Figure 8). The magnitude of C S was correspondingly lower for Ball 3. The significant stepped pattern in C S occurred when particular seams held back the flow in a certain position, and continued to do so as the ball was rotated. Eventually it reached a point where the seam suddenly lost its influence because it was too far away
17 from the natural position of separation (i.e. where separation would have occurred without the presence of the seams), and the separation point then retreated to the previous perpendicular seam. This was particularly evident between 50 o and 80 o for Ball 1. The pattern occurred less frequently for Ball 2 because a seam was less likely to hold back the flow near separation and remain holding it back as the ball rotated. The large drop in C S from 50 o to 60 o is explained by a sudden jump in separation on one side of the ball. The variation in C S was less for Ball 3 in general; however the occasional sudden peak was seen. The peak at 40 o was explained by the strong bias of the flow to separate near the long, vertical seam on one side. At 50 o the separation region jumped back to the previous vertical seam. Further considerations As well as altering the positions of separation, the asymmetrical surface geometry resulted in corresponding asymmetric wakes, an example of which is given is Figure 9. It should be noted that these wakes could decrease the stability and result in further convergence problems for turbulence models other than the k-ε models. Another factor that could be connected to this effect was thought to be the roundness of the balls. The geometries of Ball 1 and Ball 3 were examined in more detail using radius contour plots in FLUENT. The plots are shown in Figure 10, in which contours of radius are displayed at a range that captures the surface of the balls. If the balls were completely round, the seams consistent, and the reference point (0,0) perfectly in the centre of the ball, then the panels would all be red and the seams would be blue. However, the ball geometries were clearly not perfectly round, and the radius range for the panels of Ball 1 was approximately m and approximately
18 0.111 m for the panels of Ball 3. This 2-3 mm discrepancy could have been caused by a number of factors, including manufacturing inconsistencies, scanning errors, surfacing errors (resulting from the approximations made when holes were filled in the scanned geometry to produce the surface) or errors in defining the centre of the ball in the software. It could contribute to the asymmetry of the balls and thus contribute to the varying C L values. However, it was not possible to separate these effects from those thought to be caused by the seams. For Balls 4-7, similar analysis showed that the seam positions near separation seemed to have an effect on the flow, because they directly affected the position of separation. The results suggested that the exact positioning of the balls in the mesh had as much effect on the flow as their seam arrangement and hence the trajectories were thought to be very sensitive to orientation. It was thought that the variations of C S for Balls 4-7 were less defined than for Balls 1-3 because they had fewer seams. Validation Ideally these findings should be confirmed through controlled experiments, but wind tunnel tests that accurately measure C L and C S have not yet been done. However, trajectory analysis does show that the magnitude and frequency of the values obtained in this study would result in similar trajectories to those observed in reality. This is discussed below and in more detail in Barber [15] Effects on trajectory Balls launched with high velocity and low spin (< 2 rev/s) are often seen to move in the air during their flight and behave erratically, as opposed to spinning balls that swerve in the air due to the Magnus effect in a predictable manner.
19 In order to examine whether this effect could be attributed to the observed effects discussed in this study, a fully-validated trajectory simulation programme was used. The variations in C L and C S were entered into the programme for a kick similar to one observed in the English Premiership in 2006, shown approximately in Figure 11. The kick was taken at 33 m from goal, slightly to the right of centre, launched at approximately 36 m/s with ¼ rev/s of sidespin. The resulting trajectory showed similar behaviour to those observed in reality, as the example in Figure 12 for Balls 1, 2 and 3 for an initial orientation of 0 o verifies. The effects of a change in initial orientation and ball type on the resulting trajectory were investigated. The analysis of the results (given in more detail in Barber [15]), brought up the following factors that appear to affect the trajectory of a ball launched with low amounts of spin: Number of seams: more seams (especially ones that are perpendicular to the flow near separation) increase the maximum force coefficient, which would increase the amount of swerve, which may or may not lead to a less consistent range (depending on the frequency of force coefficient variation, spin rate and initial orientation); Depth of seams: deep seams increase the maximum force coefficient, which would increase the amount of swerve; Symmetry of pattern in a given direction: the less symmetry about an axis, the larger the force coefficient is perpendicular to that axis and the flow direction,
20 increasing the amount of swerve; if the pattern is symmetrical, the force coefficient would be zero perpendicular to the axes of symmetry; Frequency of repeating pattern in flow direction: a lower frequency pattern (i.e. larger panels in the flow direction) reduces the frequency of the force variation, which would reduce the number of swerves during flight and could make the flight less consistent (depending on the spin rate and the initial orientation). The most consistent balls are the ones that have the optimum combination of maximum force coefficient and frequency relative to the amount of applied spin. These observations hold as long as the behaviour remains pseudo-static and the spin rate remains low enough so that the Magnus Effect does not take over. This is expected when the Magnus coefficient (C M ) exceeds the pseudo-static force coefficient, at Sp 0.1 (ω 2 rev/s at 30 m/s ), taken from the C M vs. Sp graph in Carré [9]. 3.2 Uncertainty analysis Even though validation studies were done throughout the work, the effect of the unstructured region of the mesh was not known. It was thought that uncertainties could arise from the fact that this part of the mesh was different for each ball and orientation (because it had to be re-made each time). Other possible sources of uncertainty included manufacturing inconsistencies of the balls, scanning and surfacing inconsistencies and alignment inconsistencies when the balls were oriented at 0 o by eye.
21 These uncertainties were analysed by undertaking further studies on a smooth sphere, a repeatability study on Ball 3 and an alignment study on Ball 1, all of which are described in detail by Barber [15]. The conclusions of this study are discussed here. The CFD analysis methodology that was developed was found to predict the flow structure around a smooth sphere well, with a wake structure similar to that of wind tunnel flow visualisation. It under-predicted C D (by approximately 0.08) at very high Re (Re > ) and C L and C S values were close to zero (approximately 0.01). The addition of a section of unstructured mesh around the sphere (combining the use of the PRESTO! pressure discretisation scheme and the PISO pressure-velocity coupling) improved the speed of convergence and resulted in a more accurate prediction of the wake. The inherent error in the calculation of C L and C S in the CFD process due to the mesh was found to be Additionally, a 2-3 mm discrepancy in the diameter was found for the balls due to inconsistencies in manufacturing, scanning and surfacing processes. Repeat scans could alter the force coefficient variation curves by a maximum of ± 0.02, due to inconsistencies in the geometry, in the unstructured region of the mesh and in the manual alignment of the geometry in the mesh by eye. It was found that a ± 2 o alteration of the geometry around its 0 o position could not be easily detected by eye, and variations of ± 2 o in a ball s geometry due to misalignment could alter the force coefficients by approximately ± It was concluded that the same type of balls launched with low amounts of spin will not behave consistently from ball
22 to ball because the flight depends on their geometry and roundness as well as on the angle of orientation. 3.3 Evaluation of FLUENT Practicalities The main limitations of the use of FLUENT for this application were due to the availability of computational power, as discussed in Section 1.3. FLUENT also had a number of practical limitations, for example it was especially difficult to design the structured part of the mesh and the desired results were difficult to obtain from the y + adaption tool. Convergence was difficult to achieve for this application, and could only be achieved for the realizable k-ε model after altering the numerical model parameters. The k-ε models over-predict the turbulent kinetic energy and stabilise the solutions enough for convergence. As discussed in Section 2.2, the accuracy of the solutions is therefore compromised Uncertainties In the validation studies, FLUENT was found to be capable of predicting average wake structures that compared well with wind tunnel flow visualisation for a soccer ball, and, despite some limitations, it was found to be an effective tool for qualitative (or perhaps relative) comparison between different ball designs. The main limitations were that boundary layer transition could not be predicted, unsteady effects were not modelled and FLUENT was not capable of modelling boundary layer thickening. This resulted in under-predictions of C D up to 50% for the
23 smooth sphere, 20% for the scale model ball and 25% for the real soccer ball at the highest Re ( ). Small asymmetries due to inconsistencies in manufacturing, scanning, surfacing, geometry alignment and in the unstructured part of the mesh introduced some uncertainties into the analysis, and repeat scans were found to alter the force coefficient variation curves by a maximum of ± Conclusions The CFD analysis tool was found to be a powerful tool for the comparative analysis of soccer ball aerodynamics, even though there were some limitations with the software capabilities and the available computational resources. Several different scanned and altered soccer balls were analysed using FLUENT. C D was not significantly different between different ball designs. Both C L and C S were found to vary significantly with orientation and with ball type due to asymmetrical geometry causing variation in separation around the seams. When these quasi-steady variations for each ball were approximated and then entered into the trajectory simulation programme, each ball was found to behave quite differently, and erratic trajectories were observed for spin rates < 2 rev/s. The analysis allowed some general conclusions to be drawn regarding the effects of ball surface geometry on its trajectory. More seams (especially ones that are perpendicular to the flow near separation) increase the maximum force coefficient, which would increase the amount of swerve for low-spinning kicks, which may or
24 may not lead to a less consistent range (depending on the frequency of force coefficient variation, spin rate and initial orientation). Deep seams increase the maximum force coefficient, which would increase the amount of swerve. The lower the symmetry of the surface pattern about an axis, the larger the force coefficient is perpendicular to that axis and the flow direction, increasing the amount of swerve; if the pattern was symmetrical, the force coefficient would be zero perpendicular to the axes of symmetry. A lower frequency of repeating surface pattern (i.e. larger panels in the flow direction) reduces the frequency of the force variation, which would reduce the number of swerves during flight and could make the flight less consistent (depending on the spin rate and the initial orientation). The most consistent balls are the ones that have the optimum combination of amplitude and frequency of the varying force coefficient relative to the amount of applied spin. Acknowledgements Thanks to Fluent Europe and the EPSRC for supporting this study, and to Richard Lukes, John Hart and Dave Mann for their technical advice and support.
25 References 1. Achenbach E, Experiments on the flow past spheres at very high Reynolds numbers. Journal of Fluid Mechanics, : p Achenbach E, The effects of surface roughness and tunnel blockages on the flow past spheres. Journal of Fluid Mechanics, : p Taneda S, Visual observations on the flow past spheres at Reynolds numbers between 10 4 and Journal of Fluid Mechanics, : p Jindal S, Long LN, Plassmann PE, and Sezer-Uzol N, Large-eddy simulations around a sphere using unstructured girds. AIAA Paper Constantinescu GS, Chapelet M, and Squires KS, Turbulence modelling applied to flow over a sphere. AIAA Journal, (9): p Penrose JMT, Hose DR, and Trowbridge EA. Cricket ball swing: a preliminary analysis using CFD. in The Engineering of Sport Sheffield, UK: AA Balkema. 7. Himeno R, Computational study of influences of a seam line of a ball for baseball on flows. Journal of Flow Visualisation, : p Ting LL. Application of CFD technology analysing the 3D aerodynamic behaviour of dimpled golf balls. in ASME International Mechanical Engineering Congress and Exposition New Orleans, Louisiana, USA. 9. Ting LL. Effect of teardrop shaped dimple design on the golf ball aerodynamic performance. in ISEA 5th Engineering of Sport Conference Davis, California: International Sports Engineering Association. 10. Ting LL. Golf ball aerodynamic behaviour as affected by the dimple depth and dimple shape changes. in Asia-Pacific Congress on Sports Technology Tokyo, Japan: Australasian Sports Technology Alliance. 11. Aoki K, Nonaka M, Goto T, Miyamoto M and Sugiura M. Effect of the dimple structure on the flying characteristics and flow patterns of a golf ball. in ISEA 5th Engineering of Sport Conference Davis, California: International Sports Engineering Association. 12. Kim HC, Nakahashi K, and Kim HJ. Three-dimensional flow analysis around a cylinder with dimples. in Asia-Pacific Congress on Sports Technology Tokyo, Japan: Australasian Sports Technology Alliance. 13. S. Barber, K. Seo, T. Asai and M.J. Carré. Investigating the effects of orientation on the flight of a non-spinning soccer ball, Asia-Pacific Congress on Sports Technology Singapore. 14. Carré MJ, Asai T, Akatsuka T and Haake SJ. The curve kick of a football 2: flight through the air. Sports Engineering, : p Barber S, The aerodynamics of association footballs, in Mechancal Engineering. 2007, University of Sheffield. 16. Fluent-Incorporated. Fluent 6.2 User's Guide Asai T, Takano S, Carré MJ and Haake SJ. A fundamental study on aerodynamics of soccer ball. in Proceedings of 83rd Japan Society of Mechanical Engineering Conference (Fluid engineering division)
26 List of Figures Figure 1. General mesh structure. Figure 2. Balls 1-7at an orientation of 0 o. Figure 3 C D vs. Re for Balls 1-3 compared to known data. Figure 4. Mesh structure most suitable for soccer ball analysis. Figure 5. Velocity contours taken at a central plane (m/s, side view) and total pressure contours (Pa) for Ball 1, Ball 2 and Ball 3 and the smooth sphere. Figure 6. Variation of C S with orientation for Ball 1, Ball 2 and Ball 3, Re = Figure 7. Oil flow visualisation for Ball 1 at 0 o at Re = (coloured by particle ID). Figure 8. Shear stress contours (Pa) on the rear of (a) Ball 1, (b) Ball 2 and (c) Ball 3 with separation points marked in black (indicating separation) and red (indicating separation at a seam). Figure 9. Example of velocity and turbulence intensity contours at various rotational angles. Figure 10. Radius contours of two balls. Figure 11. Approximate trajectory of an erratic free-kick. Figure 12. Predicted trajectories of Balls 1-3 at an initial orientation of 0 o.
27 Tables Table 1 Summary of C D results compared to experiment. Table 2. Summary of solver details.

28

29

30

31

32
33

34
35

36
37
38
39
40

41
Fundamental aerodynamics of the soccer ball
 T. Asai,* K. Seo, O. Kobayashi and R. Sakashita *Comprehensive Human Sciences, Tsukuba University, Tsukuba, Japan Faculty of Education, Art & Science, Yamagata University, Yamagata, Japan Department of
Available online at Procedia Engineering 200 (2010) (2009)
 (2009)") Available online at www.sciencedirect.com Procedia Engineering 2 (21) (29) 2467 2472 Procedia Engineering www.elsevier.com/locate/procedia 8 th Conference of the International Sports Engineering Association
Available online at www.sciencedirect.com Procedia Engineering 2 (21) (29) 2467 2472 Procedia Engineering www.elsevier.com/locate/procedia 8 th Conference of the International Sports Engineering Association
COMPUTATIONAL SIMULATION OF THE FLOW PAST AN AIRFOIL FOR AN UNMANNED AERIAL VEHICLE
 COMPUTATIONAL SIMULATION OF THE FLOW PAST AN AIRFOIL FOR AN UNMANNED AERIAL VEHICLE L. Velázquez-Araque 1 and J. Nožička 2 1 Division of Thermal fluids, Department of Mechanical Engineering, National University
TURBULENT FLOW ACROSS A ROTATING CYLINDER WITH SURFACE ROUGHNESS
 HEFAT2014 10 th International Conference on Heat Transfer, Fluid Mechanics and Thermodynamics 14 16 July 2014 Orlando, Florida TURBULENT FLOW ACROSS A ROTATING CYLINDER WITH SURFACE ROUGHNESS Everts, M.,
Simulation of Aeroelastic System with Aerodynamic Nonlinearity
 Simulation of Aeroelastic System with Aerodynamic Nonlinearity Muhamad Khairil Hafizi Mohd Zorkipli School of Aerospace Engineering, Universiti Sains Malaysia, Penang, MALAYSIA Norizham Abdul Razak School
CFD Time Evolution of Heat Transfer Around A Bundle of Tubes In Staggered Configuration. G.S.T.A. Bangga 1*, W.A. Widodo 2
 CFD Time Evolution of Heat Transfer Around A Bundle of Tubes In Staggered Configuration G.S.T.A. Bangga 1*, W.A. Widodo 2 1,2 Department of mechanical engineering Field of study energy conversion Institut
International Journal of Scientific & Engineering Research, Volume 6, Issue 5, May ISSN
 International Journal of Scientific & Engineering Research, Volume 6, Issue 5, May-2015 28 CFD BASED HEAT TRANSFER ANALYSIS OF SOLAR AIR HEATER DUCT PROVIDED WITH ARTIFICIAL ROUGHNESS Vivek Rao, Dr. Ajay
WALL ROUGHNESS EFFECTS ON SHOCK BOUNDARY LAYER INTERACTION FLOWS
 ISSN (Online) : 2319-8753 ISSN (Print) : 2347-6710 International Journal of Innovative Research in Science, Engineering and Technology An ISO 3297: 2007 Certified Organization, Volume 2, Special Issue
Masters in Mechanical Engineering. Problems of incompressible viscous flow. 2µ dx y(y h)+ U h y 0 < y < h,
+ U h y 0 < y < h,") Masters in Mechanical Engineering Problems of incompressible viscous flow 1. Consider the laminar Couette flow between two infinite flat plates (lower plate (y = 0) with no velocity and top plate (y =
Masters in Mechanical Engineering Problems of incompressible viscous flow 1. Consider the laminar Couette flow between two infinite flat plates (lower plate (y = 0) with no velocity and top plate (y =
Manhar Dhanak Florida Atlantic University Graduate Student: Zaqie Reza
 REPRESENTING PRESENCE OF SUBSURFACE CURRENT TURBINES IN OCEAN MODELS Manhar Dhanak Florida Atlantic University Graduate Student: Zaqie Reza 1 Momentum Equations 2 Effect of inclusion of Coriolis force
Turbulent Boundary Layers & Turbulence Models. Lecture 09
 Turbulent Boundary Layers & Turbulence Models Lecture 09 The turbulent boundary layer In turbulent flow, the boundary layer is defined as the thin region on the surface of a body in which viscous effects
ABSTRACT I. INTRODUCTION
 2016 IJSRSET Volume 2 Issue 4 Print ISSN : 2395-1990 Online ISSN : 2394-4099 Themed Section: Engineering and Technology Analysis of Compressible Effect in the Flow Metering By Orifice Plate Using Prasanna
The aerodynamic performance of a range of FIFA-approved footballs
 Loughborough University Institutional Repository The aerodynamic performance of a range of FIFA-approved footballs This item was submitted to Loughborough University's Institutional Repository by the/an
NUMERICAL INVESTIGATION OF THE FLOW OVER A GOLF BALL IN THE SUBCRITICAL AND SUPERCRITICAL REGIMES
 NUMERICAL INVESTIGATION OF THE FLOW OVER A GOLF BALL IN THE SUBCRITICAL AND SUPERCRITICAL REGIMES Clinton Smith 1, Nikolaos Beratlis 2, Elias Balaras 2, Kyle Squires 1, and Masaya Tsunoda 3 ABSTRACT Direct
REDUCING THE ATHLETE S AERODYNAMIC RESISTANCE
 Journal of Computational and Applied Mechanics, Vol. 8., No. 2., (2007), pp. 163 173 REDUCING THE ATHLETE S AERODYNAMIC RESISTANCE Luca Oggiano, Lars Saetran, Sveinung Loset, Ronny Winther Faculty of Engineering
Experimental Verification of CFD Modeling of Turbulent Flow over Circular Cavities using FLUENT
 Experimental Verification of CFD Modeling of Turbulent Flow over Circular Cavities using FLUENT T Hering, J Dybenko, E Savory Mech. & Material Engineering Dept., University of Western Ontario, London,
The application of simulation to the understanding of football flight
 Loughborough University Institutional Repository The application of simulation to the understanding of football flight This item was submitted to Loughborough University's Institutional Repository by the/an
Analysis of Flow over a Convertible
 69 Analysis of Flow over a Convertible Aniket A Kulkarni 1, S V Satish 2 and V Saravanan 3 1 PES Institute of Technology, India, aniket260919902@gmail.com 2 PES Institute of Technology, India, svsatish@pes.edu
CHAPTER 7 NUMERICAL MODELLING OF A SPIRAL HEAT EXCHANGER USING CFD TECHNIQUE
 CHAPTER 7 NUMERICAL MODELLING OF A SPIRAL HEAT EXCHANGER USING CFD TECHNIQUE In this chapter, the governing equations for the proposed numerical model with discretisation methods are presented. Spiral
Applied Fluid Mechanics
 Applied Fluid Mechanics 1. The Nature of Fluid and the Study of Fluid Mechanics 2. Viscosity of Fluid 3. Pressure Measurement 4. Forces Due to Static Fluid 5. Buoyancy and Stability 6. Flow of Fluid and
Computational Fluid Dynamics Study Of Fluid Flow And Aerodynamic Forces On An Airfoil S.Kandwal 1, Dr. S. Singh 2
 Computational Fluid Dynamics Study Of Fluid Flow And Aerodynamic Forces On An Airfoil S.Kandwal 1, Dr. S. Singh 2 1 M. Tech Scholar, 2 Associate Professor Department of Mechanical Engineering, Bipin Tripathi
Numerical and Experimental Study on the Effect of Guide Vane Insertion on the Flow Characteristics in a 90º Rectangular Elbow
 Numerical and Experimental Study on the Effect of Guide Vane Insertion on the Flow Characteristics in a 90º Rectangular Elbow Sutardi 1, Wawan A. W., Nadia, N. and Puspita, K. 1 Mechanical Engineering
Numerical study of battle damaged two-dimensional wings
 Advances in Fluid Mechanics IX 141 Numerical study of battle damaged two-dimensional wings S. Djellal, T. Azzam, M. Djellab & K. Lakkaichi Fluid Mechanics Laboratory Polytechnical School Bordj El Bahri,
An Overview of Impellers, Velocity Profile and Reactor Design
 An Overview of s, Velocity Profile and Reactor Design Praveen Patel 1, Pranay Vaidya 1, Gurmeet Singh 2 1 Indian Institute of Technology Bombay, India 1 Indian Oil Corporation Limited, R&D Centre Faridabad
Flow Visualisation around Spinning and Non- Spinning Soccer Balls Using the Lattice Boltzmann Method
 Proceedings Flow Visualisation around Spinning and Non- Spinning Soccer Balls Using the Lattice Boltzmann Method Takeshi Asai 1, *, Sungchan Hong 1, Kaoru Kimachi 2, Keiko Abe 3, Hisashi Kai 3 and Atsushi
ScienceDirect. Optimization of the size and launch conditions of a discus
 Available online at www.sciencedirect.com ScienceDirect Procedia Engineering 72 ( 24 ) 756 76 The 24 conference of the International Sports Engineering Association Optimization of the size and launch conditions
The effect of geometric parameters on the head loss factor in headers
 Fluid Structure Interaction V 355 The effect of geometric parameters on the head loss factor in headers A. Mansourpour & S. Shayamehr Mechanical Engineering Department, Azad University of Karaj, Iran Abstract
Numerical Investigation of Thermal Performance in Cross Flow Around Square Array of Circular Cylinders
 Numerical Investigation of Thermal Performance in Cross Flow Around Square Array of Circular Cylinders A. Jugal M. Panchal, B. A M Lakdawala 2 A. M. Tech student, Mechanical Engineering Department, Institute
Self-Excited Vibration in Hydraulic Ball Check Valve
 Self-Excited Vibration in Hydraulic Ball Check Valve L. Grinis, V. Haslavsky, U. Tzadka Abstract This paper describes an experimental, theoretical model and numerical study of concentrated vortex flow
Aerodynamics of Sport Balls. 王啟川, PhD 國立交通大學機械工程系教授 Fellow ASME, Fellow ASHRAE Tel: ext
 Aerodynamics of Sport Balls 王啟川, PhD 國立交通大學機械工程系教授 Fellow ASME, Fellow ASHRAE Tel: 3-5712121 ext. 55105 E-mail:ccwang@mail.nctu.edu.tw Background Outline Basic Fluid Mechanics Non-spinning vs. spinning
Flow analysis in centrifugal compressor vaneless diffusers
 348 Journal of Scientific & Industrial Research J SCI IND RES VOL 67 MAY 2008 Vol. 67, May 2008, pp. 348-354 Flow analysis in centrifugal compressor vaneless diffusers Ozturk Tatar, Adnan Ozturk and Ali
Calculations on a heated cylinder case
 Calculations on a heated cylinder case J. C. Uribe and D. Laurence 1 Introduction In order to evaluate the wall functions in version 1.3 of Code Saturne, a heated cylinder case has been chosen. The case
CHAPTER 4 OPTIMIZATION OF COEFFICIENT OF LIFT, DRAG AND POWER - AN ITERATIVE APPROACH
 82 CHAPTER 4 OPTIMIZATION OF COEFFICIENT OF LIFT, DRAG AND POWER - AN ITERATIVE APPROACH The coefficient of lift, drag and power for wind turbine rotor is optimized using an iterative approach. The coefficient
Design and simulation of Open Circuit Blowdown type Wind Tunnel
 Design and simulation of Open Circuit Blowdown type Wind Tunnel Sanjeev Kumar Gupta a, V.K.Dwivedi b, Jitendra Kumar Chauhan c, and Rahul Goswami c a Assistant Professor, Department of Mechanical Engineering,
University of Huddersfield Repository
 University of Huddersfield Repository Malviya, Vihar, Gundala, Naresh and Mishra, Rakesh Effect of cross wind on aerodynamic coefficients of ground vehicles. Original Citation Malviya, Vihar, Gundala,
Wall treatments and wall functions
 Wall treatments and wall functions A wall treatment is the set of near-wall modelling assumptions for each turbulence model. Three types of wall treatment are provided in FLUENT, although all three might
Theoretical Gas Flow through Gaps in Screw-type Machines
 Theoretical Gas Flow through Gaps in Screw-type Machines Prof. Dr.-Ing. K. Kauder, Dipl.-Ing. D. Stratmann University of Dortmund, Fachgebiet Fluidenergiemaschinen (The experimental part of these studies
PART 1B EXPERIMENTAL ENGINEERING. SUBJECT: FLUID MECHANICS & HEAT TRANSFER LOCATION: HYDRAULICS LAB (Gnd Floor Inglis Bldg) BOUNDARY LAYERS AND DRAG
 BOUNDARY LAYERS AND DRAG") 1 PART 1B EXPERIMENTAL ENGINEERING SUBJECT: FLUID MECHANICS & HEAT TRANSFER LOCATION: HYDRAULICS LAB (Gnd Floor Inglis Bldg) EXPERIMENT T3 (LONG) BOUNDARY LAYERS AND DRAG OBJECTIVES a) To measure the velocity
1 PART 1B EXPERIMENTAL ENGINEERING SUBJECT: FLUID MECHANICS & HEAT TRANSFER LOCATION: HYDRAULICS LAB (Gnd Floor Inglis Bldg) EXPERIMENT T3 (LONG) BOUNDARY LAYERS AND DRAG OBJECTIVES a) To measure the velocity
Drag reduction in a class 8 truck - scaled down model
 Drag reduction in a class 8 truck - scaled down model Vishwa Krishna. R 1, Suwathy. R 2, Pragadeesh. M 1, and Venkatesan. M 1,* 1 School of Mechanical Engineering, SASTRA Deemed University, Tirumalaisamudram,
Prediction of Performance Characteristics of Orifice Plate Assembly for Non-Standard Conditions Using CFD
 International Journal of Engineering and Technical Research (IJETR) ISSN: 2321-0869, Volume-3, Issue-5, May 2015 Prediction of Performance Characteristics of Orifice Plate Assembly for Non-Standard Conditions
Numerical Methods in Aerodynamics. Turbulence Modeling. Lecture 5: Turbulence modeling
 Turbulence Modeling Niels N. Sørensen Professor MSO, Ph.D. Department of Civil Engineering, Alborg University & Wind Energy Department, Risø National Laboratory Technical University of Denmark 1 Outline
Zonal hybrid RANS-LES modeling using a Low-Reynolds-Number k ω approach
 Zonal hybrid RANS-LES modeling using a Low-Reynolds-Number k ω approach S. Arvidson 1,2, L. Davidson 1, S.-H. Peng 1,3 1 Chalmers University of Technology 2 SAAB AB, Aeronautics 3 FOI, Swedish Defence
Numerical analysis of fluid flow and heat transfer in 2D sinusoidal wavy channel
 Numerical analysis of fluid flow and heat transfer in 2D sinusoidal wavy channel Arunanshu Chakravarty 1* 1 CTU in Prague, Faculty of Mechanical Engineering, Department of Process Engineering,Technická
Aerodynamics of Spinning Sphere in Ideal Flow R. C. Mehta Department of Aeronautical Engineering, Noorul Islam University, Kumaracoil , India
 Scholars Journal of Engineering and Technology (SJET) Sch. J. Eng. Tech., 06; 4(5):5-9 Scholars Academic and Scientific Publisher (An International Publisher for Academic and Scientific Resources) www.saspublisher.com
NUMERICAL SIMULATION AND MODELING OF UNSTEADY FLOW AROUND AN AIRFOIL. (AERODYNAMIC FORM)
") Journal of Fundamental and Applied Sciences ISSN 1112-9867 Available online at http://www.jfas.info NUMERICAL SIMULATION AND MODELING OF UNSTEADY FLOW AROUND AN AIRFOIL. (AERODYNAMIC FORM) M. Y. Habib
Journal of Fundamental and Applied Sciences ISSN 1112-9867 Available online at http://www.jfas.info NUMERICAL SIMULATION AND MODELING OF UNSTEADY FLOW AROUND AN AIRFOIL. (AERODYNAMIC FORM) M. Y. Habib
GENERALISATION OF THE TWO-SCALE MOMENTUM THEORY FOR COUPLED WIND TURBINE/FARM OPTIMISATION
 25 th National Symposium on Wind Engineering, Tokyo, Japan, 3-5 December 2018 第 25 回風工学シンポジウム (2018) GENERALISATION OF THE TWO-SCALE MOMENTUM THEORY FOR COUPLED WIND TURBINE/FARM OPTIMISATION Takafumi
MEAM 211. Project 1. Department of Mechanical Engineering and Applied Mechanics University of Pennsylvania January 19, 2007
 MEAM 211 Project 1 Department of Mechanical Engineering and Applied Mechanics University of Pennsylvania January 19, 2007 1 Introduction The goal of this project is to investigate the dynamics of projectiles
CFD ANALYSIS OF CD NOZZLE AND EFFECT OF NOZZLE PRESSURE RATIO ON PRESSURE AND VELOCITY FOR SUDDENLY EXPANDED FLOWS. Kuala Lumpur, Malaysia
 International Journal of Mechanical and Production Engineering Research and Development (IJMPERD) ISSN(P): 2249-6890; ISSN(E): 2249-8001 Vol. 8, Issue 3, Jun 2018, 1147-1158 TJPRC Pvt. Ltd. CFD ANALYSIS
DRAG PREDICTION AND VALIDATION OF STANDARD M549, 155mm PROJECTILE
 DRAG PREDICTION AND VALIDATION OF STANDARD M549, 155mm PROJECTILE 1 Kiran Torangatti, 2 Dr.Basawaraj 1 Research Scholar, Department of Aerospace Propulsion and Technology, VTU-CPGS Bangalore -560018,Karnataka,
Performance of Elliptical Pin Fin Heat Exchanger with Three Elliptical Perforations
 www.cfdl.issres.net Vol. 3 (2) June 2011 Performance of Elliptical Pin Fin Heat Exchanger with Three Elliptical Perforations Monoj Baruah 1, Anupam Dewan 2c and P. Mahanta 1 1 Department of Mechanical
Effect of radius ratio on pressure drop across a 90 bend for high concentration coal ash slurries
 This paper is part of the Proceedings of the 11 International Conference th on Engineering Sciences (AFM 2016) www.witconferences.com Effect of radius ratio on pressure drop across a 90 bend for high concentration
CFD Simulation on Supercritical Fluid Extraction of Black Pepper's Bioactive Compounds: Single Particle Study
 Journal of Engineering Science, Vol. 10, 107 116, 2014 CFD Simulation on Supercritical Fluid Extraction of Black Pepper's Bioactive Compounds: Single Particle Study Then Siew Ping, * Freddie Panau and
A Comparative Analysis of Turbulent Pipe Flow Using k And k Models
 A Comparative Analysis of Turbulent Pipe Flow Using k And k Models 1 B. K. Menge, 2 M. Kinyanjui, 3 J. K. Sigey 1 Department of Mathematics and Physics. Technical University of Mombasa, P.O BOX 90420-80100,Mombasa,
There are no simple turbulent flows
 Turbulence 1 There are no simple turbulent flows Turbulent boundary layer: Instantaneous velocity field (snapshot) Ref: Prof. M. Gad-el-Hak, University of Notre Dame Prediction of turbulent flows standard
CFD DESIGN OF A GENERIC CONTROLLER FOR VORTEX-INDUCED RESONANCE
 Seventh International Conference on CFD in the Minerals and Process Industries CSIRO, Melbourne, Australia 9-11 December 2009 CFD DESIGN OF A GENERIC CONTROLLER FOR VORTEX-INDUCED RESONANCE Andrew A. ANTIOHOS,
DEVELOPED LAMINAR FLOW IN PIPE USING COMPUTATIONAL FLUID DYNAMICS M.
 DEVELOPED LAMINAR FLOW IN PIPE USING COMPUTATIONAL FLUID DYNAMICS M. Sahu 1, Kishanjit Kumar Khatua and Kanhu Charan Patra 3, T. Naik 4 1, &3 Department of Civil Engineering, National Institute of technology,
NUMERICAL AND EXPERIMENTAL INVESTIGATION OF THE TEMPERATURE DISTRIBUTION INSIDE OIL-COOLED TRANSFORMER WINDINGS
 NUMERICAL AND EXPERIMENTAL INVESTIGATION OF THE TEMPERATURE DISTRIBUTION INSIDE OIL-COOLED TRANSFORMER WINDINGS N. Schmidt 1* and S. Tenbohlen 1 and S. Chen 2 and C. Breuer 3 1 University of Stuttgart,
Numerical Investigation of Laminar Flow over a Rotating Circular Cylinder
 International Journal of Mechanical & Mechatronics Engineering IJMME-IJENS Vol:13 No:3 32 Numerical Investigation of Laminar Flow over a Rotating Circular Cylinder Ressan Faris Al-Maliky Department of
Numerical study of the effects of trailing-edge bluntness on highly turbulent hydro-foil flows
 Numerical study of the effects of trailing-edge bluntness on highly turbulent hydro-foil flows T. Do L. Chen J. Tu B. Anderson 7 November 2005 Abstract Flow-induced noise from fully submerged lifting bodies
Detached Eddy Simulation on Hypersonic Base Flow Structure of Reentry-F Vehicle
 Available online at www.sciencedirect.com ScienceDirect Procedia Engineering 00 (2014) 000 000 www.elsevier.com/locate/procedia APISAT2014, 2014 Asia-Pacific International Symposium on Aerospace Technology,
CFD Study of Flow Over Parallel Ridges with Varying Height and Spacing
 Proceedings of the World Congress on Engineering 21 Vol II WCE 21, June 3 - July 2, 21, London, U.K. CFD Study of Flow Over Parallel Ridges with Varying Height and Spacing Lee Chin Yik, Salim Mohamed Salim,
Parametric Investigation of Hull Shaped Fuselage for an Amphibious UAV
 Ninth International Conference on Computational Fluid Dynamics (ICCFD9), Istanbul, Turkey, July 11-15, 2016 ICCFD9-2016-226 Parametric Investigation of Hull Shaped Fuselage for an Amphibious UAV Emre Sazak
Numerical Investigation of the Flow Past a Rotating Golf Ball and Its Comparison with a Rotating Smooth Sphere
 Flow Turbulence Combust (2017) 99:837 864 https://doi.org/10.1007/s10494-017-9859-1 Numerical Investigation of the Flow Past a Rotating Golf Ball and Its Comparison with a Rotating Smooth Sphere Jing Li
Lab 1: Projectiles and Numerical Integration
 E91: DYNAMICS Lab 1: Projectiles and Numerical Integration 1 Introduction The goal of this project is to investigate the dynamics of projectiles (balls) used in sports and study their trajectories using
Introduction to Turbulence AEEM Why study turbulent flows?
 Introduction to Turbulence AEEM 7063-003 Dr. Peter J. Disimile UC-FEST Department of Aerospace Engineering Peter.disimile@uc.edu Intro to Turbulence: C1A Why 1 Most flows encountered in engineering and
AN UNCERTAINTY ESTIMATION EXAMPLE FOR BACKWARD FACING STEP CFD SIMULATION. Abstract
 nd Workshop on CFD Uncertainty Analysis - Lisbon, 19th and 0th October 006 AN UNCERTAINTY ESTIMATION EXAMPLE FOR BACKWARD FACING STEP CFD SIMULATION Alfredo Iranzo 1, Jesús Valle, Ignacio Trejo 3, Jerónimo
Visualization of flow pattern over or around immersed objects in open channel flow.
 EXPERIMENT SEVEN: FLOW VISUALIZATION AND ANALYSIS I OBJECTIVE OF THE EXPERIMENT: Visualization of flow pattern over or around immersed objects in open channel flow. II THEORY AND EQUATION: Open channel:
STRUCTURAL ANALYSIS OF A WESTFALL 2800 MIXER, BETA = 0.8 GFS R1. By Kimbal A. Hall, PE. Submitted to: WESTFALL MANUFACTURING COMPANY
 STRUCTURAL ANALYSIS OF A WESTFALL 2800 MIXER, BETA = 0.8 GFS-411519-1R1 By Kimbal A. Hall, PE Submitted to: WESTFALL MANUFACTURING COMPANY OCTOBER 2011 ALDEN RESEARCH LABORATORY, INC. 30 Shrewsbury Street
Friction Factors and Drag Coefficients
 Levicky 1 Friction Factors and Drag Coefficients Several equations that we have seen have included terms to represent dissipation of energy due to the viscous nature of fluid flow. For example, in the
Analysis of Fully Developed Turbulent Flow in a AXI-Symmetric Pipe using ANSYS FLUENT Software
 Analysis of Fully Developed Turbulent Flow in a AXI-Symmetric Pipe using ANSYS FLUENT Software Manish Joshi 1, Priyanka Bisht, Dr. Anirudh Gupta 3 1 M. Tech Scholar, M. Tech Scholar, 3 Associate Professor
Numerical simulations of the edge tone
 Numerical simulations of the edge tone I. Vaik, G. Paál Department of Hydrodynamic Systems, Budapest University of Technology and Economics, P.O. Box 91., 1521 Budapest, Hungary, {vaik, paal}@vizgep.bme.hu
FLOW PATTERN STUDY OF A CENTRIFUGAL PUMP USING CFD METHODS CONCENTRATING ON VOLUTE TONGUE ROLE
 FLOW PATTERN STUDY OF A CENTRIFUGAL PUMP USING CFD METHODS CONCENTRATING ON VOLUTE TONGUE ROLE N. Pourmahmoud and S. Majid Taleby Faculty of Engineering, Urmia University, Urmia, Iran E-Mail: majid.taleby@gmail.com
CEE 3310 External Flows (Boundary Layers & Drag, Nov. 12, Re 0.5 x x 1/2. Re 1/2
 CEE 3310 External Flows (Boundary Layers & Drag, Nov. 12, 2018 155 7.11 Review Momentum integral equation τ w = ρu 2 dθ dx Von Kármán assumed and found and δ x = 5.5 Rex 0.5 u(x, y) U = 2y δ y2 δ 2 δ =
Modeling of Anisotropic Polymers during Extrusion
 Modeling of Anisotropic Polymers during Extrusion Modified on Friday, 01 May 2015 10:38 PM by mpieler Categorized as: Paper of the Month Modeling of Anisotropic Polymers during Extrusion Arash Ahmadzadegan,
Theory & Applications of Computational Fluid Dynamics CFD
 جمعية رواد الھندسة والتكنولوجيا Theory & Applications of Computational Fluid Dynamics CFD Prepared and Presented By: Hesham Sami Abdul Munem Mechanical Engineer Pressure Vessels Department ENPPI Contents:
Validation 3. Laminar Flow Around a Circular Cylinder
 Validation 3. Laminar Flow Around a Circular Cylinder 3.1 Introduction Steady and unsteady laminar flow behind a circular cylinder, representing flow around bluff bodies, has been subjected to numerous
INTERNATIONAL JOURNAL OF SCIENTIFIC & TECHNOLOGY RESEARCH VOLUME 5, ISSUE 09, SEPTEMBER 2016 ISSN
 Numerical Analysis Of Heat Transfer And Fluid Flow Characteristics In Different V-Shaped Roughness Elements On The Absorber Plate Of Solar Air Heater Duct Jitesh Rana, Anshuman Silori, Rohan Ramola Abstract:
Side-View Mirror Vibrations Induced Aerodynamically by Separating Vortices
 Open Journal of Fluid Dynamics, 2016, 6, 42-56 Published Online March 2016 in SciRes. http://www.scirp.org/journal/ojfd http://dx.doi.org/10.4236/ojfd.2016.61004 Side-View Mirror Vibrations Induced Aerodynamically
Performance of a Vertical Axis Wind Turbine under Accelerating and Decelerating Flows
 Available online at www.sciencedirect.com Procedia CIRP 00 (2013) 000 000 www.elsevier.com/locate/procedia 2 nd International Through-life Engineering Services Conference Performance of a Vertical Axis
CFD MODELLING AND VALIDATION OF HEAD LOSSES IN PIPE BIFURCATIONS
 CFD MODELLING AND VALIDATION OF HEAD LOSSES IN PIPE BIFURCATIONS Kasturi Sukhapure* a, Alan Burns a, Tariq Mahmud a, Jake Spooner b. a School of Chemical and Process Engineering, University of Leeds, Leeds
COMPARATIVE STUDY BETWEEN FLOWS AROUND SPHERE AND POD USING FINITE VOLUME METHOD
 Journal of Naval Architecture and Marine Engineering June, 2011 DOI: 10.3329/jname.v8i1.7388 http://www.bangljol.info COMPARATIVE STUDY BETWEEN FLOWS AROUND SPHERE AND POD USING FINITE VOLUME METHOD M.
Comparison of Turbulence Models in the Flow over a Backward-Facing Step Priscila Pires Araujo 1, André Luiz Tenório Rezende 2
 Comparison of Turbulence Models in the Flow over a Backward-Facing Step Priscila Pires Araujo 1, André Luiz Tenório Rezende 2 Department of Mechanical and Materials Engineering, Military Engineering Institute,
BOUNDARY LAYER FLOWS HINCHEY
 BOUNDARY LAYER FLOWS HINCHEY BOUNDARY LAYER PHENOMENA When a body moves through a viscous fluid, the fluid at its surface moves with it. It does not slip over the surface. When a body moves at high speed,
MAE 598 Project #1 Jeremiah Dwight
 MAE 598 Project #1 Jeremiah Dwight OVERVIEW A simple hot water tank, illustrated in Figures 1 through 3 below, consists of a main cylindrical tank and two small side pipes for the inlet and outlet. All
report: Computational Fluid Dynamics Modelling of the Vortex Ventilator MK4 Rev 2 Ventrite International
 report: Computational Fluid Dynamics Modelling of the Vortex Ventilator MK4 Rev 2 PrePAreD for: Ventrite International D O C U men t C O N trol Any questions regarding this document should be directed
AERODYNAMIC CHARACTERIZATION OF A CANARD GUIDED ARTILLERY PROJECTILE
 45th AIAA Aerospace Sciences Meeting and Exhibit 8-11 January 27, Reno, Nevada AIAA 27-672 AERODYNAMIC CHARACTERIZATION OF A CANARD GUIDED ARTILLERY PROJECTILE Wei-Jen Su 1, Curtis Wilson 2, Tony Farina
Numerical Investigation of Wind Tunnel Wall Effects on a Supersonic Finned Missile
 16 th International Conference on AEROSPACE SCIENCES & AVIATION TECHNOLOGY, ASAT - 16 May 26-28, 2015, E-Mail: asat@mtc.edu.eg Military Technical College, Kobry Elkobbah, Cairo, Egypt Tel : +(202) 24025292
CEE 3310 External Flows (Boundary Layers & Drag, Nov. 14, Re 0.5 x x 1/2. Re 1/2
 CEE 3310 External Flows (Boundary Layers & Drag, Nov. 14, 2016 159 7.10 Review Momentum integral equation τ w = ρu 2 dθ dx Von Kármán assumed and found δ x = 5.5 Rex 0.5 u(x, y) U = 2y δ y2 δ 2 δ = 5.5
Circular Bearing Performance Parameters with Isothermal and Thermo-Hydrodynamic Approach Using Computational Fluid Dynamics
 Circular Bearing Performance Parameters with Isothermal and Thermo-Hydrodynamic Approach Using Computational Fluid Dynamics Amit Chauhan 1 Department of Mechanical Engineering, University Institute of
Negative Magnus Effect on a Rotating Sphere at around the Critical Reynolds Number
 Journal of Physics: Conference Series Negative Magnus Effect on a Rotating Sphere at around the Critical Reynolds Number To cite this article: Masaya Muto et al 211 J. Phys.: Conf. Ser. 318 3221 View the
PRELIMINARY STUDY OF COMPUTATIONAL SETUP FOR URBAN STREET CANYONS. by MUHAMMAD NOOR AFIQ WITRI, M.Eng
 PRELIMINARY STUDY OF COMPUTATIONAL SETUP FOR URBAN STREET CANYONS by MUHAMMAD NOOR AFIQ WITRI, M.Eng 1 CONTENTS 1.Introduction 2.Building Configuration 3.Boundary Condition 4.Previous Works 5.Summary 2
Practical Analysis Of Turbulent Flow In A Pipe Using Computational Fluid Dynamics
 International Journal of Engineering Inventions e-issn: 2278-7461, p-issn: 2319-6491 Volume 3, Issue 12 [December. 2014] PP: 77-81 Practical Analysis Of Turbulent Flow In A Pipe Using Computational Fluid
ABSTRACT I. INTRODUCTION
 2017 IJSRSET Volume 3 Issue 3 Print ISSN: 2395-1990 Online ISSN : 2394-4099 Themed Section: Engineering and Technology CFD Analysis of Flow through Single and Multi Stage Eccentric Orifice Plate Assemblies
NUMERICAL OPTIMIZATION OF THE SHAPE OF A HOLLOW PROJECTILE
 NUMERICAL OPTIMIZATION OF THE SHAPE OF A HOLLOW PROJECTILE Wessam Mahfouz Elnaggar, Zhihua Chen and Hui Zhang Key Laboratory of Transient Physics, Nanjing University of Science and Technology, Nanjing,
Numerical Simulation of Flow Around An Elliptical Cylinder at High Reynolds Numbers
 International Journal of Fluids Engineering. ISSN 0974-3138 Volume 5, Number 1 (2013), pp. 29-37 International Research Publication House http://www.irphouse.com Numerical Simulation of Flow Around An
Numerical investigation of swirl flow inside a supersonic nozzle
 Advances in Fluid Mechanics IX 131 Numerical investigation of swirl flow inside a supersonic nozzle E. Eslamian, H. Shirvani & A. Shirvani Faculty of Science and Technology, Anglia Ruskin University, UK
CFD SIMULATION OF A SINGLE PHASE FLOW IN A PIPE SEPARATOR USING REYNOLDS STRESS METHOD
 CFD SIMULATION OF A SINGLE PHASE FLOW IN A PIPE SEPARATOR USING REYNOLDS STRESS METHOD Eyitayo A. Afolabi 1 and J. G. M. Lee 2 1 Department of Chemical Engineering, Federal University of Technology, Minna,
Fluids. Fluids in Motion or Fluid Dynamics
 Fluids Fluids in Motion or Fluid Dynamics Resources: Serway - Chapter 9: 9.7-9.8 Physics B Lesson 3: Fluid Flow Continuity Physics B Lesson 4: Bernoulli's Equation MIT - 8: Hydrostatics, Archimedes' Principle,
Analysis of Mixing Chambers for the Processing of Two-Component Adhesives for Transport Applications
 Analysis of Mixing Chambers for the Processing of Two-Component Adhesives for Transport Applications P. Steinert* 1, I. Schaarschmidt 1, R. Paul 1, M. Zinecker 1, M. Hackert-Oschätzchen 1, Th. Muschalek
Numerical Simulations of the Mars Science! Laboratory Supersonic Parachute!
 Numerical Simulations of the Mars Science! Laboratory Supersonic Parachute! Graham V. Candler! Vladimyr Gidzak! William L. Garrard! University of Minnesota! Keith Stein! Bethel University! Supported by