Diploma Part 2. Quantitative Methods. Examiners Suggested Answers
|
|
|
- Andrew Hawkins
- 5 years ago
- Views:
Transcription
1 Diploma Part 2 Quantitative Methods Examiners Suggested Answers Q1 (a) A frequency distribution is a table or graph (i.e. a histogram) that shows the total number of measurements that fall in each of a number of class intervals. A probability distribution shows the probabilities associated with all the possible values of a random variable. (b) Using the binomial distribution with p = 0.25, q = 0.75 and n = 5, P(2) = 5 C 2 (0.25) 2 (0.75) 3 = (c) Using the Poisson distribution with µ = 3.5, P(more than 3) = 1 [P(0) + P(1) + P(2) + P(3)] = (d) (i) z = ( )/4 = Required proportion = (ii) z 1 = ( )/4 = 1.75 z 2 = ( )/4 = 0.5 Required proportion =
2 Q2 (a) Mean = Median = 100 Mode = 105 (b) Standard deviation (n) = Standard deviation (n 1) = (c) The standard error of the mean is the standard deviation of the sampling distribution of the mean. σ SE = = 222. n 30 (d) 95% confidence interval = ± ( ) 95% confidence interval = ± % confidence interval = ± ( ) 95% confidence interval = ± 5.72 (e) H 0 : µ 95 H 1 : µ > 95 At the 5% level, the critical value of z = (one-tailed test) z = = Cannot reject H 0.
3 Q3 (a) Let y be Aptitude and x be Age. Then, x = 289, y = 1085, xy = 30495, x = 9159, y = , n = R = ( ) ( ) {( ) 289 } ( ) 1085 { } = 2 2 = 0.89 This represents relatively strong, negative linear correlation. (b) 8615 b = = = a = y bx = (( 1. 07) 28. 9) = So, yˆ = x (c) The regression equation suggests that younger applicants gain higher scores in the aptitude test, and the equation could be used to predict aptitude score from an applicant s age. This is not likely to be very useful because the sample is small and other influences on aptitude are not considered. (d) Aptitude: Ranking: (e) 6 13 Spearman s R = 1 = ( 100 1) This suggests a high degree of positive correlation.
4 Q4 (a) Seasonal variation refers to any consistent pattern in a variable over some time period within a year. Data is said to be seasonally adjusted when the seasonal variation has been removed so that only the trend and random variations remain. (b) (i) Let y be the number of new stereo systems sold: y Trend (centred 4-pt MA) (ii) Qtrs Years Average : Adjusted : (iii) The seasonally adjusted series is: , , , , , , , , , , , , , , ,
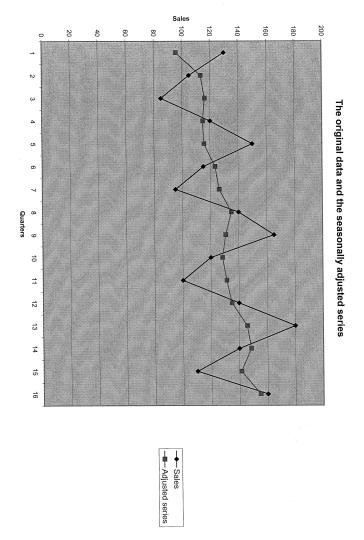
5 (iv)
6 Q5 (a) Break-even analysis enables business people to identify the level of output at which the total cost of production is equal to total revenue, so that no profit is being made. It may be useful as a means of indicating the point at which profits will start to be made and by concentrating managers minds on the determinants of costs and revenues. The simplifying assumptions upon which the model is based may limit its usefulness in practice. (b) (i) At the break-even level, Total revenue = Total cost. 60Q = Q 50Q = Q = 4000 So the break-even level of output is 4,000 units per month. (ii) Profit = R C = 50Q So profit is 5,000 when: 50Q = = Q = 4100 So the required quantity is 4,100 units per month. (iii) When 50Q = 10000, Q = 3800 Since the break-even level is 4,000, an additional 200 units are required to break even. (iv) Now 70Q = 10Q Now 70Q = 4400 So the new break-even level is 4,400 units per month.
7 Q6 (a) (i) H 0 : π 0.5 H 1 : π > 0.5 where π is the proportion of male compact car buyers. (ii) At the 5% level of significance, the critical z-value is So the null hypothesis will be rejected if z > (one-tailed test). (iii) z = = (iv) Since < 1.645, the null hypothesis cannot be rejected. The evidence does not support the claim that more than half the buyers of compact cars are men. (b) H 0 : µ N = µ S H 1 : µ N µ S where µ N and µ S are the mean house prices in the north and south respectively. In a two-tailed test, at the 5% level of significance, the critical z-value is ±1.96. z = = Reject the null hypothesis. The evidence suggests that house prices are not the same in the two regions.
8 Q7 (a) A weighted index takes into account the relative importance of each item included in the index. Unweighted price index numbers suffer from the serious disadvantage that they do not make any allowance for the relative importance of each item in the average household s budget. To calculate a more useful index, therefore, the unit prices should be weighted in such a way that the weights reflect the relative importance of each item. Quantities purchased are often used as weights for price indices. (b) (i) Aggregate quantity index = qn q = = (ii) Price relatives (q n /q 0 ) 120/150 = /110 = /60 = So the arithmetic mean of quantity relatives is = (iii) (q n /q 0 ) w = = = Weighted Index = ( ) 100 = 92.54
9 Q8 (a) Relevant points might include: Postal questionnaires are useful and convenient ways of obtaining primary data. They can cover a wide geographical area at low cost and can include a wide range of questions. However, it is difficult to design easy-to-understand and non-ambiguous questions. There may be a low response rate and non-response bias. Interviewing is a useful and very direct way of obtaining primary data. But it can be expensive and time-consuming to obtain a sufficiently large and random sample. Interviewers need to be well trained. Leading questions should be avoided. Respondents may not answer truthfully and non-response bias may be a problem. (b) (i) Need to obtain a sampling frame from which a sample can be selected (this might come from the manufacturer s list of past customers). Then describe a sampling method (such as cluster sampling) that will be less costly than simple random or stratified sampling. (ii) One possibility would be to use personal interviews in which consumers are shown the designs and asked to rank them in order of preference, based on different criteria (e.g. colour, texture, etc.) (iii) An average ranking or score for each design for each criteria could be calculated and presented in a table, together with some overall conclusions and recommendations for the manufacturer.
Diploma Part 2. Quantitative Methods. Examiner s Suggested Answers
 Diploma Part Quantitative Methods Examiner s Suggested Answers Question 1 (a) The standard normal distribution has a symmetrical and bell-shaped graph with a mean of zero and a standard deviation equal
Review 6. n 1 = 85 n 2 = 75 x 1 = x 2 = s 1 = 38.7 s 2 = 39.2
 Review 6 Use the traditional method to test the given hypothesis. Assume that the samples are independent and that they have been randomly selected ) A researcher finds that of,000 people who said that
Answer keys for Assignment 10: Measurement of study variables (The correct answer is underlined in bold text)
") Answer keys for Assignment 10: Measurement of study variables (The correct answer is underlined in bold text) 1. A quick and easy indicator of dispersion is a. Arithmetic mean b. Variance c. Standard deviation
Answer keys for Assignment 10: Measurement of study variables (The correct answer is underlined in bold text) 1. A quick and easy indicator of dispersion is a. Arithmetic mean b. Variance c. Standard deviation
Glossary. The ISI glossary of statistical terms provides definitions in a number of different languages:
 Glossary The ISI glossary of statistical terms provides definitions in a number of different languages: http://isi.cbs.nl/glossary/index.htm Adjusted r 2 Adjusted R squared measures the proportion of the
SECTION 5.1: Polynomials
 1 SECTION 5.1: Polynomials Functions Definitions: Function, Independent Variable, Dependent Variable, Domain, and Range A function is a rule that assigns to each input value x exactly output value y =
You are permitted to use your own calculator where it has been stamped as approved by the University.
 ECONOMICS TRIPOS Part I Friday 11 June 004 9 1 Paper 3 Quantitative Methods in Economics This exam comprises four sections. Sections A and B are on Mathematics; Sections C and D are on Statistics. You
ANOVA - analysis of variance - used to compare the means of several populations.
 12.1 One-Way Analysis of Variance ANOVA - analysis of variance - used to compare the means of several populations. Assumptions for One-Way ANOVA: 1. Independent samples are taken using a randomized design.
Salt Lake Community College MATH 1040 Final Exam Fall Semester 2011 Form E
 Salt Lake Community College MATH 1040 Final Exam Fall Semester 011 Form E Name Instructor Time Limit: 10 minutes Any hand-held calculator may be used. Computers, cell phones, or other communication devices
Bus 216: Business Statistics II Introduction Business statistics II is purely inferential or applied statistics.
 Bus 216: Business Statistics II Introduction Business statistics II is purely inferential or applied statistics. Study Session 1 1. Random Variable A random variable is a variable that assumes numerical
Math 2000 Practice Final Exam: Homework problems to review. Problem numbers
 Math 2000 Practice Final Exam: Homework problems to review Pages: Problem numbers 52 20 65 1 181 14 189 23, 30 245 56 256 13 280 4, 15 301 21 315 18 379 14 388 13 441 13 450 10 461 1 553 13, 16 561 13,
Statistics Handbook. All statistical tables were computed by the author.
 Statistics Handbook Contents Page Wilcoxon rank-sum test (Mann-Whitney equivalent) Wilcoxon matched-pairs test 3 Normal Distribution 4 Z-test Related samples t-test 5 Unrelated samples t-test 6 Variance
Business Statistics. Lecture 9: Simple Regression
 Business Statistics Lecture 9: Simple Regression 1 On to Model Building! Up to now, class was about descriptive and inferential statistics Numerical and graphical summaries of data Confidence intervals
Statistics 2. Revision Notes
 Statistics 2 Revision Notes June 2016 2 S2 JUNE 2016 SDB Statistics 2 1 The Binomial distribution 5 Factorials... 5 Combinations... 5 Properties of n C r... 5 Binomial Theorem... 6 Binomial coefficients...
FCE 3900 EDUCATIONAL RESEARCH LECTURE 8 P O P U L A T I O N A N D S A M P L I N G T E C H N I Q U E
 FCE 3900 EDUCATIONAL RESEARCH LECTURE 8 P O P U L A T I O N A N D S A M P L I N G T E C H N I Q U E OBJECTIVE COURSE Understand the concept of population and sampling in the research. Identify the type
LC OL - Statistics. Types of Data
 LC OL - Statistics Types of Data Question 1 Characterise each of the following variables as numerical or categorical. In each case, list any three possible values for the variable. (i) Eye colours in a
Inferences Based on Two Samples
 Chapter 6 Inferences Based on Two Samples Frequently we want to use statistical techniques to compare two populations. For example, one might wish to compare the proportions of families with incomes below
9/2/2010. Wildlife Management is a very quantitative field of study. throughout this course and throughout your career.
 Introduction to Data and Analysis Wildlife Management is a very quantitative field of study Results from studies will be used throughout this course and throughout your career. Sampling design influences
104 Business Research Methods - MCQs
 104 Business Research Methods - MCQs 1) Process of obtaining a numerical description of the extent to which a person or object possesses some characteristics a) Measurement b) Scaling c) Questionnaire
Basics of Experimental Design. Review of Statistics. Basic Study. Experimental Design. When an Experiment is Not Possible. Studying Relations
 Basics of Experimental Design Review of Statistics And Experimental Design Scientists study relation between variables In the context of experiments these variables are called independent and dependent
Module 9: Sampling IPDET. Sampling. Intro Concepts Types Confidence/ Precision? How Large? Intervention or Policy. Evaluation Questions
 IPDET Module 9: Sampling Sampling Intervention or Policy Evaluation Questions Design Approaches Data Collection Intro Concepts Types Confidence/ Precision? How Large? Introduction Introduction to Sampling
SALES AND MARKETING Department MATHEMATICS. 2nd Semester. Bivariate statistics. Tutorials and exercises
 SALES AND MARKETING Department MATHEMATICS 2nd Semester Bivariate statistics Tutorials and exercises Online document: http://jff-dut-tc.weebly.com section DUT Maths S2. IUT de Saint-Etienne Département
Study Unit 3 : Linear algebra
 1 Study Unit 3 : Linear algebra Chapter 3 : Sections 3.1, 3.2.1, 3.2.5, 3.3 Study guide C.2, C.3 and C.4 Chapter 9 : Section 9.1 1. Two equations in two unknowns Algebraically Method 1: Elimination Step
STAT 212 Business Statistics II 1
 STAT 1 Business Statistics II 1 KING FAHD UNIVERSITY OF PETROLEUM & MINERALS DEPARTMENT OF MATHEMATICAL SCIENCES DHAHRAN, SAUDI ARABIA STAT 1: BUSINESS STATISTICS II Semester 091 Final Exam Thursday Feb
Math 58. Rumbos Fall More Review Problems Solutions
 Math 58. Rumbos Fall 2008 1 More Review Problems Solutions 1. A particularly common question in the study of wildlife behavior involves observing contests between residents of a particular area and intruders.
EDEXCEL S2 PAPERS MARK SCHEMES AVAILABLE AT:
 EDEXCEL S2 PAPERS 2009-2007. MARK SCHEMES AVAILABLE AT: http://www.physicsandmathstutor.com/a-level-maths-papers/s2-edexcel/ JUNE 2009 1. A bag contains a large number of counters of which 15% are coloured
Application of Statistical Analysis in Population and Sampling Population
 Quest Journals Journal of Electronics and Communication Engineering Research Volume 2 ~ Issue 9 (2015) pp: 01-05 ISSN(Online) : 2321-5941 www.questjournals.org Research Paper Application of Statistical
The Purpose of Hypothesis Testing
 Section 8 1A:! An Introduction to Hypothesis Testing The Purpose of Hypothesis Testing See s Candy states that a box of it s candy weighs 16 oz. They do not mean that every single box weights exactly 16
Examine characteristics of a sample and make inferences about the population
 Chapter 11 Introduction to Inferential Analysis Learning Objectives Understand inferential statistics Explain the difference between a population and a sample Explain the difference between parameter and
Nonparametric Statistics
 Nonparametric Statistics Nonparametric or Distribution-free statistics: used when data are ordinal (i.e., rankings) used when ratio/interval data are not normally distributed (data are converted to ranks)
LI EAR REGRESSIO A D CORRELATIO
 CHAPTER 6 LI EAR REGRESSIO A D CORRELATIO Page Contents 6.1 Introduction 10 6. Curve Fitting 10 6.3 Fitting a Simple Linear Regression Line 103 6.4 Linear Correlation Analysis 107 6.5 Spearman s Rank Correlation
ECON1310 Quantitative Economic and Business Analysis A
 ECON1310 Quantitative Economic and Business Analysis A Topic 1 Descriptive Statistics 1 Main points - Statistics descriptive collecting/presenting data; inferential drawing conclusions from - Data types
Teaching S1/S2 statistics using graphing technology
 Teaching S1/S2 statistics using graphing technology CALCULATOR HINTS FOR S1 & 2 STATISTICS - STAT MENU (2) on Casio. It is advised that mean and standard deviation are obtained directly from a calculator.
Macomb Community College Department of Mathematics. Review for the Math 1340 Final Exam
 Macomb Community College Department of Mathematics Review for the Math 0 Final Exam WINTER 0 MATH 0 Practice Final Exam WI0 Math0PF/lm Page of MATH 0 Practice Final Exam MATH 0 DEPARTMENT REVIEW FOR THE
psychological statistics
 psychological statistics B Sc. Counselling Psychology 011 Admission onwards III SEMESTER COMPLEMENTARY COURSE UNIVERSITY OF CALICUT SCHOOL OF DISTANCE EDUCATION CALICUT UNIVERSITY.P.O., MALAPPURAM, KERALA,
********************************************************************************************************
 QUESTION # 1 1. Let the random variable X represent the number of telephone lines in use by the technical support center of a software manufacturer at noon each day. The probability distribution of X is
STATISTICS ( CODE NO. 08 ) PAPER I PART - I
 PAPER I PART - I") STATISTICS ( CODE NO. 08 ) PAPER I PART - I 1. Descriptive Statistics Types of data - Concepts of a Statistical population and sample from a population ; qualitative and quantitative data ; nominal and
STATISTICS ( CODE NO. 08 ) PAPER I PART - I 1. Descriptive Statistics Types of data - Concepts of a Statistical population and sample from a population ; qualitative and quantitative data ; nominal and
Lecture 5: Sampling Methods
 Lecture 5: Sampling Methods What is sampling? Is the process of selecting part of a larger group of participants with the intent of generalizing the results from the smaller group, called the sample, to
Georgia Kayser, PhD. Module 4 Approaches to Sampling. Hello and Welcome to Monitoring Evaluation and Learning: Approaches to Sampling.
 Slide 1 Module 4 Approaches to Sampling Georgia Kayser, PhD Hello and Welcome to Monitoring Evaluation and Learning: Approaches to Sampling Slide 2 Objectives To understand the reasons for sampling populations
A4. Methodology Annex: Sampling Design (2008) Methodology Annex: Sampling design 1
 Methodology Annex: Sampling design 1") A4. Methodology Annex: Sampling Design (2008) Methodology Annex: Sampling design 1 Introduction The evaluation strategy for the One Million Initiative is based on a panel survey. In a programme such as
A4. Methodology Annex: Sampling Design (2008) Methodology Annex: Sampling design 1 Introduction The evaluation strategy for the One Million Initiative is based on a panel survey. In a programme such as
Marketing Research Session 10 Hypothesis Testing with Simple Random samples (Chapter 12)
") Marketing Research Session 10 Hypothesis Testing with Simple Random samples (Chapter 12) Remember: Z.05 = 1.645, Z.01 = 2.33 We will only cover one-sided hypothesis testing (cases 12.3, 12.4.2, 12.5.2,
Marketing Research Session 10 Hypothesis Testing with Simple Random samples (Chapter 12) Remember: Z.05 = 1.645, Z.01 = 2.33 We will only cover one-sided hypothesis testing (cases 12.3, 12.4.2, 12.5.2,
12-1. Example 1: Which relations below represent functions? State the domains and ranges. a) {(9,81), (4,16), (5,25), ( 2,4), ( 6,36)} Function?
 {(9,81), (4,16), (5,25), ( 2,4), ( 6,36)} Function?") MA 000, Lessons a and b Introduction to Functions Algebra: Sections 3.5 and 7.4 Calculus: Sections 1. and.1 Definition: A relation is any set of ordered pairs. The set of first components in the ordered
MA 000, Lessons a and b Introduction to Functions Algebra: Sections 3.5 and 7.4 Calculus: Sections 1. and.1 Definition: A relation is any set of ordered pairs. The set of first components in the ordered
COVENANT UNIVERSITY NIGERIA TUTORIAL KIT OMEGA SEMESTER PROGRAMME: ECONOMICS
 COVENANT UNIVERSITY NIGERIA TUTORIAL KIT OMEGA SEMESTER PROGRAMME: ECONOMICS COURSE: CBS 221 DISCLAIMER The contents of this document are intended for practice and leaning purposes at the undergraduate
Teaching Research Methods: Resources for HE Social Sciences Practitioners. Sampling
 Sampling Session Objectives By the end of the session you will be able to: Explain what sampling means in research List the different sampling methods available Have had an introduction to confidence levels
Math 221, REVIEW, Instructor: Susan Sun Nunamaker
 Math 221, REVIEW, Instructor: Susan Sun Nunamaker Good Luck & Contact me through through e-mail if you have any questions. 1. Bar graphs can only be vertical. a. true b. false 2.
Practical Statistics for the Analytical Scientist Table of Contents
 Practical Statistics for the Analytical Scientist Table of Contents Chapter 1 Introduction - Choosing the Correct Statistics 1.1 Introduction 1.2 Choosing the Right Statistical Procedures 1.2.1 Planning
Chapter 16. Simple Linear Regression and dcorrelation
 Chapter 16 Simple Linear Regression and dcorrelation 16.1 Regression Analysis Our problem objective is to analyze the relationship between interval variables; regression analysis is the first tool we will
CHAPTER 8 INTRODUCTION TO STATISTICAL ANALYSIS
 CHAPTER 8 INTRODUCTION TO STATISTICAL ANALYSIS LEARNING OBJECTIVES: After studying this chapter, a student should understand: notation used in statistics; how to represent variables in a mathematical form
Exam details. Final Review Session. Things to Review
 Exam details Final Review Session Short answer, similar to book problems Formulae and tables will be given You CAN use a calculator Date and Time: Dec. 7, 006, 1-1:30 pm Location: Osborne Centre, Unit
Regression Models REVISED TEACHING SUGGESTIONS ALTERNATIVE EXAMPLES
 M04_REND6289_10_IM_C04.QXD 5/7/08 2:49 PM Page 46 4 C H A P T E R Regression Models TEACHING SUGGESTIONS Teaching Suggestion 4.1: Which Is the Independent Variable? We find that students are often confused
TECH 646 Analysis of Research in Industry and Technology
 TECH 646 Analysis of Research in Industry and Technology PART III The Sources and Collection of data: Measurement, Measurement Scales, Questionnaires & Instruments, Ch. 14 Lecture note based on the text
Chapter 16. Simple Linear Regression and Correlation
 Chapter 16 Simple Linear Regression and Correlation 16.1 Regression Analysis Our problem objective is to analyze the relationship between interval variables; regression analysis is the first tool we will
GROUPED DATA E.G. FOR SAMPLE OF RAW DATA (E.G. 4, 12, 7, 5, MEAN G x / n STANDARD DEVIATION MEDIAN AND QUARTILES STANDARD DEVIATION
 FOR SAMPLE OF RAW DATA (E.G. 4, 1, 7, 5, 11, 6, 9, 7, 11, 5, 4, 7) BE ABLE TO COMPUTE MEAN G / STANDARD DEVIATION MEDIAN AND QUARTILES Σ ( Σ) / 1 GROUPED DATA E.G. AGE FREQ. 0-9 53 10-19 4...... 80-89
Chapter 3. Comparing two populations
 Chapter 3. Comparing two populations Contents Hypothesis for the difference between two population means: matched pairs Hypothesis for the difference between two population means: independent samples Two
S2 QUESTIONS TAKEN FROM JANUARY 2006, JANUARY 2007, JANUARY 2008, JANUARY 2009
 S2 QUESTIONS TAKEN FROM JANUARY 2006, JANUARY 2007, JANUARY 2008, JANUARY 2009 SECTION 1 The binomial and Poisson distributions. Students will be expected to use these distributions to model a real-world
Math 1314 Lesson 19: Numerical Integration
 Math 1314 Lesson 19: Numerical Integration For more complicated functions, we will use GeoGebra to find the definite integral. These will include functions that involve the exponential function, logarithms,
Midterm 2 - Solutions
 Ecn 102 - Analysis of Economic Data University of California - Davis February 24, 2010 Instructor: John Parman Midterm 2 - Solutions You have until 10:20am to complete this exam. Please remember to put
STATE COUNCIL OF EDUCATIONAL RESEARCH AND TRAINING TNCF DRAFT SYLLABUS
 STATE COUNCIL OF EDUCATIONAL RESEARCH AND TRAINING TNCF 2017 - DRAFT SYLLABUS Subject :Business Maths Class : XI Unit 1 : TOPIC Matrices and Determinants CONTENT Determinants - Minors; Cofactors; Evaluation
Part I. Sampling design. Overview. INFOWO Lecture M6: Sampling design and Experiments. Outline. Sampling design Experiments.
 Overview INFOWO Lecture M6: Sampling design and Experiments Peter de Waal Sampling design Experiments Department of Information and Computing Sciences Faculty of Science, Universiteit Utrecht Lecture 4:
What is sampling? shortcut whole population small part Why sample? not enough; time, energy, money, labour/man power, equipment, access measure
 What is sampling? A shortcut method for investigating a whole population Data is gathered on a small part of the whole parent population or sampling frame, and used to inform what the whole picture is
Business Mathematics and Statistics (MATH0203) Chapter 1: Correlation & Regression
 Chapter 1: Correlation & Regression") Business Mathematics and Statistics (MATH0203) Chapter 1: Correlation & Regression Dependent and independent variables The independent variable (x) is the one that is chosen freely or occur naturally.
Business Mathematics and Statistics (MATH0203) Chapter 1: Correlation & Regression Dependent and independent variables The independent variable (x) is the one that is chosen freely or occur naturally.
Business Statistics: A First Course
 Business Statistics: A First Course 5 th Edition Chapter 7 Sampling and Sampling Distributions Basic Business Statistics, 11e 2009 Prentice-Hall, Inc. Chap 7-1 Learning Objectives In this chapter, you
POPULATION AND SAMPLE
 1 POPULATION AND SAMPLE Population. A population refers to any collection of specified group of human beings or of non-human entities such as objects, educational institutions, time units, geographical
Jakarta, Indonesia,29 Sep-10 October 2014.
 Regional Training Course on Sampling Methods for Producing Core Data Items for Agricultural and Rural Statistics Jakarta, Indonesia,29 Sep-0 October 204. LEARNING OBJECTIVES At the end of this session
Exam 2 (KEY) July 20, 2009
 July 20, 2009") STAT 2300 Business Statistics/Summer 2009, Section 002 Exam 2 (KEY) July 20, 2009 Name: USU A#: Score: /225 Directions: This exam consists of six (6) questions, assessing material learned within Modules
STAT 2300 Business Statistics/Summer 2009, Section 002 Exam 2 (KEY) July 20, 2009 Name: USU A#: Score: /225 Directions: This exam consists of six (6) questions, assessing material learned within Modules
Sections 6.1 and 6.2: The Normal Distribution and its Applications
 Sections 6.1 and 6.2: The Normal Distribution and its Applications Definition: A normal distribution is a continuous, symmetric, bell-shaped distribution of a variable. The equation for the normal distribution
Glossary for the Triola Statistics Series
 Glossary for the Triola Statistics Series Absolute deviation The measure of variation equal to the sum of the deviations of each value from the mean, divided by the number of values Acceptance sampling
DSST Principles of Statistics
 DSST Principles of Statistics Time 10 Minutes 98 Questions Each incomplete statement is followed by four suggested completions. Select the one that is best in each case. 1. Which of the following variables
University of Chicago Graduate School of Business. Business 41000: Business Statistics
 Name: OUTLINE SOLUTION University of Chicago Graduate School of Business Business 41000: Business Statistics Special Notes: 1. This is a closed-book exam. You may use an 8 11 piece of paper for the formulas.
STAT Section 3.4: The Sign Test. The sign test, as we will typically use it, is a method for analyzing paired data.
 STAT 518 --- Section 3.4: The Sign Test The sign test, as we will typically use it, is a method for analyzing paired data. Examples of Paired Data: Similar subjects are paired off and one of two treatments
1. A machine produces packets of sugar. The weights in grams of thirty packets chosen at random are shown below.
 No Gdc 1. A machine produces packets of sugar. The weights in grams of thirty packets chosen at random are shown below. Weight (g) 9.6 9.7 9.8 9.9 30.0 30.1 30. 30.3 Frequency 3 4 5 7 5 3 1 Find unbiased
(ii) Scan your answer sheets INTO ONE FILE only, and submit it in the drop-box.
 Scan your answer sheets INTO ONE FILE only, and submit it in the drop-box.") FINAL EXAM ** Two different ways to submit your answer sheet (i) Use MS-Word and place it in a drop-box. (ii) Scan your answer sheets INTO ONE FILE only, and submit it in the drop-box. Deadline: December
FINAL EXAM ** Two different ways to submit your answer sheet (i) Use MS-Word and place it in a drop-box. (ii) Scan your answer sheets INTO ONE FILE only, and submit it in the drop-box. Deadline: December
YISHUN JUNIOR COLLEGE 2017 JC2 Preliminary Examination
 YISHUN JUNIOR COLLEGE 07 JC Preliminary Examination MATHEMATICS 8864/0 HIGHER 8 AUGUST 07 MONDAY 0800h 00h Additional materials : Answer paper List of Formulae (MF5) TIME 3 hours READ THESE INSTRUCTIONS
PRE-LEAVING CERTIFICATE EXAMINATION, 2015 MARKING SCHEME MATHEMATICS HIGHER LEVEL
 PRE-LEAVING CERTIFICATE EXAMINATION, 05 MARKING SCHEME MATHEMATICS HIGHER LEVEL Page of 40 OVERVIEW OF MARKING SCHEME Scale label A B C D E No of categories 4 5 6 5 mark scale 0, 5 0,, 5 0,,, 5 0 mark
Confidence intervals and Hypothesis testing
 Confidence intervals and Hypothesis testing Confidence intervals offer a convenient way of testing hypothesis (all three forms). Procedure 1. Identify the parameter of interest.. Specify the significance
Industrial Engineering Prof. Inderdeep Singh Department of Mechanical & Industrial Engineering Indian Institute of Technology, Roorkee
 Industrial Engineering Prof. Inderdeep Singh Department of Mechanical & Industrial Engineering Indian Institute of Technology, Roorkee Module - 04 Lecture - 05 Sales Forecasting - II A very warm welcome
Applied Statistics in Business & Economics, 5 th edition
 A PowerPoint Presentation Package to Accompany Applied Statistics in Business & Economics, 5 th edition David P. Doane and Lori E. Seward Prepared by Lloyd R. Jaisingh McGraw-Hill/Irwin Copyright 2015
STATISTICS AND BUSINESS MATHEMATICS B.com-1 Private Annual Examination 2015
 B.com-1 STATISTICS AND BUSINESS MATHEMATICS B.com-1 Private Annual Examination 2015 Compiled & Solved By: JAHANGEER KHAN (SECTION A) Q.1 (a): Find the distance between the points (1, 2), (4, 5). SOLUTION
CHOOSING THE RIGHT SAMPLING TECHNIQUE FOR YOUR RESEARCH. Awanis Ku Ishak, PhD SBM
 CHOOSING THE RIGHT SAMPLING TECHNIQUE FOR YOUR RESEARCH Awanis Ku Ishak, PhD SBM Sampling The process of selecting a number of individuals for a study in such a way that the individuals represent the larger
Time: 1 hour 30 minutes
 Paper Reference(s) 6684/01 Edexcel GCE Statistics S2 Bronze Level B4 Time: 1 hour 30 minutes Materials required for examination papers Mathematical Formulae (Green) Items included with question Nil Candidates
12 STD BUSINESS MATHEMATICS
 STD BUSINESS MATHEMATICS www.kalvisolai.com 0 MARK FAQ S: CHAPTER :. APPLICATION OF MATRICES AND DETERMINANTS. If A verify that AAdjA AdjA A AI. (M 0). Show that the equations y + z = 7, + y 5z =, + y
EXAM 3 Math 1342 Elementary Statistics 6-7
 EXAM 3 Math 1342 Elementary Statistics 6-7 Name Date ********************************************************************************************************************************************** MULTIPLE
Dover- Sherborn High School Mathematics Curriculum Probability and Statistics
 Mathematics Curriculum A. DESCRIPTION This is a full year courses designed to introduce students to the basic elements of statistics and probability. Emphasis is placed on understanding terminology and
Ch. 16 SAMPLING DESIGNS AND SAMPLING PROCEDURES
 www.wernermurhadi.wordpress.com Ch. 16 SAMPLING DESIGNS AND SAMPLING PROCEDURES Dr. Werner R. Murhadi Sampling Terminology Sample is a subset, or some part, of a larger population. population (universe)
Answer key. Statistics March Section A
 Answer key Statistics March 2018 Section A One mark 1. Cohort is a group of individuals who are born at the same time and who experience the same mortality conditions 2. 100 3. Base year quantities 4.
Systems of Linear Equations in Two Variables. Break Even. Example. 240x x This is when total cost equals total revenue.
 Systems of Linear Equations in Two Variables 1 Break Even This is when total cost equals total revenue C(x) = R(x) A company breaks even when the profit is zero P(x) = R(x) C(x) = 0 2 R x 565x C x 6000
Chapter 7: Hypothesis Testing - Solutions
 Chapter 7: Hypothesis Testing - Solutions 7.1 Introduction to Hypothesis Testing The problem with applying the techniques learned in Chapter 5 is that typically, the population mean (µ) and standard deviation
JOINT UNIVERSITIES PRELIMINARY EXAMINATIONS BOARD
 JOINT UNIVERSITIES PRELIMINARY EXAMINATIONS BOARD 2015 EXAMINATIONS MATHEMATICS: SCI-J154 MULTIPLE CHOICE QUESTIONS 1. Find the non-zero negative value of x which satisfies the equation x 1 0 1 x 1 0 1
Chapter 6 Assessment. 3. Which points in the data set below are outliers? Multiple Choice. 1. The boxplot summarizes the test scores of a math class?
 Chapter Assessment Multiple Choice 1. The boxplot summarizes the test scores of a math class? Test Scores 3. Which points in the data set below are outliers? 73, 73, 7, 75, 75, 75, 77, 77, 77, 77, 7, 7,
CORRELATION AND SIMPLE REGRESSION 10.0 OBJECTIVES 10.1 INTRODUCTION
 UNIT 10 CORRELATION AND SIMPLE REGRESSION STRUCTURE 10.0 Objectives 10.1 Introduction 10. Correlation 10..1 Scatter Diagram 10.3 The Correlation Coefficient 10.3.1 Karl Pearson s Correlation Coefficient
Statistics I Exercises Lesson 3 Academic year 2015/16
 Statistics I Exercises Lesson 3 Academic year 2015/16 1. The following table represents the joint (relative) frequency distribution of two variables: semester grade in Estadística I course and # of hours
CHAPTER 20. Sample Survey CONTENTS
 CHAPTER 20 Sample Survey CONTENTS STATISTICS IN PRACTICE: CINERGY 20.1 TERMINOLOGY USED IN SAMPLE SURVEYS 20.2 TYPES OF SURVEYS AND SAMPLING METHODS 20.3 SURVEY ERRORS Nonsampling Error Sampling Error
Sampling. Module II Chapter 3
 Sampling Module II Chapter 3 Topics Introduction Terms in Sampling Techniques of Sampling Essentials of Good Sampling Introduction In research terms a sample is a group of people, objects, or items that
FURTHER MATHEMATICS. Written examination 2 (Analysis task) Wednesday 3 November 2004
 Wednesday 3 November 2004") Victorian Certificate of Education 2004 SUPERVISOR TO ATTACH PROCESSING LABEL HERE FURTHER MATHEMATICS Written examination 2 (Analysis task) Core Wednesday 3 November 2004 Reading time: 11.45 am to 12.00
Victorian Certificate of Education 2004 SUPERVISOR TO ATTACH PROCESSING LABEL HERE FURTHER MATHEMATICS Written examination 2 (Analysis task) Core Wednesday 3 November 2004 Reading time: 11.45 am to 12.00
Prepared by: DR. ROZIAH MOHD RASDI Faculty of Educational Studies Universiti Putra Malaysia
 Prepared by: DR. ROZIAH MOHD RASDI Faculty of Educational Studies Universiti Putra Malaysia roziah_m@upm.edu.my Topic 11 Sample Selection Introduction Strength of quantitative research method its ability
SL - Binomial Questions
 IB Questionbank Maths SL SL - Binomial Questions 262 min 244 marks 1. A random variable X is distributed normally with mean 450 and standard deviation 20. Find P(X 475). Given that P(X > a) = 0.27, find
Figure Figure
 Figure 4-12. Equal probability of selection with simple random sampling of equal-sized clusters at first stage and simple random sampling of equal number at second stage. The next sampling approach, shown
Ch. 16: Correlation and Regression
 Ch. 1: Correlation and Regression With the shift to correlational analyses, we change the very nature of the question we are asking of our data. Heretofore, we were asking if a difference was likely to
Correlation and regression
 NST 1B Experimental Psychology Statistics practical 1 Correlation and regression Rudolf Cardinal & Mike Aitken 11 / 12 November 2003 Department of Experimental Psychology University of Cambridge Handouts:
Test Yourself! Methodological and Statistical Requirements for M.Sc. Early Childhood Research
 Test Yourself! Methodological and Statistical Requirements for M.Sc. Early Childhood Research HOW IT WORKS For the M.Sc. Early Childhood Research, sufficient knowledge in methods and statistics is one
MTH 65-Steiner Exam #1 Review: , , 8.6. Non-Calculator sections: (Solving Systems), Chapter 5 (Operations with Polynomials)
, Chapter 5 (Operations with Polynomials)") Non-Calculator sections: 4.1-4.3 (Solving Systems), Chapter 5 (Operations with Polynomials) The following problems are examples of the types of problems you might see on the non-calculator section of the
Non-Calculator sections: 4.1-4.3 (Solving Systems), Chapter 5 (Operations with Polynomials) The following problems are examples of the types of problems you might see on the non-calculator section of the