Chapter 11 Output Analysis for a Single Model. Banks, Carson, Nelson & Nicol Discrete-Event System Simulation
|
|
|
- Victor Phillips
- 6 years ago
- Views:
Transcription
1 Chapter Output Aalysis for a Sigle Model Baks, Carso, Nelso & Nicol Discrete-Evet System Simulatio
2 Error Estimatio If {,, } are ot statistically idepedet, the S / is a biased estimator of the true variace. V( ˆ ) Almost always the case whe {,, } is a sequece of output observatios from withi a sigle replicatio (autocorrelated sequece, time-series). Suppose the poit estimator q is the sample mea i i / Variace of is almost impossible to estimate. For system with steady state, produce a output process that is approximately covariace statioary (after passig the trasiet phase). The covariace betwee two radom variables i the time series depeds oly o the lag (the # of observatios betwee them).
3 3 Error Estimatio For a covariace statioary time series, {,, }: Lag-k autocovariace is: Lag-k autocorrelatio is: If a time series is covariace statioary, the the variace of is: The expected value of the variace estimator is: ), cov( ), cov( k i i k k k k ) ( k k k V / where ), ( c B BV S E c
4 Error Estimatio The expected value of the variace estimator is: E S BV ( ), where B / c ad V ( ) is the variace of If i are idepedet, the S / is a ubiased estimator of V ( ) If the autocorrelatio k are primarily positive, the S / is biased low as a estimator of V ( ). If the autocorrelatio k are primarily egative, the S / is biased high as a estimator of V ( ). 4
5 C.I. with Specified Precisio [Termiatig Simulatios] The half-legth H of a 00( a)% cofidece iterval for a mea q, based o the t distributio, is give by: S H t a /, R R R is the # of replicatios S is the sample variace Suppose that a error criterio e is specified with probability - a, a sufficietly large sample size should satisfy: P q e a.. 5
6 C.I. with Specified Precisio [Termiatig Simulatios] Assume that a iitial sample of size R 0 (idepedet) replicatios has bee observed. Obtai a iitial estimate S 0 of the populatio variace. The, choose sample size R such that R R 0 : Sice t a/, R- z a/, a iitial estimate of R: za / S0 R, za / is the stadard ormal distributio. e t /, 0 R is the smallest iteger satisfyig R R 0 ad a R S R e Collect R - R 0 additioal observatios. The 00(-a)% C.I. for q:.. t a /, R S R 6
7 C.I. with Specified Precisio [Termiatig Simulatios] Call Ceter Example: estimate the aget s utilizatio over the first hours of the workday. Iitial sample of size R 0 = 4 is take ad a iitial estimate of the populatio variace is S 0 = (0.07) = The error criterio is e= 0.04 ad cofidece coefficiet is -a = 0.95, hece, the fial sample size must be at least: 0 z.05s0.96 * e 0.04 For the fial sample size:.4 R t 0.05, R ta /, RS0 /e R = 5 is the smallest iteger satisfyig the error criterio, so R - R 0 = additioal replicatios are eeded. After obtaiig additioal outputs, half-width should be checked. 7
8 Output Aalysis for Steady-State Simulatio Cosider a sigle ru of a simulatio model to estimate a steady-state or log-ru characteristics of the system. The sigle ru produces observatios,,... (geerally the samples of a autocorrelated time series). Performace measure: q lim T i lim 0 T E E T, E for discrete measure Idepedet of the iitial coditios. i ( t) dt, for cotiuous measure (with probability ) (with probability ) 8
9 Output Aalysis for Steady-State Simulatio The sample size is a desig choice, with several cosideratios i mid: Ay bias i the poit estimator that is due to artificial or arbitrary iitial coditios (bias ca be severe if ru legth is too short). Desired precisio of the poit estimator. Budget costraits o computer resources. Notatio: the estimatio of q from a discrete-time output process. Oe replicatio (or ru), the output data:,, 3, With several replicatios, the output data for replicatio r: r, r, r3, 9
10 Iitializatio Bias Methods to reduce the poit-estimator bias caused by usig artificial ad urealistic iitial coditios: Itelliget iitializatio. Divide simulatio ito a iitializatio phase ad data-collectio phase. Itelliget iitializatio Iitialize the simulatio i a state that is more represetative of log-ru coditios. If the system exists, collect data o it ad use these data to specify more early typical iitial coditios. If the system ca be simplified eough to make it mathematically solvable, e.g. queueig models, solve the simplified model to fid log-ru expected or most likely coditios, use that to iitialize the simulatio. 0
11 Iitializatio Bias Divide each simulatio ito two phases: A iitializatio phase, from time 0 to time T 0. A data-collectio phase, from T 0 to the stoppig time T 0 +T E. The choice of T 0 is importat: After T 0, system should be more early represetative of steady-state behavior. System has reached steady state: the probability distributio of the system state is close to the steady-state probability distributio (bias of respose variable is egligible).
12 Iitializatio Bias M/G/ queueig example: A total of 0 idepedet replicatios were made. Each replicatio begiig i the empty ad idle state. Simulatio ru legth o each replicatio was T 0 +T E = 5,000 miutes. Respose variable: queue legth, L Q (t,r) (at time t of the rth replicatio). Batchig itervals of,000 miutes, batch meas Esemble averages: To idetify tred i the data due to iitializatio bias The average correspodig batch meas across replicatios:. j rj R r The preferred method to determie deletio poit. R R replicatios
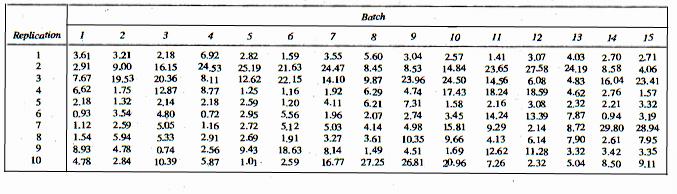
13 Iitializatio Bias 3
14 Iitializatio Bias 4
15 Iitializatio Bias A plot of the esemble averages,..(, d), versus 000j, for j =,,,5. Illustrates the dowward bias of the iitial observatios. 5
16 Iitializatio Bias Cumulative average sample mea (after deletig d observatios):.. (, d). j d jd Not recommeded to determie the iitializatio phase. It is apparet that dowward bias is preset ad this bias ca be reduced by deletio of oe or more observatios. 6
17 Iitializatio Bias No widely accepted, objective ad prove techique to guide how much data to delete to reduce iitializatio bias to a egligible level. Plots ca, at times, be misleadig but they are still recommeded. Cumulative average becomes less variable as more data are averaged. The more correlatio preset, the loger it takes for approach steady state.. j to Differet performace measures could approach steady state at differet rates. 7
There is no straightforward approach for choosing the warmup period l.
 B. Maddah INDE 504 Discrete-Evet Simulatio Output Aalysis () Statistical Aalysis for Steady-State Parameters I a otermiatig simulatio, the iterest is i estimatig the log ru steady state measures of performace.
A Question. Output Analysis. Example. What Are We Doing Wrong? Result from throwing a die. Let X be the random variable
 A Questio Output Aalysis Let X be the radom variable Result from throwig a die 5.. Questio: What is E (X? Would you throw just oce ad take the result as your aswer? Itroductio to Simulatio WS/ - L 7 /
Output Analysis (2, Chapters 10 &11 Law)
") B. Maddah ENMG 6 Simulatio Output Aalysis (, Chapters 10 &11 Law) Comparig alterative system cofiguratio Sice the output of a simulatio is radom, the comparig differet systems via simulatio should be doe
B. Maddah ENMG 6 Simulatio Output Aalysis (, Chapters 10 &11 Law) Comparig alterative system cofiguratio Sice the output of a simulatio is radom, the comparig differet systems via simulatio should be doe
 http://www.xelca.l/articles/ufo_ladigsbaa_houte.aspx imulatio Output aalysis 3/4/06 This lecture Output: A simulatio determies the value of some performace measures, e.g. productio per hour, average queue
Statistical Analysis on Uncertainty for Autocorrelated Measurements and its Applications to Key Comparisons
 Statistical Aalysis o Ucertaity for Autocorrelated Measuremets ad its Applicatios to Key Comparisos Nie Fa Zhag Natioal Istitute of Stadards ad Techology Gaithersburg, MD 0899, USA Outlies. Itroductio.
Basis for simulation techniques
 Basis for simulatio techiques M. Veeraraghava, March 7, 004 Estimatio is based o a collectio of experimetal outcomes, x, x,, x, where each experimetal outcome is a value of a radom variable. x i. Defiitios
Estimation of the Mean and the ACVF
 Chapter 5 Estimatio of the Mea ad the ACVF A statioary process {X t } is characterized by its mea ad its autocovariace fuctio γ ), ad so by the autocorrelatio fuctio ρ ) I this chapter we preset the estimators
MATH 320: Probability and Statistics 9. Estimation and Testing of Parameters. Readings: Pruim, Chapter 4
 MATH 30: Probability ad Statistics 9. Estimatio ad Testig of Parameters Estimatio ad Testig of Parameters We have bee dealig situatios i which we have full kowledge of the distributio of a radom variable.
Random Variables, Sampling and Estimation
 Chapter 1 Radom Variables, Samplig ad Estimatio 1.1 Itroductio This chapter will cover the most importat basic statistical theory you eed i order to uderstad the ecoometric material that will be comig
Direction: This test is worth 250 points. You are required to complete this test within 50 minutes.
 Term Test October 3, 003 Name Math 56 Studet Number Directio: This test is worth 50 poits. You are required to complete this test withi 50 miutes. I order to receive full credit, aswer each problem completely
It should be unbiased, or approximately unbiased. Variance of the variance estimator should be small. That is, the variance estimator is stable.
 Chapter 10 Variace Estimatio 10.1 Itroductio Variace estimatio is a importat practical problem i survey samplig. Variace estimates are used i two purposes. Oe is the aalytic purpose such as costructig
Circle the single best answer for each multiple choice question. Your choice should be made clearly.
 TEST #1 STA 4853 March 6, 2017 Name: Please read the followig directios. DO NOT TURN THE PAGE UNTIL INSTRUCTED TO DO SO Directios This exam is closed book ad closed otes. There are 32 multiple choice questios.
Confidence Interval for Standard Deviation of Normal Distribution with Known Coefficients of Variation
 Cofidece Iterval for tadard Deviatio of Normal Distributio with Kow Coefficiets of Variatio uparat Niwitpog Departmet of Applied tatistics, Faculty of Applied ciece Kig Mogkut s Uiversity of Techology
Properties and Hypothesis Testing
 Chapter 3 Properties ad Hypothesis Testig 3.1 Types of data The regressio techiques developed i previous chapters ca be applied to three differet kids of data. 1. Cross-sectioal data. 2. Time series data.
Statistical Inference (Chapter 10) Statistical inference = learn about a population based on the information provided by a sample.
 Statistical inference = learn about a population based on the information provided by a sample.") Statistical Iferece (Chapter 10) Statistical iferece = lear about a populatio based o the iformatio provided by a sample. Populatio: The set of all values of a radom variable X of iterest. Characterized
Statistical Iferece (Chapter 10) Statistical iferece = lear about a populatio based o the iformatio provided by a sample. Populatio: The set of all values of a radom variable X of iterest. Characterized
Linear Regression Models
 Liear Regressio Models Dr. Joh Mellor-Crummey Departmet of Computer Sciece Rice Uiversity johmc@cs.rice.edu COMP 528 Lecture 9 15 February 2005 Goals for Today Uderstad how to Use scatter diagrams to ispect
1.010 Uncertainty in Engineering Fall 2008
 MIT OpeCourseWare http://ocw.mit.edu.00 Ucertaity i Egieerig Fall 2008 For iformatio about citig these materials or our Terms of Use, visit: http://ocw.mit.edu.terms. .00 - Brief Notes # 9 Poit ad Iterval
A statistical method to determine sample size to estimate characteristic value of soil parameters
 A statistical method to determie sample size to estimate characteristic value of soil parameters Y. Hojo, B. Setiawa 2 ad M. Suzuki 3 Abstract Sample size is a importat factor to be cosidered i determiig
Lecture 3. Properties of Summary Statistics: Sampling Distribution
 Lecture 3 Properties of Summary Statistics: Samplig Distributio Mai Theme How ca we use math to justify that our umerical summaries from the sample are good summaries of the populatio? Lecture Summary
Topic 9: Sampling Distributions of Estimators
 Topic 9: Samplig Distributios of Estimators Course 003, 2018 Page 0 Samplig distributios of estimators Sice our estimators are statistics (particular fuctios of radom variables), their distributio ca be
Stochastic Simulation
 Stochastic Simulatio 1 Itroductio Readig Assigmet: Read Chapter 1 of text. We shall itroduce may of the key issues to be discussed i this course via a couple of model problems. Model Problem 1 (Jackso
Computing Confidence Intervals for Sample Data
 Computig Cofidece Itervals for Sample Data Topics Use of Statistics Sources of errors Accuracy, precisio, resolutio A mathematical model of errors Cofidece itervals For meas For variaces For proportios
Interval Estimation (Confidence Interval = C.I.): An interval estimate of some population parameter is an interval of the form (, ),
: An interval estimate of some population parameter is an interval of the form (, ),") Cofidece Iterval Estimatio Problems Suppose we have a populatio with some ukow parameter(s). Example: Normal(,) ad are parameters. We eed to draw coclusios (make ifereces) about the ukow parameters. We
Cofidece Iterval Estimatio Problems Suppose we have a populatio with some ukow parameter(s). Example: Normal(,) ad are parameters. We eed to draw coclusios (make ifereces) about the ukow parameters. We
Econ 325 Notes on Point Estimator and Confidence Interval 1 By Hiro Kasahara
 Poit Estimator Eco 325 Notes o Poit Estimator ad Cofidece Iterval 1 By Hiro Kasahara Parameter, Estimator, ad Estimate The ormal probability desity fuctio is fully characterized by two costats: populatio
Overview. p 2. Chapter 9. Pooled Estimate of. q = 1 p. Notation for Two Proportions. Inferences about Two Proportions. Assumptions
 Chapter 9 Slide Ifereces from Two Samples 9- Overview 9- Ifereces about Two Proportios 9- Ifereces about Two Meas: Idepedet Samples 9-4 Ifereces about Matched Pairs 9-5 Comparig Variatio i Two Samples
4. Partial Sums and the Central Limit Theorem
 1 of 10 7/16/2009 6:05 AM Virtual Laboratories > 6. Radom Samples > 1 2 3 4 5 6 7 4. Partial Sums ad the Cetral Limit Theorem The cetral limit theorem ad the law of large umbers are the two fudametal theorems
Statistical Intervals for a Single Sample
 3/5/06 Applied Statistics ad Probability for Egieers Sixth Editio Douglas C. Motgomery George C. Ruger Chapter 8 Statistical Itervals for a Sigle Sample 8 CHAPTER OUTLINE 8- Cofidece Iterval o the Mea
62. Power series Definition 16. (Power series) Given a sequence {c n }, the series. c n x n = c 0 + c 1 x + c 2 x 2 + c 3 x 3 +
 Given a sequence {c n }, the series. c n x n = c 0 + c 1 x + c 2 x 2 + c 3 x 3 +") 62. Power series Defiitio 16. (Power series) Give a sequece {c }, the series c x = c 0 + c 1 x + c 2 x 2 + c 3 x 3 + is called a power series i the variable x. The umbers c are called the coefficiets of
62. Power series Defiitio 16. (Power series) Give a sequece {c }, the series c x = c 0 + c 1 x + c 2 x 2 + c 3 x 3 + is called a power series i the variable x. The umbers c are called the coefficiets of
Simulation of Discrete Event Systems
 Simulatio of Discrete Evet Systems Uit 13 Evet Schedulig Scheme ad Output Aalysis Fall Witer 2017/2018 Prof. Dr.-Ig. Dipl.-Wirt.-Ig. Sve Tackeberg Beedikt Adrew Latos M.Sc.RWTH Chair ad Istitute of Idustrial
Joint Probability Distributions and Random Samples. Jointly Distributed Random Variables. Chapter { }
 UCLA STAT A Applied Probability & Statistics for Egieers Istructor: Ivo Diov, Asst. Prof. I Statistics ad Neurology Teachig Assistat: Neda Farziia, UCLA Statistics Uiversity of Califoria, Los Ageles, Sprig
Topic 9: Sampling Distributions of Estimators
 Topic 9: Samplig Distributios of Estimators Course 003, 2016 Page 0 Samplig distributios of estimators Sice our estimators are statistics (particular fuctios of radom variables), their distributio ca be
Topic 9: Sampling Distributions of Estimators
 Topic 9: Samplig Distributios of Estimators Course 003, 2018 Page 0 Samplig distributios of estimators Sice our estimators are statistics (particular fuctios of radom variables), their distributio ca be
9. Simulation lect09.ppt S Introduction to Teletraffic Theory - Fall
 lect09.ppt S-38.145 - Itroductio to Teletraffic Theory - Fall 2001 1 Cotets Itroductio Geeratio of realizatios of the traffic process Geeratio of realizatios of radom variables Collectio of data Statistical
A proposed discrete distribution for the statistical modeling of
 It. Statistical Ist.: Proc. 58th World Statistical Cogress, 0, Dubli (Sessio CPS047) p.5059 A proposed discrete distributio for the statistical modelig of Likert data Kidd, Marti Cetre for Statistical
 1 of 7 7/16/2009 6:06 AM Virtual Laboratories > 6. Radom Samples > 1 2 3 4 5 6 7 6. Order Statistics Defiitios Suppose agai that we have a basic radom experimet, ad that X is a real-valued radom variable
This is an introductory course in Analysis of Variance and Design of Experiments.
 1 Notes for M 384E, Wedesday, Jauary 21, 2009 (Please ote: I will ot pass out hard-copy class otes i future classes. If there are writte class otes, they will be posted o the web by the ight before class
Lecture 19: Convergence
 Lecture 19: Covergece Asymptotic approach I statistical aalysis or iferece, a key to the success of fidig a good procedure is beig able to fid some momets ad/or distributios of various statistics. I may
Topic 10: Introduction to Estimation
 Topic 0: Itroductio to Estimatio Jue, 0 Itroductio I the simplest possible terms, the goal of estimatio theory is to aswer the questio: What is that umber? What is the legth, the reactio rate, the fractio
Investigating the Significance of a Correlation Coefficient using Jackknife Estimates
 Iteratioal Joural of Scieces: Basic ad Applied Research (IJSBAR) ISSN 2307-4531 (Prit & Olie) http://gssrr.org/idex.php?joural=jouralofbasicadapplied ---------------------------------------------------------------------------------------------------------------------------
Approximations and more PMFs and PDFs
 Approximatios ad more PMFs ad PDFs Saad Meimeh 1 Approximatio of biomial with Poisso Cosider the biomial distributio ( b(k,,p = p k (1 p k, k λ: k Assume that is large, ad p is small, but p λ at the limit.
First come, first served (FCFS) Batch
 Batch") Queuig Theory Prelimiaries A flow of customers comig towards the service facility forms a queue o accout of lack of capacity to serve them all at a time. RK Jaa Some Examples: Persos waitig at doctor s
Queuig Theory Prelimiaries A flow of customers comig towards the service facility forms a queue o accout of lack of capacity to serve them all at a time. RK Jaa Some Examples: Persos waitig at doctor s
FACULTY OF MATHEMATICAL STUDIES MATHEMATICS FOR PART I ENGINEERING. Lectures
 FACULTY OF MATHEMATICAL STUDIES MATHEMATICS FOR PART I ENGINEERING Lectures MODULE 5 STATISTICS II. Mea ad stadard error of sample data. Biomial distributio. Normal distributio 4. Samplig 5. Cofidece itervals
Statistical Pattern Recognition
 Statistical Patter Recogitio Classificatio: No-Parametric Modelig Hamid R. Rabiee Jafar Muhammadi Sprig 2014 http://ce.sharif.edu/courses/92-93/2/ce725-2/ Ageda Parametric Modelig No-Parametric Modelig
Econ 325/327 Notes on Sample Mean, Sample Proportion, Central Limit Theorem, Chi-square Distribution, Student s t distribution 1.
 Eco 325/327 Notes o Sample Mea, Sample Proportio, Cetral Limit Theorem, Chi-square Distributio, Studet s t distributio 1 Sample Mea By Hiro Kasahara We cosider a radom sample from a populatio. Defiitio
Statistical Fundamentals and Control Charts
 Statistical Fudametals ad Cotrol Charts 1. Statistical Process Cotrol Basics Chace causes of variatio uavoidable causes of variatios Assigable causes of variatio large variatios related to machies, materials,
Lecture 11 Simple Linear Regression
 Lecture 11 Simple Liear Regressio Fall 2013 Prof. Yao Xie, yao.xie@isye.gatech.edu H. Milto Stewart School of Idustrial Systems & Egieerig Georgia Tech Midterm 2 mea: 91.2 media: 93.75 std: 6.5 2 Meddicorp
Statistics 511 Additional Materials
 Cofidece Itervals o mu Statistics 511 Additioal Materials This topic officially moves us from probability to statistics. We begi to discuss makig ifereces about the populatio. Oe way to differetiate probability
1 Inferential Methods for Correlation and Regression Analysis
 1 Iferetial Methods for Correlatio ad Regressio Aalysis I the chapter o Correlatio ad Regressio Aalysis tools for describig bivariate cotiuous data were itroduced. The sample Pearso Correlatio Coefficiet
EECS564 Estimation, Filtering, and Detection Hwk 2 Solns. Winter p θ (z) = (2θz + 1 θ), 0 z 1
 = (2θz + 1 θ), 0 z 1") EECS564 Estimatio, Filterig, ad Detectio Hwk 2 Sols. Witer 25 4. Let Z be a sigle observatio havig desity fuctio where. p (z) = (2z + ), z (a) Assumig that is a oradom parameter, fid ad plot the maximum
EECS564 Estimatio, Filterig, ad Detectio Hwk 2 Sols. Witer 25 4. Let Z be a sigle observatio havig desity fuctio where. p (z) = (2z + ), z (a) Assumig that is a oradom parameter, fid ad plot the maximum
STA Learning Objectives. Population Proportions. Module 10 Comparing Two Proportions. Upon completing this module, you should be able to:
 STA 2023 Module 10 Comparig Two Proportios Learig Objectives Upo completig this module, you should be able to: 1. Perform large-sample ifereces (hypothesis test ad cofidece itervals) to compare two populatio
Probability and statistics: basic terms
 Probability ad statistics: basic terms M. Veeraraghava August 203 A radom variable is a rule that assigs a umerical value to each possible outcome of a experimet. Outcomes of a experimet form the sample
ECONOMETRIC THEORY. MODULE XIII Lecture - 34 Asymptotic Theory and Stochastic Regressors
 ECONOMETRIC THEORY MODULE XIII Lecture - 34 Asymptotic Theory ad Stochastic Regressors Dr. Shalabh Departmet of Mathematics ad Statistics Idia Istitute of Techology Kapur Asymptotic theory The asymptotic
ENGI 4421 Confidence Intervals (Two Samples) Page 12-01
 Page 12-01") ENGI 44 Cofidece Itervals (Two Samples) Page -0 Two Sample Cofidece Iterval for a Differece i Populatio Meas [Navidi sectios 5.4-5.7; Devore chapter 9] From the cetral limit theorem, we kow that, for sufficietly
ENGI 44 Cofidece Itervals (Two Samples) Page -0 Two Sample Cofidece Iterval for a Differece i Populatio Meas [Navidi sectios 5.4-5.7; Devore chapter 9] From the cetral limit theorem, we kow that, for sufficietly
CHAPTER 2. Mean This is the usual arithmetic mean or average and is equal to the sum of the measurements divided by number of measurements.
 CHAPTER 2 umerical Measures Graphical method may ot always be sufficiet for describig data. You ca use the data to calculate a set of umbers that will covey a good metal picture of the frequecy distributio.
Linear Regression Analysis. Analysis of paired data and using a given value of one variable to predict the value of the other
 Liear Regressio Aalysis Aalysis of paired data ad usig a give value of oe variable to predict the value of the other 5 5 15 15 1 1 5 5 1 3 4 5 6 7 8 1 3 4 5 6 7 8 Liear Regressio Aalysis E: The chirp rate
Exam II Covers. STA 291 Lecture 19. Exam II Next Tuesday 5-7pm Memorial Hall (Same place as exam I) Makeup Exam 7:15pm 9:15pm Location CB 234
 Makeup Exam 7:15pm 9:15pm Location CB 234") STA 291 Lecture 19 Exam II Next Tuesday 5-7pm Memorial Hall (Same place as exam I) Makeup Exam 7:15pm 9:15pm Locatio CB 234 STA 291 - Lecture 19 1 Exam II Covers Chapter 9 10.1; 10.2; 10.3; 10.4; 10.6
STA 291 Lecture 19 Exam II Next Tuesday 5-7pm Memorial Hall (Same place as exam I) Makeup Exam 7:15pm 9:15pm Locatio CB 234 STA 291 - Lecture 19 1 Exam II Covers Chapter 9 10.1; 10.2; 10.3; 10.4; 10.6
Data Description. Measure of Central Tendency. Data Description. Chapter x i
 Data Descriptio Describe Distributio with Numbers Example: Birth weights (i lb) of 5 babies bor from two groups of wome uder differet care programs. Group : 7, 6, 8, 7, 7 Group : 3, 4, 8, 9, Chapter 3
9. Simulation. lect09.ppt S Introduction to Teletraffic Theory - Fall Literature
 lect09.ppt S-38.45 - Itroductio to Teletraffic Theory - Fall 999 Literature I. Mitrai (98) Simulatio techiques for discrete evet systems Cambridge Uiversity Press, Cambridge A.M. Law ad W. D. Kelto (98,
Appendix to: Hypothesis Testing for Multiple Mean and Correlation Curves with Functional Data
 Appedix to: Hypothesis Testig for Multiple Mea ad Correlatio Curves with Fuctioal Data Ao Yua 1, Hog-Bi Fag 1, Haiou Li 1, Coli O. Wu, Mig T. Ta 1, 1 Departmet of Biostatistics, Bioiformatics ad Biomathematics,
32 estimating the cumulative distribution function
 32 estimatig the cumulative distributio fuctio 4.6 types of cofidece itervals/bads Let F be a class of distributio fuctios F ad let θ be some quatity of iterest, such as the mea of F or the whole fuctio
Trading Friction Noise 1
 Ecoomics 883 Sprig 205 Tauche Tradig Frictio Noise Setup Let Y be the usual cotiuous semi-martigale Y t = t 0 cs dw s We will cosider jump discotiuities later. The usual setup for modelig tradig frictio
CS/ECE 715 Spring 2004 Homework 5 (Due date: March 16)
") CS/ECE 75 Sprig 004 Homework 5 (Due date: March 6) Problem 0 (For fu). M/G/ Queue with Radom-Sized Batch Arrivals. Cosider the M/G/ system with the differece that customers are arrivig i batches accordig
CS/ECE 75 Sprig 004 Homework 5 (Due date: March 6) Problem 0 (For fu). M/G/ Queue with Radom-Sized Batch Arrivals. Cosider the M/G/ system with the differece that customers are arrivig i batches accordig
Since X n /n P p, we know that X n (n. Xn (n X n ) Using the asymptotic result above to obtain an approximation for fixed n, we obtain
 Using the asymptotic result above to obtain an approximation for fixed n, we obtain") Assigmet 9 Exercise 5.5 Let X biomial, p, where p 0, 1 is ukow. Obtai cofidece itervals for p i two differet ways: a Sice X / p d N0, p1 p], the variace of the limitig distributio depeds oly o p. Use the
Assigmet 9 Exercise 5.5 Let X biomial, p, where p 0, 1 is ukow. Obtai cofidece itervals for p i two differet ways: a Sice X / p d N0, p1 p], the variace of the limitig distributio depeds oly o p. Use the
Hypothesis Testing. Evaluation of Performance of Learned h. Issues. Trade-off Between Bias and Variance
 Hypothesis Testig Empirically evaluatig accuracy of hypotheses: importat activity i ML. Three questios: Give observed accuracy over a sample set, how well does this estimate apply over additioal samples?
The variance of a sum of independent variables is the sum of their variances, since covariances are zero. Therefore. V (xi )= n n 2 σ2 = σ2.
= n n 2 σ2 = σ2.") SAMPLE STATISTICS A radom sample x 1,x,,x from a distributio f(x) is a set of idepedetly ad idetically variables with x i f(x) for all i Their joit pdf is f(x 1,x,,x )=f(x 1 )f(x ) f(x )= f(x i ) The sample
SAMPLE STATISTICS A radom sample x 1,x,,x from a distributio f(x) is a set of idepedetly ad idetically variables with x i f(x) for all i Their joit pdf is f(x 1,x,,x )=f(x 1 )f(x ) f(x )= f(x i ) The sample
9. Simulation. Contents
 9. Simulatio lect09.ppt S-38.45 - Itroductio to Teletraffic Theory - Fall 000 9. Simulatio Cotets Itroductio Geeratio of realizatios of the traffic process Geeratio of realizatios of radom variables Collectio
Direction: This test is worth 150 points. You are required to complete this test within 55 minutes.
 Term Test 3 (Part A) November 1, 004 Name Math 6 Studet Number Directio: This test is worth 10 poits. You are required to complete this test withi miutes. I order to receive full credit, aswer each problem
Open book and notes. 120 minutes. Cover page and six pages of exam. No calculators.
 IE 330 Seat # Ope book ad otes 120 miutes Cover page ad six pages of exam No calculators Score Fial Exam (example) Schmeiser Ope book ad otes No calculator 120 miutes 1 True or false (for each, 2 poits
MOST PEOPLE WOULD RATHER LIVE WITH A PROBLEM THEY CAN'T SOLVE, THAN ACCEPT A SOLUTION THEY CAN'T UNDERSTAND.
 XI-1 (1074) MOST PEOPLE WOULD RATHER LIVE WITH A PROBLEM THEY CAN'T SOLVE, THAN ACCEPT A SOLUTION THEY CAN'T UNDERSTAND. R. E. D. WOOLSEY AND H. S. SWANSON XI-2 (1075) STATISTICAL DECISION MAKING Advaced
Sampling Distributions, Z-Tests, Power
 Samplig Distributios, Z-Tests, Power We draw ifereces about populatio parameters from sample statistics Sample proportio approximates populatio proportio Sample mea approximates populatio mea Sample variace
Big Picture. 5. Data, Estimates, and Models: quantifying the accuracy of estimates.
 5. Data, Estimates, ad Models: quatifyig the accuracy of estimates. 5. Estimatig a Normal Mea 5.2 The Distributio of the Normal Sample Mea 5.3 Normal data, cofidece iterval for, kow 5.4 Normal data, cofidece
KLMED8004 Medical statistics. Part I, autumn Estimation. We have previously learned: Population and sample. New questions
 We have previously leared: KLMED8004 Medical statistics Part I, autum 00 How kow probability distributios (e.g. biomial distributio, ormal distributio) with kow populatio parameters (mea, variace) ca give
Queuing Theory. Basic properties, Markovian models, Networks of queues, General service time distributions, Finite source models, Multiserver queues
 Queuig Theory Basic properties, Markovia models, Networks of queues, Geeral service time distributios, Fiite source models, Multiserver queues Chapter 8 Kedall s Notatio for Queuig Systems A/B/X/Y/Z: A
MATH/STAT 352: Lecture 15
 MATH/STAT 352: Lecture 15 Sectios 5.2 ad 5.3. Large sample CI for a proportio ad small sample CI for a mea. 1 5.2: Cofidece Iterval for a Proportio Estimatig proportio of successes i a biomial experimet
Chapter 13, Part A Analysis of Variance and Experimental Design
 Slides Prepared by JOHN S. LOUCKS St. Edward s Uiversity Slide 1 Chapter 13, Part A Aalysis of Variace ad Eperimetal Desig Itroductio to Aalysis of Variace Aalysis of Variace: Testig for the Equality of
Resampling Methods. X (1/2), i.e., Pr (X i m) = 1/2. We order the data: X (1) X (2) X (n). Define the sample median: ( n.
, i.e., Pr (X i m) = 1/2. We order the data: X (1) X (2) X (n). Define the sample median: ( n.") Jauary 1, 2019 Resamplig Methods Motivatio We have so may estimators with the property θ θ d N 0, σ 2 We ca also write θ a N θ, σ 2 /, where a meas approximately distributed as Oce we have a cosistet estimator
Jauary 1, 2019 Resamplig Methods Motivatio We have so may estimators with the property θ θ d N 0, σ 2 We ca also write θ a N θ, σ 2 /, where a meas approximately distributed as Oce we have a cosistet estimator
(all terms are scalars).the minimization is clearer in sum notation:
.the minimization is clearer in sum notation:") 7 Multiple liear regressio: with predictors) Depedet data set: y i i = 1, oe predictad, predictors x i,k i = 1,, k = 1, ' The forecast equatio is ŷ i = b + Use matrix otatio: k =1 b k x ik Y = y 1 y 1
7 Multiple liear regressio: with predictors) Depedet data set: y i i = 1, oe predictad, predictors x i,k i = 1,, k = 1, ' The forecast equatio is ŷ i = b + Use matrix otatio: k =1 b k x ik Y = y 1 y 1
Inferential Statistics. Inference Process. Inferential Statistics and Probability a Holistic Approach. Inference Process.
 Iferetial Statistics ad Probability a Holistic Approach Iferece Process Chapter 8 Poit Estimatio ad Cofidece Itervals This Course Material by Maurice Geraghty is licesed uder a Creative Commos Attributio-ShareAlike
STATISTICAL PROPERTIES OF LEAST SQUARES ESTIMATORS. Comments:
 Recall: STATISTICAL PROPERTIES OF LEAST SQUARES ESTIMATORS Commets:. So far we have estimates of the parameters! 0 ad!, but have o idea how good these estimates are. Assumptio: E(Y x)! 0 +! x (liear coditioal
Confidence intervals summary Conservative and approximate confidence intervals for a binomial p Examples. MATH1005 Statistics. Lecture 24. M.
 MATH1005 Statistics Lecture 24 M. Stewart School of Mathematics ad Statistics Uiversity of Sydey Outlie Cofidece itervals summary Coservative ad approximate cofidece itervals for a biomial p The aïve iterval
Simulation. Two Rule For Inverting A Distribution Function
 Simulatio Two Rule For Ivertig A Distributio Fuctio Rule 1. If F(x) = u is costat o a iterval [x 1, x 2 ), the the uiform value u is mapped oto x 2 through the iversio process. Rule 2. If there is a jump
Statisticians use the word population to refer the total number of (potential) observations under consideration
 observations under consideration") 6 Samplig Distributios Statisticias use the word populatio to refer the total umber of (potetial) observatios uder cosideratio The populatio is just the set of all possible outcomes i our sample space
6 Samplig Distributios Statisticias use the word populatio to refer the total umber of (potetial) observatios uder cosideratio The populatio is just the set of all possible outcomes i our sample space
Efficient GMM LECTURE 12 GMM II
 DECEMBER 1 010 LECTURE 1 II Efficiet The estimator depeds o the choice of the weight matrix A. The efficiet estimator is the oe that has the smallest asymptotic variace amog all estimators defied by differet
f(x i ; ) L(x; p) = i=1 To estimate the value of that maximizes L or equivalently ln L we will set =0, for i =1, 2,...,m p x i (1 p) 1 x i i=1
 L(x; p) = i=1 To estimate the value of that maximizes L or equivalently ln L we will set =0, for i =1, 2,...,m p x i (1 p) 1 x i i=1") Parameter Estimatio Samples from a probability distributio F () are: [,,..., ] T.Theprobabilitydistributio has a parameter vector [,,..., m ] T. Estimator: Statistic used to estimate ukow. Estimate: Observed
Parameter Estimatio Samples from a probability distributio F () are: [,,..., ] T.Theprobabilitydistributio has a parameter vector [,,..., m ] T. Estimator: Statistic used to estimate ukow. Estimate: Observed
Stat 421-SP2012 Interval Estimation Section
 Stat 41-SP01 Iterval Estimatio Sectio 11.1-11. We ow uderstad (Chapter 10) how to fid poit estimators of a ukow parameter. o However, a poit estimate does ot provide ay iformatio about the ucertaity (possible
If, for instance, we were required to test whether the population mean μ could be equal to a certain value μ
 STATISTICAL INFERENCE INTRODUCTION Statistical iferece is that brach of Statistics i which oe typically makes a statemet about a populatio based upo the results of a sample. I oesample testig, we essetially
ARIMA Models. Dan Saunders. y t = φy t 1 + ɛ t
 ARIMA Models Da Sauders I will discuss models with a depedet variable y t, a potetially edogeous error term ɛ t, ad a exogeous error term η t, each with a subscript t deotig time. With just these three
Introductory statistics
 CM9S: Machie Learig for Bioiformatics Lecture - 03/3/06 Itroductory statistics Lecturer: Sriram Sakararama Scribe: Sriram Sakararama We will provide a overview of statistical iferece focussig o the key
Confidence interval for the two-parameter exponentiated Gumbel distribution based on record values
 Iteratioal Joural of Applied Operatioal Research Vol. 4 No. 1 pp. 61-68 Witer 2014 Joural homepage: www.ijorlu.ir Cofidece iterval for the two-parameter expoetiated Gumbel distributio based o record values
Chapter 10 Advanced Topics in Random Processes
 ery Stark ad Joh W. Woods, Probability, Statistics, ad Radom Variables for Egieers, 4th ed., Pearso Educatio Ic.,. ISBN 978--3-33-6 Chapter Advaced opics i Radom Processes Sectios. Mea-Square (m.s.) Calculus
B. Maddah ENMG 622 ENMG /27/07
 B. Maddah ENMG 622 ENMG 5 3/27/7 Queueig Theory () What is a queueig system? A queueig system cosists of servers (resources) that provide service to customers (etities). A Customer requestig service will
CEE 522 Autumn Uncertainty Concepts for Geotechnical Engineering
 CEE 5 Autum 005 Ucertaity Cocepts for Geotechical Egieerig Basic Termiology Set A set is a collectio of (mutually exclusive) objects or evets. The sample space is the (collectively exhaustive) collectio
Expectation and Variance of a random variable
 Chapter 11 Expectatio ad Variace of a radom variable The aim of this lecture is to defie ad itroduce mathematical Expectatio ad variace of a fuctio of discrete & cotiuous radom variables ad the distributio
Formulas and Tables for Gerstman
 Formulas ad Tables for Gerstma Measuremet ad Study Desig Biostatistics is more tha a compilatio of computatioal techiques! Measuremet scales: quatitative, ordial, categorical Iformatio quality is primary
7-1. Chapter 4. Part I. Sampling Distributions and Confidence Intervals
 7-1 Chapter 4 Part I. Samplig Distributios ad Cofidece Itervals 1 7- Sectio 1. Samplig Distributio 7-3 Usig Statistics Statistical Iferece: Predict ad forecast values of populatio parameters... Test hypotheses
µ and π p i.e. Point Estimation x And, more generally, the population proportion is approximately equal to a sample proportion
 Poit Estimatio Poit estimatio is the rather simplistic (ad obvious) process of usig the kow value of a sample statistic as a approximatio to the ukow value of a populatio parameter. So we could for example
STAT 350 Handout 19 Sampling Distribution, Central Limit Theorem (6.6)
") STAT 350 Hadout 9 Samplig Distributio, Cetral Limit Theorem (6.6) A radom sample is a sequece of radom variables X, X 2,, X that are idepedet ad idetically distributed. o This property is ofte abbreviated
STAT 350 Hadout 9 Samplig Distributio, Cetral Limit Theorem (6.6) A radom sample is a sequece of radom variables X, X 2,, X that are idepedet ad idetically distributed. o This property is ofte abbreviated
3/3/2014. CDS M Phil Econometrics. Types of Relationships. Types of Relationships. Types of Relationships. Vijayamohanan Pillai N.
 3/3/04 CDS M Phil Old Least Squares (OLS) Vijayamohaa Pillai N CDS M Phil Vijayamoha CDS M Phil Vijayamoha Types of Relatioships Oly oe idepedet variable, Relatioship betwee ad is Liear relatioships Curviliear
[ ] ( ) ( ) [ ] ( ) 1 [ ] [ ] Sums of Random Variables Y = a 1 X 1 + a 2 X 2 + +a n X n The expected value of Y is:
![[ ] ( ) ( ) [ ] ( ) 1 [ ] [ ] Sums of Random Variables Y = a 1 X 1 + a 2 X 2 + +a n X n The expected value of Y is:](/thumbs/89/98900182.jpg "[ ] ( ) ( ) [ ] ( ) 1 [ ] [ ] Sums of Random Variables Y = a 1 X 1 + a 2 X 2 + +a n X n The expected value of Y is:") PROBABILITY FUNCTIONS A radom variable X has a probabilit associated with each of its possible values. The probabilit is termed a discrete probabilit if X ca assume ol discrete values, or X = x, x, x 3,,
PROBABILITY FUNCTIONS A radom variable X has a probabilit associated with each of its possible values. The probabilit is termed a discrete probabilit if X ca assume ol discrete values, or X = x, x, x 3,,
Probability, Expectation Value and Uncertainty
 Chapter 1 Probability, Expectatio Value ad Ucertaity We have see that the physically observable properties of a quatum system are represeted by Hermitea operators (also referred to as observables ) such