Modelling heterogeneous variance-covariance components in two-level multilevel models with application to school effects educational research
|
|
|
- Aubrie Harrell
- 5 years ago
- Views:
Transcription
1 Modelling heterogeneous variance-covariance components in two-level multilevel models with application to school effects educational research Research Methods Festival Oxford 9 th July 014 George Leckie Centre for Multilevel Modelling Graduate School of Education University of Bristol
2 1. INTRODUCTION
3 The standard two-level random-slope multilevel model The standard two-level (e.g. students within schools or repeated measures within subjects) random-slope multilevel model can be written as where Y ij = β 0 + β 1 X ij fixed part + u 0j + u 1j X ij + e ij random part u 0j u 1j ~N 0 0, σ u0 σ u0u1 σ u1 e ij ~N(0, σ e ) Every school is modelled as having its own regression line with its own intercept, β 0 + u 0j, and its own slope, β 1 + u 1j, but all school are constrained to have a common residual error variance, σ e However, it will often be substantively interesting to model this residual error variance as heterogeneous across students and schools, σ eij
4 What we do We extend the standard random-slope model by modelling the level-1 variance as a log-linear function of the covariates and further random effects Mean function: Y ij = β 0 + β 1 X ij fixed part + u 0j + u 1j X ij + e ij random part where Level-1 variance function: log σ eij = α 0 + α 1 X ij fixed part + v 0j + v 1j X ij random part u 0j u 1j v 0j v 1j ~N , σ u0 σ u01 σ u1 σ u0v0 σ u1v0 σ v0 σ u0v1 σ u1v1 σ v01 σ v1, e ij ~N(0, σ eij ) We won t discus modelling the different variances and covariances of the level- covariance matrix as a function of the covariates, but this is possible
5 . SOFTWARE
6 Likelihood-based methods Not possible to fit these models using routine commands in general-purpose packages such as R, SAS, SPSS and Stata, nor is it possible to fit these models in dedicated multilevel modelling packages such as MLwiN, HLM, and SuperMix ASReml and GenStat: Assume independent random effects SAS PROC NLMIXED: Two-level models only; slow; sensitive to starting values MIXREGLS: Developed by Don Hedeker; Two-level random-intercept models only; computationally faster and more stable than SAS; fiddly to use We have written runmixregls, a command to call MIXREGLS from within Stata
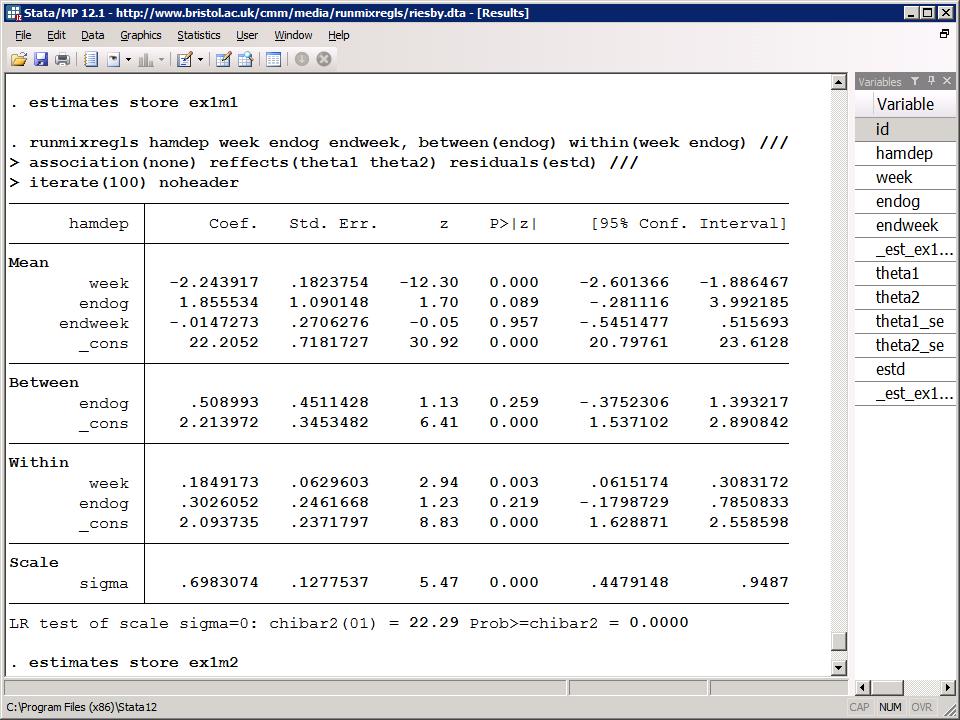
7
8 MCMC methods WinBUGS: Highly flexible; fiddly to use; computationally fairly slow Stat-JR: Easy to use, computationally faster than WinBUGS, developed by the MLwiN team! We have developed a LevelRSCVGL template to fit this calls of model Need a better name!
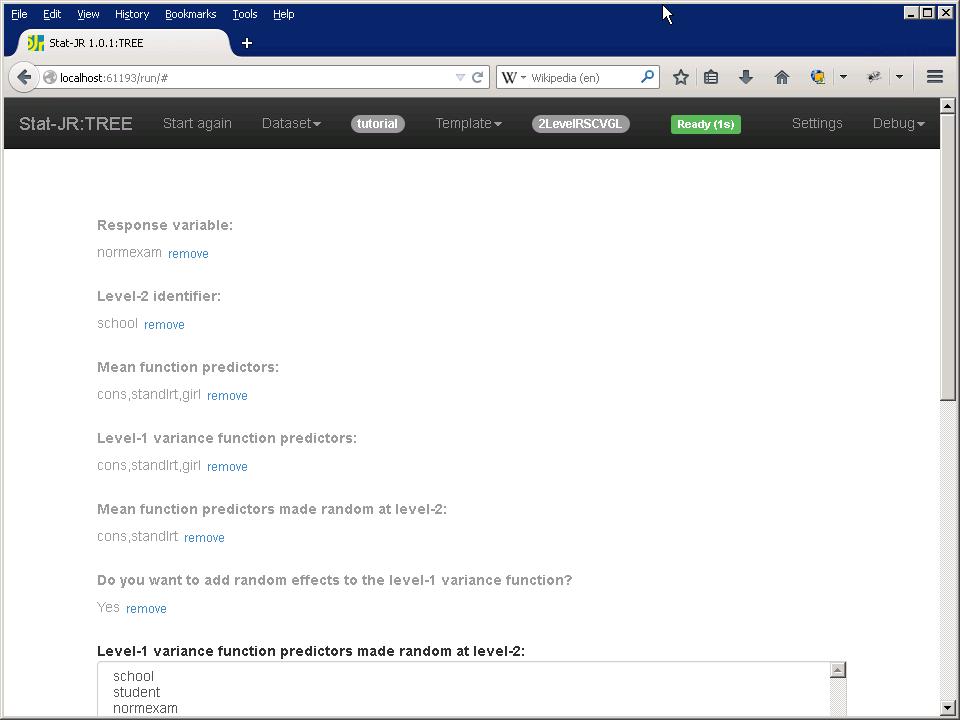
9
10 3. ILLUSTRATIVE APPLICATION
11 Studies of school effects Most studies of school effects focus on estimating mean differences in student achievement Which schools score highest, having adjusted for intake differences? What school polices and practices make some schools more effective than others? Rarely is anything said about whether there might be variance differences in student achievement However, just as schools influence the mean achievement of their students, they are likely to influence the dispersion in their students achievements Which schools widen initial inequalities and which schools narrow them? What school polices and practices drive these differences?
12 MLwiN tutorial dataset Inner-London schools exam scores dataset 4,059 students (level-1) nested within 65 schools (level-) to 198 students per school (mean = 6 students) Response is a standardised age 16 exam score Main covariates are A standardised age 11 exam score Student gender
13 Observed school means and within-school variances There is substantial variability in both school means and within-school variances There is a moderate positive association between the two (r = 0.9)
14 Specify a log-linear level-1 variance function First we specify a log-linear level-1 variance function for the within-school variance and we include a new set of school random effects Mean function SCORE16 ij = β 0 + u j + e ij u j ~N 0, σ u e ij ~N(0, σ ej ) Level-1 variance function log(σ ej ) = α 0 + v j v j ~N 0, σ v where u j and v j are allowed to covary with covariance σ uv (correlation ρ uv ) Every school has its own mean β 0j = β 0 + u j and variance σ ej = exp (α 0 + v j )
15 Random within-school variances Model 1 is simply a reparameterised variance-components model where log σ e = α 0 Model includes the new school random effects log(σ ej ) = α 0 + v j, v j ~N 0, σ v Mean function Level-1 variance function Model 1 Model Parameter Mean SD Mean SD β 0 Intercept σ u Intercept variance α 0 Intercept σ v Intercept variance Cross-function ρ uv Correlation DIC Model is preferred to Model 1 as shown by drop in DIC of 17 points Note that the estimated intercept has decreased from to -0.. Why?
16 Caterpillar plots of school means and within-school variances β 0j = β 0 + u j σ ej = exp (α 0 + v j ) While 35 schools differ significantly from the population-average school mean, only 17 schools differ significantly from the population-average within-school variance
17 Caterpillar plot of intraclass correlation coefficients σ u corr y ij, y i j = σ u + exp (α 0 + v j ) The expected correlation between two students from the same school ranges from 0.11 to 0.9 Few schools differ significantly from the population-average correlation of 0.18
18 Add covariates to the mean function Model Model 3 Parameter Mean SD Mean SD β 0 Intercept Mean function β 1 Age 11 scores β Girl σ u Intercept variance Level-1 variance function α 0 Intercept σ v Intercept variance Cross-function ρ uv Correlation β 1 = 0.55 and so age 11 scores are strongly predictive of age 16 scores β = 0.17 and so girls make more progress than similar initial achieving boys Between-school variance σ u reduces by 47% DIC Population-average of the within-school variances E(σ ej ) reduces by 33% Population-variance of the within-school variances Var(σ ej ) reduces by 78%
19 Add a random slope to the mean function Are schools differentially effective for different types of students? Are the schools that are best for high initial achievers different from the schools that are best for low initial achievers? Does the gender gap vary across schools? Are there some schools where boys actually outperform girls? Model 4 allows the age 11 slope coefficient to vary across schools SCORE16 ij = β 0 + β 1 SCORE11 ij + β GIRL ij + u 0j + u 1j SCORE11 ij + e ij log(σ ej ) = α 0 + v j u 0j u 1j v j ~N 0 0 0, σ u0 σ u01 σ u1 σ u0v σ u1v σ v e ij ~N(0, σ ej )
20 Predicted mean function school lines Age 11 scores are more predictive of age 16 scores in some schools than in others Schools with steeper slopes widen initial achievement differences School choice matters more for high initial achievers?
21 Add covariates to the level-1 variance function Model 4 Model 5 Parameter Mean SD Mean SD Mean function Level-1 variance function Cross-function α 0 Intercept α 1 Age 11 scores α Girl σ v Intercept variance ρ u0v Intercept-intercept correlation ρ u1v Slope-intercept correlation DIC The mean function parameters hardly change and are omitted from the table α 1 = 0.07 and so, within schools, low initial achievers tend to score more variably than high initial achievers α = 0.10 and so, within schools, girls tend to score less variably than boys
22 Add a random slope to the level-1 variance function Do schools have differentially dispersed outcomes for different types of students? Are the schools that are least dispersed for high initial achievers different from the schools that are least dispersed for low initial achievers? Does the gender dispersion gap vary across schools? Model 6 adds a random slope to the level-1 variance function SCORE16 ij = β 0 + β 1 SCORE11 ij + β GIRL ij + u 0j + u 1j SCORE11 ij + e ij log(σ eij ) = α 0 + α 1 SCORE11 ij + α GIRL ij + v 0j + v 1j SCORE11 ij u 0j u 1j v 0j v 1j ~N , σ u0 σ u01 σ u1 σ u0v0 σ u1v0 σ v0 σ u0v1 σ u1v1 σ v01 σ v1 e ij ~N(0, σ eij )
23 Predicted level-1 variance function school lines Three schools actually go against the overall trend and should be examined further What is it about these three schools which leads their highest initial achieving students to perform more erratically than their lowest initial achieving students?
24 Explaining the differences between schools So far we have quantified differences in effectiveness and dispersion between schools and how the magnitude of these differences vary as function of initial achievement The obvious next step is to seek to explain these differences in terms of schoollevel predictors W j Entering W j as a main effect into the mean function will explain away σ u0 Entering W j as a cross-level interaction with X ij into the mean function will explain away σ u1 Entering W j as a main effect into the level-1 variance function will explain away σ v0 Entering W j as a cross-level interaction with X ij into the level-1 variance function will explain away σ v1
25 4. SIMULATION STUDY
26 Can we ignore the random effects? Many packages allow you to fit limited level-1 variance functions with no random effects R, SAS, SPSS, Stata HLM, MLwiN However, we have carried out simulations which show that ignoring level- variability in the level-1 variances leads the level-1 variance function regression coefficients to be estimated with spurious precision This problem is particularly acute for the coefficients of level- covariates We run the risk of making Type I errors of inference about predictors of level-1 variance This problem is analogous to ignoring clustering in linear regression
27 5. CONCLUSION
28 Conclusion We have extended the standard two-level random-slope model to model the residual error variance as a function of the covariates and additional random effects We are implementing this in runmixregls and the new Stat-JR software The principle of modelling within-group variances as randomly varying across groups applies to multilevel models more generally, including those with additional levels, crossed random effects and discrete responses The discussed methods are relevant to any study where there is interest on estimating dispersion differences on outcome variables across groups
29 References to our work Goldstein, H., Leckie, G., Charlton, C., and Browne, W. Multilevel models with random effects for level 1 variance functions, with application to child growth data. Submitted. Leckie, G. (013). Modeling the residual error variance in Two-Level Random- Coefficient Multilevel Models. Bulletin of the International Statistical Institute, 68, 1-6. Leckie, G. (014). runmixregls - A Program to Run the MIXREGLS Mixed-effects Location Scale Software from within Stata. Journal of Statistical Software, Code Snippet, Forthcoming. Leckie, G., French, R., Charlton, C., and Browne, W. (015). Modeling Heterogeneous Variance-Covariance Components in Two-Level Models. Journal of Educational and Behavioral Statistics. Forthcoming.
30 References to other work Hedeker, D., Mermelstein, R. J., & Demirtas, H. (008). An Application of a Mixed-Effects Location Scale Model for Analysis of Ecological Momentary Assessment (EMA) Data. Biometrics, 64, Lee, Y., & Nelder, J. A. (006). Double hierarchical generalized linear models (with discussion). Applied Statistics, 55, Rast, P., Hofer, S. M., & Sparks, C. (01). Modeling individual differences in within-person variation of negative and positive affect in a mixed effects location scale model using BUGS/JAGS. Multivariate Behavioral Research, 47,
31 What about modelling the level- variance-covariance matrix? It is relatively easy to model a variance-covariance matrix as a function of the covariates u j v j ~N 0 0, σ uj σ uvj σ vj log σ uj = κ 0 + κ 1 W j log σ vj = γ 0 + γ 1 W j tanh 1 ρ uvj = δ 0 + δ 1 W j However, simply specifying appropriate link functions will no longer ensure positive definiteness in 3 3 and larger variance-covariance matrices In MCMC sampler, reject any proposed parameter values which give rise to variance-covariance matrices which are not positive definite
University of Bristol - Explore Bristol Research. Peer reviewed version. Link to published version (if available): /
: /") Goldstein, H., Leckie, G., Charlton, C., Tilling, K., & Browne, W. (017). Multilevel growth curve models that incorporate a random coefficient model for the level 1 variance function. Statistical Methods
Goldstein, H., Leckie, G., Charlton, C., Tilling, K., & Browne, W. (017). Multilevel growth curve models that incorporate a random coefficient model for the level 1 variance function. Statistical Methods
Summary of Talk Background to Multilevel modelling project. What is complex level 1 variation? Tutorial dataset. Method 1 : Inverse Wishart proposals.
 Modelling the Variance : MCMC methods for tting multilevel models with complex level 1 variation and extensions to constrained variance matrices By Dr William Browne Centre for Multilevel Modelling Institute
Multilevel Modeling: A Second Course
 Multilevel Modeling: A Second Course Kristopher Preacher, Ph.D. Upcoming Seminar: February 2-3, 2017, Ft. Myers, Florida What this workshop will accomplish I will review the basics of multilevel modeling
An Application of a Mixed-Effects Location Scale Model for Analysis of Ecological Momentary Assessment (EMA) Data
 Data") An Application of a Mixed-Effects Location Scale Model for Analysis of Ecological Momentary Assessment (EMA) Data Don Hedeker, Robin Mermelstein, & Hakan Demirtas University of Illinois at Chicago hedeker@uic.edu
An Application of a Mixed-Effects Location Scale Model for Analysis of Ecological Momentary Assessment (EMA) Data Don Hedeker, Robin Mermelstein, & Hakan Demirtas University of Illinois at Chicago hedeker@uic.edu
Time-Invariant Predictors in Longitudinal Models
 Time-Invariant Predictors in Longitudinal Models Today s Topics: What happens to missing predictors Effects of time-invariant predictors Fixed vs. systematically varying vs. random effects Model building
Estimating a Piecewise Growth Model with Longitudinal Data that Contains Individual Mobility across Clusters
 Estimating a Piecewise Growth Model with Longitudinal Data that Contains Individual Mobility across Clusters Audrey J. Leroux Georgia State University Piecewise Growth Model (PGM) PGMs are beneficial for
Hierarchical Linear Modeling. Lesson Two
 Hierarchical Linear Modeling Lesson Two Lesson Two Plan Multivariate Multilevel Model I. The Two-Level Multivariate Model II. Examining Residuals III. More Practice in Running HLM I. The Two-Level Multivariate
1 Introduction. 2 Example
 Statistics: Multilevel modelling Richard Buxton. 2008. Introduction Multilevel modelling is an approach that can be used to handle clustered or grouped data. Suppose we are trying to discover some of the
Hierarchical Generalized Linear Models. ERSH 8990 REMS Seminar on HLM Last Lecture!
 Hierarchical Generalized Linear Models ERSH 8990 REMS Seminar on HLM Last Lecture! Hierarchical Generalized Linear Models Introduction to generalized models Models for binary outcomes Interpreting parameter
Designing Multilevel Models Using SPSS 11.5 Mixed Model. John Painter, Ph.D.
 Designing Multilevel Models Using SPSS 11.5 Mixed Model John Painter, Ph.D. Jordan Institute for Families School of Social Work University of North Carolina at Chapel Hill 1 Creating Multilevel Models
Statistical Distribution Assumptions of General Linear Models
 Statistical Distribution Assumptions of General Linear Models Applied Multilevel Models for Cross Sectional Data Lecture 4 ICPSR Summer Workshop University of Colorado Boulder Lecture 4: Statistical Distributions
The Basic Two-Level Regression Model
 7 Manuscript version, chapter in J.J. Hox, M. Moerbeek & R. van de Schoot (018). Multilevel Analysis. Techniques and Applications. New York, NY: Routledge. The Basic Two-Level Regression Model Summary.
LINEAR MULTILEVEL MODELS. Data are often hierarchical. By this we mean that data contain information
 LINEAR MULTILEVEL MODELS JAN DE LEEUW ABSTRACT. This is an entry for The Encyclopedia of Statistics in Behavioral Science, to be published by Wiley in 2005. 1. HIERARCHICAL DATA Data are often hierarchical.
Time-Invariant Predictors in Longitudinal Models
 Time-Invariant Predictors in Longitudinal Models Today s Class (or 3): Summary of steps in building unconditional models for time What happens to missing predictors Effects of time-invariant predictors
A multivariate multilevel model for the analysis of TIMMS & PIRLS data
 A multivariate multilevel model for the analysis of TIMMS & PIRLS data European Congress of Methodology July 23-25, 2014 - Utrecht Leonardo Grilli 1, Fulvia Pennoni 2, Carla Rampichini 1, Isabella Romeo
Spring RMC Professional Development Series January 14, Generalized Linear Mixed Models (GLMMs): Concepts and some Demonstrations
: Concepts and some Demonstrations") Spring RMC Professional Development Series January 14, 2016 Generalized Linear Mixed Models (GLMMs): Concepts and some Demonstrations Ann A. O Connell, Ed.D. Professor, Educational Studies (QREM) Director,
Spring RMC Professional Development Series January 14, 2016 Generalized Linear Mixed Models (GLMMs): Concepts and some Demonstrations Ann A. O Connell, Ed.D. Professor, Educational Studies (QREM) Director,
Time Invariant Predictors in Longitudinal Models
 Time Invariant Predictors in Longitudinal Models Longitudinal Data Analysis Workshop Section 9 University of Georgia: Institute for Interdisciplinary Research in Education and Human Development Section
Two-Level Models for Clustered* Data
 Two-Level Models for Clustered* Data Today s Class: Fixed vs. Random Effects for Modeling Clustered Data ICC and Design Effects in Clustered Data Group-Mean-Centering vs. Grand-Mean Centering Model Extensions
A Non-parametric bootstrap for multilevel models
 A Non-parametric bootstrap for multilevel models By James Carpenter London School of Hygiene and ropical Medicine Harvey Goldstein and Jon asbash Institute of Education 1. Introduction Bootstrapping is
Time-Invariant Predictors in Longitudinal Models
 Time-Invariant Predictors in Longitudinal Models Topics: What happens to missing predictors Effects of time-invariant predictors Fixed vs. systematically varying vs. random effects Model building strategies
Additional Notes: Investigating a Random Slope. When we have fixed level-1 predictors at level 2 we show them like this:
 Ron Heck, Summer 01 Seminars 1 Multilevel Regression Models and Their Applications Seminar Additional Notes: Investigating a Random Slope We can begin with Model 3 and add a Random slope parameter. If
An Introduction to Multilevel Models. PSYC 943 (930): Fundamentals of Multivariate Modeling Lecture 25: December 7, 2012
: Fundamentals of Multivariate Modeling Lecture 25: December 7, 2012") An Introduction to Multilevel Models PSYC 943 (930): Fundamentals of Multivariate Modeling Lecture 25: December 7, 2012 Today s Class Concepts in Longitudinal Modeling Between-Person vs. +Within-Person
An Introduction to Multilevel Models PSYC 943 (930): Fundamentals of Multivariate Modeling Lecture 25: December 7, 2012 Today s Class Concepts in Longitudinal Modeling Between-Person vs. +Within-Person
MLMED. User Guide. Nicholas J. Rockwood The Ohio State University Beta Version May, 2017
 MLMED User Guide Nicholas J. Rockwood The Ohio State University rockwood.19@osu.edu Beta Version May, 2017 MLmed is a computational macro for SPSS that simplifies the fitting of multilevel mediation and
Introduction to Bayesian Statistics and Markov Chain Monte Carlo Estimation. EPSY 905: Multivariate Analysis Spring 2016 Lecture #10: April 6, 2016
 Introduction to Bayesian Statistics and Markov Chain Monte Carlo Estimation EPSY 905: Multivariate Analysis Spring 2016 Lecture #10: April 6, 2016 EPSY 905: Intro to Bayesian and MCMC Today s Class An
Journal of Statistical Software
 JSS Journal of Statistical Software August 2014, Volume 59, Code Snippet 2. http://www.jstatsoft.org/ runmixregls: A Program to Run the MIXREGLS Mixed-Effects Location Scale Software from within Stata
Time-Invariant Predictors in Longitudinal Models
 Time-Invariant Predictors in Longitudinal Models Topics: Summary of building unconditional models for time Missing predictors in MLM Effects of time-invariant predictors Fixed, systematically varying,
Describing Change over Time: Adding Linear Trends
 Describing Change over Time: Adding Linear Trends Longitudinal Data Analysis Workshop Section 7 University of Georgia: Institute for Interdisciplinary Research in Education and Human Development Section
Generalized Linear Models (GLZ)
") Generalized Linear Models (GLZ) Generalized Linear Models (GLZ) are an extension of the linear modeling process that allows models to be fit to data that follow probability distributions other than the
Generalized Linear Models (GLZ) Generalized Linear Models (GLZ) are an extension of the linear modeling process that allows models to be fit to data that follow probability distributions other than the
Specifying Latent Curve and Other Growth Models Using Mplus. (Revised )
") Ronald H. Heck 1 University of Hawai i at Mānoa Handout #20 Specifying Latent Curve and Other Growth Models Using Mplus (Revised 12-1-2014) The SEM approach offers a contrasting framework for use in analyzing
Ronald H. Heck 1 University of Hawai i at Mānoa Handout #20 Specifying Latent Curve and Other Growth Models Using Mplus (Revised 12-1-2014) The SEM approach offers a contrasting framework for use in analyzing
H-LIKELIHOOD ESTIMATION METHOOD FOR VARYING CLUSTERED BINARY MIXED EFFECTS MODEL
 H-LIKELIHOOD ESTIMATION METHOOD FOR VARYING CLUSTERED BINARY MIXED EFFECTS MODEL Intesar N. El-Saeiti Department of Statistics, Faculty of Science, University of Bengahzi-Libya. entesar.el-saeiti@uob.edu.ly
WU Weiterbildung. Linear Mixed Models
 Linear Mixed Effects Models WU Weiterbildung SLIDE 1 Outline 1 Estimation: ML vs. REML 2 Special Models On Two Levels Mixed ANOVA Or Random ANOVA Random Intercept Model Random Coefficients Model Intercept-and-Slopes-as-Outcomes
Assessing the relation between language comprehension and performance in general chemistry. Appendices
 Assessing the relation between language comprehension and performance in general chemistry Daniel T. Pyburn a, Samuel Pazicni* a, Victor A. Benassi b, and Elizabeth E. Tappin c a Department of Chemistry,
Partitioning variation in multilevel models.
 Partitioning variation in multilevel models. by Harvey Goldstein, William Browne and Jon Rasbash Institute of Education, London, UK. Summary. In multilevel modelling, the residual variation in a response
Longitudinal Modeling with Logistic Regression
 Newsom 1 Longitudinal Modeling with Logistic Regression Longitudinal designs involve repeated measurements of the same individuals over time There are two general classes of analyses that correspond to
1. (Rao example 11.15) A study measures oxygen demand (y) (on a log scale) and five explanatory variables (see below). Data are available as
 A study measures oxygen demand (y) (on a log scale) and five explanatory variables (see below). Data are available as") ST 51, Summer, Dr. Jason A. Osborne Homework assignment # - Solutions 1. (Rao example 11.15) A study measures oxygen demand (y) (on a log scale) and five explanatory variables (see below). Data are available
ST 51, Summer, Dr. Jason A. Osborne Homework assignment # - Solutions 1. (Rao example 11.15) A study measures oxygen demand (y) (on a log scale) and five explanatory variables (see below). Data are available
INTRODUCTION TO MULTILEVEL MODELLING FOR REPEATED MEASURES DATA. Belfast 9 th June to 10 th June, 2011
 INTRODUCTION TO MULTILEVEL MODELLING FOR REPEATED MEASURES DATA Belfast 9 th June to 10 th June, 2011 Dr James J Brown Southampton Statistical Sciences Research Institute (UoS) ADMIN Research Centre (IoE
Random Intercept Models
 Random Intercept Models Edps/Psych/Soc 589 Carolyn J. Anderson Department of Educational Psychology c Board of Trustees, University of Illinois Spring 2019 Outline A very simple case of a random intercept
The Application and Promise of Hierarchical Linear Modeling (HLM) in Studying First-Year Student Programs
 in Studying First-Year Student Programs") The Application and Promise of Hierarchical Linear Modeling (HLM) in Studying First-Year Student Programs Chad S. Briggs, Kathie Lorentz & Eric Davis Education & Outreach University Housing Southern Illinois
The Application and Promise of Hierarchical Linear Modeling (HLM) in Studying First-Year Student Programs Chad S. Briggs, Kathie Lorentz & Eric Davis Education & Outreach University Housing Southern Illinois
Harvard University. Rigorous Research in Engineering Education
 Statistical Inference Kari Lock Harvard University Department of Statistics Rigorous Research in Engineering Education 12/3/09 Statistical Inference You have a sample and want to use the data collected
Model Assumptions; Predicting Heterogeneity of Variance
 Model Assumptions; Predicting Heterogeneity of Variance Today s topics: Model assumptions Normality Constant variance Predicting heterogeneity of variance CLP 945: Lecture 6 1 Checking for Violations of
Course Introduction and Overview Descriptive Statistics Conceptualizations of Variance Review of the General Linear Model
 Course Introduction and Overview Descriptive Statistics Conceptualizations of Variance Review of the General Linear Model PSYC 943 (930): Fundamentals of Multivariate Modeling Lecture 1: August 22, 2012
Multilevel Analysis, with Extensions
 May 26, 2010 We start by reviewing the research on multilevel analysis that has been done in psychometrics and educational statistics, roughly since 1985. The canonical reference (at least I hope so) is
Application of Item Response Theory Models for Intensive Longitudinal Data
 Application of Item Response Theory Models for Intensive Longitudinal Data Don Hedeker, Robin Mermelstein, & Brian Flay University of Illinois at Chicago hedeker@uic.edu Models for Intensive Longitudinal
Multilevel Structural Equation Modeling
 Multilevel Structural Equation Modeling Joop Hox Utrecht University j.hox@uu.nl http://www.joophox.net 14_15_mlevsem Multilevel Regression Three level data structure Groups at different levels may have
Ron Heck, Fall Week 3: Notes Building a Two-Level Model
 Ron Heck, Fall 2011 1 EDEP 768E: Seminar on Multilevel Modeling rev. 9/6/2011@11:27pm Week 3: Notes Building a Two-Level Model We will build a model to explain student math achievement using student-level
Review of Multiple Regression
 Ronald H. Heck 1 Let s begin with a little review of multiple regression this week. Linear models [e.g., correlation, t-tests, analysis of variance (ANOVA), multiple regression, path analysis, multivariate
MULTILEVEL IMPUTATION 1
 MULTILEVEL IMPUTATION 1 Supplement B: MCMC Sampling Steps and Distributions for Two-Level Imputation This document gives technical details of the full conditional distributions used to draw regression
Bayesian Methods in Multilevel Regression
 Bayesian Methods in Multilevel Regression Joop Hox MuLOG, 15 september 2000 mcmc What is Statistics?! Statistics is about uncertainty To err is human, to forgive divine, but to include errors in your design
Hierarchical Linear Models. Jeff Gill. University of Florida
 Hierarchical Linear Models Jeff Gill University of Florida I. ESSENTIAL DESCRIPTION OF HIERARCHICAL LINEAR MODELS II. SPECIAL CASES OF THE HLM III. THE GENERAL STRUCTURE OF THE HLM IV. ESTIMATION OF THE
Multi-level Models: Idea
 Review of 140.656 Review Introduction to multi-level models The two-stage normal-normal model Two-stage linear models with random effects Three-stage linear models Two-stage logistic regression with random
Modeling Data with Linear Combinations of Basis Functions. Read Chapter 3 in the text by Bishop
 Modeling Data with Linear Combinations of Basis Functions Read Chapter 3 in the text by Bishop A Type of Supervised Learning Problem We want to model data (x 1, t 1 ),..., (x N, t N ), where x i is a vector
Models for Clustered Data
 Models for Clustered Data Edps/Psych/Soc 589 Carolyn J Anderson Department of Educational Psychology c Board of Trustees, University of Illinois Spring 2019 Outline Notation NELS88 data Fixed Effects ANOVA
Models for Clustered Data
 Models for Clustered Data Edps/Psych/Stat 587 Carolyn J Anderson Department of Educational Psychology c Board of Trustees, University of Illinois Fall 2017 Outline Notation NELS88 data Fixed Effects ANOVA
Dyadic Data Analysis. Richard Gonzalez University of Michigan. September 9, 2010
 Dyadic Data Analysis Richard Gonzalez University of Michigan September 9, 2010 Dyadic Component 1. Psychological rationale for homogeneity and interdependence 2. Statistical framework that incorporates
Exploiting TIMSS and PIRLS combined data: multivariate multilevel modelling of student achievement
 Exploiting TIMSS and PIRLS combined data: multivariate multilevel modelling of student achievement Second meeting of the FIRB 2012 project Mixture and latent variable models for causal-inference and analysis
Hierarchical Linear Models (HLM) Using R Package nlme. Interpretation. 2 = ( x 2) u 0j. e ij
 Using R Package nlme. Interpretation. 2 = ( x 2) u 0j. e ij") Hierarchical Linear Models (HLM) Using R Package nlme Interpretation I. The Null Model Level 1 (student level) model is mathach ij = β 0j + e ij Level 2 (school level) model is β 0j = γ 00 + u 0j Combined
Hierarchical Linear Models (HLM) Using R Package nlme Interpretation I. The Null Model Level 1 (student level) model is mathach ij = β 0j + e ij Level 2 (school level) model is β 0j = γ 00 + u 0j Combined
Advanced Quantitative Data Analysis
 Chapter 24 Advanced Quantitative Data Analysis Daniel Muijs Doing Regression Analysis in SPSS When we want to do regression analysis in SPSS, we have to go through the following steps: 1 As usual, we choose
Three-Level Modeling for Factorial Experiments With Experimentally Induced Clustering
 Three-Level Modeling for Factorial Experiments With Experimentally Induced Clustering John J. Dziak The Pennsylvania State University Inbal Nahum-Shani The University of Michigan Copyright 016, Penn State.
LDA Midterm Due: 02/21/2005
 LDA.665 Midterm Due: //5 Question : The randomized intervention trial is designed to answer the scientific questions: whether social network method is effective in retaining drug users in treatment programs,
Recent Developments in Multilevel Modeling
 Recent Developments in Multilevel Modeling Roberto G. Gutierrez Director of Statistics StataCorp LP 2007 North American Stata Users Group Meeting, Boston R. Gutierrez (StataCorp) Multilevel Modeling August
Multilevel/Mixed Models and Longitudinal Analysis Using Stata
 Multilevel/Mixed Models and Longitudinal Analysis Using Stata Isaac J. Washburn PhD Research Associate Oregon Social Learning Center Summer Workshop Series July 2010 Longitudinal Analysis 1 Longitudinal
Journal of Statistical Software
 JSS Journal of Statistical Software March 2013, Volume 52, Issue 12. http://www.jstatsoft.org/ MIXREGLS: A Program for Mixed-Effects Location Scale Analysis Donald Hedeker University of Illinois at Chicago
Multiple Linear Regression II. Lecture 8. Overview. Readings
 Multiple Linear Regression II Lecture 8 Image source:https://commons.wikimedia.org/wiki/file:autobunnskr%c3%a4iz-ro-a201.jpg Survey Research & Design in Psychology James Neill, 2016 Creative Commons Attribution
Multiple Linear Regression II. Lecture 8. Overview. Readings. Summary of MLR I. Summary of MLR I. Summary of MLR I
 Multiple Linear Regression II Lecture 8 Image source:https://commons.wikimedia.org/wiki/file:autobunnskr%c3%a4iz-ro-a201.jpg Survey Research & Design in Psychology James Neill, 2016 Creative Commons Attribution
One-Way ANOVA. Some examples of when ANOVA would be appropriate include:
 One-Way ANOVA 1. Purpose Analysis of variance (ANOVA) is used when one wishes to determine whether two or more groups (e.g., classes A, B, and C) differ on some outcome of interest (e.g., an achievement
Nonlinear multilevel models, with an application to discrete response data
 Biometrika (1991), 78, 1, pp. 45-51 Printed in Great Britain Nonlinear multilevel models, with an application to discrete response data BY HARVEY GOLDSTEIN Department of Mathematics, Statistics and Computing,
Univariate analysis. Simple and Multiple Regression. Univariate analysis. Simple Regression How best to summarise the data?
 Univariate analysis Example - linear regression equation: y = ax + c Least squares criteria ( yobs ycalc ) = yobs ( ax + c) = minimum Simple and + = xa xc xy xa + nc = y Solve for a and c Univariate analysis
TABLE OF CONTENTS INTRODUCTION TO MIXED-EFFECTS MODELS...3
 Table of contents TABLE OF CONTENTS...1 1 INTRODUCTION TO MIXED-EFFECTS MODELS...3 Fixed-effects regression ignoring data clustering...5 Fixed-effects regression including data clustering...1 Fixed-effects
Computationally Efficient Estimation of Multilevel High-Dimensional Latent Variable Models
 Computationally Efficient Estimation of Multilevel High-Dimensional Latent Variable Models Tihomir Asparouhov 1, Bengt Muthen 2 Muthen & Muthen 1 UCLA 2 Abstract Multilevel analysis often leads to modeling
Multiple Linear Regression II. Lecture 8. Overview. Readings
 Multiple Linear Regression II Lecture 8 Image source:http://commons.wikimedia.org/wiki/file:vidrarias_de_laboratorio.jpg Survey Research & Design in Psychology James Neill, 2015 Creative Commons Attribution
Multiple Linear Regression II. Lecture 8. Overview. Readings. Summary of MLR I. Summary of MLR I. Summary of MLR I
 Multiple Linear Regression II Lecture 8 Image source:http://commons.wikimedia.org/wiki/file:vidrarias_de_laboratorio.jpg Survey Research & Design in Psychology James Neill, 2015 Creative Commons Attribution
Generalized Linear Models for Non-Normal Data
 Generalized Linear Models for Non-Normal Data Today s Class: 3 parts of a generalized model Models for binary outcomes Complications for generalized multivariate or multilevel models SPLH 861: Lecture
Ronald Heck Week 14 1 EDEP 768E: Seminar in Categorical Data Modeling (F2012) Nov. 17, 2012
 Nov. 17, 2012") Ronald Heck Week 14 1 From Single Level to Multilevel Categorical Models This week we develop a two-level model to examine the event probability for an ordinal response variable with three categories (persist
Ronald Heck Week 14 1 From Single Level to Multilevel Categorical Models This week we develop a two-level model to examine the event probability for an ordinal response variable with three categories (persist
Part 8: GLMs and Hierarchical LMs and GLMs
 Part 8: GLMs and Hierarchical LMs and GLMs 1 Example: Song sparrow reproductive success Arcese et al., (1992) provide data on a sample from a population of 52 female song sparrows studied over the course
Bayesian Hierarchical Models
 Bayesian Hierarchical Models Gavin Shaddick, Millie Green, Matthew Thomas University of Bath 6 th - 9 th December 2016 1/ 34 APPLICATIONS OF BAYESIAN HIERARCHICAL MODELS 2/ 34 OUTLINE Spatial epidemiology
Tutorial 6: Tutorial on Translating between GLIMMPSE Power Analysis and Data Analysis. Acknowledgements:
 Tutorial 6: Tutorial on Translating between GLIMMPSE Power Analysis and Data Analysis Anna E. Barón, Keith E. Muller, Sarah M. Kreidler, and Deborah H. Glueck Acknowledgements: The project was supported
CAMPBELL COLLABORATION
 CAMPBELL COLLABORATION Random and Mixed-effects Modeling C Training Materials 1 Overview Effect-size estimates Random-effects model Mixed model C Training Materials Effect sizes Suppose we have computed
Multilevel Analysis of Assessment Data
 8 Multilevel Analysis of Assessment Data Jee-Seon Kim University of Wisconsin-Madison Carolyn J. Anderson University of Illinois Bryan Keller Teachers College, Columbia University Contents Introduction...390
Discrete Response Multilevel Models for Repeated Measures: An Application to Voting Intentions Data
 Quality & Quantity 34: 323 330, 2000. 2000 Kluwer Academic Publishers. Printed in the Netherlands. 323 Note Discrete Response Multilevel Models for Repeated Measures: An Application to Voting Intentions
A 3-level Bayesian mixed effects location scale model with an application to ecological momentary assessment data
 Received: 28 July 2017 Revised: 2 January 2018 Accepted: 13 January 2018 DOI: 10.1002/sim.7627 RESEARCH ARTICLE A 3-level Bayesian mixed effects location scale model with an application to ecological momentary
Correlation and Regression Bangkok, 14-18, Sept. 2015
 Analysing and Understanding Learning Assessment for Evidence-based Policy Making Correlation and Regression Bangkok, 14-18, Sept. 2015 Australian Council for Educational Research Correlation The strength
Online appendices for: Explaining Fixed Effects: Random Effects modelling of Time-Series Cross-Sectional and Panel Data
 Online appendices for: Explaining Fixed Effects: Random Effects modelling of Time-Series Cross-Sectional and Panel Data Andrew Bell and Kelvyn Jones School of Geographical Sciences and Centre for Multilevel
Introducing Generalized Linear Models: Logistic Regression
 Ron Heck, Summer 2012 Seminars 1 Multilevel Regression Models and Their Applications Seminar Introducing Generalized Linear Models: Logistic Regression The generalized linear model (GLM) represents and
Review of Multilevel Models for Longitudinal Data
 Review of Multilevel Models for Longitudinal Data Topics: Concepts in longitudinal multilevel modeling Describing within-person fluctuation using ACS models Describing within-person change using random
Random Coefficient Model (a.k.a. multilevel model) (Adapted from UCLA Statistical Computing Seminars)
 (Adapted from UCLA Statistical Computing Seminars)") STAT:5201 Applied Statistic II Random Coefficient Model (a.k.a. multilevel model) (Adapted from UCLA Statistical Computing Seminars) School math achievement scores The data file consists of 7185 students
STAT:5201 Applied Statistic II Random Coefficient Model (a.k.a. multilevel model) (Adapted from UCLA Statistical Computing Seminars) School math achievement scores The data file consists of 7185 students
Correlation & Simple Regression
 Chapter 11 Correlation & Simple Regression The previous chapter dealt with inference for two categorical variables. In this chapter, we would like to examine the relationship between two quantitative variables.
Introduction to Within-Person Analysis and RM ANOVA
 Introduction to Within-Person Analysis and RM ANOVA Today s Class: From between-person to within-person ANOVAs for longitudinal data Variance model comparisons using 2 LL CLP 944: Lecture 3 1 The Two Sides
Objectives Simple linear regression. Statistical model for linear regression. Estimating the regression parameters
 Objectives 10.1 Simple linear regression Statistical model for linear regression Estimating the regression parameters Confidence interval for regression parameters Significance test for the slope Confidence
STA 216, GLM, Lecture 16. October 29, 2007
 STA 216, GLM, Lecture 16 October 29, 2007 Efficient Posterior Computation in Factor Models Underlying Normal Models Generalized Latent Trait Models Formulation Genetic Epidemiology Illustration Structural
Bayesian Networks in Educational Assessment
 Bayesian Networks in Educational Assessment Estimating Parameters with MCMC Bayesian Inference: Expanding Our Context Roy Levy Arizona State University Roy.Levy@asu.edu 2017 Roy Levy MCMC 1 MCMC 2 Posterior
Ron Heck, Fall Week 8: Introducing Generalized Linear Models: Logistic Regression 1 (Replaces prior revision dated October 20, 2011)
") Ron Heck, Fall 2011 1 EDEP 768E: Seminar in Multilevel Modeling rev. January 3, 2012 (see footnote) Week 8: Introducing Generalized Linear Models: Logistic Regression 1 (Replaces prior revision dated October
Ron Heck, Fall 2011 1 EDEP 768E: Seminar in Multilevel Modeling rev. January 3, 2012 (see footnote) Week 8: Introducing Generalized Linear Models: Logistic Regression 1 (Replaces prior revision dated October
Estimation and Centering
 Estimation and Centering PSYED 3486 Feifei Ye University of Pittsburgh Main Topics Estimating the level-1 coefficients for a particular unit Reading: R&B, Chapter 3 (p85-94) Centering-Location of X Reading
Determining Sample Sizes for Surveys with Data Analyzed by Hierarchical Linear Models
 Journal of Of cial Statistics, Vol. 14, No. 3, 1998, pp. 267±275 Determining Sample Sizes for Surveys with Data Analyzed by Hierarchical Linear Models Michael P. ohen 1 Behavioral and social data commonly
Product Held at Accelerated Stability Conditions. José G. Ramírez, PhD Amgen Global Quality Engineering 6/6/2013
 Modeling Sub-Visible Particle Data Product Held at Accelerated Stability Conditions José G. Ramírez, PhD Amgen Global Quality Engineering 6/6/2013 Outline Sub-Visible Particle (SbVP) Poisson Negative Binomial
Introduction to. Multilevel Analysis
 Introduction to Multilevel Analysis Tom Snijders University of Oxford University of Groningen December 2009 Tom AB Snijders Introduction to Multilevel Analysis 1 Multilevel Analysis based on the Hierarchical
AN APPLICATION OF MULTILEVEL MODEL PREDICTION TO NELS:88
 Behaviormetrika Vol.31, No.1, 2004, 43 66 AN APPLICATION OF MULTILEVEL MODEL PREDICTION TO NELS:88 David Afshartous and Jan de Leeuw Multilevel modeling is often used in the social sciences for analyzing
Lecture Outline. Biost 518 Applied Biostatistics II. Choice of Model for Analysis. Choice of Model. Choice of Model. Lecture 10: Multiple Regression:
 Biost 518 Applied Biostatistics II Scott S. Emerson, M.D., Ph.D. Professor of Biostatistics University of Washington Lecture utline Choice of Model Alternative Models Effect of data driven selection of
Interactions among Continuous Predictors
 Interactions among Continuous Predictors Today s Class: Simple main effects within two-way interactions Conquering TEST/ESTIMATE/LINCOM statements Regions of significance Three-way interactions (and beyond
Variance partitioning in multilevel logistic models that exhibit overdispersion
 J. R. Statist. Soc. A (2005) 168, Part 3, pp. 599 613 Variance partitioning in multilevel logistic models that exhibit overdispersion W. J. Browne, University of Nottingham, UK S. V. Subramanian, Harvard
Simple, Marginal, and Interaction Effects in General Linear Models: Part 1
 Simple, Marginal, and Interaction Effects in General Linear Models: Part 1 PSYC 943 (930): Fundamentals of Multivariate Modeling Lecture 2: August 24, 2012 PSYC 943: Lecture 2 Today s Class Centering and