Alliance for College-Ready Public Schools
|
|
|
- Quentin Kelley
- 5 years ago
- Views:
Transcription
1 Alliance for College-Ready Public Schools Version 2 Alliance Summative IM1 CMP AND IMP Teacher Rationale
2 About the Teacher Rationale This document contains the specific definitions for the Version 2 Alliance Summative IM1 CMP AND IMP assessment. This includes: (a) (b) (c) (d) The item number as it appears on the assessment. The item. The standard, standard description, and Depth of Knowledge (DOK) level of the item. The correct answer and rationale for each incorrect response for each multiple-choice item and scoring rubric for each short constructed response or constructed response item. These specifications have been included to help you look for consistencies in student errors, and the specific cause of the student error in turn, this should help guide your intervention and reteach strategies.
3 Test Definition File Item # Correct Answer(s) Standard 1 B CCSS.Math.Content.HSA-REI.D.12 2 See Scoring Rubric CCSS.Math.Content.HSA-CED.A.3 3 C CCSS.Math.Content.HSA-REI.B.3 4 See Scoring Rubric CCSS.Math.Content.HSF-IF.B.6 5 D CCSS.Math.Content.HSF-IF.B.4 6 B CCSS.Math.Content.HSG-CO.B.7 7 See Scoring Rubric CCSS.Math.Content.HSA-REI.B.3 8 D CCSS.Math.Content.HSN-Q.A.1 9 See Scoring Rubric CCSS.Math.Content.HSA-REI.D C CCSS.Math.Content.HSN-Q.A.1 11 See Scoring Rubric CCSS.Math.Content.HSA-CED.A.2 12 A CCSS.Math.Content.HSG-CO.B.6 13 C CCSS.Math.Content.HSF-IF.A.3 14 See Scoring Rubric CCSS.Math.Content.HSF-IF.A.1 15 B CCSS.Math.Content.HSA-REI.B.3 16 See Scoring Rubric CCSS.Math.Content.HSA-CED.A.1 17 A CCSS.Math.Content.HSA-CED.A.1 18 A CCSS.Math.Content.HSA-CED.A.3 19 A CCSS.Math.Content.HSF-IF.A.1 20 A CCSS.Math.Content.HSA-SSE.A.1.a 21 A CCSS.Math.Content.HSA-SSE.A.1.a 22 A CCSS.Math.Content.HSG-CO.B.7 23 A CCSS.Math.Content.HSG-CO.B.6 24 A CCSS.Math.Content.HSN-Q.A.1 25 C CCSS.Math.Content.HSS-ID.B.6.a 26 A CCSS.Math.Content.HSS-ID.B.6.a 27 B CCSS.Math.Content.HSS-ID.C.7 28 See Scoring Rubric CCSS.Math.Content.HSS-ID.C.7 29 A CCSS.Math.Content.HSA-REI.D A CCSS.Math.Content.HSF-IF.B.4 3
4 Standards Coverage Summary: CC Standard DOK 1 DOK 2 DOK 3 DOK 4 Total CCSS.Math.Content.HSN-Q.A CCSS.Math.Content.HSA-SSE.A.1.a CCSS.Math.Content.HSA-CED.A CCSS.Math.Content.HSA-CED.A CCSS.Math.Content.HSA-CED.A CCSS.Math.Content.HSA-REI.B CCSS.Math.Content.HSA-REI.D CCSS.Math.Content.HSA-REI.D CCSS.Math.Content.HSA-REI.D CCSS.Math.Content.HSF-IF.A CCSS.Math.Content.HSF-IF.A CCSS.Math.Content.HSF-IF.B CCSS.Math.Content.HSF-IF.B CCSS.Math.Content.HSG-CO.B CCSS.Math.Content.HSG-CO.B CCSS.Math.Content.HSS-ID.B.6.a CCSS.Math.Content.HSS-ID.C Total
5 Rationale 5
, and graph the solution set to a system of linear")

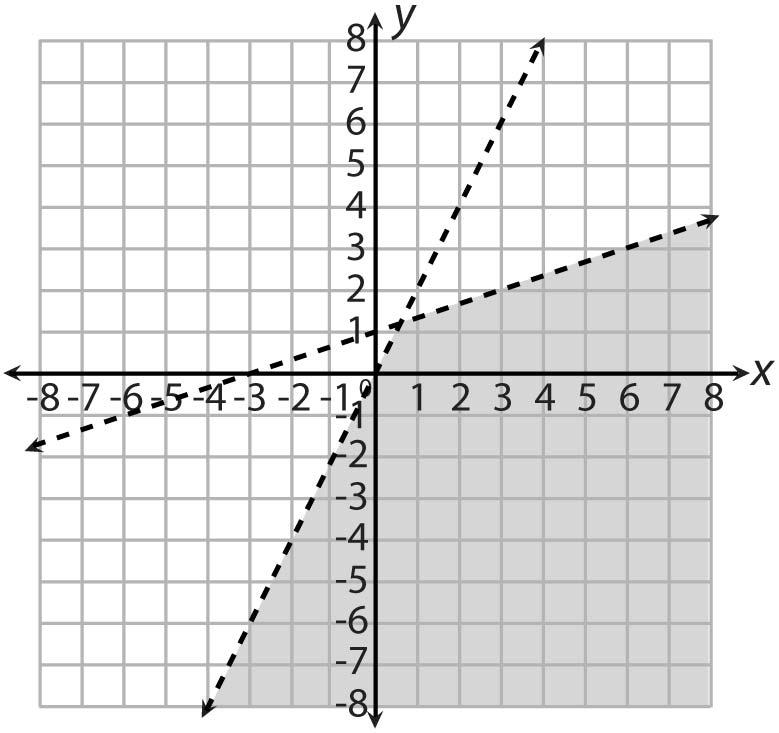
6 Question #1 (E258442) Which graph shows the solution to this system? y < 2x y > 1 3 x + 1 A. CCSS.Math.Content.HSA-REI.D.12 > DOK 1 Graph the solutions to a linear inequality in two variables as a half-plane (excluding the boundary in the case of a strict inequality), and graph the solution set to a system of linear inequalities in two variables as the intersection of the corresponding half-planes. A. This is the result of shading with the signs reversed, using > in the first inequality and < in the second. B. Correct: The line y = 2x is graphed with a dashed line, and the graph of y = 1/3x + 1 is also graphed using a dashed line. The area that needs to be shaded is determined by testing a point in that area. C. This is the result of shading as if the signs in both inequalities are <. D. This is the result of shading as if the signs in both inequalities are >. B. 6

7 C. D. 7

8 Question #2 (E217391) A carpenter makes wooden chairs. He has enough wood to make 30 chairs. He makes $60 profit on a dining chair and $90 profit on a rocking chair. It takes him 1 hour to make a dining chair and 2 hours to make a rocking chair. He only has 40 hours available to work on the chairs. The carpenter wants to maximize his profit given the constraints. He draws the graph below to represent this situation. CCSS.Math.Content.HSA-CED.A.3 > DOK 2 Represent constraints by equations or inequalities, and by systems of equations and/or inequalities, and interpret solutions as viable or non-viable options in a modeling context. Rationale Given the constraints, the carpenter can maximize profits by making 20 dining chairs and 10 rocking chairs. His total profit for all the chairs will be $2,100. The graph shows the system of inequalities x + y 30 and 2x + y 40, which represents the given constraints. The profit can be found using the equation Profit = 60x + 90y where x stands for the number of dining chairs and y stands for the number of rocking chairs. We substitute the corner points (which are (0, 20), (20, 10), and (30, 0)) into this function to find which point gives the maximum profit. 60(0) + 90(20) = 1,800 60(20) + 90(10) = 2,100 60(30) + 90(0) = 1,800 The point (20, 10) gives the maximum profit, so the carpenter should make 20 dining chairs and 10 rocking chairs for a profit of $2,100. Use the drop-down menus to correctly complete the statements below. This question must be answered online. 8
9 Question #3 (E185893) The values a and b in the equation ax = 3 + bx are constants. What value of x satisfies this equation? A. 3 + b a B. 3 a 3 b C. 3 a b D. 3a 3b Question #4 (E213585) The graph below shows the height of a small tree, in feet, as a function of the number of years since it was planted. CCSS.Math.Content.HSA-REI.B.3 > DOK 1 Solve linear equations and inequalities in one variable, including equations with coefficients represented by letters. A. This is the result of making a mistake in the first step when dividing the constant a on both sides. B. This is the result of making a mistake when simplifying ax bx = 3. C. Correct: This is the result of solving ax bx = 3 x(a b) = 3 x = 3/(a b). D. This is the result of making a mistake when simplifying x(a b) = 3. CCSS.Math.Content.HSF-IF.B.6 > DOK 2 Calculate and interpret the average rate of change of a function (presented symbolically or as a table) over a specified interval. Estimate the rate of change from a graph. Rationale The height of the tree goes from 4 feet in year 0 to 6 feet in year 4. This is a change of 2 feet in 4 years, which equals 0.5 foot per year. Choose a response from each drop-down menu to complete the sentence below. This question must be answered online. 9


10 Question #5 (E213107) A bus is traveling 500 miles at a constant speed of 55 miles per hour. Which graph represents n, the number of miles REMAINING on the trip, as a function of t, the number of hours traveled? A. CCSS.Math.Content.HSF-IF.B.4 > DOK 2 For a function that models a relationship between two quantities, interpret key features of graphs and tables in terms of the quantities, and sketch graphs showing key features given a verbal description of the relationship. A. This is incorrect because it shows the miles remaining as the independent variable and the time traveled as the dependent variable. B. This is incorrect because it shows the miles traveled as the independent variable and the time traveled as the dependent variable. C. This is incorrect because it shows the miles traveled, not remaining, as the dependent variable. D. Correct: This is correct because it shows the time traveled as the independent variable and the miles remaining as the dependent variable, and the correct intercepts. B. C. 10
 What is the value of x that makes this equation true?")
11 D. Question #6 (E213294) The following are true for LMN. m L = 45 ; m M = 55 ; LM = 7 inches Triangle LMN is reflected across the x -axis and then rotated about its center to form its image, L M N. Which statement is true? A. m M = 45 B. m N = 80 C. m M = 170 D. m N = 73 Question #7 (E270575) What is the value of x that makes this equation true? 5 2x 3 + 4x = 3x + 6 Use the on-screen keyboard to complete the equation below. CCSS.Math.Content.HSG-CO.B.7 > DOK 2 Use the definition of congruence in terms of rigid motions to show that two triangles are congruent if and only if corresponding pairs of sides and corresponding pairs of angles are congruent. A. This answer is incorrect. Since angle M' corresponds to angle M, its measure is 55 degrees. B. Correct: This is the correct answer. A reflection and a rotation are rigid motions, so the original triangle and its image are congruent. Since the sum of the angles of a triangle is 180, angle N = 180 ( ) = 80 degrees. C. This answer is the result of finding 180 (55 45). D. This answer is the result of finding 180 ( ). CCSS.Math.Content.HSA-REI.B.3 > DOK 1 Solve linear equations and inequalities in one variable, including equations with coefficients represented by letters. Rationale A correct response of x = 3. This question must be answered online. 11
 The graphs of linear functions f and g are shown below. CCSS.Math.Content.HSN-Q.A.")
12 Question #8 (E178563) Tara bakes 225 cookies in 5 hours, and she uses 8 pounds of sugar. She divides 225 by 5 to get a rate of 45. Which of the following corresponds to this rate? A. pounds per hour B. hours per cookie C. cookies per pound D. cookies per hour Question #9 (E270577) The graphs of linear functions f and g are shown below. CCSS.Math.Content.HSN-Q.A.1 > DOK 1 Use units as a way to understand problems and to guide the solution of multi-step problems; choose and interpret units consistently in formulas; choose and interpret the scale and the origin in graphs and data displays. A. This expression uses two units that are in the problem, but the number that is used as the dividend (225) relates to cookies, not pounds. B. This is the result of using the two correct units, but reversing their positions. C. This expression uses two units that are in the problem, but the number that is used as the divisor (5) relates to hours, not pounds. D. Correct: This unit corresponds to the units for the dividend and divisor. CCSS.Math.Content.HSA-REI.D.11 > DOK 1 Explain why the x-coordinates of the points where the graphs of the equations y = f(x) and y = g(x) intersect are the solutions of the equation f(x) = g(x); find the solutions approximately, e.g., using technology to graph the functions, make tables of values, or find successive approximations. Include cases where f(x) and/or g(x) are linear, polynomial, rational, absolute value, exponential, and logarithmic functions. Rationale Correct response of -3 or x = -3. Responses of -1/2 or 6 indicate confusion between the solution to the system and the intercepts. A response of 5 indicates the student misinterpreted the y-coordinate of the intersection point as the solution. What is the solution to f(x) = g(x)? Use the onscreen keyboard to enter the solution. This question must be answered online. 12
13 Question #10 (E258755) On a certain date, the price of silver was $30 per ounce. The graph below shows how the total cost of the silver depends on the amount purchased. CCSS.Math.Content.HSN-Q.A.1 > DOK 2 Use units as a way to understand problems and to guide the solution of multi-step problems; choose and interpret units consistently in formulas; choose and interpret the scale and the origin in graphs and data displays. A. This is the result of thinking that the line should go from (0, 0) to (10, 30). B. This uses the $30 per ounce from the problem. C. Correct: The cost of 10 ounces of silver is $300, and the line on the graph goes from (0, 0) to (10, 300). Since the line goes up 6 units, each unit represents = 50 dollars. D. This is the cost of 10 ounces of silver. The scale on the vertical axis of the graph is missing. What does each unit on the vertical axis represent? A. $5 B. $30 C. $50 D. $300 13
14 Question #11 (E270578) Mr. Rokum is comparing the costs for two different electrical providers for his home. Provider A charges $0.15 per kilowatt-hour. Provider B charges a flat rate of $20 per month plus $0.10 per kilowatt-hour. On the coordinate grid below, graph a system of equations to model c, the total cost in dollars for each plan, based on h kilowatt-hours of electricity used during a one-month period. To graph a ray, make sure the Ray button is highlighted. On the coordinate grid, find the endpoint of the ray and click on that point, then find another point on the ray and click on that point. CCSS.Math.Content.HSA-CED.A.2 > DOK 2 Create equations in two or more variables to represent relationships between quantities; graph equations on coordinate axes with labels and scales. Rationale The correct graph is given below. Note: Any 2 points on either ray is acceptable, as long as the endpoint is one of the points. This question must be answered online. 14
15 Question #12 (E184108) In the graph, ABC A B C. CCSS.Math.Content.HSG-CO.B.6 > DOK 2 Use geometric descriptions of rigid motions to transform figures and to predict the effect of a given rigid motion on a given figure; given two figures, use the definition of congruence in terms of rigid motions to decide if they are congruent. A. Correct: These two transformations map triangle ABC onto triangle A'B'C'. B. This transformation maps triangle ABC into the correct quadrant, but it is not the correct transformation. For example, point A' after this transformation is at ( 1, 3) instead of ( 3, 1). C. This transformation maps triangle ABC into the correct quadrant, but it is not the correct transformation. For example, point A' after this transformation is at ( 1, 3) instead of ( 3, 1). D. Two reflections are required to correctly map the triangle. However, these reflections result in a transformed triangle in the incorrect quadrant. Which transformation maps ABC onto A B C? A. Reflect about x-axis and then reflect about the y- axis. B. Rotate 90 counterclockwise and then reflect about the y axis. C. Rotate 90 clockwise and then reflect about the x- axis. D. Reflect about y = x and then reflect about the y- axis. Question #13 (E270579) Consider the sequence whose first five terms are shown below. 8, 6, 4, 2, 0 Which function, with the domain of n = {1, 2, 3, 4, 5} defines this sequence? A. f (n) = n + 9 B. f (n) = 10n + 2 C. f (n) = 2n + 10 D. f (n) = n 2 CCSS.Math.Content.HSF-IF.A.3 > DOK 2 Recognize that sequences are functions, sometimes defined recursively, whose domain is a subset of the integers. A. This function is correct for only the first term. B. This function switches 2 and 10 and results in 8, 18, 28, and so on. C. Correct: The sequence corresponds to f(1), f(2), f(3), f(4), and f(5). D. This function uses the arithmetic difference of the pattern. 15
16 Question #14 (E212954) Five relations are shown below. Determine which of these relations are functions. Drag and drop each relation to the correct box. This question must be answered online. CCSS.Math.Content.HSF-IF.A.1 > DOK 1 Understand that a function from one set (called the domain) to another set (called the range) assigns to each element of the domain exactly one element of the range. If f is a function and x is an element of its domain, then f(x) denotes the output of f corresponding to the input x. The graph of f is the graph of the equation y = f(x). Rationale If a relation is a function, each x value (or input) is associated with one and only one y-value (or output). Relation 1 is NOT a function. Since the input 0 is mapped to two outputs, both 1 and 7, it is not a function. Relation 2 is a function. Since each input or x value has only one output or y value associated with it, it is a function. Relation 3 is NOT a function. For each value of x, there are 2 values of y that satisfy the equation. For example if x = 3, then 9 + y 2 = 25, y 2 = 16, and y = + 4, and y = 4. Since the x value 3 is associated with 2 different y values, this is not a function. Relation 4 is a function. This graph passes the vertical line test; that is, a vertical line drawn through the graph intersects it at only one point. This shows that each x value has one and only one corresponding y value. Relation 5 is NOT a function. Note that the x value 1 corresponds to y values of both 2 and 1. To be a function, each x value must have one and only one y value. 16
17 Question #15 (E200981) What values of x satisfy the inequality 2x + 3 > 11? A. x > 4 B. x < 4 C. x > 4 D. x < 4 Question #16 (E222130) A high school booster club plans to sell bags of popcorn at their basketball games. It cost the club $700 for a popcorn machine. It costs them an additional $0.25 to make each bag of popcorn the club sells. The club sells each bag of popcorn for $1.50. Write an equation that can be used to determine x, the number of bags of popcorn the booster club must sell so that the total sales equals the total costs. Solve your equation to determine the number of bags of popcorn the booster club must sell so that the total sales equals the total costs. Type your answer in the box below. This question must be answered online. CCSS.Math.Content.HSA-REI.B.3 > DOK 1 Solve linear equations and inequalities in one variable, including equations with coefficients represented by letters. A. This is the result of not reversing the inequality after dividing by a negative number. B. Correct: The answer is found in these steps: 2x + 3 > 11 2x > x > 8 2x 2 < 8 2 x < 4. C. This is the result of not reversing the inequality after dividing by a negative number and not making the sign negative on the right side of the inequality. D. This is the result of failing to make the sign negative on the right side of the inequality. CCSS.Math.Content.HSA-CED.A.1 > DOK 2 Create equations and inequalities in one variable and use them to solve problems. Rationale See Rubric. 2 Point Response: The response is correct and complete. A level 2 response is characterized by: A correct equation. A correct solution. Sample Correct Answer: The total sales in dollars is $1.50 times the number of bags sold. The total cost in dollars is $700 plus $0.25 times the number of bags sold. The equation is 1.5x = x or equivalent. 1.5x = x 1.25x = 700 x = 560 The booster club must sell 560 bags to break even. 1 Point Response: The response is partially correct. A level 1 response is characterized by: A correct equation with an incorrect or no solution. A correct solution based on an incorrect equation. 0 Point Response: The response is completely incorrect, there is no response, or the response is off topic. 17
18 Question #17 (E260183) What is the solution to the inequality below? CCSS.Math.Content.HSA-CED.A.1 > DOK 1 Create equations and inequalities in one variable and use them to solve problems. A. x > 9 2 B. x < 9 2 C. x > 9 D. x < 9 2x + 3 < 12 A. Correct: This correctly states the solution to the inequality: 2x + 3 < 12, then 2x < 9, so x > 9/2. B. This answer is the result of not switching the inequality when dividing by a negative number. C. This answer is the result of incorrectly dividing by 2 first to get x + 3 > 6, while remembering to switch the inequality sign. D. This answer is the result of incorrectly dividing by 2 first to get x + 3 < 6, and also neglecting to reverse the inequality sign. Question #18 (E260863) Max bought m 8-ounce jars of olives and n 12- ounce jars of olives. The total amount of olives was at least 80 ounces. Which inequality models this situation? A. 8m + 12n 80 B. 8m + 12n 80 C. 20(m + n) 80 D. 20(m + n) 80 CCSS.Math.Content.HSA-CED.A.3 > DOK 2 Represent constraints by equations or inequalities, and by systems of equations and/or inequalities, and interpret solutions as viable or non-viable options in a modeling context. A. Correct: The amount in ounces of olives in m 8-ounce jars is represented by the expression 8m, and the amount in ounces of olives in n 12-ounce jars is represented by the expression 12n. The total amount of olives is AT LEAST 80 ounces, which means 80 ounces or more, so the inequality sign needed is the greater-than-or-equal sign. The correct inequality is 8m + 12n 80. B. This inequality uses the less-than-or-equal sign instead of the greater-than-or-equal sign. C. This inequality adds and adds m + n before multiplying. D. This inequality adds and adds m + n before multiplying, and uses the less-than-or-equal sign instead of the greater-than-or-equal sign. 18

19 Question #19 (E258739) Which table represents a function? A. B. C. CCSS.Math.Content.HSF-IF.A.1 > DOK 1 Understand that a function from one set (called the domain) to another set (called the range) assigns to each element of the domain exactly one element of the range. If f is a function and x is an element of its domain, then f(x) denotes the output of f corresponding to the input x. The graph of f is the graph of the equation y = f(x). A. Correct: Each x-value in this table is assigned to exactly one y-value, so this table represents a function. B. This table assigns two different y-values to the x- value 0, and also two different y-values to the x- value 1, so it is not a function. C. This table assigns two different y-values to the x- value 2, so it is not a function. D. This table assigns four different y-values to the x- value 0, so it is not a function. D. Question #20 (E260114) A school ordered three different types of pizzas to sell at a fundraiser. There are x cheese pizzas, y pepperoni pizzas, and z vegetarian pizzas. The total cost in dollars of the pizzas is given by the expression below. 10x + 12y + 14z What do the coefficients in the expression represent? A. the cost in dollars of each type of pizza B. the number of each type of pizza ordered C. the total amount in dollars spent on each type of pizza D. the total number of pizzas purchased CCSS.Math.Content.HSA-SSE.A.1.a > DOK 2 Interpret parts of an expression, such as terms, factors, and coefficients. A. Correct: If the total cost in dollars is represented by the expression 10x + 12y + 14z, then the coefficient of each variable must represent the cost in dollars of the corresponding type of pizza. For example, the expression 10x represents the cost of x cheese pizzas because each cheese pizza costs 10 dollars. B. This answer describes the quantities that are represented by the variables x, y, and z. C. This answer describes the quantities that are represented by the terms 10x, 12y, and 14z. D. This answer describes the quantity that would be represented by the expression x + y + z. 19
20 Question #21 (E258692) The dollar value of a computer, based on the number of years since it was purchased, can be determined using the equation below. y = x In the equation, which of the following represents the initial cost of the computer? A B. 350 C. x D. y Question #22 (E172620) In DEF, m D = 48 and m E = 101. This triangle is rotated 75 counterclockwise about its center. What is m F? A. 31 B. 26 C. 44 D. 74 CCSS.Math.Content.HSA-SSE.A.1.a > DOK 2 Interpret parts of an expression, such as terms, factors, and coefficients. A. Correct: The computer was purchased for $2,000. B. This is the yearly decrease in the value of the computer. C. This represents the number of years since the computer was purchased. D. This is the current dollar value of the computer. CCSS.Math.Content.HSG-CO.B.7 > DOK 2 Use the definition of congruence in terms of rigid motions to show that two triangles are congruent if and only if corresponding pairs of sides and corresponding pairs of angles are congruent. A. Correct: Since rotation is a rigid motion, the angle measure does not change. The measure is = 31. B. This is the difference between the largest angle (101) and the angle of rotation. C. This is the difference between the angle of rotation (75) and the missing angle (31). D. This is the sum of the two given angles ( ) minus the angle of rotation. 20
21 Question #23 (E184113) In the Cartesian plane, ΔABC ΔA B C. CCSS.Math.Content.HSG-CO.B.6 > DOK 2 Use geometric descriptions of rigid motions to transform figures and to predict the effect of a given rigid motion on a given figure; given two figures, use the definition of congruence in terms of rigid motions to decide if they are congruent. A. Correct: This transformation maps triangle ABC onto triangle A'B'C'. B. This transformation would be another way to map the triangles only if the rotation were counterclockwise. C. These transformations are similar to one possible series of transformations, but they place the new triangle A'B'C' in the third quadrant, not the fourth. D. This series of transformations would be correct if the rotation were 90. Which transformations map ΔABC to ΔA B C? A. Reflect about the y-axis and then rotate 90 clockwise. B. Reflect about the x-axis and then rotate 90 clockwise. C. Reflect about the y-axis and then rotate 180 counterclockwise. D. Reflect about the x-axis and then rotate 180 counterclockwise. 21
22 Question #24 (E258336) The graph shows how the amount Amanda earns each day depends on the number of hours she works. CCSS.Math.Content.HSN-Q.A.1 > DOK 1 Use units as a way to understand problems and to guide the solution of multi-step problems; choose and interpret units consistently in formulas; choose and interpret the scale and the origin in graphs and data displays. A. Correct: The x-value of the point (0, 0) gives the number of hours worked, and the y-value gives the earnings in dollars. B. This is the result of interpreting the point (10, 160). C. This results from misinterpreting either the x- or y- value of the point (0, 0). D. This results from interpreting the meaning of the slope of the line instead of the meaning of the point (0, 0). What is the meaning of the point (0, 0) on the graph? A. If Amanda works 0 hours on a certain day, she earns $0. B. If Amanda works 10 hours on a certain day, she earns $160. C. Amanda earns $0 per hour. D. Amanda earns $16 per hour. 22
23 Question #25 (E196492) The balance in Ana's savings account may be modeled by the linear function y = 50x , where x represents the number of months that have passed and y represents the account balance. Based on this function, which of these is the BEST prediction of Ana's total savings after 3 years? A. $2,650 B. $3,700 C. $4,300 D. $7,650 CCSS.Math.Content.HSS-ID.B.6.a > DOK 2 Fit a function to the data; use functions fitted to data to solve problems in the context of the data. A. This is the result of substituting 3 for the number of months, x, rather than converting 3 years to 36 months. B. This is the result of incorrectly calculating 3 years as 24 months and then solving the equation. C. Correct: Evaluating the function for an x- value of 36 (3 years converted to months) gives 4,300. Thus, the best prediction for her cumulative savings after 3 years is $4,300. D. This is the result of summing 2500 and 50 and then multiplying by 3 (years) 23
24 Question #26 (E193471) Which line best models the data in the scatter plot? A. B. CCSS.Math.Content.HSS-ID.B.6.a > DOK 1 Fit a function to the data; use functions fitted to data to solve problems in the context of the data. A. Correct: This model passes through the middle of the general group of points and accurately models the trend of the data. B. This model passes through two of the data points and is the correct slope, but as most of the data points are above the line, it is too low to be a good model. C. This model shows a general positive trend as do the data points, but since the line is forced through the origin it does not model a correct slope or intercept. D. This model passes through three data points, but it does not model the data set as a whole. C. D. 24
25 Question #27 (E197553) The total amount spent by a local business on utility expenses for its factory may be modeled by the function E(x) = 380x Which best describes the slope in this function? A. the initial cost for setting up the utilities B. the average cost of the utilities each month C. the number of months for which the business has paid utility bills D. the maximum cost of the utilities Question #28 (E265087) The function H(d) = 0.2d represents the height of a lawn, in inches, d days after it was mowed. Using this model, fill in the boxes to correctly complete the statements below. Use the on-screen keyboard to type your response in each box. This question must be answered online. CCSS.Math.Content.HSS-ID.C.7 > DOK 2 Interpret the slope (rate of change) and the intercept (constant term) of a linear model in the context of the data. A. This amount is represented by the y-intercept of 50. B. Correct: The slope represents the rate of change or the rate of the utilities per month. This rate is $380. C. This variable, x, represents the number of months over which the cumulative expenses have been incurred. D. Since this is a linear function, there is not a maximum amount, and the total expenses are represented by the y-value, or output value, not the slope. CCSS.Math.Content.HSS-ID.C.7 > DOK 2 Interpret the slope (rate of change) and the intercept (constant term) of a linear model in the context of the data. Rationale This item is worth 1 point. The correct response is: The height of the lawn immediately after it is mowed is 1.5 inch(es). The lawn grows at a rate of 0.2 inch(es) per day. 25
26 Question #29 (E220468) The length in centimeters of a goldfish, L, can be determined using the equation below, based on m, the age, in months, of the fish. L = 0.8m + 3 Which graph represents the solutions to the equation? A. CCSS.Math.Content.HSA-REI.D.10 > DOK 1 Understand that the graph of an equation in two variables is the set of all its solutions plotted in the coordinate plane, often forming a curve (which could be a line). A. Correct: This answer is correct, since the line properly represents the slope and the intercept given in the equation, which is in slope-intercept form. B. This answer is the result of reversing the slope and the intercept. C. This answer is the result of thinking the slope is run over rise that a slope of 0.8 means that for every 0.8 units the line goes right, it goes up 1. D. This answer is the result of treating the intercept as an x-intercept instead of a y-intercept. B. 26
27 C. D. 27
28 Question #30 (E212737) The graph on the coordinate plane below shows that the number of bushels of corn that can be grown on an acre of land is a function of the number of seeds planted. CCSS.Math.Content.HSF-IF.B.4 > DOK 2 For a function that models a relationship between two quantities, interpret key features of graphs and tables in terms of the quantities, and sketch graphs showing key features given a verbal description of the relationship. A. Correct: This answer is not supported by the graph because the value of the function decreases after its maximum of 50. B. This answer is supported by the graph because it correctly identifies 50 as the maximum value of the function. C. This answer is supported by the graph because it correctly identifies 250,000 as generating the maximum value of the graph. D. This answer is supported by the graph because it correctly identifies the value of the function as being the same for 100,000 and 400,000. Which statement CANNOT be concluded from the graph? A. The greater the number of seeds planted, the more corn will be produced per acre. B. The maximum amount of corn produced will be 50 bushels per acre. C. The number of bushels of corn produced per acre is greatest if 250,000 seeds are planted per acre. D. Planting 100,000 seeds per acre will give the same result as planting 400,000 seeds per acre. 28
BUILT. for. Regents Pathways
 BUILT for NY 2016 2017 Algebra 1 Regents Pathway Think Through Math s Algebra 1 Regents pathway is designed to equip students with the skills and conceptual understandings of high school level mathematics
Algebra I 1. REAL NUMBER SYSTEM 2. EQUATIONS AND INEQUALITIES. Tutorial Outline
 Tutorial Outline Math Tutorials offer targeted instruction, practice and review designed to develop computational fluency, deepen conceptual understanding, and apply mathematical practices. They automatically
Algebra I Illinois 1. REAL NUMBER SYSTEM. Tutorial Outline
 Tutorial Outline Apex Learning Tutorials provide teachers with a solution to support all students in rising to the expectations established by Illinois Learning Standards (ILS). Tutorials offer direct
Algebra I Washington 1. REAL NUMBER SYSTEM 2. EQUATIONS AND INEQUALITIES. Tutorial Outline
 Tutorial Outline Washington Tutorials are designed specifically for the Washington State Learning Standards to prepare students for the Smarter Balanced Assessment Consortium (SBAC) exams and End-of-Course
ALGEBRA 1 - SJPS Curriculum
 ALGEBRA 1 - SJPS Curriculum Year at a Glance (2013-2014) Name of Unit Learning Goals Knowledge & Skills UNIT 1: Relationships Between Quantities and Reasoning with Equations (35 days?) UNIT 2: Linear and
Algebra II End of Course Exam Answer Key Segment I. Scientific Calculator Only
 Algebra II End of Course Exam Answer Key Segment I Scientific Calculator Only Question 1 Reporting Category: Modeling & Problem Solving Common Core Standard: A-REI.4a: Solve quadratic equations in one
Algebra I Remediation Guide
 Algebra I Remediation Guide Focused remediation helps target the skills students need to more quickly access and practice on-grade level content. This chart is a reference guide for teachers to help them
Algebra I. Algebra I Guide to Rigor
 Code A1: N-RN.B.3 A1: N-Q.A.1 Standard LSSM Algebra I Algebra I Explain why the sum or product of two rational numbers is rational; that the sum of a rational number and an irrational number is irrational;
HS Mathematics Item Specification C1 TL Task Model 1
 Task Model 1 Matching Table DOK Level 1 F-IF.B.4 models a relationship quantities, interpret key features of graphs and tables in terms of the quantities, and sketch graphs showing key features given a
Ohio s State Tests ITEM RELEASE SPRING 2018 INTEGRATED MATHEMATICS II
 Ohio s State Tests ITEM RELEASE SPRING 2018 INTEGRATED MATHEMATICS II Table of Contents Content Summary and Answer Key... iii Question 1: Question and Scoring Guidelines... 1 Question 1: Sample Responses...
Table of Contents [N-Q.A.1, A-SSE.A.1, A-CED.A.1, A-REI.B.3] Lesson 12 Creating Equations and Inequalities in Two Variables
![Table of Contents [N-Q.A.1, A-SSE.A.1, A-CED.A.1, A-REI.B.3] Lesson 12 Creating Equations and Inequalities in Two Variables](/thumbs/88/115993853.jpg "Table of Contents [N-Q.A.1, A-SSE.A.1, A-CED.A.1, A-REI.B.3] Lesson 12 Creating Equations and Inequalities in Two Variables") Table of Contents Introduction to New York State Finish Line Algebra I...5 MODULE 1 Relationships Between Quantities and Reasoning with Equations Lesson 1 Reasoning Quantitatively [N-Q.A.1, N-Q.A.2, N-Q.A.3,
Table of Contents Introduction to New York State Finish Line Algebra I...5 MODULE 1 Relationships Between Quantities and Reasoning with Equations Lesson 1 Reasoning Quantitatively [N-Q.A.1, N-Q.A.2, N-Q.A.3,
Algebra II Illinois 1. EXPRESSIONS, EQUATIONS, AND INEQUALITIES. Tutorial Outline
 Tutorial Outline Apex Learning Tutorials provide teachers with a solution to support all students in rising to the expectations established by Illinois Learning Standards (ILS). Tutorials offer direct
Algebra II Washington
 Tutorial Outline Washington Tutorials are designed specifically for the Washington State Learning Standards to prepare students for the Smarter Balanced Assessment Consortium (SBAC) exams and End-of-Course
Midterm Review Fall 2018
 Midterm Review Fall 018 Topics List: Unit 1 Simplifying Expressions Evaluating Linear Equations Dimensional Analysis Consecutive Number Equations Linear Equation Word Problems Representing Linear Equations
Item Specification Sheet Algebra I Semester Exam
 Item Specification Sheet Algebra I Semester Exam Free Response: 1. Illustrating Mathematical Properties 2. Equations with Infinitely Many Solutions or No Solution 3. Relations and Functions 4. Application
Guide Assessment Structure Algebra I
 Guide Assessment Structure Algebra I The Common Core State Standards for Mathematics are organized into Content Standards which define what students should understand and be able to do. Related standards
Math: Question 1 A. 4 B. 5 C. 6 D. 7
 Math: Question 1 Abigail can read 200 words in one minute. If she were to read at this rate for 30 minutes each day, how many days would Abigail take to read 30,000 words of a book? A. 4 B. 5 C. 6 D. 7
Correlation of Common Core Content Standards to CMP3 Content As Identified by PARCC. Number Standard for Mathematical Content CMP3 Unit: Investigation
 Correlation of Common Core Content Standards to CMP3 Content As Identified by PARCC 8.NS.A Know that there are numbers that are not rational, and approximate them by rational numbers. 8.NS.A.1 Understand
Algebra I Final Study Guide
 2011-2012 Algebra I Final Study Guide Short Answer Source: www.cityoforlando.net/public_works/stormwater/rain/rainfall.htm 1. For which one month period was the rate of change in rainfall amounts in Orlando
Unit Essential Questions. How can you represent quantities, patterns, and relationships? How are properties of real numbers related to algebra?
 Unit Essential Questions How can you represent quantities, patterns, and relationships? How are properties of real numbers related to algebra? Williams Math Lessons TARGET RATING 3 VARIABLES AND EXPRESSIONS
UNIT 2: REASONING WITH LINEAR EQUATIONS AND INEQUALITIES. Solving Equations and Inequalities in One Variable
 UNIT 2: REASONING WITH LINEAR EQUATIONS AND INEQUALITIES This unit investigates linear equations and inequalities. Students create linear equations and inequalities and use them to solve problems. They
CC Math I UNIT 7 Systems of Equations and Inequalities
 CC Math I UNIT 7 Systems of Equations and Inequalities Name Teacher Estimated Test Date MAIN CONCEPTS Page(s) Study Guide 1 2 Equations of Circles & Midpoint 3 5 Parallel and Perpendicular Lines 6 8 Systems
Integrated Mathematics 3 Washington
 Tutorial Outline Washington Tutorials are designed specifically for the Washington State Learning Standards to prepare students for the Smarter Balanced Assessment Consortium (SBAC) exams and End-of-Course
Grade 6 - SBA Claim 1 Example Stems
 Grade 6 - SBA Claim 1 Example Stems This document takes publicly available information about the Smarter Balanced Assessment (SBA) in Mathematics, namely the Claim 1 Item Specifications, and combines and
ALGEBRA MIDTERM REVIEW SHEET
 Name Date Part 1 (Multiple Choice): Please show ALL work! ALGEBRA MIDTERM REVIEW SHEET 1) The equations 5x 2y 48 and 3x 2y 32 represent the money collected from school concert ticket sales during two class
4. Based on the table below, what is the joint relative frequency of the people surveyed who do not have a job and have a savings account?
 Name: Period: Date: Algebra 1 Common Semester 1 Final Review 1. How many surveyed do not like PS4 and do not like X-Box? 2. What percent of people surveyed like the X-Box, but not the PS4? 3. What is the
HONORS ALGEBRA PACING GUIDE: 1 st Nine Weeks UNIT ONE: Quantities and Modeling Week Lesson Standards Learning Target. Other Materials/Projects
 HONORS ALGEBRA PACING GUIDE: 1 st Nine Weeks UNIT ONE: Quantities and Modeling ONE TWO THREE 1.1-1.3: Quantitative Reasoning 2.1-2.2: Algebraic Models Goals Expectations Pre-Assessment A-REI.A.1 : Explain
PRACTICE TEST ANSWER KEY & SCORING GUIDELINES INTEGRATED MATHEMATICS I
 Ohio s State Tests PRACTICE TEST ANSWER KEY & SCORING GUIDELINES INTEGRATED MATHEMATICS I Table of Contents Questions 1 29: Content Summary and Answer Key... iii Question 1: Question and Scoring Guidelines...
Module 1. Identify parts of an expression using vocabulary such as term, equation, inequality
 Common Core Standards Major Topic Key Skills Chapters Key Vocabulary Essential Questions Module 1 Pre- Requisites Skills: Students need to know how to add, subtract, multiply and divide. Students need
Math 3 Variable Manipulation Part 7 Absolute Value & Inequalities
 Math 3 Variable Manipulation Part 7 Absolute Value & Inequalities 1 MATH 1 REVIEW SOLVING AN ABSOLUTE VALUE EQUATION Absolute value is a measure of distance; how far a number is from zero. In practice,
4. Based on the table below, what is the joint relative frequency of the people surveyed who do not have a job and have a savings account?
 Name: Period: Date: Algebra 1 Common Semester 1 Final Review Like PS4 1. How many surveyed do not like PS4 and do not like X-Box? 2. What percent of people surveyed like the X-Box, but not the PS4? 3.
The steps in Raya s solution to 2.5 (6.25x + 0.5) = 11 are shown. Select the correct reason for line 4 of Raya s solution.
 = 11 are shown. Select the correct reason for line 4 of Raya s solution.") A.CED.1 Create equations and inequalities in one variable and use them to solve problems. Include equations arising from linear functions. Unit 2: Reasoning with Linear Equations and Inequalities The perimeter
A.CED.1 Create equations and inequalities in one variable and use them to solve problems. Include equations arising from linear functions. Unit 2: Reasoning with Linear Equations and Inequalities The perimeter
Define the word inequality
 Warm Up: Define the word inequality Agenda: Objective- Students can solve linear inequalities in one variable, including equations with coefficients represented by letters. Define Inequalities One & Two
1 Version 2.0. through and second pair. Related Grade 7 Standards
 Claim 1: Concepts and Procedures Students can explain and apply mathematical concepts and carry out mathematical procedures with precision and fluency. Content Domain: Expressions and Equations Target
ALGEBRA I Number and Quantity The Real Number System (N-RN)
") Number and Quantity The Real Number System (N-RN) Use properties of rational and irrational numbers Additional N-RN.3 Explain why the sum or product of two rational numbers is rational; that the sum of
Number and Quantity The Real Number System (N-RN) Use properties of rational and irrational numbers Additional N-RN.3 Explain why the sum or product of two rational numbers is rational; that the sum of
Algebra II. Note workbook. Chapter 2. Name
 Algebra II Note workbook Chapter 2 Name Algebra II: 2-1 Relations and Functions The table shows the average lifetime and maximum lifetime for some animals. This data can be written as. The ordered pairs
Name Date. and y = 5.
 Name Date Chapter Fair Game Review Evaluate the epression when = and =.... 0 +. 8( ) Evaluate the epression when a = 9 and b =.. ab. a ( b + ) 7. b b 7 8. 7b + ( ab ) 9. You go to the movies with five
Expressions and Equations 6.EE.9
 Expressions and Equations 6.EE.9 Teacher Notes Common Core State Standard Expressions and Equations 6.EE Represent and analyze quantitative relationships between dependent and independent variables. 9.
Grade 8 - SBA Claim 1 Example Stems
 Grade 8 - SBA Claim 1 Example Stems This document takes publicly available information about the Smarter Balanced Assessment (SBA) in Mathematics, namely the Claim 1 Item Specifications, and combines and
ALGEBRA 1 SEMESTER 1 INSTRUCTIONAL MATERIALS Courses: Algebra 1 S1 (#2201) and Foundations in Algebra 1 S1 (#7769)
 and Foundations in Algebra 1 S1 (#7769)") Multiple Choice: Identify the choice that best completes the statement or answers the question. 1. Ramal goes to the grocery store and buys pounds of apples and pounds of bananas. Apples cost dollars per
Multiple Choice: Identify the choice that best completes the statement or answers the question. 1. Ramal goes to the grocery store and buys pounds of apples and pounds of bananas. Apples cost dollars per
Section 8 Topic 1 Comparing Linear, Quadratic, and Exponential Functions Part 1
 Section 8: Summary of Functions Section 8 Topic 1 Comparing Linear, Quadratic, and Exponential Functions Part 1 Complete the table below to describe the characteristics of linear functions. Linear Functions
Example Item 1 (Grade 6): Primary Target 3A (Content Domain NF), Secondary Target 1F (CCSS 5.NF.4), Tertiary Target 3F
: Primary Target 3A (Content Domain NF), Secondary Target 1F (CCSS 5.NF.4), Tertiary Target 3F") Task Model 1 DOK Level 2 Target A: Test propositions or conjectures with specific examples Task Expectations: The student is asked to give an example that refutes a proposition or conjecture; or The student
Task Model 1 DOK Level 2 Target A: Test propositions or conjectures with specific examples Task Expectations: The student is asked to give an example that refutes a proposition or conjecture; or The student
Mississippi ALGEBRA I (Traditional) Pacing Guide
 Pacing Guide") Mississippi ALGEBRA I (Traditional) 2018-2019 Pacing Guide Note: The Mississippi College- and Career-Readiness Standards describe the varieties of expertise that mathematics educators should seek to develop
Mississippi ALGEBRA I (Traditional) 2018-2019 Pacing Guide Note: The Mississippi College- and Career-Readiness Standards describe the varieties of expertise that mathematics educators should seek to develop
Algebra I New Jersey 1. REAL NUMBER SYSTEM 2. EQUATIONS AND INEQUALITIES. Tutorial Outline
 Tutorial Outline New Jersey Tutorials are designed specifically for the New Jersey Core Curriculum Content Standards to prepare students for the PARCC assessments, the New Jersey Biology Competency Test
8 th Grade Algebra 1 (Honors) Subject
 Subject") Subject Nine Week Standard 8 th Grade Algebra 1 (Honors) First 9 Weeks Standards are not covered in their entirety during this 9 weeks. Standards will be repeated throughout the course. N-Q.A.1: Use units
Subject Nine Week Standard 8 th Grade Algebra 1 (Honors) First 9 Weeks Standards are not covered in their entirety during this 9 weeks. Standards will be repeated throughout the course. N-Q.A.1: Use units
Topic 1. Solving Equations and Inequalities 1. Solve the following equation
 Topic 1. Solving Equations and Inequalities 1. Solve the following equation Algebraically 2( x 3) = 12 Graphically 2( x 3) = 12 2. Solve the following equations algebraically a. 5w 15 2w = 2(w 5) b. 1
Common Core State Standards for Mathematics - High School
 to the Common Core State Standards for - High School I Table of Contents Number and Quantity... 1 Algebra... 1 Functions... 3 Geometry... 6 Statistics and Probability... 8 Copyright 2013 Pearson Education,
4. The table shows the number of toll booths driven through compared to the cost of using a Toll Tag.
 ALGEBRA 1 Fall 2016 Semester Exam Review Name 1. According to the data shown below, which would be the best prediction of the average cost of a -bedroom house in Georgetown in the year 2018? Year Average
I can Match each mathematical sentence on the right with its translation on the left. Define the variable(s). 1.
. 1.") Day 1 & 2-4.1.1 Systems of equations Defining Variables Name: I can. 4-1. Match each mathematical sentence on the right with its translation on the left. Define the variable(s). 1. 2z + 12 = 30 A. A zoo
Day 1 & 2-4.1.1 Systems of equations Defining Variables Name: I can. 4-1. Match each mathematical sentence on the right with its translation on the left. Define the variable(s). 1. 2z + 12 = 30 A. A zoo
Integrated Math, Semester A
 Teacher s Guide World History Before 1815 PLATO Course Teacher s Guide 2013 EDMENTUM, INC. Contents Course Components... 3, Overview... 5, Curriculum Contents and Pacing Guide... 6 2 Course Components
Algebra 1 Practice Test
 Part 1: Directions: For questions 1-20, circle the correct answer on your answer sheet. 1. Solve for x: 2(x+ 7) 3(2x-4) = -18 A. x = 5 B. x = 11 C. x = -11 D. x = -5 2. Which system of equations is represented
8 Mathematics Curriculum
 New York State Common Core 8 Mathematics Curriculum G R A D E GRADE 8 MODULE 4 Table of Contents 1... 3 Topic A: Writing and Solving (8.EE.C.7)... 11 Lesson 1: Writing Equations Using Symbols... 13 Lesson
Mathematics. Standards Plus. Grade COMMON CORE INTERVENTION SAMPLER
 Mathematics Standards Plus COMMON CORE INTERVENTION Grade 7 SAMPLER Standards Plus COMMON CORE INTERVENTION Available for Grades 1-8 Language Arts and Math Standards Plus COMMON CORE INTERVENTION Mathematics
EOC FSA Practice Test. Algebra 1. Calculator Portion
 EOC FSA Practice Test Algebra 1 Calculator Portion FSA Mathematics Reference Sheets Packet Algebra 1 EOC FSA Mathematics Reference Sheet Customary Conversions 1 foot = 12 inches 1 yard = 3 feet 1 mile
SOLVING LINEAR INEQUALITIES
 Topic 15: Solving linear inequalities 65 SOLVING LINEAR INEQUALITIES Lesson 15.1 Inequalities on the number line 15.1 OPENER Consider the inequality x > 7. 1. List five numbers that make the inequality
Algebra I Practice Exam
 Algebra I This practice assessment represents selected TEKS student expectations for each reporting category. These questions do not represent all the student expectations eligible for assessment. Copyright
Math Algebra I. PLD Standard Minimally Proficient Partially Proficient Proficient Highly Proficient. student
 PLD Standard Minimally Proficient Partially Proficient Proficient Highly Proficient The Minimally Proficient student The Partially Proficient student The Proficient student The Highly Proficient student
Answer Explanations SAT Practice Test #1
 Answer Explanations SAT Practice Test #1 2015 The College Board. College Board, SAT, and the acorn logo are registered trademarks of the College Board. 5KSA09 Section 4: Math Test Calculator QUESTION 1.
Sequence of Algebra 1 Units Aligned with the California Standards
 Sequence of Algebra 1 Units Aligned with the California Standards Year at a Glance Unit Big Ideas Math Algebra 1 Textbook Chapters Dates 1. Equations and Inequalities Ch. 1 Solving Linear Equations MS
INSIDE ALGEBRA CORRELATED WITH CALIFORNIA S COMMON CORE STANDARDS HIGH SCHOOL ALGEBRA
 We CA Can COMMON Early Learning CORE STANDARDS Curriculum PreK Grades 8 12 INSIDE ALGEBRA CORRELATED WITH CALIFORNIA S COMMON CORE STANDARDS HIGH SCHOOL ALGEBRA May 2011 www.voyagersopris.com/insidealgebra
Algebra I Notes Linear Inequalities in One Variable and Unit 3 Absolute Value Equations and Inequalities
 PREREQUISITE SKILLS: students must have a clear understanding of signed numbers and their operations students must understand meaning of operations and how they relate to one another students must be able
Archdiocese of Washington Catholic Schools Academic Standards Mathematics
 ALGEBRA 1 Standard 1 Operations with Real Numbers Students simplify and compare expressions. They use rational exponents, and simplify square roots. A1.1.1 A1.1.2 A1.1.3 A1.1.4 A1.1.5 Compare real number
DRAFT. New York State Testing Program Grade 8 Common Core Mathematics Test. Released Questions with Annotations
 DRAFT New York State Testing Program Grade 8 Common Core Mathematics Test Released Questions with Annotations August 03 08009_ Lucy graphed a system of linear equations. y 0 9 8 7 5 3-0 -9-8 -7 - -5 -
Students will develop an understanding of linear equations and inequalities (including systems of each) and apply related solution techniques.
 and apply related solution techniques.") Grade: Algebra I Enduring Skill 1: Students will develop an understanding of linear equations and inequalities (including systems of each) and apply related solution techniques. Demonstrators and Related
Grade: Algebra I Enduring Skill 1: Students will develop an understanding of linear equations and inequalities (including systems of each) and apply related solution techniques. Demonstrators and Related
Grade 8. Functions 8.F.1-3. Student Pages
 THE NEWARK PUBLIC SCHOOLS THE OFFICE OF MATHEMATICS Grade 8 Functions 8.F.1-3 Student Pages 2012 2012 COMMON CORE CORE STATE STATE STANDARDS ALIGNED ALIGNED MODULES Grade 8 - Lesson 1 Introductory Task
Throughout Algebra I, students should continue to develop proficiency with the Common Core's eight Standards for Mathematical Practice:
 In the three years prior to Algebra I, students have already begun their study of algebraic concepts. They have investigated variables and expressions, solved equations, constructed and analyzed tables,
Mathematics II 1. SIMPLIFYING EXPRESSIONS 2. EQUATIONS AND INEQUALITIES. Tutorial Outline
 Tutorial Outline Math Tutorials offer targeted instruction, practice and review designed to develop computational fluency, deepen conceptual understanding, and apply mathematical practices. They automatically
Grade 8 Mathematics MCA Item Sampler Teacher Guide
 Grade 8 Mathematics MCA Item Sampler Teacher Guide Overview of Item Samplers Item samplers are one type of student resource provided to help students and educators prepare for test administration. While
Algebra 1 Practice Test. Algebra 1. Practice Test. Copyright Karin Hutchinson, All rights reserved.
 Algebra 1 Practice Test Copyright Karin Hutchinson, 2011. All rights reserved. Please respect the time, effort, and careful planning spent to prepare these materials. The distribution of this e-book via
ALGEBRA 1 PACING GUIDE
 Unit 8 Graphing Quadratic Functions F-BF.3 F-IF.2 F-IF.4 F-IF.7a F-BF.1 Identify the effect on the graph of replacing f(x) by f(x) + k, k f(x), f(kx), and f(x + k) for specific values of k (both positive
NAME DATE PER. FALL FINAL EXAM REVIEW ALGEBRA 1 Solve = 6 3v = -3(c + 5)
") FINAL EXAM REVIEW, p. 1 NAME DATE PER. FALL FINAL EXAM REVIEW ALGEBRA 1 Solve. 1. 24 = 6 3v 2. 12 = -3(c + 5) 3. 5 2(x 3) = 63 4. 7x + 2(x - 5) = 4(x + 8) 5. r 1 10 3 2 6. x 1 2x 2 5 4 Write an equation,
FINAL EXAM REVIEW, p. 1 NAME DATE PER. FALL FINAL EXAM REVIEW ALGEBRA 1 Solve. 1. 24 = 6 3v 2. 12 = -3(c + 5) 3. 5 2(x 3) = 63 4. 7x + 2(x - 5) = 4(x + 8) 5. r 1 10 3 2 6. x 1 2x 2 5 4 Write an equation,
Inequalities Chapter Test
 Inequalities Chapter Test Part 1: For questions 1-9, circle the answer that best answers the question. 1. Which graph best represents the solution of 8 4x < 4 A. B. C. D. 2. Which of the following inequalities
Standards to Topics. Grade 6
 Standards to Topics Grade 6 6-RP.01 Understand the concept of a ratio and use ratio language to describe a ratio relationship between two quantities. For example, The ratio of wings to beaks in the bird
Using Graphs to Relate Two Quantities
 - Using Graphs to Relate Two Quantities For Eercises, choose the correct letter.. The graph shows our distance from the practice field as ou go home after practice. You received a ride from a friend back
Unit 5. Linear equations and inequalities OUTLINE. Topic 13: Solving linear equations. Topic 14: Problem solving with slope triangles
 Unit 5 Linear equations and inequalities In this unit, you will build your understanding of the connection between linear functions and linear equations and inequalities that can be used to represent and
Unit 2 Linear Functions and Systems of Linear Functions Algebra 1
 Number of Days: MS 44 10/16/17 12/22/17 HS 44 10/16/17 12/22/17 Unit Goals Stage 1 Unit Description: Unit 2 builds upon students prior knowledge of linear models. Students learn function notation and develop
Algebra 1 Midterm Review
 Name Block Algebra 1 Midterm Review MULTIPLE CHOICE Write the letter for the correct answer at the left of each question. 1. Solve: A. 8 C. 2. Solve: A. 43 C. 42 3. Solve the compound inequality and graph
ALGEBRA I. 2. Rewrite expressions involving radicals and rational exponents using the properties of exponents. (N-RN2)
") ALGEBRA I The Algebra I course builds on foundational mathematical content learned by students in Grades K-8 by expanding mathematics understanding to provide students with a strong mathematics education.
ALGEBRA I The Algebra I course builds on foundational mathematical content learned by students in Grades K-8 by expanding mathematics understanding to provide students with a strong mathematics education.
Curriculum Mapping 3/28/2013
 Curriculum Mapping Curriculum Map: 2012 2013 Mathematics State Standards Algebra 1 Q1 (8/14/2012-10/12/2012) Chapter 1: Expressions, Equations, and Functions N-Q - Quantities Reason quantitatively and
GSE Algebra 1. Unit Two Information. Curriculum Map: Reasoning with Linear Equations & Inequalities
 GSE Algebra 1 Unit Two Information EOCT Domain & Weight: Equations 30% Curriculum Map: Reasoning with Linear Equations & Inequalities Content Descriptors: Concept 1: Create equations that describe numbers
Relations and Functions
 Lesson 5.1 Objectives Identify the domain and range of a relation. Write a rule for a sequence of numbers. Determine if a relation is a function. Relations and Functions You can estimate the distance of
Math 8 Performance Test
 Name: Class: Date: Math 8 Performance Test Multiple Choice Identify the choice that best completes the statement or answers the question. 1) Which of the following is an irrational number? 300 a. 5 c.
UNIT 1 Equations and Their Graphs
 UNIT 1 Equations and Their Graphs ALGEBRA I Unit Length and Description: 8 weeks By the end of eighth grade students have learned to solve linear equations in one variable and have applied graphical and
CORE. Chapter 3: Interacting Linear Functions, Linear Systems. Algebra Assessments
 CORE Algebra Assessments Chapter 3: Interacting Linear Functions, Linear Systems 97 98 Bears Band Booster Club The Bears Band Booster Club has decided to sell calendars to the band members and their parents.
GRE Workshop Quantitative Reasoning. February 13 and 20, 2018
 GRE Workshop Quantitative Reasoning February 13 and 20, 2018 Overview Welcome and introduction Tonight: arithmetic and algebra 6-7:15 arithmetic 7:15 break 7:30-8:45 algebra Time permitting, we ll start
Blue Ribbon Math: Math I Jessica Amtower
 Objective: Math I Next Generation Standards Blue Ribbon Math: Math I Jessica Amtower M.1HS.RBQ.5 create equations and inequalities in one variable and use them to solve problems. Include equations arising
Common Core State Standards: Algebra 1
 Common Core State Standards: Number and Quantity Standards The Real Number System Extend the properties of exponents to rational exponents. N-RN.1 Explain how the definition of the meaning of rational
Archdiocese of New York Practice Items
 Archdiocese of New York Practice Items Mathematics Grade 6 Teacher Sample Packet Unit 1 NY MATH_TE_G6_U1.indd 1 NY MATH_TE_G6_U1.indd 2 1. For every 3 cats Alex had, his sister Alexis had 6 fish. What
Paper-Based: 8th Grade Comprehensive Mathematics Assessment
 Student Name: Teacher: Date: District: Miami-Dade County Public Schools Assessment: 08 Mathematics Mathematics Exam 3 Description: Paper-Based: 8th Grade Comprehensive Mathematics Assessment Form: 201
ALGEBRA I SEMESTER EXAMS PRACTICE MATERIALS SEMESTER Use the diagram below. 9.3 cm. A = (9.3 cm) (6.2 cm) = cm 2. 6.
 (6.2 cm) = cm 2. 6.") 1. Use the diagram below. 9.3 cm A = (9.3 cm) (6.2 cm) = 57.66 cm 2 6.2 cm A rectangle s sides are measured to be 6.2 cm and 9.3 cm. What is the rectangle s area rounded to the correct number of significant
1. Use the diagram below. 9.3 cm A = (9.3 cm) (6.2 cm) = 57.66 cm 2 6.2 cm A rectangle s sides are measured to be 6.2 cm and 9.3 cm. What is the rectangle s area rounded to the correct number of significant
East Greenwich Mathematics Summer Review Material for Students Entering Algebra I, Part II Directions:
 East Greenwich Mathematics Summer Review Material for Students Entering Algebra I, Part II 2016-2017 Directions: In order to earn full credit, show all work in the spaces provided. Do all work without
The following pages include the answer key for all machine-scored items, followed by the rubrics for the hand-scored items.
 Practice Test Answer and Alignment Document Mathematics Algebra 1 Online The following pages include the answer key for all machine-scored items, followed by the rubrics for the hand-scored items. The
CHAPTER 5-1. Regents Exam Questions - PH Algebra Chapter 5 Page a, P.I. 8.G.13 What is the slope of line shown in the
 Regents Exam Questions - PH Algebra Chapter Page 1 CHAPTER -1 SLOPE AND DIRECT VARIATION 4. 069918a, P.I. 8.G.1 What is the slope of line shown in the accompanying diagram? 1. 080417a, P.I. A.A. If the
Name: Class: Date: Describe a pattern in each sequence. What are the next two terms of each sequence?
 Class: Date: Unit 3 Practice Test Describe a pattern in each sequence. What are the next two terms of each sequence? 1. 24, 22, 20, 18,... Tell whether the sequence is arithmetic. If it is, what is the
ISTEP+: Algebra I End-of-Course Assessment Released Items and Scoring Notes
 ISTEP+: Algebra I End-of-Course Assessment Released Items and Scoring Notes Page 1 of 33 Introduction Indiana students enrolled in Algebra I participated in the ISTEP+: Algebra I Graduation Examination
ACT MATH TEST. Pre-Algebra and Elementary Algebra
 Pre-Algebra and Elementary Algebra Of the 60 questions, 14 will relate to pre-algebra and 10 to elementary algebra. The pre-algebra and elementary algebra questions will cover the following topics: Arithmetic
On Your Own. Applications. Unit 1. 1 p = 7.5n - 55, where n represents the number of car washes and p represents the profit in dollars.
 Applications 1 p = 7.5n - 55, where n represents the number of car washes and p represents the profit in dollars. 2 t = 0.5 + 2a, where a represents the area of the grass and t represents the time in hours
Indicate which numbers are prime: 0, 1, 2, 3, 4, 5, 6, 7, 8, 9, 10, Indicate which numbers are even: 0, 1, 2, 3, 4, 5, 6, 7, 8, 9, 10,
 Quick review: Indicate which numbers are prime: 0, 1, 2, 3, 4, 5, 6, 7, 8, 9, 10, Indicate which numbers are even: 0, 1, 2, 3, 4, 5, 6, 7, 8, 9, 10, List a set of consecutive odd integers: List a set of
Sequenced Units for Arizona s College and Career Ready Standards MA27 Algebra I
 Sequenced Units for Arizona s College and Career Ready Standards MA27 Algebra I Year at a Glance Semester 1 Semester 2 Unit 1: Solving Linear Equations (12 days) Unit 2: Solving Linear Inequalities (12
KEYSTONE ALGEBRA I REVIEW
 1. Which graph represents a linear function 4. The faces of a cube are numbered from 1 to 6. If the cube is tossed once, what is the probability that a prime number or a number divisible by 2 is obtained